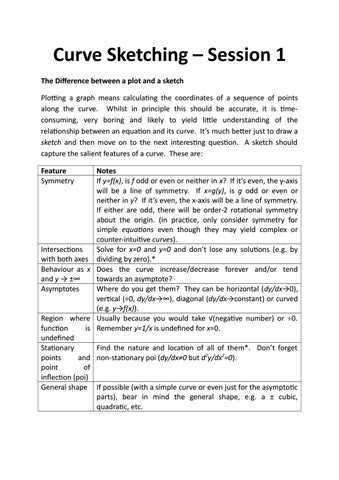
Curve Sketching – Session 1 The Difference between a plot and a sketch Plotting a graph means calculating the coordinates of a sequence of points along the curve. Whilst in principle this should be accurate, it is timeconsuming, very boring and likely to yield little understanding of the relationship between an equation and its curve. It’s much better just to draw a sketch and then move on to the next interesting question. A sketch should capture the salient features of a curve. These are: Feature Symmetry
Notes If y=f(x), is f odd or even or neither in x? If it’s even, the y-axis will be a line of symmetry. If x=g(y), is g odd or even or neither in y? If it’s even, the x-axis will be a line of symmetry. If either are odd, there will be order-2 rotational symmetry about the origin. (In practice, only consider symmetry for simple equations even though they may yield complex or counter-intuitive curves). Intersections Solve for x=0 and y=0 and don’t lose any solutions (e.g. by with both axes dividing by zero).* Behaviour as x Does the curve increase/decrease forever and/or tend and y → ±∞ towards an asymptote? Asymptotes Where do you get them? They can be horizontal (dy/dx→0), vertical (÷0, dy/dx→∞), diagonal (dy/dx→constant) or curved (e.g. y→f(x)). Region where Usually because you would take √(negative number) or ÷0. function is Remember y=1/x is undefined for x=0. undefined Stationary Find the nature and location of all of them*. Don’t forget points and non-stationary poi (dy/dx≠0 but d2y/dx2=0). point of inflection (poi) General shape If possible (with a simple curve or even just for the asymptotic parts), bear in mind the general shape, e.g. a ± cubic, quadratic, etc.