ARE THESE STREETS MADE FOR WALKING?
How Visual AI Can Inform Urban
Walkability for Older Adults
AUTHORS
Haozhuo Yang
Emily Chmielewski, EDAC
Hanna Negami, PhD
Alejandro Giraldo, Associate AIA, LEED AP BD+C
© Perkins Eastman 2025


AUTHORS
Haozhuo Yang
Emily Chmielewski, EDAC
Hanna Negami, PhD
Alejandro Giraldo, Associate AIA, LEED AP BD+C
© Perkins Eastman 2025


The global rise in older adult populations1 highlights the importance of designing urban environments that promote their well-being. Walking is a vital activity for older adults, offering physical exercise and opportunities for social interaction, which significantly impact their physical and mental health.2,3 The quality of these walking experiences depends on urban design elements like sidewalks, green spaces, lighting, crosswalks, benches, and signage, collectively influencing the “walkability” of an area.4
Understanding the role of these elements is crucial for urban designers and policymakers to develop strategies that enhance walkability and promote healthier lifestyles for older adults. This paper introduces a novel framework using Visual Artificial Intelligence (AI) to examine the relationship between urban design and walking experiences. By centering the human perspective, this approach provides actionable insights and guidelines for creating inclusive, walkable environments that improve accessibility and quality of life for older adults and diverse populations.


Regular walks are crucial to the physical and mental well-being of older adults.
Routine pedestrian activity significantly impacts the physical and mental well-being of older adults, mainly because it is accessible and offers natural opportunities for social engagement. This significance is particularly evident among older adults residing in urban neighborhoods characterized by limited access to natural environments.5,6 Researchers have devoted considerable academic attention to investigating the intricate relationship between the health status of older adults and their patterns of urban walking.7,8
Although the quality of pedestrian behavior is influenced by the layout, scale, and spatial qualities of the built environment,9 assessing these intricate relationships and linkages has remained a complex and difficult endeavor, primarily due to the challenges associated with the quantification and qualities of spatial features like benches, trees, sidewalks, etc. Much of the existing research has historically centered on qualitative comparative studies across diverse neighborhoods.10
Recent methodological developments, however, have placed new emphasis on some quantitative dimension of the built environment and pedestrian behavior.11 Geographical Information Systems (GIS) and statistical techniques have been deployed to facilitate the quantitative evaluation of the built environment. Nonetheless, the quantitative research paradigm has been constrained by the inherent limitations of GIS methodologies. Typically, GIS data originates from either remote sensing or spatial boundary-based summarization, both utilizing a top-down planning perspective. For example, metrics employed to represent the built environment have been circumscribed to large-scale data related to transportation systems, land use, and population.12,13 Consequently, the quantification process has inadvertently oversimplified the nuanced human experience of walking from a street-level, human-scaled perspective.
There is a compelling need for further investigations into the everyday elements that pedestrians, particularly the senior population, experience. It is imperative to establish a methodological framework that captures the nuanced connection of urban elements to pedestrian behavior, with due consideration to the human perspective.

Example of walkability index mapping in the Washington, DC, area based on GIS data: Access to Jobs and Workers Via Transit, courtesy of United States Environmental Protection Agency. 14
This study created a new framework for analyzing the urban environment from a human perspective, utilizing machine learning methods to understand and quantify various urban elements based on street-view images. Visual Artificial Intelligence (AI) methods like Object Detection and Image Segmentation can calculate the percentage of each urban element (e.g., trees, sidewalks, etc.) in one street-view image. Considering the abundant geographical coverage of the Google Street View Image Dataset, this methodology enabled us to understand and summarize the quantitative details of the built environment. Because of the small scale and detail of one unit of data (i.e., one Google Street View image), the quantification process was rooted in ground-truth summarization instead of oversimplification and abstraction.
This study differs from others in its use of ground-truth data of people’s travel behaviors to calculate walkability instead of commonly used simulative methods such as surveys based on participants’ subjectivity. We used a dataset derived from a government-led survey in Hong Kong, a major metropolitan area, where more than 100,000 residents completed detailed accounts of their mobility and transportation information. The survey and resulting dataset documents all the trips each individual took within a 24-hour time period, with emphasis on the details of those walk-only trips. From combining the demographic information and behavior data of these trips, a probability for older adults’ choice to walk was calculated to represent the willingness of walking as the index for walkability. The scale and level of detail of this survey dataset provided a more accurate and compelling reflection of walkability for older adults.
After the quantification of the urban elements and older adult’s walking behaviors, a statistical analysis was run on the correlations. Linear Regression and Geographically Weighted Regression were utilized to understand the impact of each urban element on walkability and how this impact varied spatially. The regression analyses identified whether certain urban elements or several combined together affected walkability, and whether positively or negatively. As a follow-up, a qualitative analysis of select street view images was also conducted to understand the details of these statistical effects. The research team then developed specific design guidelines that suggest how to control particular urban elements at both the plan and section levels to improve walkability for older adults.


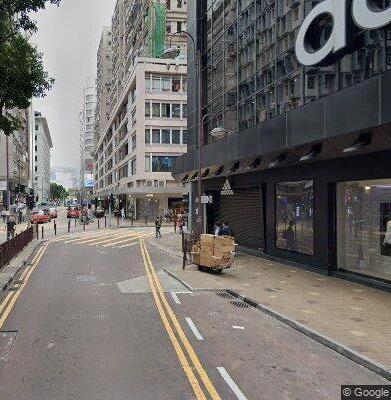

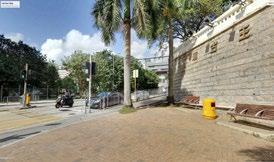
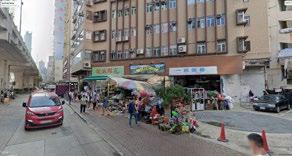
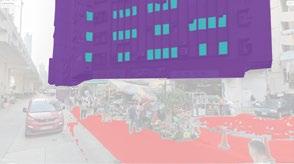
To better understand the walking experience from a human-scaled perspective, this study used street-level views in Hong Kong (above) as opposed to aerial views (top right).

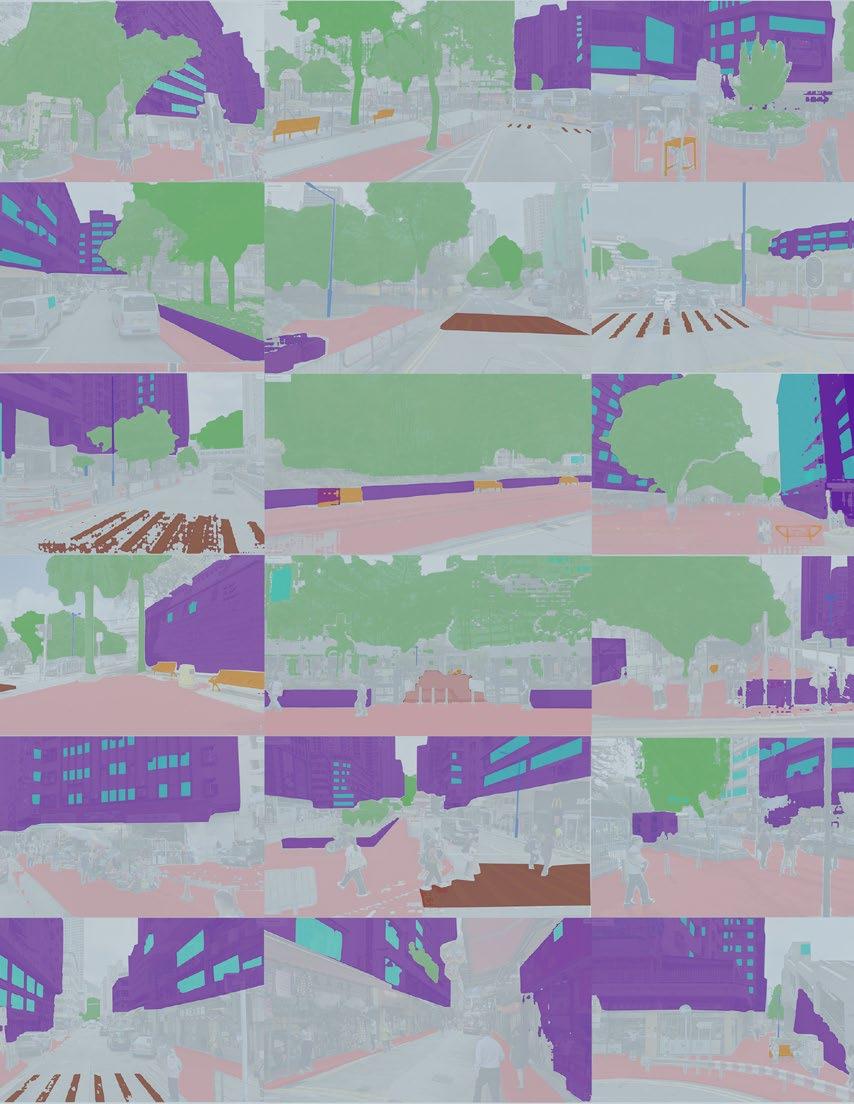
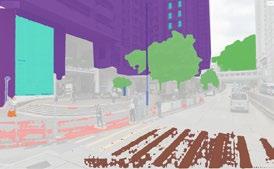
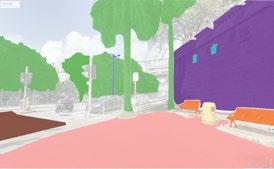
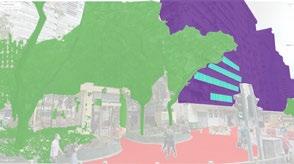
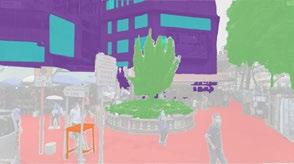
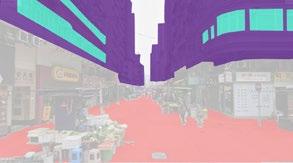
Visual Artificial Intelligence (AI) methods like Object Detection and Image Segmentation were used to understand how urban elements affect older adults’ walkability from a human perspective.
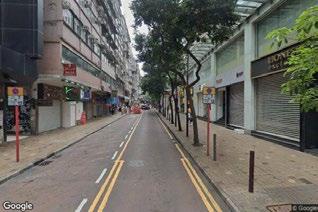

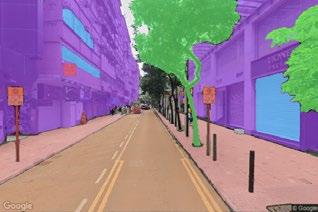
Visual AI Methodology: Street View Image –Object Detection – Image Segmentation

The mark of a great city is in how it treats its ordinary spaces, not its special ones.
~ Aaron M. Renn15
The data analyzed in the study included Google Street View Images in conjunction with the Travel Characteristics Survey (TCS) conducted by the Hong Kong Transport Department. This survey is regularly conducted approximately every decade, with notable instances in 1981, 1992, 2002, 2011, and 2021. The TCS serves as a vital tool for gathering current data on residents’ travel behaviors, contributing valuable insights to transportation planning and policy formation. With a sample size of more than 100,000 residents, this survey involves detailed questions about transportation trip information within a 24-hour period, including start/end points, means of transportation, transportation time, and travel purpose. This dataset offers comprehensive information on Hong Kong residents’ mobility details.
Since the most recent 2021 dataset had not yet been released by the Hong Kong Transportation Department for public use, this study used the 2011 TCS dataset as the primary source for older adults’ walking behaviors. The use of this dataset for this study was authorized by the Hong Kong Transportation Department. The 2011 TCS comprises three key sections, including the Household Interview Survey, which was the focal point of this research.


The TCS dataset encompasses a diverse range of travel information, presenting various measures to evaluate walkability. Walking behaviors are gauged through factors such as walking duration, location, and choice. Given the study’s specific focus on studying the health benefits of regular walks among older adults, the chosen approach for gauging walkability within a particular neighborhood involved using older adults’ choice of walking as their primary transportation mode.
Our interpretation of the age of “older adult” aligned with the Hong Kong government’s Elderly Commission definition, which defined older adults as individuals aged 65 and above. Within this framework, we found that the 2011 TCS dataset included approximately 13,000 older adults, constituting 12.8% of the surveyed population. Thus, we felt this dataset could offer substantial insights into the research domain.
Our study employed key metrics from the comprehensive TCS dataset to quantify walkability, including: Age, Address, Trip Origin, Trip Destination, Modes of Transport, and Trip Purpose. By considering these data categories and recognizing the voluntary nature of these trips, the research aimed to calculate the proportion of older adults opting for walking as their mode of transportation within a specific neighborhood, offering a representation of the neighborhood’s walkability.
Walkability =
Total Number of Older Adults

The urban area of study for this study was the Kowloon district in Hong Kong. Apart from being a multi-layered urban landscape blending residential, commercial, and cultural spaces, Kowloon also accommodates a significant portion of Hong Kong’s older adult population, making it an ideal microcosm for observing and analyzing the walking habits of this demographic group. The Kowloon district’s network of streets and mixed land uses offers a rich ground for understanding various walking patterns and preferences among older adults.
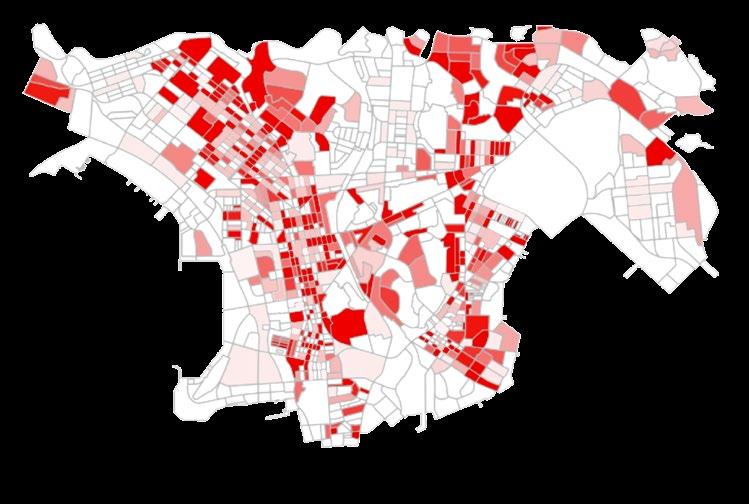
Utilizing the TCS dataset in conjunction with Hong Kong’s TPUSB (Tertiary Planning Units Street Blocks) geospatial information, an assessment of older adult walkability within Kowloon’s geographic regions was calculated. The data metric quantifies on a scale from 0 to 1, allowing for a detailed block-level mapping.
Spatial analysis of this data revealed certain patterns regarding the prevalence of older adults’ choice of walking. Notably, areas displaying a deeper shade of red in the diagram to the right, signified a higher percentage of older adults choosing to walk in that area. These areas tended to predominantly occupy smallersized blocks, notably seen in locales such as Mong Kok and Sham Shui Po to the west and Kau Pui Lung to the east. These areas, characterized by a historical urban fabric, typically encompass blocks measuring approximately 50 meters by 100 meters. Further, a noticeable concentration of higher walkability regions aligned along the east-west axis streets, forming a contiguous zone of higher walkability along the 50-meter dimension of these blocks. Contrary to expectations, areas surrounding significant public parks like Kowloon Tsai Park or Kowloon Park do not exhibit increased walkability, indicating the influence of additional factors shaping the walking choices of older adults.
An analysis of alternative transportation mode choices revealed a preference for other transportation methods in the darker blue regions shown in the diagram to the right. These regions are primarily located in the central and northern sections of Kowloon, where blocks are irregularly segmented by thoroughfares and highways.
Darker red indicates higher walking rates for older adults.
blue indicates higher reliance on public transit or cars for older adults.



To understand the precise quantitative attributes of urban elements experienced by older adults during walks, it was necessary to analyze a comprehensive image dataset that encompassed the streetscapes traversed by this population. Accordingly, the study integrated a supplementary resource: the Google Street View Image Dataset.
This repository provided an extensive collection of street-level images, globally representing urban environments. These panoramic images, made accessible via the Google Maps API, afforded the research with a detailed, quantitative comprehension of the physical cityscape encountered during routine pedestrian walks. This dataset facilitated an in-depth analysis and quantification of diverse urban features pertinent to the study.
The research retrieved a total of 32,512 images to scrutinize the urban elements within the Kowloon district. Employing a systematic approach, the study generated intervals of points at every 10-meter along the roads throughout Kowloon, acquiring corresponding street view images for each point. This method provides a comprehensive and detailed depiction of the streetscapes prevalent in the Kowloon region.

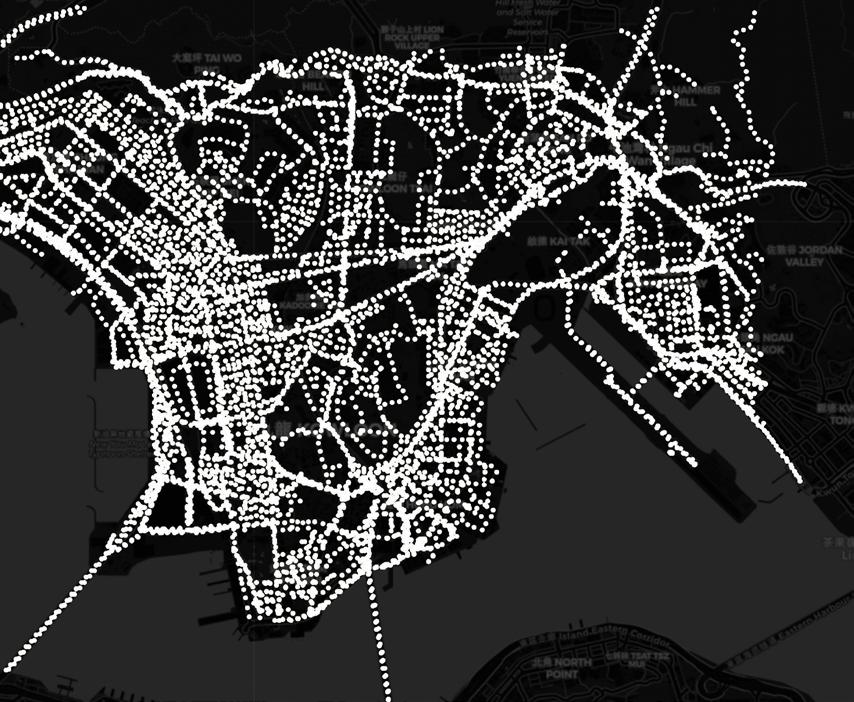
Data points of the street view images retrieved in the Kowloon district of Hong Kong
This study explores the impact of various urban streetscape elements on walkability, such as crosswalks, benches, walls, windows, trees and vegetation, sidewalks, and streetlights. The process of quantifying these urban elements was fundamentally rooted in an image-based methodology. Two advanced machine learning techniques were employed: Object Detection, which used algorithms to locate instances of an object in an image, and Image Segmentation that divided each image into multiple parts/regions belonging to the same category—in this case, the urban streetscape elements. For the study, the advanced machine learning techniques used an algorithm adept at discerning specific objects within an image and precisely determining their spatial extent and location. This pixel-centric approach facilitated the extraction of object-specific pixel counts, enabling the calculation of an element’s relative representation within the overall image.
The machine learning models at the core of this study’s methodology are Grounded DINO (Distillation with No Labels)16[15], specializing in object detection and zero-shot recognition to assign labels to identified objects, and the Segment Anything Model (SAM), dedicated to the segmentation of diverse elements within an image. By integrating Grounded DINO and SAM, the synergy enables the utilization of SAM for precise instance segmentation and accurate object labeling. This amalgamation of models culminates in the development of a robust instance segmentation model specifically tailored for the precise delineation and labeling of urban elements within images, enhancing the capacity for comprehensive analysis and understanding of the urban landscape’s constituent elements.


To conduct a correlation analysis, it is imperative to harmonize the geospatial base unit of both walkability data and urban elements. Given that the geospatial resolution of walkability analysis was defined at the level of Hong Kong Administrative TPUSB code, while Google Street View Images are latitude and longitude based, a process was employed to compute the mean pixel percentage value of each urban element within a TPUSB district as a quantitative metric.
Subsequent to this calculation, visualization maps were generated to illustrate the spatial variations of individual urban elements across the expanse of Kowloon. This approach, adopting a humanscale methodology that gauges the quantitative variability of urban elements, offers a complementary perspective to results obtained through Geographical Information System (GIS) analysis. The proportional representation of each urban element within its respective district provided an average portrayal of the visual experiences encountered.
The conclusions drawn from these maps revealed discernible spatial patterns relating to the distribution of urban elements. Locations with a high concentration of certain urban features tended to follow one of three patterns: They were lined up along a road or path, clustered around a central area, or spread out randomly across the city. These spatial patterns will be exhaustively delineated and crossanalyzed in the subsequent chapter, particularly in relation to the walkability data, elucidating the interplay between urban element spatial distribution and pedestrian accessibility.

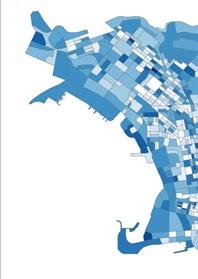

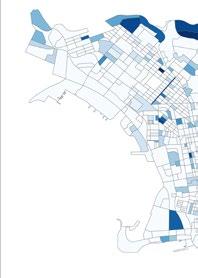
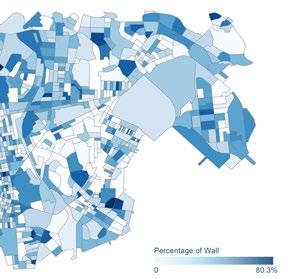


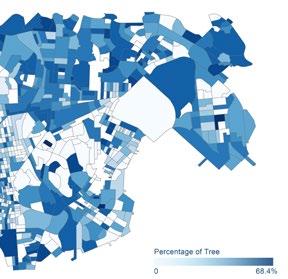

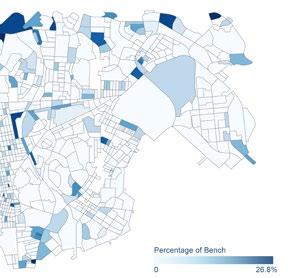


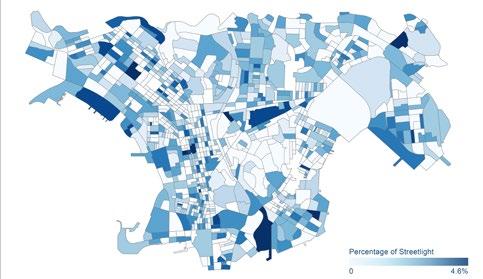

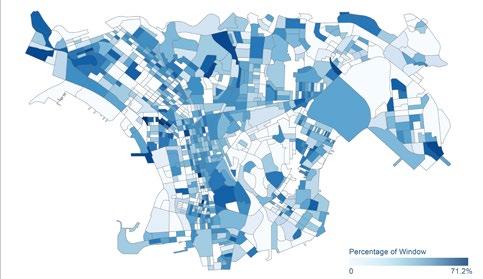

Spatial mapping of average urban element pixels in the Kowloon district. Top row: Wall, Crosswalk, Second row: Sidewalk, Streetlight, Third row: Tree, Window, Bottom: Bench
After quantifying both walkability among older adults and urban elements separately, we then examined their spatial correlations to understand the relationship between these two variables. This necessitated the employment of diverse methodologies such as 3D visualization, Regression Analysis, and Google Street View Sampling, encompassing both quantitative and qualitative approaches.
To understand the spatial correlation, this study utilized visualization techniques to juxtapose the quantitative attributes of walkability and urban elements. This enabled a comparative analysis that identified areas exhibiting strong positive correlations (i.e., high walkability = high urban element, or low walkability = low urban element) or strong inverse correlations (i.e., low walkability = high urban element, or high walkability = low urban element).
Further, the sampling of Google Street View images from these areas in Kowloon allowed for a qualitative investigation into the details of the urban environment. This qualitative exploration served to complement and expound upon the findings derived from the quantitative regression analyses. Insights gained from the detailed examination of the urban environment through Google Street View images embraced a philosophy of learning from existing elements. These insights contributed to the enhancement of the study’s design guidelines, which aim to help designers and planners improve walkability for older adults.


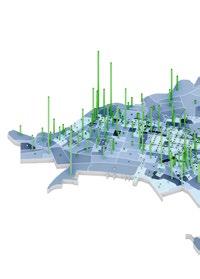

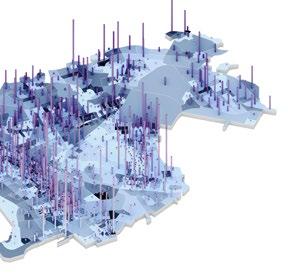

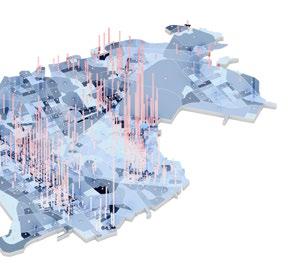
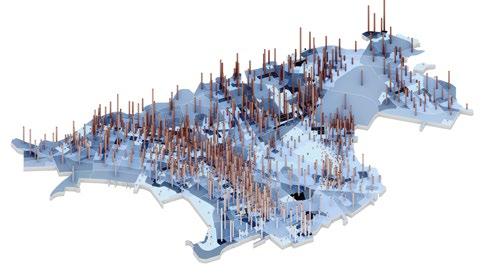


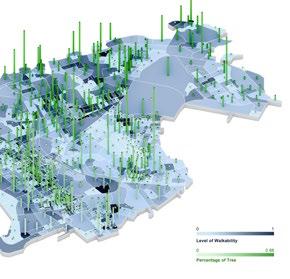
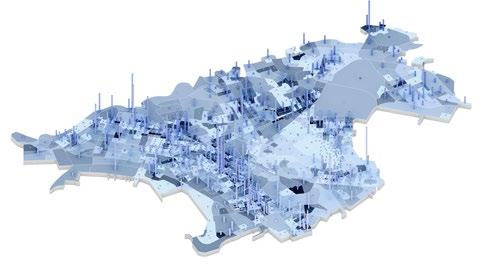


Juxtaposition of the quantitative attributes of walkability and urban elements. Top row: Wall, Crosswalk, Second row: Sidewalk, Streetlight, Third row: Tree, Window, Bottom: Bench

The study applied statistical methods to analyze the correlation between the quantified data of the walkability of older adults and urban elements. Given the intricacies inherent in their associations at a practical level, a comprehensive array of regression models was deployed to investigate both the individual impact of these factors and their combined influence.
The statistical methodology used for this study followed a structured progression, starting with the analysis of individual factors and advancing to a more comprehensive multivariate analysis. This sequential approach involved the utilization of single linear regression, multiple linear regression, and geographically weighted regression analyses. These models served to systematically uncover the nuanced relationships between walkability and single or multiple urban elements, both in numerical terms and also with respect to their spatial dynamics.
Initially, a singular linear regression model was employed to examine the individual impact of each urban element on the walkability of older adults. This analysis was used to answer the following questions: “How much does one urban element affect walkability?” and “Is this influence positive or negative?”
The findings from the single regression analyses demonstrated relatively comparable levels of influence among the various urban elements. Both the urban elements of ‘Bench’ and ‘Tree’ exhibited notably higher scores, which indicated a more substantial contribution to enhancing walkability. However, across all the individual linear regression models, the coefficient of determination (R-squared) values was relatively low. This suggested that, when assessed in isolation, no single urban element can explain very well the variability in walkability of older adults.


Seven separate single linear regressions were run to find the relationships between each of the urban elements and walkability. Predictor: Each of the urban elements; Response: Walkability


Results from the single linear regressions, shown by the dark grey lines, show varying degrees of influence individual urban elements have on walkability. When assessed in isolation, no single urban element can adequately explain the variability in the walkability of older adults.
The decision for older adults to walk is complex and influenced by several factors at once. Consequently, a multiple linear regression model was applied to explore the combined effects of paired urban elements on older adults’ walkability. This multivariate analysis sought to shed light on the extent to which urban elements jointly influence walkability and whether they complement or counteract each other in enhancing pedestrian accessibility.
Generally, the coefficients of determination (R-squared) in the multiple linear regression models showed increases compared to the singular regression models. This suggested that when considered collectively, pairs of urban elements better reflect the variance in older adults’ walkability. The outcomes of these regression analyses revealed that specific pairs of urban elements exert a relatively stronger combined influence. For instance, ‘Bench’ and ‘Sidewalk’ emerge as the most influential combination, signifying that areas furnished with more benches and sidewalks tend to have higher walkability. This model not only provided insights into how urban elements work together to impact walkability but also offered valuable information for qualitative analysis and design guidelines by highlighting specific combinations that can enhance the pedestrian experience.
The regression models used in this study primarily addressed the statistical associations between urban elements and walkability in a quantitative manner. They ascertained whether specific urban elements influence walkability, but did not delve into how this influence varied spatially. Given that all data concerning urban elements and walkability are geographically referenced, the application of a Geographically Weighted Regression (GWR) model became essential to comprehend the spatially varying nature of this influence.


Twenty-one multiple linear regressions were run to examine the relationship between walkability and each unique pair of urban elements. Predictor: One pair of urban elements; Response: Walkability.


Results from the multiple linear regressions, shown by the dark grey lines, show that specific pairs of urban elements exert a relatively stronger combined influence on walkability.
Unlike traditional regression models that use a single equation to analyze the relationship between the response variable and independent variables, the GWR model utilizes a series of equations. This approach allows for a deeper exploration of the spatial differences between these relationships. This model involves multiple localized regressions based on individual and neighboring points, thereby enabling the estimation of parameters that vary across them. For instance, when employing GWR to analyze the relationship between the percentage of window coverage and walkability, a geographical distribution of R-squared values was mapped back to the corresponding TPUSB districts. The resulting map (on the left) illustrates lower R-squared values in the southern and northwestern areas, indicating a weaker regression model, while stronger models are observed in the northeastern region of Kowloon.
Through GWR, the analysis not only facilitated an understanding of the relationship but also revealed the spatial patterns inherent in these relationships. Such insights provided valuable cues for qualitative analysis, aiding in the identification of built environment examples conducive to enhancing walkability among older adults.
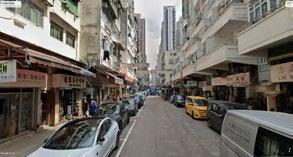
The regression analyses conducted for this study illuminated the statistically significant relationship between diverse urban elements and the walkability of older adults. They offered insights into the specific combinations of urban elements that predict walkability and how this influence varies across different spatial contexts. Nevertheless, since the statistical data in the analyses was derived from pixel values within images, we reconnected these findings to street view images. This process aimed to provide a more nuanced understanding of how these positive or negative influences manifest in the real-world physical street environment.
We were able to derive design guidelines from the cumulative insights gathered from these street-level observations by methodically categorizing and abstracting the spatial compositions, as shown in the next section.


GWR R-Squared Values
-0.03–0.02
0.02–0.06
0.06–0.09
0.09–0.11
0.11–0.12
0.12–0.14
0.14–0.16
This map illustrates a result from the Geographically Weighted Regressions, here examining the relationship between the proportion of windows in an urban streetscape and walkability. The map displays the spatial variation in this relationship, with darker green areas indicating weak associations and darker purple areas showing stronger relationships.

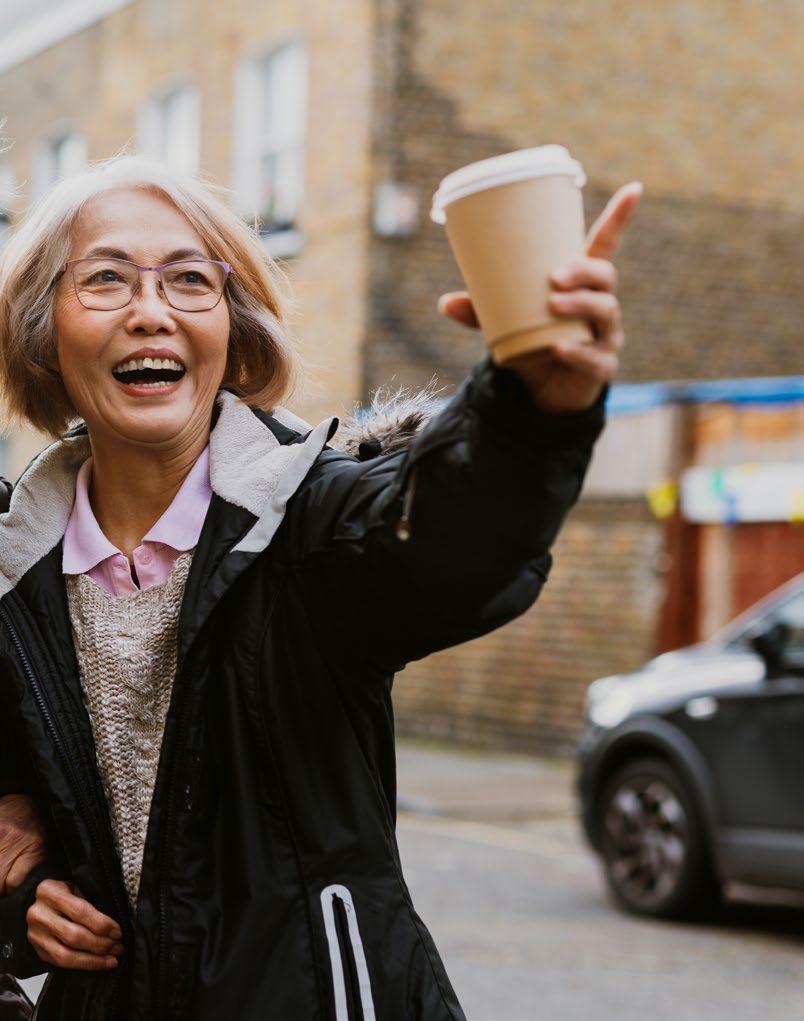


Objective: Inviting Street Space is a concept that emphasizes not just mobility but also the quality of time spent on our streets. It's about transforming ordinary sidewalks into inviting and vibrant areas where people are not just passing through but are enticed to linger, relax, and connect with their surroundings. By combining well-placed street furniture, such as benches and seating areas, with lush greenery and open spaces, our design guideline aims to increase the walkability for older adults.
Description: This study shows that when there are more trees and benches together, there is also a significant enhancement in walkability. Adding more trees and benches creates an “Inviting Street Space” that merges functional street furniture with the tranquility of greenery and open spaces.
Description: Our research model shows when trees and benches increase altogether, a significant enhancement in walkability and the creation of 'Inviting Street Space' is achieved. This approach ingeniously merges the functionality of street furniture with the tranquility of greenery and open spaces, resulting in a design guideline that reimagines urban environments.
Objective: The Inviting Street Space concept enhances not just mobility but also the quality of time spent on streets. By integrating strategically placed street furniture with greenery, it transforms ordinary sidewalks into vibrant areas where people are encouraged to linger and connect.
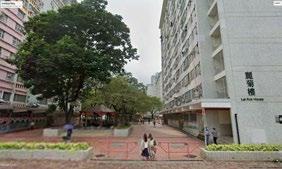

Urban Element: Tree
Urban Element: Tree
Urban Element: Tree
Urban Element: Tree

Urban Element: Tree
Urban Element: Tree
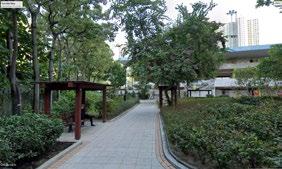

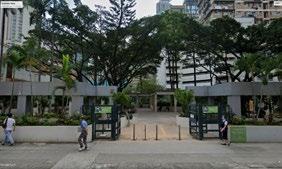


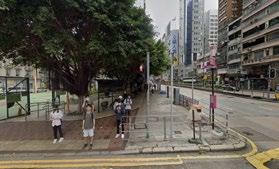
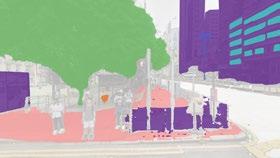
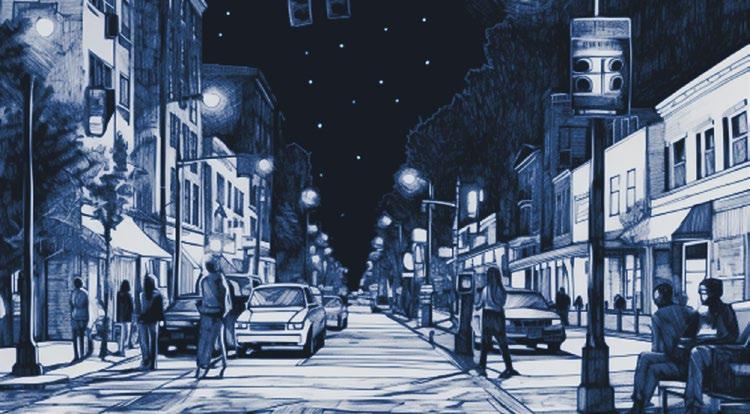


Description:
'A Connected Journey' addresses the pivotal notion that the quality of urban walk is elevated when people can traverse the cityscape with ease and comfort. By seamlessly linking stayable spaces, created through the strategic placement of benches and presence of trees, with a network of crosswalks and guided by the guidance and illumination of streetlights, older adults can develop a daily walk routine more easily.
Description: This study shows that crosswalks and streetlamps paired together are associated with enhanced walkability. “A Connected Journey” suggests that well-illuminated, pedestrian-friendly crosswalks encourage older adults to traverse the city comfortably and develop a regular walking routine.
Objective:


Central to our guideline is the commitment to expanding reachability within the urban environment. Each stayable space becomes an oasis of rest and contemplation, inviting individuals to pause and connect, yet it is equally vital that these spaces are themselves interconnected. Crosswalks thoughtfully designed to traverse streets guide pedestrians to adjacent stayable spaces with ease.
Objective: This guideline emphasizes expanding access within the urban environment. While the previous guideline, “Intervals of Pedestrian Respite,” offers restful spaces, thoughtfully designed crosswalks connect these areas, fostering community-building and encouraging shared experiences that enrich the city’s cultural fabric.
The interconnected stayable spaces foster community building. Individuals are not just solitary travelers but cohabitants in a vibrant urban ecosystem. Conversations, gatherings, and shared experiences enrich the

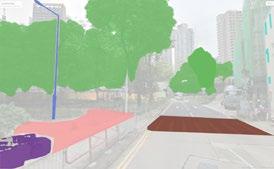


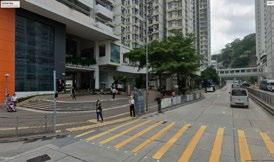


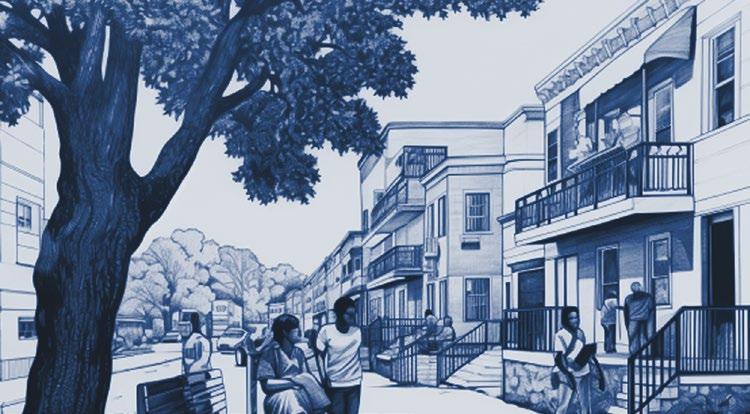


Description: 'A Conversational Routine' is dedicated to redefining the daily act of walking, turning it into a social and community-building experience that is particularly beneficial for older adults. By strategically designing facades openings and introducing stayable benches, we aim to create environments where every stroll becomes an opportunity for enriching social interactions and enhancing mental well-being.
Description: This study showed that more walkable areas had more façade openings (e.g., windows, patios, balconies) paired with both benches and trees. “A Conversational Routine” aims to redefine the daily act of walking into a social and communitybuilding experience with spaces of respite, especially benefiting older adults by enhancing social interactions and mental well-being.
Objective: These openings allow individuals to engage with the daily activities and rhythms of urban life, offering glimpses into the daily routines of neighbors, passersby, and local businesses. These visual connections promote a sense of familiarity and belonging. By making the walking routine more engaging and social, older adults are more likely to remain active. Physical activity is essential for maintaining physical and mental health as one ages, and 'A Conversational Routine' facilitates this by making walking an enjoyable and sociable endeavor.
Objective: Thoughtful façade openings allow people to connect with the daily activities and rhythms of their community, fostering a sense of familiarity and belonging. Making walking more engaging and social encourages older adults to stay active, which is crucial for their physical and mental health. “A Conversational Routine” helps make walking an enjoyable and sociable activity.


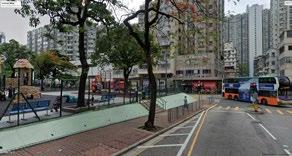

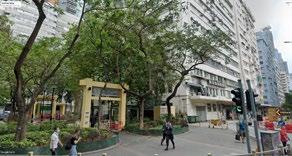



Description:


Description: This study showed that walkability was associated with benches paired with both windows and façade walls. “Façade Intimacy” aims to create urban streets that foster connection, using strategic dimensions and urban furniture to engage pedestrians with their surroundings.
'Facade Intimacy,' is dedicated to shaping urban streets as spaces that evoke a sense of intimacy and connection between pedestrians and the surrounding built environment. By meticulously crafting the dimensions of streets, implementing strategic height-width ratios, increasing facade window openings, and incorporating urban furniture, we aim to curate an urban landscape that engages and resonates with the people walking its paths.


Objective: he proportions and scale of buildings play a crucial role in establishing a sense of intimacy. By balancing the height-width ratio, we create streets that feel inviting rather than overwhelming. The careful adjustment of these dimensions results in a street setting that feels comfortably enclosed and human-scaled, promoting a sense of coziness.
The design focuses on putting people at the center. Whether for leisurely strolls, brief pauses, or longer moments of relaxation, the urban street becomes a canvas for pedestrian engagement. The combination of comfortable dimensions, window views, and well-placed furniture amplifies the experience of the space.
Objective: The proportions and scale of buildings are vital for creating intimacy. Balancing height-towidth ratios makes streets feel inviting and humanscaled, promoting coziness. This design centers on people, enhancing walkability through comfortable dimensions, window views, and strategically placed furniture for pedestrian engagement.




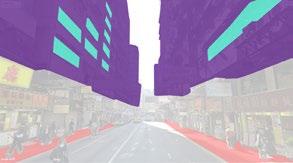
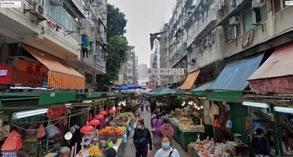
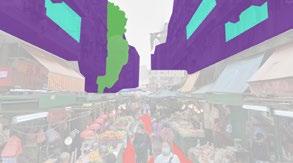
Human-centric design principles are important for integrating and supporting human behaviors during the urban design process. At an urban scale, the everyday experiences of individuals are often overlooked. Urban designers require a methodology that bridges people’s daily experiences and choices, translating these insights into practical spatial design. This study offers an example of this bridge by integrating human behavior data with spatial images. Specifically, it established a connection between the choice of walking by older adults in their daily routines and the specific urban elements and spatial compositions within street environments. This linkage provides a set of design guidelines that may be used by planners and designers. Given that the walking trips undertaken by older adults are predominantly recreational, the design guidelines developed are rooted in understanding the inherent spontaneity and quality of these walks with the aim to improve the urban environment for this demographic group.
Another important implication of this research for real-world application pertains to the utilization of machine learning methodologies. This study leverages two primary datasets: the Hong Kong Travel Characteristics Survey and Google Street View Images. The application of a machine learning model demonstrates a relationship between the prevalence of walking and specific urban elements along those walking paths. Specifically, the development of an image classification model can be undertaken. In this study’s model, street view images served as the input data while the label feature represented the urban elements. This classification model revealed the relationships between walkability and street view images, drawing from the walking behavior data collected in Hong Kong.
Subsequently, the trained model could be employed to forecast the walkability of older adults in other cities by utilizing an alternate set of Google Street View Images specific to the new city being investigated. While walking behaviors are profoundly influenced by cultural, geographical, and demographic factors, the predictive outcomes generated by the model established in this study using Hong Kong data could provide comparative insights when applied to other datasets. This model may also serve as an initial framework for understanding areas where collecting walking data is challenging.


1 https://www.who.int/news-room/fact-sheets/detail/ageing-and-health
2 Cunningham, Conor, and Roger O’Sullivan. 2021. “Healthcare Professionals’ Application and Integration of Physical Activity in Routine Practice with Older Adults: A Qualitative Study.” International Journal of Environmental Research and Public Health 18 (21): 11222. https://doi. org/10.3390/ijerph182111222
3 Yu, Ruby, Osbert Cheung, Kevin Lau, and Jean Woo. 2017. “Associations Between Perceived Neighborhood Walkability and Walking Time, Wellbeing, and Loneliness in Community-Dwelling Older Chinese People in Hong Kong.” International Journal of Environmental Research and Public Health 14 (10): 1199.
4 Forsyth, Ann. 2015. “What Is a Walkable Place? The Walkability Debate in Urban Design.” Urban Design International 20 (4): 274–292. https://dash.harvard.edu/handle/1/29663388
5 Neale, C., J. Hoffman, D. Jefferson, J. Gohlke, M. Boukhechba, A. Mondschein, S. Wang, and J. Roe. 2022. “The Impact of Urban Walking on Psychophysiological Wellbeing.” Cities & Health 6 (6): 1053–66.
6 Lee, Ji Hei, and Teck Hong Tan. 2023. “Neighborhood Walkability or Third Places? Determinants of Social Support and Loneliness Among Older Adults.” Journal of Planning Education and Research 43 (2): 240–53. https://doi.org/10.1177/0739456X19870295.
7 Chen, Bo, Ming-Chun Hsueh, Ru Rutherford, Jong-Hwan Park, and Yung Liao. 2019. “The Associations Between Neighborhood Walkability Attributes and Objectively Measured Physical Activity in Older Adults.” PloS One 14 (9): e0222268–e0222268.
8 Neale, C., J. Hoffman, D. Jefferson, J. Gohlke, M. Boukhechba, A. Mondschein, S. Wang, and J. Roe. 2022. “The Impact of Urban Walking on Psychophysiological Wellbeing.” Cities & Health 6 (6): 1053–66.
9 Grant, Theresa L., Nancy Edwards, Heidi Sveistrup, Caroline Andrew, and Mary Egan. 2010. “Inequitable Walking Conditions Among Older People: Examining the Interrelationship of Neighbourhood Socio-Economic Status and Urban Form Using a Comparative Case Study.” BMC Public Health 10 (1): 677–677.
10 Poklewski-Koziełł, Damian, Karolina Dudzic-Gyurkovich, and Carlos Marmolejo Duarte. 2023. “Investigating Urban Form, and Walkability Measures in the New Developments. The Case Study of Garnizon in Gdansk.” Land Use Policy 125: 106471.
11 Holle, Veerle Van, Jelle Van Cauwenberg, Delfien Van Dyck, Benedicte Deforche, Nico Van de Weghe, and Ilse De Bourdeaudhuij. 2014. “Relationship Between Neighborhood Walkability and Older Adults’ Physical Activity: Results from the Belgian Environmental Physical Activity Study in Seniors (BEPAS Seniors).” The International Journal of Behavioral Nutrition and Physical Activity 11 (1): 110–110.
12 Weiss, Rachael L., Juliana A. Maantay, and Marianne Fahs. 2010. “Promoting Active Urban Aging: A Measurement Approach to Neighborhood Walkability for Older Adults.” Cities and the Environment 3 (1): 1–17.
13 McCormack, Gavin R. 2017. “Neighbourhood Built Environment Characteristics Associated with Different Types of Physical Activity in Canadian Adults.” Health Promotion and Chronic Disease Prevention in Canada 37 (6): 175–85.
14 https://www.epa.gov/smartgrowth/smart-location-mapping
15 https://www.urbanophile.com/2010/08/01/the-mark-of-a-great-city-is-in-how-it-treats-its-ordinaryspaces-not-its-special-ones/#:~:text=The%20Mark%20of%20a%20Great,Renn
16 Grounded-SAM Contributors. (2023). Grounded-Segment-Anything [Computer software]. https:// github.com/IDEA-Research/Grounded-Segment-Anything
Thank you to the Hong Kong Transport Department for granting permission to use the 2011 Travel Characteristics Survey data for this study, and the ability to publish the study’s aggregated findings.
Cover © Joose Laine/Wirestock Creators / Adobe Stock
Contents © N Felix/peopleimages.com / Adobe Stock
Page 3 © Oleg / Adobe Stock
Page 8-9 © Alvaro / Adobe Stock
Page 10-11 © Cristi / Adobe Stock
Page 12-13 © James Jiao / Adobe Stock
Page 30-31 © Rawpixel.com / Adobe Stock
Page 40-41 © M Einero/peopleimages.com / Adobe Stock
All other images by Haozhuo Yang / Google Street View Images in conjunction with the Travel Characteristics Survey (TCS) conducted by the Hong Kong Transport Department


Haozhuo Yang
haozhuoyang@gsd.harvard.edu (617) 800 3996
Alejandro Giraldo, Associate AIA, LEED AP BD+C (202) 971 4995
a.giraldo@perkinseastman.com
Hanna Negami, PhD (212) 353 7201
h.negami@perkinseastman.com
Emily Chmielewski, EDAC (412) 894 8366
e.chmielewski@perkinseastman.com