DOWNTOWNDC CONTINUED AS ONE OF THE LARGEST ECONOMIC HUBS IN THE WASHINGTON REGION, WITH ITS ECONOMIC ACTIVITY REBOUNDING IN 2022 AND THE FIRST MONTHS OF 2023.
AS OF SPRING 2O23, THE ECONOMIC ACTIVITY IN DOWNTOWNDC AS A PERCENTAGE OF PRE-PANDEMIC LEVELS WAS VARIED: •
OVERALL ECONOMIC ACTIVITY 65%
DEVELOPMENT STARTS (6/22–5/23) 20% • OFFICE WORKERS IN OFFICE 41% • METRORAIL RIDERSHIP — WEEKDAYS 45% • PEOPLE IN DOWNTOWN 58% • OFFICE FOOD & BEVERAGE 67% • SHOPPING — EVERYDAY GOODS 67% • METRORAIL RIDERSHIP — WEEKENDS 68% • CULTURE ATTENDANCE 75% • CONVENTION CENTER ATTENDANCE 80% • TOURISM — ALL OF D.C. 86% • HOTEL OCCUPANCY 93% • ENTERTAINMENT ATTENDANCE 95% • EMPLOYMENT 96% • HOUSING — APARTMENTS 101% • HOUSING — CONDOS 103% • DINING — DESTINATION RESTAURANTS 108% • SHOPPING — LUXURY 130%
•
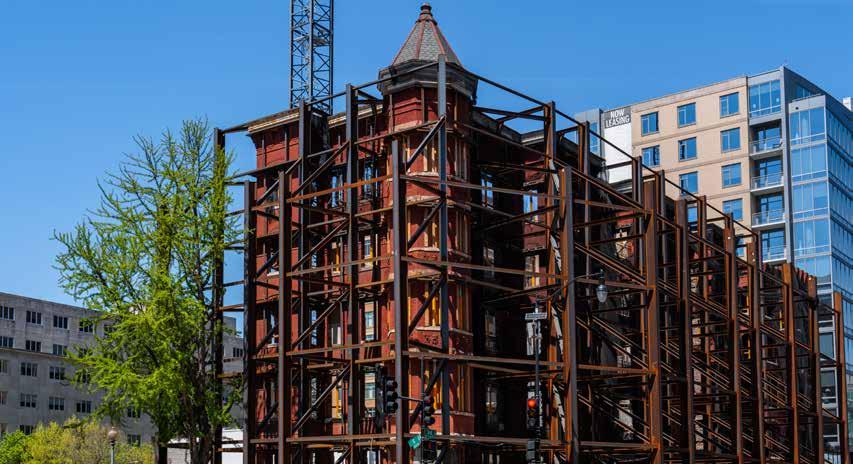
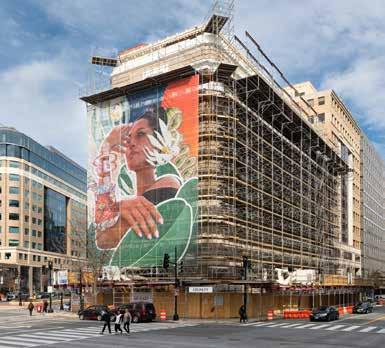
DOWNTOWNDC.ORG STATE OF DOWNTOWN 2022 Nordstrom Rack in DowntownDC Cover page photo: 1125 15th Street NW — an announced, but currently paused, office-to-residential project that may be jump-started by the FY 2024 DC Budget’s Housing in Downtown Tax Abatements. CONTENTS TABLE OF ABOUT THE BID 04 CREDITS 52 YEAR IN REVIEW 08 EMPLOYMENT 16 OFFICE MARKET 20 HOTELS, TOURISM & CONVENTIONS 24 CULTURE & ENTERTAINMENT 30 SHOPPING & DINING 34 HOUSING & DEMOGRAPHICS 38 TRANSPORTATION 42 PUBLIC REALM 46 LETTER FROM THE CHAIRMAN OF THE BOARD AND THE PRESIDENT & CEO 06 DEVELOPMENT 12
The Bazaar by José Andres at the Waldorf Astoria Hotel
ABOUT THE BID
The Downtown Business Improvement District was founded in 1997 and is a private nonprofit organization. This special district, where property owners have agreed to tax themselves to fund services, encompasses a 138-block area of properties from Massachusetts Avenue on the north, including the Walter E. Washington Convention Center at Mount Vernon Square, to Constitution Avenue on the south, and from Louisiana Avenue on the east to 16th Street on the west.
1 SQUARE MILE 138 BLOCK AREA
528 PROPERTIES TOTALING
103 MM SF
04 DOWNTOWNDC.ORG STATE OF DOWNTOWN 2021 JUDICIARY SQUARE FRANKLIN PARK MT. VERNON SQUARE THE PARK AT CITYCENTER SAMUEL GOMPERS MEMORIAL PARK MCPHERSON SQUARE PERSHING SQUARE THOMAS CIRCLE SCOTT CIRCLE FREEDOM PLAZA CHINATOWN PARK
MIX OF USES IN DOWNTOWN (a)
(a) Includes space under construction
05 DOWNTOWNDC.ORG STATE OF DOWNTOWN 2022
in millions of square feet (SF)
78.6 SF Office 76% Housing 6.7 SF 7% Hotels 6.7 SF 7% Retail 4.2 SF 4% Center Convention 2.3 SF 2% Theatres and Performance Venues 0.4 SF 0.3% Entertainment 0.7 SF 0.7% University 1.4 SF 1% Museums 2.4 SF 2%
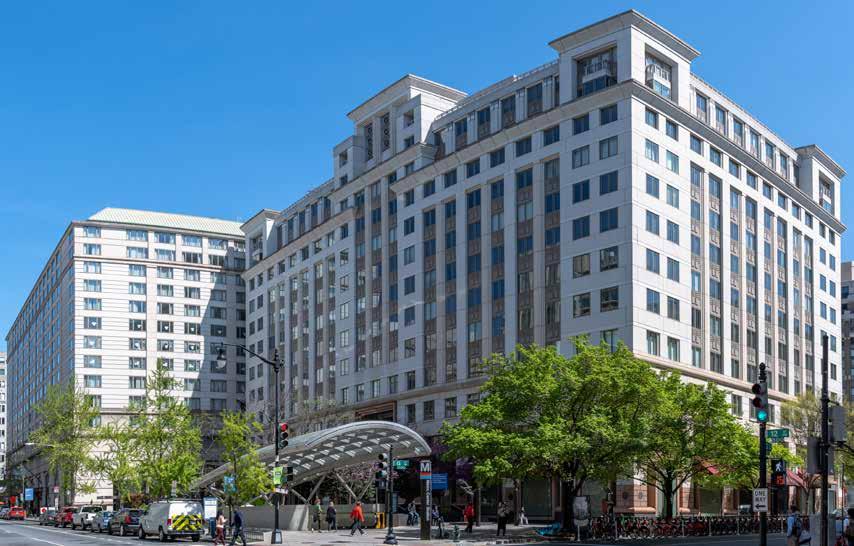
The Renaissance Hotel at 9th and K streets NW, is undergoing a $92 million renovation and change to the Westin flag in October 2023.
LETTER
Dear DowntownDC BID Member,
The DowntownDC Business Improvement District (BID) area faced many challenges in 2022 that it is still grappling with as of spring 2023. However, several seeds of optimism have been planted for downtown’s reimagination and recovery. With the partnership of the DowntownDC private sector as well as the District and federal governments, the BID sees a bright future. It will take change and funding to make this future a reality but the city’s downtown can become a resilient economic engine that is diverse, equitable, and welcoming to D.C. residents from all walks of life, businesses, and visitors. And, most important, downtown can restore its tax base to prepandemic levels.
reached new highs. Next, concerns about the safety of regional banks for depositors caused liquidity and valuation issues for commercial real estate, particularly downtown office buildings. When all these issues combined with a reduction in District revenue projections, the economic uncertainty in DowntownDC reached a 25-year high.
In spring 2023, DowntownDC economic activity was estimated at 65% of prepandemic levels — up from 55% in fall 2022 and 47% in March 2022. But economic activity has stagnated in the low-to-mid 60% range since January 2023.
Assistance or the Housing Production Trust Fund.
The DowntownDC and Golden Triangle BIDs’ combined net fiscal impact (revenues generated less expenditures made) is estimated to decline by $300 million from FY 2019 through FY 2024 (using property tax revenue estimates slightly lower than those of the Office of the Chief Financial Officer).
2022 opened with the Omicron variant flare-up, with COVID-19 cases suddenly increasing and economic activity in DowntownDC plummeting, including the cancelation of several theater performances and productions. Health uncertainty skyrocketed. By March 2022, the Omicron health uncertainty had dropped substantially, but other concerns had appeared or remained: Russia’s invasion of Ukraine, historic rises in inflation, Metrorail issues, the impact of proposed street projects, the impact of increased office energy efficiency issues, and the long-term impact of remote work (in particular, on the federal government workforce). In early 2023, concerns about crime and congestion
As one D.C. developer recently said to the press, “Uncertainty breeds inaction.” And private business activity has not yet fully recovered in DowntownDC. Fortunately, the private sector’s drop in performance was uplifted by federal and District government investment in pandemic-related relief funding of 2020 and 2021 and, more recently, in the Biden administration’s Inflation Reduction Act and the D.C. FY 2024 budget investments in downtown. This classic Keynesian response has been essential to (1) limiting the economic damage of the pandemic and (2) accelerating the economic recovery from the pandemic.
Recent D.C. government revenue estimates show that office property taxes have declined by $135 million per year from FY 2019 through FY 2022 and are estimated to decline another $123 million per year through FY 2025. This lost revenue is not being invested in District schools and the city’s many excellent social programs, like Emergency Rental
An equitable recovery and reimagination of downtown will also address issues like rising concerns about public safety and disorder in some areas, and must include plans and funding for affordable housing, improved parks, potential partnerships with universities and K–12 schools, enhanced homeless services infrastructure, incentives for retail retention and attraction (particularly grocery stores, child care, and other residential amenities), and strong public transit.
The BID believes the seeds have been planted for a robust recovery and reimagination of the District’s downtown.
The full recovery of DowntownDC and the visionary reimagination of the District’s downtown began with Mayor Muriel Bowser’s January 2023 release of DC’s Comeback Plan: 2023–2027 Economic Development Strategy. The plan includes as one of its main goals an increase in downtown residents of 15,000 over five years (from 25,000 to 40,000 residents). This is anticipated to remove 5 million to 7 million SF of the District’s historic high of 25 million SF of vacant office space (historic high 19% vacancy rate and 23% availability rate) through office-to-housing conversion and repurposing. This is just one of six major goals of the Comeback Plan; the other goals focus on all of the city’s neighborhoods.
Following up on the Comeback Plan, Mayor Bowser included in her FY 2024 budget proposal a robust
06 STATE OF DOWNTOWN 2022 DOWNTOWNDC.ORG
FROM THE PRESIDENT & CEO AND THE CHAIRMAN OF THE BOARD
DUE TO DOWNTOWNDC’S FISCAL CONTRIBUTIONS TO THE DISTRICT, THE RECOVERY AND REIMAGINATION OF DOWNTOWNDC WILL BENEFIT ALL D.C. RESIDENTS.
PANDEMIC AND POSTPANDEMIC STAGES OF DOWNTOWNDC ECONOMY
• Relief 3/2019–2/2022
• Recovery 3/2021–12/2024
• Reimagination 1/2023–12/2027+
investment in the conversion/repurposing of downtown office buildings into housing with affordable housing requirements. The BID strongly supports the proposed investment in Housing in Downtown Tax Abatements as well as several provisions in Ward 2 Councilmember Brooke Pinto’s RECOVERY Act of 2023 programs that are included in the District’s FY 2024 budget: approximately $7 million to remain available in the existing $10 million Vitality Fund to retain and attract downtown office
DOWNTOWN ACTION PLAN
tenants; $3.2 million for a new Downtown Retail Retention and Attraction Fund; and $1.1 million for a new Safe Commercial Corridors Fund. All three are competitive grant programs.
The next step in downtown’s recovery and reimagination will be the Downtown Action Plan that is called for by the Comeback Plan. The Action Plan is a partnership between the DowntownDC BID, the Golden Triangle BID, the Federal City Council, and the Office of the Deputy Mayor for Planning and
Engagement, Research, and Analysis
Goal: To align various stakeholders, initiatives, and actions to support downtown’s reimagination and recovery into a vibrant, economically sustainable, diverse, and equitable area at the heart of the city that benefits all residents and businesses by offering jobs, various housing types, and a robust tax base.
Purpose: To present a set of recommendations regarding specific investments, policies, and real estate actions that align with the goals and initiatives of DC’s Comeback Plan and can catalyze actions and investments from a variety of stakeholders.
Economic Development. The Action Plan effort will begin in June 2023 and release a recommendations report in November 2023.
Though the uncertainty regarding the DowntownDC economy remains high, the BID believes that the FY 2024 District Budget and the upcoming Action Plan should result in the full recovery and an exciting reimagination of the DowntownDC economy. We invite you to join us as we get to work.
Michael McCarthy Chairman, Board of Directors DowntownDC BID
 Gerren Price President & CEO DowntownDC BID

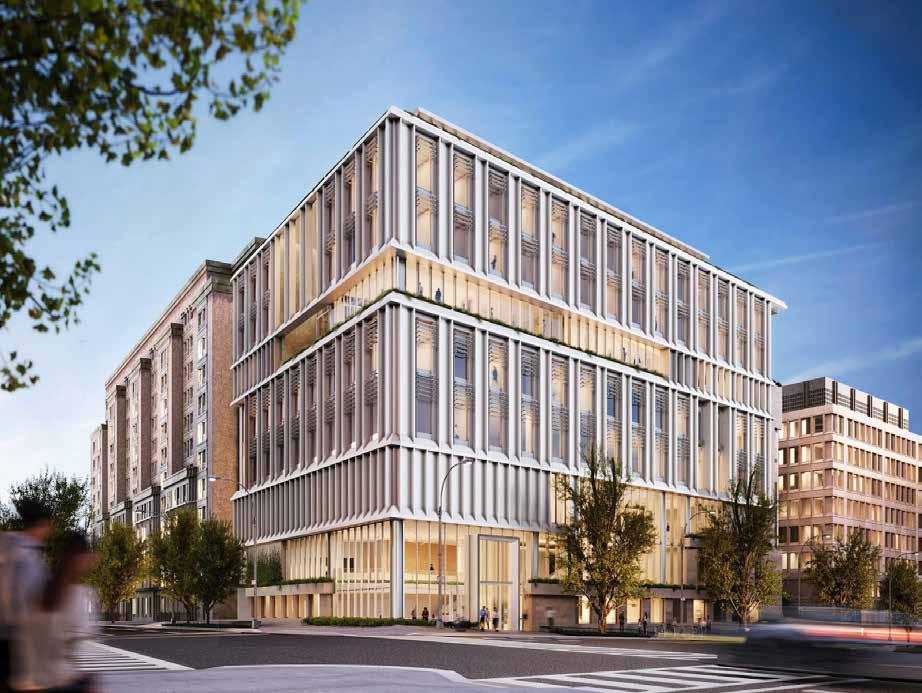
In 2024, Georgetown University’s McCourt School of Public Policy will move into a new building at 125 E Street NW
07 DOWNTOWNDC.ORG STATE OF DOWNTOWN 2022
YEAR
IN REVIEW
RELIEF — RECOVERY — REIMAGINATION
In 2020 and 2021, District and federal relief programs allowed most DowntownDC businesses and organizations to survive the worst months of the pandemic.
In 2022 and the first months of 2023, the DowntownDC economy moved into a relatively strong recovery mode.

DowntownDC’s economic activity is now an estimated 65% of pre-pandemic levels. However, the recovery has varied widely by economic sector:
• Office, office-serving retail, and general shopping are performing at 41% to 67% of pre-pandemic levels.
• Hotels/tourism/convention center, housing, destination dining, luxury retail, culture, and entertainment are performing at 75% to 95% of pre-pandemic levels.
08 STATE OF DOWNTOWN 2022 DOWNTOWNDC.ORG
0% 50% 100% DowntownDC Real Economic Activity As Percentage Of Pre-Pandemic Real Economic Activity
Midtown Center at 1100 15th Street NW
65% 60% 47% 40% 16% 10% 100% % of Pre-Pandemic Real Economic Activity Feb 2020 Apr 2020 Mar 21 Oct 21 Mar 22 Nov 22 May 23
Source: DowntownDC BID
The reimagination of DowntownDC and the larger central business district began in January 2023 with Mayor Bowser’s release of DC’s Comeback Plan (the city’s 2023–2027 Economic Development Strategy), which includes a focus on downtown while calling for investments across all parts of the District. In particular, the goals of 15,000 new downtown residents and 35,000 new jobs by the end of 2027 and several retail and other downtown initiatives have the potential to complete the final stages of the recovery and jump-start the first steps of D.C.’s reimagination of downtown. Mayor Bowser and the D.C Council’s FY 2024 budget includes an updated program for the existing Housing in Downtown Tax Abatements (HIDTA), which the BID strongly supports. HIDTA is intended to create 5,000 to 6,000 new downtown housing units (7,500 to 9,000 new downtown residents). Ward 2 Councilmember Brooke Pinto led the funding of two new competitive grant programs for (1) Downtown retail and (2) Safe Commercial Corridors.
DOWNTOWN’S NET FISCAL IMPACT, THOUGH DECLINING, REMAINS STRONG
DowntownDC remains a major contributor to the city’s tax base and budget, with a FY 2022 Net Fiscal Impact of $676 million from revenues of $1.3 billion (13% of D.C.’s local fund revenues), less expenditures of $618 million (6.5% of D.C.’ local fund expenditures). DowntownDC’s FY 2022 Net Fiscal Impact is down to $676 million from $774 million in FY 2019 — a decline of $98 million and forecast to decline another $110 million in FY 2023. When combined with the Golden Triangle BID, the Net Fiscal
THE NET FISCAL IMPACT OF DC’S DOWNTOWN (a)
FY 2019 FY 2020 FY 2021 FY 2022 FY 2023 FY 2024 DOWNSIDE ESTIMATE FY 2024 (b) DOWNTOWN BID Local Fund Revenues $1,310 $1,171 $1,170 $1,294 $1,309 $1,298 $1,251 Local Fund Expenditures and Transfers 536 548 582 618 774 702 702 Net Fiscal Impact $774 $623 $588 $676 $566 $596 $549 Change From FY 2019 NA ($151) ($186) ($98) ($208) ($178) ($225) Local Fund Revenues as % of District of Columbia 15.8% 14.4% 13.4%% 13.1% 13.5% 13.4% NA Local Fund Expenditures and Transfers as % of D.C. 6.8% 6.6% 6.8% 6.5% 6.7% 6.6% NA GOLDEN TRIANGLE BID Local Fund Revenues $603 $553 $614 $570 $581 $568 (est.) $534 (est.) Local Fund Expenditures and Transfers 227 246 273 278 288 $279 (est.) $279 (est.) Net Fiscal Impact $376 $307 $341 $292 $293 $289 (est.) $256 (est.) Change From FY 2019 NA ($69) ($35) ($84) ($83) -$87 (est.) $120 (est.) Local Fund Revenues as % of District of Columbia 7.2% 6.8% 7.0% 5.8% 6.0% 5.9% (est.) NA Local Fund Expenditures and Transfers as % of D.C. 2.9% 3.0% 3.2% 2.9% 2.6% 2.6% (est.) NA TOTAL OF TWO BIDS Local Fund Revenues $1,913 $1,724 $1,784 $1,864 $1,890 $1,866 $1,786 Local Fund Expenditures and Transfers 763 794 855 897 1,031 981 981 Net Fiscal Impact $1,150 $930 $929 $967 $859 $886 $805 Change From FY 2019 NA ($221) ($221) ($183) ($292) ($265) ($345) Local Fund Revenues as % of District of Columbia 2.3.0% 21.2% 20.4% 18.9% 19.5% 19.3% NA Local Fund Expenditures and Transfers as % of D.C. 9.6% 9.6% 9.9% 9.4% 9.3% 9.2% NA Source: RCLCO and DowntownDC BID. (a) Defined as the DowntownDC BID and the Golden Triangle BID (b) Assumes a further decline of 10% in office building property tax assessments.
(all dollar numbers in millions) 09 DOWNTOWNDC.ORG STATE OF DOWNTOWN 2022
900 1000 1200 1100 DC
Source: D.C. Office of the Chief Financial Officer 963 963 963 1,040 983 1,238 1,080 1,133 Millions of Dollars Fiscal Years $ NA % NA % NA Actual Projections 17 18 19 20 21 22 23 24 25 26 27 55 4.9% NA 27 2.3% NA 23 1.9% 2% (19) -1.5% 0% (139) -11.4% -11% (40) -3.7% -14% (57) -5.5% -19% (20) -2.0% -21% NA 0.0% -21% NA 0.0% -21% Cumulative Change From FY 2019 Annual Change
THE DISTRICT’S FY 2024 BUDGET HAS THE POTENTIAL TO JUMP-START THE REIMAGINATION OF DOWNTOWN WITH INVESTMENTS IN HOUSING, BUSINESS RETENTION/ATTRACTION, AND SAFETY.
Large Office Building Property Tax Revenues
Impact from the two BIDs will decline by an estimated $300 million annually from FY 2019 through FY 2024 using the projections in the District’s Chief Financial Officer’s February 2023 Revenue Estimate Letter and a further decline of 10% in office property tax assessments.
The major reason for the decline in downtown’s Net Fiscal Impact is the decline in the D.C. office market’s performance — declining effective rents due to record rent concessions, record vacancy rates, and negative absorption — and declining investment liquidity.
DOWNTOWN’S RECOVERY HAS BEEN UNEVEN
As of spring 2023, here is the real performance of DowntownDC’s economic sectors as a percentage of prepandemic performance:
• Luxury shopping: 90%–150%
• Destination restaurants: 90%–110%
• Apartments/condominiums: 90%–110%
• Capital One Arena: 90%–110%
• Hotels: 90%–110%
• Employment attributed to downtown locations: 96%
• Theaters/performance venues: 80%–100%
• Walter E. Washington Convention Center: 80%–90%
• Museums: 60%–80%
• Everyday shopping: 60%–70%
• Office-dependent food and beverage: 60%–70%
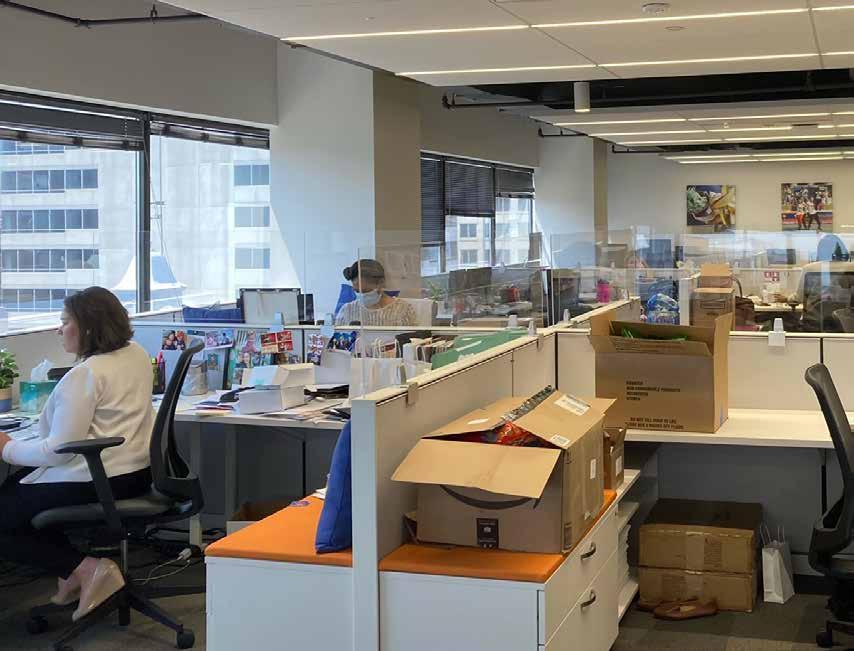
• Office workers in the office: 40%–50%
• Development starts (6/22–5/23) 20%
Key data showing that DowntownDC’s recovery has a way to go (see graphics to the right):
• 40% to 43% of office workers are in-office on an average weekday compared with pre-pandemic, with Tuesdays and Wednesdays just over 50%.
• 40% to 45% of Metrorail weekday ridership compared with pre-pandemic.
• 58% to 70% of people in downtown (residents, workers, and visitors) compared with pre-pandemic.
• 68% to 84% of Metrorail weekend ridership compared with pre-pandemic.
FEDERAL GOVERNMENT UNCERTAINTY
The District’s status as the primary home of the federal government is a major uncertainty in looking to the city’s future. Because there is no reliable data on the percentage
DC and Region Office Workers In Office As A % Of Pre-Pandemic
BID (99 buildings)
Rest of DC (195 buildings)
Source: Kastle
(a) The pandemic months are compared to a pre-pandemic control period of February 3, 2020 to February 18, 2020.
(b) As each month is compared to the first two weeks of February 2020, December 2021 and 2022 show a significant drop due to holiday vacations.
Metrorail Ridership In DowntownDC As A % Of Pre-Pandemic
Source: WMATA
(a) The pandemic months are compared to the most recent pre-pandemic same month. For example, April 2020 and April 2021 are both compared to April 2019.
People in DowntownDC As A % Of Pre-Pandemic
(a) Counts all people in the DowntownDC BID area for more than 8 minutes using cell phone data and Placer's proprietary algorithm.
(b) The pandemic months are compared to the most recent pre-pandemic same month. For example, all pandemic Januarys are compared to Janaury 2020 and all pandemic Aprils are compared to Apirl 2019.
10 STATE OF DOWNTOWN 2022 DOWNTOWNDC.ORG
0% 20% 40% 60% 80% 100% 120% J F M A J F M A M J J A S O N D 2020 J F M A M J J A S O N D J F M A M J J A S O N D 2021 2022 2023 Source:
% of Pre-Pandemic DowntownDC Pedestrian Counts 109% 9% 25% 59% 70% 67% 58% People Counts As A % Of Pre-Pandemic People Counts (a) (b)
Placer
0% 30% 60% 90% 120% 150%
as % of Pre-Pandemic Ridership (a)
Ridership
144% 122% 76% 84% 68% 7% 47% 45% 9% % of Pre-Pandemic Ridership Weekday Ridership Weekend Ridership 2% 2% 17% 36% J F M A M J J A S O N D 2020 J F M A M J J A S O N D J F M J F M A A M J J A S O N D 2021 2022 2023 40% 38% 74% 0% 20% 40% 60% 80% 100% Office Workers in Office as % of Pre-Pandemic Office Workers in Office (a) (b)
(303 buildings) 11% 10% 17% 18% 31% 27% 36% 35% 17% 15% 24% 26% 46% 40% 43% 41% 48% 41% 45% 40% % of Pre-Pandemic Office Workers in Office F M A M J J A S J F M A M J J S A O N D J M A F O N D 2020 2021 J F M A M J J S A O N D 2022 2023
Suburban MD (93 buildings) Northern VA
of federal office workers in the office today as compared with pre-pandemic and regarding the impact of the cafeterias in many federally owned buildings, it is hard to fully understand the current and future implication of significant working from home by federal workers on DowntownDC and the rest of D.C. Nevertheless, the impact of the federal government on DowntownDC and D.C. is substantial: an estimated 32% of District office space (approximately 65 million SF) is owned or leased by the federal government (the General Services Administration, Congress, and independent agencies), and 25% of District employment (approximately 194,000 employees) are federal civilian workers. The federal presence in DowntownDC is 26% of office space and 32% of employment.
The sale of excess federal buildings to the private sector could create more activity in many parts of DowntownDC and D.C. and add millions of dollars to the city’s tax base.
OFFICE CONVERSIONS/REPURPOSINGS AREA FISCAL GAIN FOR THE DISTRICT
The conversion or repurposing of an existing office building into a residential building with affordable housing is expensive. The Housing in Downtown Tax Abatements (HIDTA) in the FY 2024 D.C. budget help cover those costs. HIDTA has a positive fiscal benefit of approximately $9,500 per unit per year, assuming a 100% property tax abatement (which may not be the case). If the full $41 million of tax abatements are used per year starting in FY 2028 and incentivize 6,000 to 7,000 units, then the new taxes from conversion/repurposing alone will be $57 million to $67 million per year. In addition, the removal of 5 million to 7 million SF of office space from D.C.’s office market is likely to stabilize and improve office market performance. Each 1% increase in the assessed values of large office buildings yields an increase in annual property
taxes of $11 million. Assuming a 1% to 4% increase (or prevention in further decline), this would add $11 million to $44 million per year to the return of the HIDTA – a total return of $68 million to $111 million per year, in new tax revenue.
DOWNTOWN’S ACTION PLAN AND REIMAGINATION
The Downtown Action Plan, planned for release in November 2023, will be the product of (1) extensive engagement with downtown stakeholders, District residents and national and international urban experts, and (2) thorough research and analysis. The Action Plan will create a vision and implementation plan for the restoration of downtown’s vitality, employment base, tax base, and welcome all of D.C.’s residents and businesses.
The Action Plan project has four partners: the DowntownDC and Golden Triangle BIDs, the Federal City Council, and the Office of the Deputy Mayor for Planning and Economic Development. The Action Plan’s extensive outreach will include public meetings, subject expert meetings, webinars, and online feedback options. In-depth research and analysis will allow a clear view of the cost of “doing nothing” and the positive fiscal, economic, and human benefits of a robust Downtown Action Plan. The BID hopes the Action Plan’s recommendations could then be included in the District’s FY 2025 budget and result in $10 billion to $15 billion in new private-sector investment over the next 5 to 10 years — creating new jobs and new housing (including affordable housing) and substantially increasing D.C.’s tax base.
DOWNTOWN AND THE NEIGHBORHOODS — NOT DOWNTOWN OR THE NEIGHBORHOODS — HAS BEEN A GUIDING PRINCIPLE OF THE DOWNTOWNDC BID FOR OVER 25 YEARS AND WILL BE FOR THE 2023 DOWNTOWN ACTION PLAN.
11 DOWNTOWNDC.ORG STATE OF DOWNTOWN 2022
Owned or Leased Office Space (a) 26% 32% 36% 23% 25% 32% Employment Federal
Source:
(a) Federally owned space is 21%, 24% and 23% of total
SF
Government Share of DowntownDC and D.C. Office Space and Employment
General Services Administration, Bureau of Labor Statistics, Econsult Solutions Inc., CoStar and DowntownDC Business Improvement District.
office
for each geography, respectively.
DowntownDC BID Area Rest of DC All of DC
D.C’S FY 2024 BUDGET’S HOUSING IN DOWNTOWN TAX ABATEMENTS PROGRAM IS LIKELY TO GENERATE A POSITIVE NET FISCAL IMPACT OF $9,500 PER HOUSING UNIT PER YEAR AND A TOTAL OF $68 MILLION TO $111 MILLION PER YEAR IN NEW TAX REVENUE.
DEVELOPMENT
DOWNTOWNDC DEVELOPMENT SLOWED IN 2022
Development in DowntownDC came to a halt in July 2022 with no groundbreakings since then — the not-unexpected result of rising construction costs, higher interest rates, the continued strength of remote work, and substantial economic and political uncertainty.
Development Overview:
• One completion in 2022.
• Two groundbreakings in 2022.
• 8 projects, totaling $1.2 billion, are under construction as of spring 2023.
• 15 projects, totaling $1.6 billion, are planned as of spring 2023.
15 PLANNED PROJECTS
The 15 planned projects in DowntownDC will fill four of the area’s remaining six surface parking lots and are summarized below:
• Housing: three conversions and three ground-up projects
• Office: one gut renovation and three ground-up projects.
• Two firehouse redevelopments by the D.C. government.
• Two hotel projects.
• Likely redevelopment of the FBI headquarters site into a mix of uses.
The estimated new tax revenue from these planned projects totals $70 million to $100 million per year.
12 STATE OF DOWNTOWN 2022 DOWNTOWNDC.ORG
The Arlo Hotel is under construction on the 300 block of G Street NW
“UNCERTAINTY BREEDS INACTION.”
—D.C. DEVELOPER
15 PLANNED PROJECTS, TOTALING $1.6 BILLION, ARE ESTIMATED TO GENERATE $70 MILLION TO $100 MILLION PER YEAR IN NEW TAX REVENUES FOR D.C.
In addition, there are several notyet-publicly-announced office-toresidential conversion projects that are paused, totaling 1,300 units. These projects are pending (1) the availability of conversion/repurposing incentives included in the FY 2024 DC budget and (2) market conditions.
9 PROJECT UNDER CONSTRUCTION
1. Johns Hopkins University: 555 Pennsylvania Avenue NW renovation, 420,000 SF
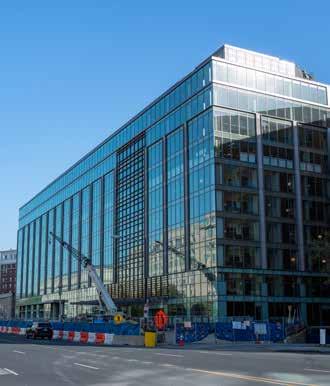
2. Office Properties Income Trust: 20 Massachusetts Avenue NW renovation of 340,000 SF and new construction of 87,000 SF into a 271-room Royal Sonesta Hotel and 184,000 SF of office space
3. Quadrum Global: Arlo Hotel, 333 G
Street NW, 445 rooms and 7,000 SF of retail
4. Lincoln Properties and Cadillac Fairview: 1313 L Street NW apartment building, 222 units
5. Milken Center for Advancing the American Dream, 15th Street and Pennsylvania Avenue NW
6. National Museum of Women in the Arts: renovation of 1250 New York Avenue NW
7. Georgetown University: McCourt School of Public Policy, new construction at 125 E Street NW
8. Renaissance Hotel: 999 9th Street NW, a $92 million renovation into a Westin Hotel (807 rooms)
9. Capital Jewish Museum, 575 3rd Street NW (June 2023 opening)
2 GROUNDBREAKINGS
• Quadrum Global: Arlo Hotel, 333 G Street NW
• Renaissance Hotel: 999 9th Street NW renovation into a Westin Hotel
In addition, the $375 million gut renovation and addition to the former WMATA headquarters at 600 5th Street NW by Stonebridge and the Rockefeller Group (400,000 SF of office) is expected to be under construction in June 2023.
1 COMPLETION
• The Victims of Communism Museum opened in June 2022 in 10,000 SF at 900 15th Street NW.
13 DOWNTOWNDC.ORG STATE OF DOWNTOWN 2022
725 12th Street NW is a potential office-to-residential conversion
OFFICE-TO-RESIDENTIAL CONVERSIONS/REPURPOSING
There are approximately 18 office-to-residential conversion/repurposing projects in and adjacent to DowntownDC that have the potential to convert/ repurpose 4.6 million SF of office and create approximately 4,500 to 5,000 housing units, of which 450 to 750 may be affordable. These projects are currently paused/appear paused due to rising construction costs and financing costs, as well as general market uncertainty. These projects are an enormous opportunity for the District to create marketrate and affordable housing in downtown.
DOWNTOWN DEVELOPMENT HISTORY
ONLY SIX GROUND-UP DEVELOPMENT SITES REMAIN IN DOWNTOWNDC. IN 1995 THERE WERE 125+.
PROJECTS UNDER CONSTRUCTION AT YEAR-END
14 STATE OF DOWNTOWN 2022 DOWNTOWNDC.ORG
10 11 12 13 14 16 17 15 2022 1
CUMULATIVE TOTALS SINCE 1995 (billions of dollars) 15 5 7 7 8 5 3 4 4 7 10 20 0 9 10 11 12 13 14 15 16 17 19 20 21 18 2022 20 0 9 10 11 12 13 14 15 16 17 19 18 20 0 9 10 11 12 13 14 15 16 17 19 18 20 20 0 9 10 11 12 13 14 15 16 17 19 18 $0.8 $0.2 $0.3 $0.2 $0.7 $1.0 $0.2 $0.5 $0.3 $1.3 $0.35 $0.18 $0.005 $1.1 2009 10 11 12 13 14 15 16 17 18 19 20 $10.4 $10.6 $10.9 $11.1 $11.8 $12.7 $12.9 $13.1 $13.4 $14.7 $15.8 $16.2 $16.4 $16.4 PROJECTS COMPLETED BY YEAR
INVESTMENT (billions of $) # OF PROJECTS # OF PROJECTS 4 14 17 12 13 16 15 11 13 17 9 19 7 19 7 8 $0.2 $1.2 $1.8 $1.9 $1.1 $1.6 $1.7 $1.6 $1.9 $1.5 2022 $1.25 $0.6 $0.8 21 $1.01 INVESTMENT (billions of $) # of Projects 154 159 166 173 181 186 189 193 197 204 214 222 21 227 2022 228 0,0 0,3 0,6 0,9 1,2 1,5 PROJECTS STARTS/GROUNDBREAKINGS # of Projects 2009 3 10 3 11 10 12 3 13 8 14 4 15 3 16 6 17 8 18 7 19 2 20 5 21 4 2022 2 $0.20 $0.80 $0.90 $0.29 NA NA $1.40 $0.66 $0.35 $0.48 $0.21 $0.07 $0.54 $0.39 8 20 5 21 2022 0 5 10 15 20 25 30 SURFACE PARKING LOTS/DEVELOPMENT SITES Source: DowntownDC BID 2009 28 10 26 11 18 12 18 13 16 14 14 15 13 16 12 17 10 18 8 19 8 20 8 21 7 2022 6
20 Massachusetts Ave N!W under construction
THE IMPORTANCE OF THE HOUSING IN DOWNTOWN TAX ABATEMENTS
Mayor Bowser’s DC’s Comeback Plan: 2023–2027 Economic Development
Strategy highlights the importance of downtown as the District’s economic and fiscal engine and set a goal of 15,000 new downtown residents by the end of 2027. This aggressive, but achievable, goal will meet four important goals:
(1) Increased D.C. tax revenues of $9,500 per new residential unit per year; (2) stem the continuing decline in downtown office property tax revenues; (3) diversify downtown building stock by converting 6 million to 7 million SF of office to housing; and (4) create 1,000 to 1,500 units of affordable housing. For example: 1425 New York Avenue NW’s conversion is estimated to have positive net fiscal impact of $9,500 per unit per year, or $2.4 million per year; will take 287,000 SF out of the office market; and create 255 total residential units, of which 25 would be potentially affordable.
In the spring of 2023, the District finds a very difficult downtown development market and declining downtown office property tax base, and it is the classic Keynesian economic response for the government to make a “jolting” investment to bring the private sector back to investing in downtown. It is estimated that Mayor Bowser’s FY 2024 Housing in Downtown Tax Abatements (HIDTA) will attract $5 billion to $7 billion in private capial to create 6,000 to 7,000 new market-rate and affordable housing units in downtown.
DOWNTOWN OFFICE TO HOUSING CONVERSIONS/REPURPOSING PROJECTS
15 DOWNTOWNDC.ORG STATE OF DOWNTOWN 2022 Source: DowntownDC Business Improvement District
Developer Address Address Address SF of Office Converted Housing Units % of Units Affordable Completion Date DowntownDC BID Area Under Construction Announced Planned, But Not Announced TOTAL 1,907,384 2,130 84,040 273,011 287,042 63,291 1,200,000 222 264 255 89 1,300 Zero TBD TBD TBD TBD 2023 Paused Paused Paused TBD 1313 L Street NW 1125 15th Street NW 1425 New York Ave NW 1010 Vermont Ave NW Several Projects Lincoln Properties and Cadillac Fairview Lincoln Properties and Cadillac Fairview Foulger Pratt Altus/McLean Various Developer SF of Office Converted Housing Units % of Units Affordable Completion Date Downtown Adjacent Under Construction Announced TOTAL 508,294 446508,294446TBDTBD None 1250-1280 Maryland Ave SW Zero Lowe Enterprises Developer SF of Office Converted Housing Units % of Units Affordable Completion Date Rest of Downtown Under Construction Announced TOTAL 2,471,347 2,563 186,012 302,000 383,000 275,585 98,000 96,750 32,000 300.000 800,000 163 300 350 185 110 106 49 300 1,000 Zero TBD TBD TBD TBD TBD TBD TBD TBD 2024 TBD TBD TBD TBD TBD TBD TBD TBD 1111 20th Street NW 1825 Connecticut Ave NW 1875 Connecticut Ave NW 1133 19th Street NW 2141 K Street NW 1735 K Street NW 2626 Pennsylvania Avenue, NW 2100 M Street NW Several Projects Willco Post Brothers Post Brothers Foulger Pratt Not Available Bernstein/Placemakr Velocity/New Legacy Post Brothers Various Planned, But Not Announced
EMPLOYMENT
DOWNTOWNDC AND D.C. EMPLOYMENT REBOUND FOR SECOND STRAIGHT YEAR, BUT STILL TRAIL 2019 LEVELS
DowntownDC is estimated to be home to 185,400 jobs in December 2022, or 24% of all District jobs. This is an increase of 2,000 jobs over December 2021, or 1.1%, but 7,100 jobs below the end of 2019, or down 3.7%. D.C. employment in December 2022 was
772,900, an increase of 11,900 jobs over December 2021, or 1.6%, but 29,100 jobs below the end of 2019, or down 3.6%. The bulk of 2022 job growth came in hotel and food service employment.
However, DowntownDC is lagging the city’s job growth, and the District is lagging the region’s job growth.
As of 1Q 2023, Northern Virginia has surpassed its pre-pandemic employment by 1.4%, and Suburban Maryland is at 99.6% of pre-pandemic employment, while D.C. is at 96.4% of pre-pandemic employment.
DowntownDC is lagging the rest
DOWNTOWNDC IS HOME TO 24% OF D.C.’S JOBS, AND D.C. IS HOME TO 23% OF THE REGION’S JOBS.
16 STATE OF DOWNTOWN 2022 DOWNTOWNDC.ORG
of D.C. in overall employment recovery primarily due to its high percentage of hotel, restaurant, and arts employment and office-serving retailers. D.C. is lagging the rest of the region for the same reasons, plus a decline in federal civilian employment not seen in Maryland and Virginia.
D.C. private-sector employment totaled 538,000 in December 2022, an increase of 19,300 jobs over December 2021, but still 26,900 jobs below the end of 2019, or down 4.8%. D.C. federal government employment dropped by 6,200, or 3.1%, to 193,500 in 2022 (and has dropped even more in 1Q 2023), while the D.C. government also declined in 2022 by 1,200, or 3.1%, to 37,400.
Source: Econsult Solutions Inc (ESI) and The Riddle Company (2010, 2019, 2021 & 2022) and DowntownDC BID (2011-2018 & 2020)

17 DOWNTOWNDC.ORG STATE OF DOWNTOWN 2022 DOWNTOWNDC EMPLOYMENT HISTORY (a) (b) (a) Not Seasonally Adjusted. (b) Annual data is as of December for each year. (thou s a nd s) 185.4 183.4 192.5 193.5 175.1 170 175 180 185 190 195 172.2 2010 11 12 13 14 15 16 17 18 19 20 21 2022 2022 Change +1.1%
20% 21% 22% 23% 24% 25%
DC EMPLOYMENT
EMPLOYMENT
REGIONAL EMPLOYMENT Source: DowntownDC BID 2010 13 12 11 14 15 16 17 18 19 20 21 2022 24.0% 23.7% 24.0% 23.8% 24.0% 24.1% 23.2% 23.3% 23.0% 24.0% DowntownDC as % of DC DC as % of Region 500 1,000 1,500 2,000 2,500 3,000 3,500 REGIONAL EMPLOYMENT HISTORY (a) (b) Sources: U.S. Bureau of Labor Statistics (a) Not Seasonally Adjusted. (b) Annual data is as of December for each year. (thousands) DC Suburban Mar yland Nor thern V irginia 2010 11 12 13 14 15 16 17 18 19 20 21 2022 718 960 1,344 773 3,356 1,027 1,556 802 3,368 3,274 1,512 1,031 1,535 3,021 998 761 +2.6% +3.0% +2.9% +1.6% Region 2022 Change DowntownDC BID office
DOWNTOWNDC EMPLOYMENT AS % OF
AND DC
AS % OF
REGIONAL
D.C. HAS HISTORICALLY LOW UNEMPLOYMENT RATE
In August 2022, the District recorded a historic low unemployment rate of 3.9%, with 15,417 unemployed residents, down from 11.2% and 43,900, respectively, in April 2020. In March 2023, DC’s unemployment rate was 4.8%. In addition, the preliminary March 2023 unemployment rates in Wards 7 and 8 were 6.9% and 8.2%, respectively, down from 8.4% and 10.4, respectively, in March 2022.
Sources: U.S. Bureau of Labor Statistics and the Stephen S. Fuller Institute, George Mason University
(a) Not Seasonally Adjusted.
(b) Annual data is as of December for each year
DC EMPLOYMENT AND KEY DOWNTOWN SECTOR EMPLOYMENT RECENT HISTORY (a)
18 STATE OF DOWNTOWN 2022 DOWNTOWNDC.ORG DC as % of Region
EMPLOYMENT CHANGE HISTORY (a) (thousa nds) Nor thern V irginia DC Suburban Maryland
20 10 2011 2012 2013 2014 2015 2016 2017 2018 2019 2020 (b) 2021 2022 27% 37% 28% 121% 26% 12% 13% 32% 14% 35% 29% 14% 20% 25.3 -5.7 8.4 44.2 19.4 19.0 29.0 -72.4 -73.3 32.2 19.7 -0.6 8.2 4.1 16.6 11.5 17.4 9.3 5.6 23.9 8.2 11.8 11.0 13.0 9.1 6.3 20.0 49.7 39.1 35.9 44.7 29.0 11.9 8.3 5.0 5.6 -76.9 6.2 -1.3
(numbers in thousands) Employment Sectors Change Change December 2022 Dec 2021 Dec 2020 Dec 2019 Dec 22 –Dec 21 Dec 19–Dec 22 March 2023 (c) March 2022 March 2021 March 2020 March 2019 March 23 - March 22 March 19March 23 # % # # % # % # # % Total DC Employment (b) 772.9 100% 761.0 725.1 802.0 11.9 (29.1) -3.6% 769.7 100% 758.8 720.5 799.5 796.6 10.9 (26.9) -3.4% Federal Government 193.5 25% 199.7 198.5 195.1 (6.2) (1.6) -0.8% 191.4 25% 199.0 197.4 195.4 195.2 (7.6) (3.8) -1.9% D.C. Government 37.4 5% 38.6 38.1 37.8 (1.2) (0.4) -1.1% 37.6 5% 37.4 38.0 37.6 37.6 0.2 - 0.0% Private Sector Total 538.0 70% 518.7 484.3 564.9 19.3 (26.9) -4.8% 536.7 70% 518.4 481.0 562.0 559.5 18.3 (22.8) -4.1% Key DC Employment Sectors Impacting Downtown Office Using Jobs (d) 284.8 37% 279.4 273.3 293.2 5.4 (8.4) -2.9% 284.8 37% 280.6 270.9 294.4 287.0 4.2 (2.2) -0.8% Food Services & Drinking Places 51.1 7% 44.4 27.0 54.6 6.7 (3.5) -6.4% 5`.6 7% 44.1 27.8 51.5 56.7 7.5 (5.1) -9.0% Retail Trade 21.1 3% 21.0 20.2 24.1 0.1 (3.0) -12.4% 20.5 3% 20.5 19.5 22.6 22.6 0.0 (2.1) -9.3% Accommodations 13.8 2% 9.6 5.3 16.4 4.2 (2.6) -15.9% 13.8 2% 9.9 5.0 16.2 16.2 3.9 (2.4) -14.8% Arts, Entertainment & Recreation 8.5 1% 7.8 4.9 10.2 0.7 (1.7) -16.7% 9.0 1% 8.0 4.8 9.5 10.4 1.0 (1.4) -13.5 Source: Bureau of Labor Statistics (a) Not seasonally adjusted (b) Numbers do not total (c) Preliminary (d) Professional and business services, including legal, administrative, support, waste management, scientific and technical services.
(a) Seasonally adjusted. Annual data is for December of each year. 4.8% 5.5% 6.5% 11.2% 0% 5% 10% 15% 9.9% 3.9% 4.2% 2010 11 12 13 14 15 16 17 18 19 April 2020 20 21 Aug 2022 March 2023 22
DC UNEMPLOYMENT RATE HISTORY (a)
Source: Bureau of Labor Statistics
UNIVERSITY EMPLOYMENT TO JUMP IN 2023
Johns Hopkins’ new academic center at 555 Pennsylvania Avenue will be home to approximately 400 full-time employees and 700 part-time employees to serve approximately 1,500 full-time students and 600 part-time students when it opens in fall 2023. Georgetown University currently has hundreds of employees working in the DowntownDC BID area, and the opening of the 151,000 SF McCourt School of Public Policy in late 2023, and the University’s purchase of 111 Massachusetts Avenue NW (just outside the DowntownDC BID) should add to that total.
19 DOWNTOWNDC.ORG STATE OF DOWNTOWN 2022
DowntownDC Rest of DC (thousands) DC FEDERAL CIVILIAN EMPLOYMENT
DOWNTOWNDC
Federal Civilian Employment 58,500 135,000 193,500 185,400 587,500 772,900 Federal Employment as % of Total Area Employment Total Area Employment Sources: U S Bureau of L abor Statistic s and DowntownDC BID (a) Not Seasonally Adjusted. 31.6% 23.0% 25.0% 20% 25% 30% 35% Source: U.S. Bureau of Labor Statistics (a) Annual average; Not Seasonally Adjusted. Region is the sum of the sub-state areas. 1992 94 93 95 96 97 98 99 00 01 02 03 04 05 06 07 08 09 10 11 12 13 14 15 16 17 18 19 20 21 2022 34.0% FEDERAL SHARE OF D.C. EMPLOYMENT, 1990-2020 (a) 25.0% 28.2% 29.6% 24.5% 26.4% 26.7% DowntownDC Rest of DC All of DC Northern VA and Suburban Maryland Region FEDERAL CIVILIAN EMPLOYMENT IN REGION - DEC 2022 (a) Federal Employment 58,500 135,000 193,500 178,800 372,700 30% 70% 100% NA NA % of Regional Federal Employment % of DC Federal Employment Sources: U S Bureau of Labor Statistic s and DowntownDC BID (a) Not Seasonally Adjusted. 16% 36% 52% 48% 100%
IN
AND DC - DEC 2022 (a)
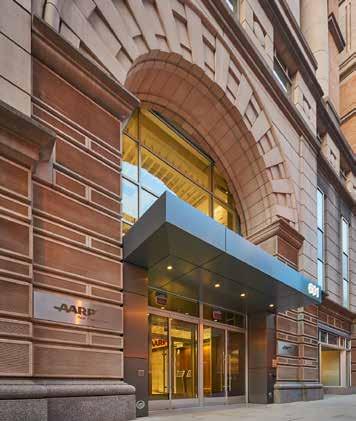
AARP headquarters building at 601 E Street NW — one of the largest private-sector employers in the District
THE FEDERAL WORKFORCE IS 32% OF DOWNTOWNDC EMPLOYMENT AND 25% OF D.C. EMPLOYMENT.
OFFICE MARKET
2022 AND Q1 2023 SAW THE DOWNTOWNDC AND DC OFFICE MARKETS DECLINE TO THEIR LOWEST PERFORMANCE IN DECADES
A combination of factors has created a perfect storm for pessimism about the DowntownDC and D.C. office markets:
• Poor office market operating performance: record vacancy rates of almost 19%; record D.C. vacant office SF of 25 million (and heading higher); federal leasing of fewer SF; negative office absorption; record rent concessions; and Kastle data showing only 41% to 43% of DowntownDC
office workers in office compared with pre-pandemic levels.
• Factors beyond the control of office building owners: Russia’s invasion of Ukraine; Metrorail woes; rising interest rates; tightening lending standards; increasing traffic congestion; perceptions of increasing crime in DowntownDC; and uncertainty regarding taxation and regulation.
DOWNTOWNDC IS THE LARGEST OFFICE SUBMARKET IN REGION, WITH 76 MILLION SF —
37% OF D.C.’S OFFICE SPACE
20 STATE OF DOWNTOWN 2022 DOWNTOWNDC.ORG
DowntownDC Arlington (a) Tysons Reston Bethesda Rest of DC 5% 1 0% 1 5% 2 0% 2 5% 7.7% 9.0% 9.6% 53 MM SF 82 MM SF 13 MM SF 37 MM SF 23 MM SF 18 MM SF 13.6% 17.9% 17.7% 19.4% 23.1% 24.7% 21.8% 23.6% 24.2% 15.6% 17.7% 18.8% 21.7% 23.7% 24.8% 18.8% 17.7% 18.5% Source: CoStar (a) CoStar data is for office buildings over 20,000 SF and are not owner occupied. REGIONAL OVERALL VACANCY RATES 2010 13 14 15 16 17 18 19 20 2021 2022 1Q 2023 11 12 24.7% 23.7% 24.6% GOOD
DOWNTOWNDC AND THE REST OF D.C. BOTH REPORT RECORD VACANCY RATES OF ALMOST 19% AND A RECORD TOTAL VACANT OFFICE SPACE OF 10 MM SF AND 25 MM SF, RESPECTIVELY.
NEWS: THE BOSTON CONSULTING GROUP RECENTLY MOVED INTO DOWNTOWNDC, OCCUPYING 98,000 SF.
AS A RESULT OF BOTH POOR PERFORMANCE AND HIGH LEVELS OF UNCERTAINTY, OFFICE PROPERTY OWNERS HAVE OFFERED RECORD RENT CONCESSIONS, AND OFFICE SALES ARE AT HISTORICALLY LOW LEVELS.
ROSE TO #4 OF U.S. CITIES IN 2023 AFTER SEVERAL YEARS OF RANKING AT #11
21 DOWNTOWNDC.ORG STATE OF DOWNTOWN 2022 200 Massachusetts Avenue NW DC OFFICE RENT CONCESSION COMPONENTS ($ per SF) $0 $3 0 $60 $90 $120 $150 5 0 25 10 15 20 $68 $132 8 24 11 15 17 23 $80 24 Source: Avison Young 2010 11 12 13 14 15 16 17 18 19 20 21 22 1Q 2023 Tenant Improvement Allowance Per SF Tenant Improvement Allowance$ per SF Months of Free Rent $151 $155 $160 $120 Months of Free Rent DOWNTOWNDC OFFICE SALES VOLUME IN SQUARE FEET (a) (numbers in millions of SF) 0 1 2 3 4 5 3.869 0.608 5.330 Source: CoStar (a) Sales of buildings larger than 50,000 square feet. 2010 11 12 13 14 15 16 17 18 19 20 21 22 1Q 2023 Millions of Square Feet in Sales 1.190 0 2.579
D.C’S RANKING BY AFIRE (ASSOCIATION OF FOREIGN INVESTORS IN REAL ESTATE)
OFFICE OCCUPIED SF (a)
OFFICE SF OF BUILDING
22 STATE OF DOWNTOWN 2022 DOWNTOWNDC.ORG 0.0 0.5 1.0 1.5 2.0 2.5 3.0 (in millions of SF) OFFICE SF UNDER CONSTRUCTION (a) Source: CoStar (a) CoStar data is for office buildings over 20,000 SF and are not owner occupied. 2011 12 13 14 15 16 17 18 19 20 21 22 1Q 23 DowntownDC Rest of DC 2.89 0.63 0.67 0.19 0.28 0.88 0.19 2.69 0% 5% 10% 15% 20% 25% Source: CoStar (a) CoStar data is for office buildings over 20,000 SF and are not owner occupied. 2011 12 13 14 15 16 17 18 19 20 21 22 1Q 23 DowntownDC Rest of DC 18.8% 18.8% 17.7% 18.5% 12.2% 12.8% 11.5% 9.6% OFFICE SPACE VACANCY RATE (a) -1.0 -2.0 -0.5 0.0 0.5 1.0 1.5 2.0 2.5 OFFICE NET ABSORPTION SF (in millions of SF) -0.69 Source: CoStar (a) CoStar data is for office buildings over 20,000 SF and are not owner occupied. 2011 12 13 14 15 16 17 18 19 20 21 22 1Q 23 DowntownDC Rest of DC -0.40 -0.23 0.18 1.92 0.05 -2.1 -0.20 -0.93 -0.63
(in millions of SF) 0.0 0.5 1.0 1.5 2.0 2.5 0 0.18 0 Source: CoStar (a) CoStar data is for office buildings over 20,000 SF and are not owner occupied. 2011 12 13 14 15 16 17 18 19 20 21 DowntownDC Rest of DC 2.40 1.01 1.29 0.91 0 0 0 0 22 1Q 23 0 3 6 9 12 15 (in millions of SF) OFFICE VACANT SF (a) Source: CoStar (a) CoStar data is for office buildings over 20,000 SF and are not owner occupied. 2011 12 13 14 15 16 17 18 19 20 21 DowntownDC Rest of DC 22 1Q 23 9.0 6.4 15.2 9.9 9.0 14.5 10.0 4.6 0 20 40 60 80 100 Source: CoStar (a) CoStar data is for office buildings over 20,000 SF and are not owner occupied. 2011 12 13 14 15 16 17 18 19 20 21 22 1Q 23 DowntownDC Rest of DC 66.6 43.0 43.0 67.2 43.3 44.1 70.7 64.7 (in millions of SF)
DELIVERIES (a)
THE FEDERAL GOVERNMENT OCCUPIES
32% OF ALL D.C. OFFICE SPACE.
• The opportunity is that the federal government will sell/ long-term lease surplus buildings as it did with the Old Post Office Building, now home to the Waldorf Astoria Washington DC hotel. The current FBI headquarters site is another such opportunity.
THERE IS LIGHT AT THE END OF THE TUNNEL
While there is a lot to be concerned about in the DowntownDC and D.C. office markets, there is positive news:
• 601 Massachusetts Avenue NW sold in 2022 for $1,100/SF.
• Mayor Bowser and the D.C Council’s FY 2024 budget has funding of $41 million per year, starting in 2028, for the conversion/repurposing of up to 6 million to 7 million SF of office space into housing.
• The Zoning Commission voted to not apply Inclusionary Zoning (IZ) to most of DowntownDC, as there is no density to provide per the IZ program due to the city’s height limits. This decision may initiate more development opportunities.
• With modest funding, the D.C. Vitality Fund is retaining and attracting small-growth companies to D.C. office space.
• Mayor Bowser and the D.C Council’s FY 2024 budget includes the sunset of the temporary increase in the deed recordation and transfer taxes from 5% to the former 2.9%. D.C. was among the higher percentages in the nation at 5%.
• The upcoming Downtown Action Plan will likely recommend additional measures to support the office market and diversify DowntownDC into a series of mixed-use neighborhoods, the kind that have supported office markets in other D.C. and suburban submarkets in other U.S. cities during the pandemic.
• D.C. is estimated to have a net gain in tenants from the suburbs of 455,000 SF for 2020–2027 (with a positive 272,00 SF in 2022); D.C. is not seeing its office tenants moving en masse to cheaper suburban office submarkets.
THE LARGE FEDERAL PRESENCE IN DOWNTOWNDC AND D.C. PRESENTS BOTH RISK AND OPPORTUNITY
While all large city office markets in the U.S. are facing challenging times, D.C.’s office market is different due to the significant presence of the federal government as an occupier of owned and leased office space. This is both a major risk and an opportunity for the city:
• The risk is that the federal government reduces the 17.6 million SF of leased space in privately owned buildings.
REGIONAL
AND SUBURBS (numbers in thousandest of SF)
23 DOWNTOWNDC.ORG STATE OF DOWNTOWN 2022
01 02 03 04 05 06 07 08 09 10 11 12 13 14 15 16 17 18 19 20 21 22 23 24 25 26/ 27 -500 -600 -400 -300 -200 -100 0% 100 200 300 Into D.C. Year 27 Source: DowntownDC BID -579 Totals 455,000 SF Out of D.C. 44 30 30 85 -10 0 0 272 -190 38 -129 15.6 1.0 0.0 16.6 21%) 1% 0% 22% 4.6 54.0 0.4 6% 71% 1% 37.5 7.0 3.0 47.5 19% 3% 1% 23% 21.9 6.0 3.0 30.9 17% 5% 2% 24% 59.0 78% 16.6 3.9 0.0 21%) 5% 0% 20.5 26% 30.9 13.7 1.0 24% 11% 1% 45.6 36% 47.5 17.6 1.0 23% 9% 0% 66.1 32% 9.2 81.9 5.4 7% 64% 4.3% 96.5 76% 13.8 135.9 5.8 7% 67% 2.9% 155.5 77% 75.6 100% 127.4 100% 203.0 100% DowntownDC BID Rest of DC FEDERAL AND PRIVATE OWNED AND LEASED OFFICE SPACE IN DOWNTOWNDC AND DC (in millions of SF) Total Leased To 3rd Parties > 20K SF < 20K SF Total Total Office SF (d) By GSA By Other (d) Total SF % SF % All of DC SF % Source: CoStar, General Service Administration and DowntownDC BID. (a) GSA = General Service Administration. (b) Other includes the Supreme Court, Federal Reserve and independent agencies. (c) CoStar data. (d) Does not include DC government-owned office space. Federal-Owned Privately-Owned (c) Federal Owned and Leased SF GSA (a) Congress Other (b) Owner-Occupied Owned Leased
PRIVATE OFFICE TENANT MOVEMENT BETWEEN D.C.
HOTELS, TOURISM & CONVENTIONS
HOTEL, TOURISM, AND CONVENTION PERFORMANCE IMPROVED SIGNIFICANTLY IN 2022. DOWNTOWNDC HOTELS ARE OUTPERFORMING ALL OTHER D.C. AND REGIONAL SUBMARKETS.

24 STATE OF DOWNTOWN 2022 DOWNTOWNDC.ORG
Waldorf Astoria Washington DC interior 0% 20% 40% 60% 80% 100% 120% 0% 20% 40% 60% 80% 100% 120% % of Pre-Pandemic Revenue Hotel Revenues As % of Pre-Pandemic Revenues (a) Hotel Occupancy As % of Pre-Pandemic Occupancy (a) 116% 45% 113% 106% 111% 84% 52% 53% 58% 115% 108% 90% 2020 2021 J F M A M J J A S O N D J F M A M J J A S O N D 2022 2023 J F M J F M 2023 J F M A M J J A S O N D DowntownDC Rest of DC % of Pre-Pandemic Occupancy 45% 84% 87% 113% 107% 57% 62% 79% 94% 85% 92% 93% 2020 2021 J F M A M J J A S O N D J F M A M J J A S O N D 2022 J F M A M J J A S O N D DowntownDC Rest of DC (a) The pandemic months are compared to the same month in 2019 For example, April 2020 and April 2021 are both compared to April 2019 Source: str
DOWNTOWNDC
HOTEL PERFORMANCE
In Q1 2023, DowntownDC hotels had an occupancy rate of 65% compared with 70% in 1Q 2019, or 93% of pre-pandemic levels. Due to a Q1 2023 average daily rate of 112% of Q1 2019, Q1 2023 revenues for DowntownDC hotel were at 108% of Q1 2019 revenues. Since April 2022, hotel occupancy has been 76% to 93% of pre-pandemic levels.
Hotel employment jumped by 44% in 2022, or 4,200 jobs, from 9,600 in December 2021 to 13,800 in December 2022, although this is still down from 16,400 jobs in December 2019, a decline of 2,600 jobs.
25 DOWNTOWNDC.ORG STATE OF DOWNTOWN 2022 0% 2 0% 4 0% 6 0% 8 0% 1 00% $0 $200 $400 $600 $800 $1000 $0 $5 0 $1 00 $1 50 $2 00 $2 50 $3 00 11 12 13 14 15 16 21 17 18 19 20 19 First Quarter 20 21 22 23 $0 $5 0 $1 00 $1 50 $2 00 $2 50 22 (a) Revenue per available room (or RevPAR) = Occupancy Rate * Average Daily Room Rate. S ou rce: str DOWNTOWNDC HOTEL PERFORMANCE Revenue per available room (a) $173 Occupanc y rate $204 $254 $222 11 12 13 14 15 16 21 22 19 First Quarter 20 21 22 23 17 18 19 20 78% $243 $201 $177 $236 $221 $153 $228 $191 $54 $70 $166 $122 $61 $89 $158 $172 $695 $187 $258 $264 79% 39% 70% 55% 40% 39% 27% 81% 61% 65% Revenues 11 12 13 14 15 16 21 17 18 19 20 19 First Quarter 20 21 22 23 $607 $822 $173 $130 $97 $55 $178 $290 $836 Average daily room rate 11 12 13 14 15 16 21 17 18 19 20 19 First Quarter 20 21 22 23 22 22
HOTEL REVENUES IN Q1 2023 WERE 108% OF Q1 2019 REVENUES.
DOWNTOWNDC HAS 37% OF D.C’S HOTEL ROOMS AND GENERATES 40% OF D.C. HOTEL REVENUES.
REVPAR COMPARISON: MARYLAND, VIRGINIA AND SELECTED U.S. DOWNTOWNS
D.C. VISITOR TRAVEL REBOUNDED STRONGLY
IN 2021
Destination DC, the city’s tourism marketing arm, reported strong domestic visitor travel for 2022: 20.0 million visitors, up 52% from 2020’s 13.1 million and 6.4% from 2021 domestic visitation. For 2022, Destination DC is estimating international visitors of 1.1 million to 1.3 million.
Overall, visitors in 2022 is estimated at 86% of 2019, with domestic visitors at 88% and international visitors at 67%.
The memorials and museums on the National Mall attracted 31 million and 13 million visitors, respectively, in 2022, compared with 31 million and 21 million visitors, respectively, in 2019.
(a) Visitor Data is released as follows: domestic visitation in May-June of each year for the prior year, and international visitation in August of each year for t he prior year. (b) Destination DC estimate. (c) International visitors does not include visitors from Canada or Mexico.
26 STATE OF DOWNTOWN 2022 DOWNTOWNDC.ORG 2015 2016 2017 2018 $183 $194 $204 $190 2019 $191 Res t of DC $155 $162 $169 $159 $159 Bethesda / Rock ville $91 $96 $101 $100 $101 Alexandria / A rling ton $113 $116 $118 $113 $117 New York Cit y $244 $238 $243 $243 $233 Bos ton / San Francisco $206 $211 $209 $216 $223 Chicago / Denver / Houston / Los Angeles / Seattle 2020 2021 2022 1Q 2023 $54 $50 $34 $38 $70 $71 $42 $70 $70 $46 $52 $129 $86 $78 $158 $142 $81 $101 $229 $166 $136 $172 $140 $83 $104 $168 $150 $101 $150 $152 $154 $158 $153
Compared to Rest of DC and Region DowntownDC Compared to Other L arge Cit y Downtowns Source: str (REVPAR = Revenue Per Available Room Night)
S ou rce : Destination
VISITORS TO DC (a) (million s) Do m e s tic To ta l 1.7 17 2 15.5 1.7 17 8 16.1 1.7 18 5 16.8 1.6 19 0 17.4 1.9 2 0 2 18.3 2.0 21. 3 19.3 2.0 2 2 0 20.0 2.0 20.8 1.9 22.8 23.8 24.6 13.3 19.1 21.2 21.9 22.8 1.8 18.8 0.3 20.0 1.2 (b) 13.1 0.2 In te rna tio na l (c) 2011 2010 2012 2013 2014 2015 2016 2017 2018 2019 2020 2021 2022
DC
D.C. HOTEL EMPLOYMENT WAS STILL DOWN 16% FROM DECEMBER 2019 TO DECEMBER 2022, BUT UP 44% FROM DECEMBER 2021.
CONVENTION CENTER REBOUNDS STRONGLY IN 2022, AND 2023 IS PROJECTED TO BE EVEN STRONGER
Attendance at the Walter E. Washington Convention Center in 2022 was up 185% from 2021: 476,000 at 105 events, up from 167,000 at 38 events. 2023’s projected attendance is 818,000 — up 72% from 2022 and 77% of 2019 attendance.
The room nights generated by Destination DC for the convention center are particularly important to DowntownDC hotels, as their marginal demand has a significant impact on room rates. 2022 saw a strong rebound to 467,320 room nights from 2021’s 71,004 room nights. The 2022 total accounted for 17.3% of DowntownDC room demand — significant marginal demand.
WALTER E . WA SHINGTON CONVENTION CENTER AT TENDANCE
27 DOWNTOWNDC.ORG STATE OF DOWNTOWN 2022
2011 2012 2013 2014 2015 2016 2017 2018 2019 2020 2021 2022 2023 projected 0 1 0 0, 0 0 0 2 0 0, 0 0 0 3 0 0, 0 0 0 4 0 0, 0 0 0 5 0 0, 0 0 0 6 0 0, 0 0 0 HOTEL ROOM NIGHTS GENERATED
THE WALTER
WASHINGTON CONVENTION CENTER S o u rce: D e s ti n a t i o n D C 530,624 467,320 423,747 587,071 407,287 72,322 71,004
BY DESTINATION DC FOR
E.
S o ur ce: Eve nt s D C # of Event s At tendance 2011 2012 2013 2014 2015 2016 2017 2018 199 208 201 205 233 213 177 165 9 98,00 0 818,000 1,112,00 0 1,070,000 1,332,000 1,170,000 1, 345 ,00 0 1,176,00 0 1, 5 4 3,00 0 2019 2020 29 449,000 1,060,000 145 2021 167,000 38 2022 476,000 105 2023 estimate 109
STRONG INVESTMENT INTEREST IN DOWNTOWNDC HOTELS
In 2022 there was strong investor interest in four DowntownDC hotels, totaling an estimated $700 million:
• Royal Sonesta is building a 271room hotel as part of a mixed-use redevelopment by Office Properties
Income Trust of an existing office building at 20 Massachusetts Avenue NW, which also includes office and retail space.
construction at 333 G Street NW is a $133 million investment by Quadrum.
• Sunstone Hotel Investors is under way with a $92 million renovation of the Renaissance Washington DC Hotel as part of a rebranding to a Westin Hotel in 2023.
TO
• In May 2022, the 263-room Trump International Hotel was purchased by an investor group, which has reflagged the building as the Waldorf Astoria Washington DC, for $375 million. The purchase price of $1.4 million per room is a record hotel room purchase price for the city.
• The 445-room Arlo Hotel under
28 STATE OF DOWNTOWN 2022 DOWNTOWNDC.ORG
(millions) (a)The Washington Monument was closed in 2012-2013 and from August 2016 to September 2019. Source: The National Park Service MEMORIAL ATTENDANCE (millions) Annual Average (2010-2019) 2020 2022 2021 Lincoln Memorial Korean War Veterans Memorial Martin Luther King Jr. Memorial Franklin D. Roosevelt Memorial Thomas Jefferson Memorial Washington Monument (a) Vietnam Veterans Memorial World War II Memorial (a) 2018 (b) from (c) (d) MUSEUM Sources: 2020 2010-2019 ANNUAL TOTAL AVERAGE TOTAL 29.8 10.9 2021 TOTAL 21.4 2022 TOTAL 31.3
VISITORS
NATIONAL MALL AND MUSEUMS 5.8 7.1 3.7 4.5 3.0 3.7 2.0 3.5 2.0 3.1 1.8 2.8 0.1 0.4 3.6 4.7 3.0 7.8 4.8 4.9 4.0 3.3 3.2 3.0 0.3 1.9 1.6 1.4 1.1 1.0 0.9 0.1
$700 MILLION IN HOTEL INVESTOR INTEREST IN DOWNTOWNDC
2016
September 2019. Source:
National
MEMORIAL ATTENDANCE (millions) Annual Average (2010-2019) 2020 2022 2021 Lincoln Memorial Korean War Veterans Memorial Martin Luther King Jr. Memorial Franklin D. Roosevelt Memorial Thomas Jefferson Memorial Washington Monument (a) Vietnam Veterans Memorial World War II Memorial 2020 2010-2019 ANNUAL TOTAL AVERAGE TOTAL 29.8 10.9 2021 TOTAL 21.4 2022 TOTAL 31.3
ANNUAL
ANNUAL VISITORS TO NATIONAL MALL MEMORIALS
(a)The
Washington Monument was closed in 2012-2013 and from
August
to
The
Park Service
5.8 7.1 3.7 4.5 3.0 3.7 2.0 3.5 2.0 3.1 1.8 2.8 0.1 0.4 3.6 4.7 3.0 7.8 4.8 4.9 4.0 3.3 3.2 3.0 0.3 1.9 1.6 1.4 1.1 1.0 0.9 0.1 (millions) Annual Average (2010-2019) 2020 2021 MEMORIAL ATTENDANCE (millions) Annual Average (2010-2019) 2020 2022 2021 Lincoln Memorial Korean War Veterans Memorial Martin Luther King Jr. Memorial Franklin D. Roosevelt Memorial Vietnam Veterans Memorial World War II Memorial 2022 National Museum of Natural History(b) National Gallery of Art National Museum of American History Holocaust Museum National Museum of the American Indian 0.4 0.4 0.3 1.2 1.2 0.6 1.0 0.6 1.7 0.7 0.6 0.3 0.4 0.4 0.3(d) 0.6(d) 1.6 0.2 0.1 MUSEUM ATTENDANCE 2010-2019 ANNUAL TOTAL AVERAGE 29.8 2021 TOTAL 2022 TOTAL 31.3 National Museum of African American History and Culture National Air and Space Museum(a) ANNUAL VISITORS TO NATIONAL MALL AND MUSEUMS 5.8 7.1 3.7 4.5 3.0 3.7 2.0 3.5 2.0 3.1 3.6 4.7 3.0 7.8 4.8 4.9 4.0 3.3 3.2 1.9 1.6 1.4 1.1 1.0
NATIONAL MALL AND MUSEUMS
ANNUAL VISITORS TO NATIONAL MALL MUSEUMS
National Museum of Natural History(b)
MUSEUM ATTENDANCE
MUSEUM ATTENDANCE
National Gallery of Art
National Museum of American History
of Natural History(b)
Holocaust Museum
of American
National Museum of the American Indian
of the American Indian
Hirshhorn Museum and Sculpture Garden
(a) The Air and Space Museum began a 7-year $650 million renovation in December 2018 that will result in partial closure of the building over this time period.
(a) The Air and Space Museum began a 7-year $650 million renovation in December 2018 that will result in partial closure of the building over this time period.
(a) The Air and Space Museum began a 7-year $650 million renovation in December 2018 that will result in partial closure of the building over this time period.
(b) The National Museum of Natural History's Dinosaur Hall was closed for five years, from June 2014 to June 2019.
(b) The National Museum of Natural History's Dinosaur Hall was closed for five years, from June 2014 to June 2019.
(b) The National Museum of Natural History's Dinosaur Hall was closed for five years, from June 2014 to June 2019.
(c) The National Museum of African American History and Culture opened in September 24, 2016.
(c) The National Museum of African American History and Culture opened in September 24, 2016.
(d) DowntownDC BID estimate.
(d) DowntownDC BID estimate.
(c) The National Museum of African American History and Culture opened in September 24, 2016.
(d) DowntownDC BID estimate.
Sources: Smithsonian, National Gallery of Art and the U.S. Holocaust Museum
Sources: Smithsonian, National Gallery of Art and the U.S. Holocaust Museum
Sources: Smithsonian, National Gallery of Art and the U.S. Holocaust Museum
29 DOWNTOWNDC.ORG STATE OF DOWNTOWN 2022 (millions) Annual Average (2010-2019) 2020 2021 0.2 0.7
2022 National Museum of Natural History(b) National Gallery of Art National Museum of American History Holocaust Museum National Museum of the American Indian Hirshhorn Museum and Sculpture Garden 0.4 6.7 0.4 0.3 3.9 3.3 1.9 1.2 1.2 0.6 0.8 1.0 6.5 0.6 1.7 4.4 0.7 0.6 4.1 0.3 0.4 2.2(c) 0.4 0.3(d) 0.6(d) 1.6 0.2 1.3 0.1 0.1
2010-2019 ANNUAL TOTAL AVERAGE 2010-2019 ANNUAL TOTAL AVERAGE 2020 TOTAL 3.1 2021 TOTAL 4.9 27.4 2022 TOTAL 13.3 29.8 2022 TOTAL 31.3 National Museum of
American History and Culture National Air and Space Museum(a)
African
0.2 0.7
0.4 6.7 0.4 0.3 3.9 3.3 1.9 1.2 1.2 0.6 0.8 1.0 6.5 0.6 1.7 4.4 0.7 0.6 4.1 0.3 0.4 2.2(c) 0.4 0.3(d) 0.6(d) 1.6 0.2 1.3 0.1 0.1
TOTAL 2020 TOTAL 3.1 2021 TOTAL
2022
13.3 National Museum of
American History and Culture National Air and Space Museum (a) (millions) Annual Average (2010-2019) 2020 2021 0.2 0.7
4.9
TOTAL
African
2022 National
National Gallery of Art National Museum
History Holocaust Museum National Museum
Hirshhorn Museum
Sculpture Garden 0.4 6.7 0.4 0.3 3.9 3.3 1.9 1.2 1.2 0.6 0.8 1.0 6.5 0.6 1.7 4.4 0.7 0.6 4.1 0.3 0.4 2.2(c) 0.4 0.3(d) 0.6(d) 1.6 0.2 1.3 0.1 0.1
Museum
and
2010-2019 ANNUAL TOTAL AVERAGE 2010-2019 ANNUAL TOTAL 2020 TOTAL 3.1 2021 TOTAL 4.9 27.4 2022 TOTAL 13.3 29.8 2021 TOTAL 21.4 2022 TOTAL 31.3 National Museum of African American History and Culture National Air and
Museum(a) MUSEUMS 7.1 7.8
Space
CULTURE & ENTERTAINMENT
2022 WAS A YEAR OF SIGNIFICANT RECOVERY FOR CULTURE & ENTERTAINMENT, AND 2023 WILL SEE THE COMEBACK CONTINUE.
DowntownDC’s 13 museums (with two new museums under construction) and eight theaters/ performance venues were the hardest-hit sector of the BID-area economy during the pandemic, as all operations were almost 100% closed from mid-March 2020 to mid-April 2021. The District began relaxing restrictions on large gatherings indoors in April 2021. Then the late 2021/early
2022 Omicron flareup caused many individual shows to be canceled as performers became sick and several full productions were postponed or pulled, such as Shakespeare Theatre’s Much Ado About Nothing , Ford Theatre’s The Mountaintop, and Woolly Mammoth’s Seven Methods of Killing Kylie Jenner. Also, museum attendance for many institutions was impacted by fewer operating
30 STATE OF DOWNTOWN 2022 DOWNTOWNDC.ORG
days and shorter opening hours than pre-pandemic. However, by Q4 2022, culture and entertainment attendance had rebounded to 65% to 100% of prepandemic levels and has continued to improve in 2023.
In 2022, 4.7 million culture and entertainment patrons/visitors frequented DowntownDC venues, 63% of 2019 attendance of 7.5 million (with 4Q 2022 reaching 88% of Q4 2019 attendance). Visitor attendance fell to 1.5 million in 2020 (95% of which occurred in Q1 2020) from 7.5 million in 2019. The BID projects 2023 culture and entertainment visitor attendance at 6.2 million — 83% of 2019 attendance.
In Q4 2022 and Q1 2023, culture and entertainment subsectors are recovering at varying paces, as shown by these average monthly attendance ranges:
• Capital One Arena: 90%–100% of prepandemic levels
• Museums: 65%–85% of pre-pandemic levels
• Theaters: 75%–85% pre-pandemic levels
• Performance venues: 80%–90% of prepandemic levels

31 DOWNTOWNDC.ORG STATE OF DOWNTOWN 2022
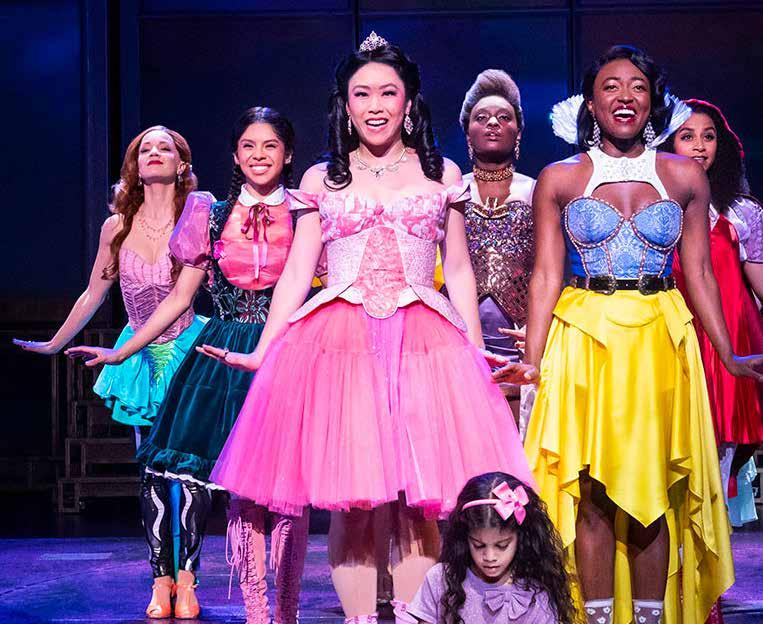
In 2022,
STC’s best-selling show ever. 0 2 4 6 8 10 DOWNTOWNDC CULTURE AND ENTERTAINMENT ATTENDANCE (a) Sources: Museums, Performing Arts Venues and Monumental Sports & Entertainment (a) Key dates impacting Culture & Entertainment attendance: • 2/2/18 - Obama’s portrait unveiled at the National Portrait Gallery. • 1/1/19 - Closing of the Spy Museum location in DowntownDC. • 12/31/19 - Closing of the Newseum. (b) 95% of 2020 attendance occured in 1Q 2020. Museums, Capital One Arena and Performance Venues (millions) 2020 (b) 2021 2022 2023 Projected 8.2 1.7 1.5 7.5 4.7 9.4 6.2 2010 2011 2012 2013 2014 2015 2016 2017 2018 2019
ARTS AND ENTERTAINMENT EMPLOYMENT IS STILL DOWN 13% FROM PREPANDEMIC LEVELS, OR 1,400 JOBS.
the Shakespeare Theatre Company’s production of the pre-Broadway run of the Brittany Spears-inspired Once Upon a One More Time became
2023 CULTURE AND ENTERTAINMENT ATTENDANCE IS ESTIMATED AT 6.2 MILLION — 83% OF 2019 LEVELS.
FEDERAL, CITY, AND PRIVATE FUNDING WAS CRITICAL IN PROVIDING RELIEF FOR THE FIRST 18 MONTHS OF THE PANDEMIC
The culture and entertainment sector has received significant federal, District, and private support since March 2020. The District has invested more than $50 million to provide relief and recovery funding to arts and culture organizations. In addition, D.C. is funding the Arts and Humanities (Commission) with approximately $51 million in the upcoming FY 2024 budget, a record level of funding. Federal funding support included $16.25 billion in the December 2020 Shuttered Venue Operators Grants (covering theaters and other performance venues) in addition to the first two rounds of Payroll Protection Program funding. In addition, many theaters were supported by special fundraising campaigns. Theatre Washington’s Taking Care Fund has distributed approximately $1 million in emergency pandemic grants to hundreds of local theater professionals.
The current FY 2024 District budget calls for restricting the Commission’s future budget growth to 2% per year. The D.C. Council added $5 million for arts and culture capital projects to the FY 2024 budget.
NEW MUSEUMS IN DOWNTOWNDC
The Victims of Communism Museum opened at 900 15th Street NW in June 2022.
Two museums are under construction:
32 STATE OF DOWNTOWN 2022 DOWNTOWNDC.ORG Capital One Arena Museums Performing Arts Venues 2010 2011 2012 2013 2014 2015 2016 2017 2018 2019 5,140,000 5,438,000 5,030,000 5,026,000 5,371,000 4,899,000 4,977,000 5,184,000 2,600,000 2,500,000 2,500,000 2,500,000 2,300,000 2,300,000 2,000,000 2,500,000 2,500,000 DOWNTOWNDC CULTURE & ENTERTAINMENT ATTENDANCE BY VENUE TYPE Sources: Museums, Performing Arts Venues and Monumental Sports & Entertainment 6,310,000 2,700,000 4,786,000 2020 2021 2022 2022 % of 2019 48% 93% 71% 4Q 2022 as % of 4Q 2019 67% 121% 85% 650,000 730,000 2,300,000 764,000 1,860,000 720,000 140,000 516,000 180,000 664,000 701,000 678,000 661,000 812,000 733,000 759,000 730,000 629,000 811,000
National Museum of Women in the Arts is undergoing a $68 million renovation
• Capital Jewish Museum (opening in June 2023)
• Milken Center for Advancing the American Dream (expected to open in 2024)
Also, the National Museum of Women in the Arts is scheduled to reopen in fall 2023 after a two-year, $68 million renovation.
The redevelopment of the current FBI headquarters site would provide an excellent location for a new museum or the expansion of an existing one.
WHAT DOES A RETURN TO NORMAL LOOK LIKE?
DowntownDC’s culture and entertainment venues are part of the BID’s, and the District’s, competitive advantage in attracting employers, conventions, and visitors. A return to a “normal” (pre-pandemic) year would result in the following annual attendance numbers:
• Museums 4.0 million–4.5 million
• Capital One Arena 2.0 million–2.5 million
• Theaters/Venues 0.7 million–0.8 million
• Total 6.7 million–7.8 million
PRE-PANDEMIC DOWNTOWNDC CULTURE AND ENTERTAINMENT ATTENDANCE
Warner Theatre
National Theatre
Sidney Harman Hall (b)
Ford's Theatre
Sixth & I Synagogue
Michael Klein Theatre (b)
Woolly Mammoth Theatre
Sources: Theatres and Performance Venues
(a) If open less than years for the average, average based on years open.
(b) Shakespeare Theatre Company venues.
PRE-PANDEMIC DOWNTOWN DC MUSEUM ATTENDANCE
Average for 2010 - 2019 Average
Sources: Museums and
(a) For 2017 -- 2019.
(b) DowntownDC BID estimate.
33 DOWNTOWNDC.ORG STATE OF DOWNTOWN 2022
TOTAL
2010
2019
for
-
Hamilton Live
(c) Under construction
DowntownDC BID
553,900 504,462 107,630 119,508 134,222 66,034 NA NA 1,085,704 1,312,700 65,549 NA NA NA 732,400
Portrait Gallery and Smithsonian American Art Museum National Archives Ford's Theatre Historical Site National Building Museum National Museum of Women In The Arts 158,415 113,185 124,035 87,253 73,061 65,629 71,379 39,443 TOTAL
3,949,709
National
Naval Heritage Center DC History Center
Law Enforcement Museum (b)
Museum
of Communism
Jewish Museum (c) Center for the American Dream
Museum
Old Post Office Tower (a) The
National
Children's
Planet Word Victims
Capital
(c) National Building
SHOPPING & DINING
PERFORMANCE MIXED IN 2022 AND Q1 2023
The performance of the DowntownDC retail sector in 2022 and early 2023 was vastly different for destination dining and luxury shopping compared with lunchtime dining and everyday shopping, which have been significantly impacted by the low percentage of office workers coming to the office.
The DowntownDC destination restaurant sector continued its strong recovery, with 19 openings and 12 closings in 2022, and three openings and one closing in Q1 2023, and with eight destination restaurants under construction and eight announced openings. On the other hand, quick-service restaurants had net closings rather than net
THE DOWNTOWN RETAIL VACANCY RATE REMAINS VERY HIGH AT 22% IN MARCH 2023, UP FROM 10% IN DECEMBER 2019.
openings, with 19 closings and 12 openings in 2022 and four closings and two openings in 1Q 2023.
Luxury stores saw one opening and zero closings in 2022, and one opening and one closing in Q1 2023, with two projected openings later in 2023, while everyday stores saw four closings and zero openings in 2022 and two closings and zero openings in Q1 2022.
The increase in vacant retail space of 500,000 SF, from 410,000 SF in December 2019 to 910,000 SF in March 2023, represents the loss of hundreds of retail jobs and an estimated in $18 million to $24 million in annual sales tax revenue.
The potential of DowntownDC retail is shown at CityCenterDC, where retailers continue to grow their sales and report average sales per SF of $1,529, with some luxury brands averaging $4,700 per SF in 2022.
CITYCENTERDC REPORTS AVERAGE STORE SALES OF $1,529 PER SQUARE FOOT IN 2022.
DOWNTOWNDC IS HOME TO MANY AWARD-WINNING RESTAURANTS.
MICHELIN 2022
• ONE 2-STAR RESTAURANT
• THREE 1-STAR RESTAURANTS
• EIGHT BIB GOURMAND RESTAURANTS
JAMES BEARD 2022
• THREE NOMINEES
RESTAURANT ASSOCIATION OF METROPOLITAN WASHINGTON
• 12 NOMINATIONS FOR 2022
34 STATE OF DOWNTOWN 2022 DOWNTOWNDC.ORG
Rumis Kitchen
THERE WERE 19 DESTINATION RESTUARANT OPENINGS IN 2022, AND 19 OPENINGS ARE PLANNED FOR 2023
DOWNTOWNDC RETAIL VACANCY RATE HISTORY
DESTINATION RESTAURANT OVERVIEW AS OF APRIL 2023:
• 141 total restaurants; 151 projected by year-end
• Revenues at 120% of April 2023, a bit better than the rest of D.C. and the suburbs
• 2021: 10 openings, four closings
DESTINATION STORES OVERVIEW
AS OF APRIL 2023:
• 2022: 19 opening, 12 closings
• 2023: 19 openings projected, one closing as of April
• D.C. restaurant employment as of March 2023 is 7% below March 2019
• 64 total stores, 66 projected by year-end
• Several luxury stores’ current sales are well above prepandemic levels
• 2021: five openings, seven closings
• 2022: one opening, four closings
• 2023: two openings projected, three closings as of April
• D.C. retail employment as of March 2023 is 10% below March 2019
REGIONAL RESTAURANT SALES DURING PANDEMIC
Jan 2020 - April 2023 Sales Compared to Pre-pandemic Sales
35 DOWNTOWNDC.ORG STATE OF DOWNTOWN 2022
(a) J F M A M J J A S O N D 2020 J F M A M J J A S O N D 2021 J F M A M J J A S O N D 2022 J F M A 2023 -100% -80% -60% -40% -20% 0% 20% 40% % of Pre-Pandemic Level
+10% +12% +11% -64% -93% -68% +5% -26% +7 % -32% -8% DowntownDC Rest of DC NoVa and Suburban MD
(a) The pandemic months are compared to the most recent pre-pandemic same month For example, April 2020 and April 2021 are both compared to April 2019
-4% 24% 13% 9% 34% 26% 32% 20% 19% 18% -87% -46% -32%
Source: MarginEdge and DowntownDC BID
0% 5% 10% 15% 20% Dec 20 Dec 21 Dec 22 March 23 Dec 19 Dec 18 Dec 17 April 17 April 16 Aug 14 April 14 March 13 March 12 8.5% 22.6% 20.8% 20.8% 12.9% March 11 Nov 09
10.0%
Source: Dochter & Alexander Retail Advisors (2017 - 2021) and DowntownDC BID (2010 - 2016).
22.0%
DOWNTOWNDC DESTINATION RESTAURANT HISTORY
Source: DowntownDC BID
(a) Includes eight destination restaurants under construction and eight announced as of March 2023.
DESTINATION RESTAURANT OPENINGS AND CLOSINGS
2021
10 Opened
Farmbird, Cheesecake Factory, Yardbird, DC Noble, Truluck’s, Dauphine’s, Piccolina, Immigrant Food+, L’Ardente, Michele’s
4 Closed Cedar, Rosa Mexicano, Circa, American Son
2022 AND Q1 2023
22 Opened
Philotimo, Piccolina, Shoto, Dos Toros Taqueria, Piccoletto, Bulldog, The Henri, Little Chicken, Rania, Lima Twist, Carlyle Room & Brennan’s Bar, Grazie Nonna, Bar Spero, Taffer’s Tavern, Brickstone’s Kitchen & Bar, Guy Fieri’s DC Kitchen & Bar, Pow Pow, Howl at the Moon, Tom’s Watch Bar, The Bazaar by Jose Andres, Parlour Victoria, Petite Cerise
12 Closed
Fire & Sage, Café Mozart, Naan and Beyond, Carving Room, Occidental, Punjab Grill, DBGB, The Noble, BLT Prime, Siroc, Toro Toro, Red Apron/Partisan
6 Under Construction
Akedo, 1413 K Street, Love, Maketto, Street Pizza, Mi Vida, Lucha Rosa, G.O.A.T. Room, The Springs at Franklin Park
8 Announced
Fish & Chips, La Grande Boucherie, Washoku Room, Olio e Piu, Tom Colicchio at Market Square, Arlo Hotel Restaurant, 900 Block of F Street, Kitchen + Kocktails
DESTINATION SHOPPING OPENINGS AND CLOSINGS
5 Opened Brunello Cucinelli, Express Edit, Chanel, Claire du Lune, Giorgio Armani
7 Closed Coudailie, Mia Gemma, Johnston & Murphy, Gap, Anthropologie, Potomac River Running, Zadig & Voltaire
2 Opened Akris and Christian Louboutin
7 Closed J.Crew, Ann Taylor Loft, Paper Source, Banana Republic, Marshall’s, Bensons Jewelers, Christofle
0 Under Construction
2 Announced
At CityCenterDC, but not yet publicly announced
36 STATE OF DOWNTOWN 2022 DOWNTOWNDC.ORG Number of Stores at End of Year Openings Closings Net Change 2010 2011 2012 2013 2014 2015 2016 2017 2018 2019 2020 2021 2022 DOWNTOWNDC DESTINATION SHOPPING HISTORY Source: DowntownDC BID 54 0 2 (2) 54 0 2 (2) 54 0 2 (2) 55 1 1 (a) 0 67 12 12 (a) 0 79 12 12 (a) 0 80 1 2 (1) 83 3 3 0 79 (4) 0 (4) 78 (1) 3 (4) 72 (6) 1 (7) 70 (2) 5 (7) 66 (1) 2 (3) 2023 Estimate 67 (3) 1 (4)
Number of Restaurants at End of Year Openings Closings Net Change 2010 2011 2012 2013 2014 2015 2016 2017 2018 2019 2020 2021
120 (2) 4 (6) 125 5 10 (5) 123 (2) 3 (5) 127 4 10 (6) 125 (2) 3 (5) 132 7 10 (3) 136 4 9 (5) 142 6 11 (5) 138 (4) 6 (10) 134 (4) 10 (14) 125 (9) 3 (12) 131 6 10 (4) 2022 138 7 19 (12) 2023 Estimate 151 13 19(a) (6)
DOWNTOWNDC RETAIL OVERVIEW (AT MARCH 2023)
DowntownDC has a broad mix of retailers totaling 3.1 million SF of occupied retail space:
• 948,000 SF of high-end or casual dining in 141 destination restaurants (30%)
• 561,000 SF of other food service providers (18%)
• 595,000 SF of destination shopping in 64 stores (19%)
• 332,000 SF of other shopper’s goods retail (11%), including furniture design showrooms, drugstores, and convenience retail
• 704,000 SF of other retail (22%), with banks, entertainment, and fitness being the largest categories
3,140,000 SF
SF
49%
30% 21%
37 DOWNTOWNDC.ORG STATE OF DOWNTOWN 2022 276,000 SF 227,000 SF 145,000 SF 130,000 SF 16,000 SF 9,000 SF 52,000 SF SHOPPERS' GOODS Apparel Department Store Home Goods Drug Stores / Other Conveniences Jewelry Cosmetics 551,000 SF 340,000 SF 397,000 SF 144,000 SF 77,000 SF FOOD AND BEVERAGE High End Dining Bar Coffee 152,000 SF 207,000 SF 152,000 SF 51,000 SF 40,000 SF OTHER RETAIL Banks and Financial Institutions Spa Childcare 40,000 SF 33,000 SF 29,000 SF Entertainment Fitness Medical Salon Total Possible Retail Space 5,140,000 SF Non-Retail First Floor Under Construction Vacant 910,000 SF DOWNTOWN DC RETAIL SPACE OVERVIEW MARCH 2023
Food and Beverage 1,509,000
Source: Dochter & Alexander Retail Advisors and DowntownDC BID
Shoppers'
927,000
Other Retail
1,005,000 SF 85,000SF
Total Services Occupied Space Electronics 38,000 SF Hard Goods 34,000 SF Gifts Quick Service Restaurant Casual Dining
Goods
SF
704,000 SF
HOUSING AND DEMOGRAPHICS
STEADY APARTMENT AND CONDO MARKETS IN 2022
The DowntownDC apartment market rents increased slightly in 2022 and 1Q 2023, and its vacancy rate rose. Class A rents were $3.51 per SF per month in Q1 2023 — a new record high for DowntownDC. Rents at CityCenterDC’s apartments were in the $4.50 to $4.75 per SF per month range. And the DowntownDC apartment vacancy rate increased from a near record low of 3.1% at the end of 2021 to 4.7% in Q1 2023.
The condominium market remained strong as prices and sales volumes remained at slightly above and at pre-pandemic levels, respectively. Condominium prices and sales volumes were also generally strong in other D.C. submarkets and in the suburbs.
DOWNTOWNDC CLASS RENTS SET
38 STATE OF DOWNTOWN 2022 DOWNTOWNDC.ORG
Bethesda DC Near DowntownDC(a) DowntownDC Rosslyn-Ballston Corridor 2012 2013 2014 2015 2016 2017 2018 2019 $2.82 $2.79 $2.72 $2.82 $2.85 $2.85 $2.91 $3.07 $3.04 $3.05 $3.01 $3.00 $3.11 $3.03 $ 3.17 $ 3.38 $3.22 $3.33 $3.04 $3.17 $3.47 $3.36 $3.46 $3.68 $3.03 $3.25 $3.19 $3.23 $3.29 $3.19 $3.16 $3.30 2020 $2.59 $2.80 $2.77 $2.52 $2.53 2021 $3.03 $3.33 $3.66 $3.41 $3.10 2022 1Q 2023 $3.12 $3.38 $3.63 $3.49 $3.16 $3.26 $3.38 $3.59 $3.51 $3.24 $2.71 $2.68 $2.68 $2.77 $2.72 $2.78 $ 2.96 $ 3.03 CLASS A APARTMENT EFFECTIVE RENTS Source: Delta Associates (a) Includes the area five blocks north and west of the DowntownDC BID boundary. ($ per SF per month)
A NEW RECORD OF $3.51 PER SF IN Q1 2023. DOWNTOWNDC CONDO PRICES SET A NEW RECORD OF $691 PER SF IN 2022.
CL A SS A APAR TMENT VACANCY RATES
4,470
10,433
(a) Includes the area five blocks north and west of the DowntownDC BID boundary.
39 DOWNTOWNDC.ORG STATE OF DOWNTOWN 2022 CityCenterDC 0% 2% 4% 6% 8% 10% 12%
Down town D C N ea r 20 12 1Q 2023 13 14 15 16 17 18 19 20 21 20 12 1Q 2023 13 14 15 16 17 18 19 20 21 20 12 1Q 2023 13 14 15 16 17 18 19 20 21 20 12 1Q 2023 13 14 15 16 17 18 19 20 21 20 12 1Q 2023 13 14 15 16 17 18 19 20 21 2.4 % 2.2% 5.5% 3.1% 22 5.1% 3.8% 11.1% 8.3% 10.3% 8.1% 3.4% 6.2% 4.1% 22 5.7% 4.8% 3.3% 3.8% 22 6.8% 7.4% 4.5% 2.6% 3.4% 22 3.1% 4.6% 4.4% 2.4% 4.7% 3.1% 22 4.0% 4.9% B e th e sd a
S o u rc e: D e l t a A s s o c ia te s D C Ros sl y nBa ll s to n Co rrido r
CLASS A UNITS at 1Q 2023
CLASS A UNITS at 1Q 2023
CLASS A UNITS at 1Q 2023
2,159
5,479
45,014
CLASS A UNITS at 1Q 2023
CLASS A
at 1Q 2023 Down town D C (a)
UNITS
DOWNTOWNDC HAS 9,434 RESIDENTS AND APPROXIMATELY 7,000 TOTAL HOUSING UNITS JUST 1.5% AND 2.0% OF D.C. TOTALS, RESPECTIVELY, PER COSTAR.
HOUSING IS COMING TO DOWNTOWNDC:
222 UNITS
1 UNDER-CONSTRUCTION PROJECT
1,023 UNITS
6 ANNOUNCED PROJECTS
3 CONVERSIONS — 608 UNITS
3 GROUND-UP — 415 UNITS
1,300 UNITS
FROM SEVERAL POTENTIAL CONVERSION PROJECTS
In DC’s Comeback Plan: 2023–2027 Economic Development
Strategy, Mayor Bowser set a goal of 15,000 new residents in five years (by 12/31/27). This is an aggressive, but achievable goal, with the inclusion of the Housing in Downtown Tax Abatement amendments in the city’s FY 2024 budget.
IT IS AGGRESSIVE, BUT DOABLE:
• 15,000 residents will need 9,000 to 10,000 units, or openings of almost 2,000 units per year.
• 385 residential units are under construction from conversions.
• There are 1,923 units in announced and potential housing projects in the DowntownDC BID area and another 1,512 units in other parts of the Mayor’s downtown geography.
• DC averaged 5,907 multifamily housing starts for the five years 2018–2022.
BENEFITS:
• Help stop the decline in office property tax rates by removing 5 million SF to 7 million SF of vacant office space from the market.
• Will provide substantial affordable units — between 1,000 and 1,500 units.
• Will provide demand for new retail.
• Each office conversion increases the District’s tax base, after accounting for the tax abatement, by approximately $9,500 per unit.
• The Mayor’s HIDTA package will bring $5 billion to $7 billion of private capital to DowntownDC and help “jolt” downtown into full recovery mode.
40 STATE OF DOWNTOWN 2022 DOWNTOWNDC.ORG Source: The Mayhood Company (a) New construction sales in 2010-2012. $664 2010 2022 $1,006 $514 $661 $411 $429 REGIONAL CONDO RESALE PRICES ($ per SF) $200 $400 $600 $1,000 $800 $1,200 0 2010 2022 DowntownDC NA $1,122 $1,081 $691 $625 $771 $489 $664 $658 $661 $750 $781 $348 $454 $633 $482 $585 $631 Georgetown/ 14th & U CityCenterDC (a) Shaw/
Bethesda
2010 2022 2010 2022 2010 2022 2010 2022 CITYCENTERDC AVERAGE 2022 CONDO PRICE OF $1,006 PER SF.
Mount Vernon Triangle
Rosslyn-Ballston Corridor
MAYOR BOWSER’S HOUSING GOAL IS AGGRESSIVE, BUT ACHIEVABLE
DOWNTOWNDC AND DC DEMOGRAPHICS 2021 (a)
41 DOWNTOWNDC.ORG STATE OF DOWNTOWN 2022 Bachelor's Degree Graduate/ Professional Degree Source: ERSI forecasts (courtesy of Washington DC Economic Partnership) (a) ESRI data as of April 2023. (b) U.S. Census Bureau estimated D.C. population to be 671,803 as of July 1, 2022. (c) Includes people who have completed some college and Associate Degrees.
49.8% GENDER RACE AGE FEMALE MALE BID DC TOTAL POPULATION 9,434 TOTAL POPULATION 706,367 (b) DOWNTOWNDC 16% 34% 46% TOTAL HOUSEHOLDS: 5,793 TOTAL UNITS: 6,710 50.2% 4% Not Completed High School Completed High School(c) American Indian 0% Pacific Islander 0% 59% White Black 13% Asian 16% Hispanic 10% 2 or more races 9% Other 3% EDUCATIONAL ATTAINMENT HOUSEHOLD HOUSEHOLD INCOME Average Household Size Median Home Value 1.51 Owner Occupied 77% 22% $572,391 Share of Households With Incomes of $75,000 or More $192,291 $134,408 Average Annual Income Median Income 52.3% GENDER RACE AGE FEMALE MALE 32% TOTAL HOUSEHOLDS: 320,719 TOTAL UNITS: 350,364 47.7% 7% Not Completed High School EDUCATIONAL ATTAINMENT HOUSEHOLD HOUSEHOLD INCOME Average Household Size Median Home Value 2.08 Owner Occupied 37% $659,443 63% Share of Households With Incomes of $75,000 or More $160,516 $104,140 Average Annual Income Median Income 0-14 4% 15-24 12% 25-34 35% 35-44 17% 45-54 10% Over 55 22% Bachelor's Degree 27% Graduate/ Professional Degree 34% Average Annual Income Median Income Completed High School(c) Black 42% 40% 11% 5% 5% White Hispanic Other Asian 2 or More Races 8% American Indian 0% Pacific Islander 0% 0-14 14% 15-24 14% 25-34 20% 35-44 15% 45-54 11% Over 55 26% Median Age: 34.8 years Median Age: 36.3 years
TRANSPORTATION
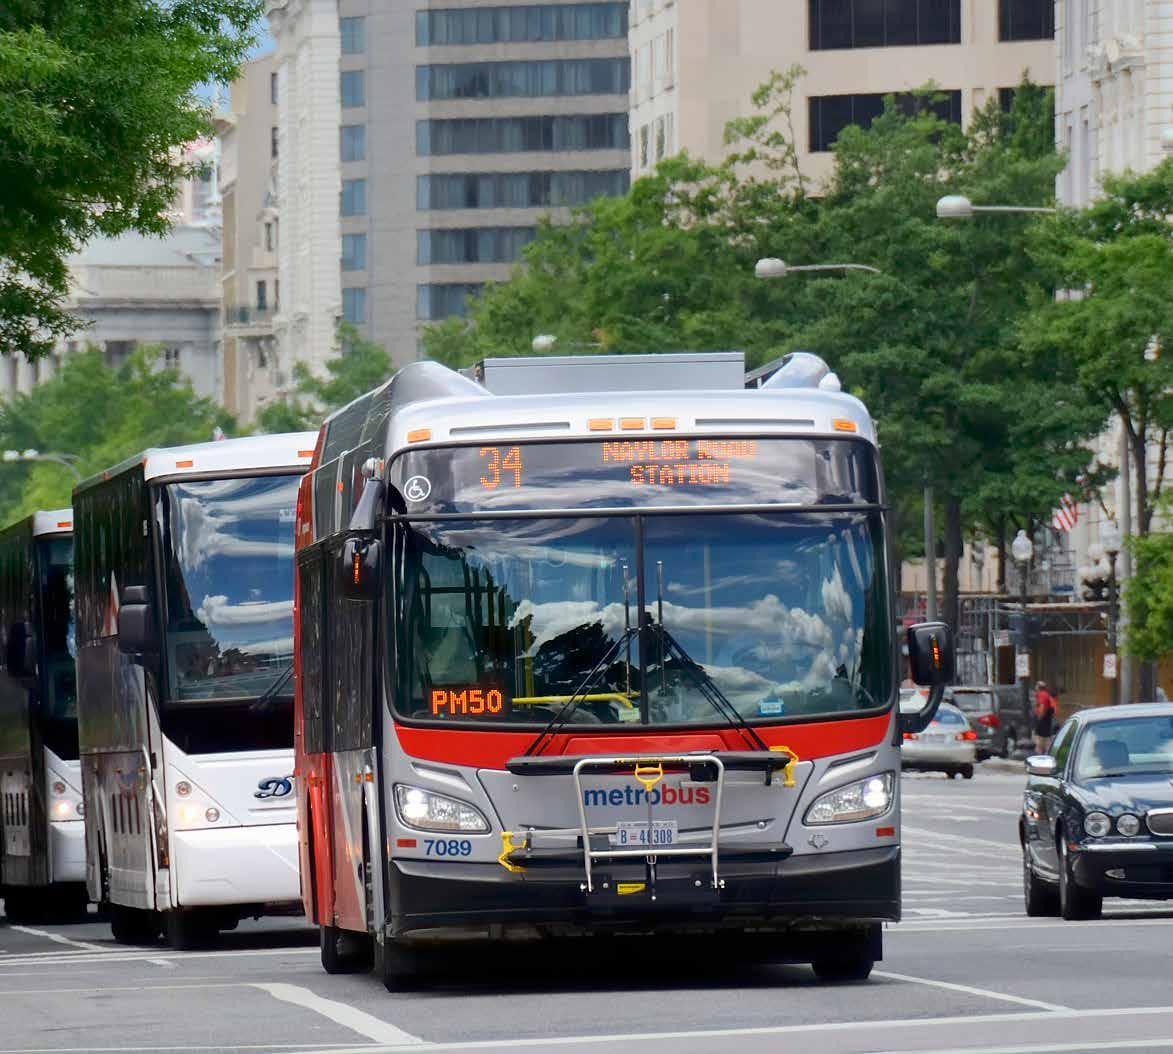
42 STATE OF DOWNTOWN 2022 DOWNTOWNDC.ORG
Bus
ridership is very important to DowntownDC
Metrorail has long been the beating heart of DowntownDC, but due to the pandemic and the derailment of 7000-series railcars in the fall of 2021, D.C. residents, workers, and visitors relied more heavily on bikes and scooters. Rentals of bikes and scooters were strong in 2022 across the variety of available systems, showing a high demand for flexible micromobility options across the city.
IN 2022, METRORAIL SAW
74% OF PRE-PANDEMIC LEVELS.
43 DOWNTOWNDC.ORG STATE OF DOWNTOWN 2022 2022 AVERAGE DAILY METRORAIL EXITS IN DOWNTOWNDC 28,662 37,378 Average Weekday Total Average Weekend Day Total Source: WMATA 8,576 10,056 7,014 12,129 4,205 2,232 1,878 2,006 1,989 2,640 3,369 2,459 13,430 4,057 Average Exits (Weekend Day) Average Exits (Weekday) Metro Center McPherson Square Judiciary Square Mt. Vernon Square Archives Federal Triangle Gallery Place METRORAIL
Source: WMATA (a) Exit numbers for Metro stations in DowntownDC BID Area (McPherson Square, Metro Center, Gallery Place-Chinatown, Archives-N avy Memorial-Penn Quarter, Federal Triangle, Mt. Vernon Square and Judiciary Square). (b) The MCI Center (now Capital One Arena) opened in December 1997 at Gallery Place. (c) Includes weekday holidays. DOWNTOWNDC METRORAIL RIDERSHIP HISTORY (a) (in thousands) 0 20 40 60 80 100 120 97(b) 98 99 00 01 02 03 04 05 06 07 08 09 10 11 12 13 14 15 16 17 18 19 20 21 22 Average Weekday Ridership Average Weekend Day Ridership (c) 68 29 19 37 109 43 22 8 21 15 Year
ITS HIGHEST WEEKDAY SYSTEMWIDE LEVELS IN OCTOBER, WITH 121% OF PRE-PANDEMIC RIDERSHIP. WEEKEND RIDERSHIP WAS HIGHEST IN JUNE, WITH
Systemwide Metrorail ridership increased steadily in 2022, showing a 66% rise in average daily exits from 2021 ridership levels. Although ridership hovers at about half of pre-pandemic levels, use continues to rise in 2023. The share of riders using Metro stations in DowntownDC on weekdays in 2021 (11%) was also lower than it was pre-pandemic (14%). In 2022, downtown metro stations comprised about 13% of systemwide weekday ridership.
METROBUS
In 2022, DDOT advanced and kicked off several key buspriority projects that include: the competition of 2.7 miles of the 16th Street bus priority lane, progressed the K Street Transitway, and kicked off the 11th Street Bus Priority Project.
IN 2022, SYSTEMWIDE BUS RIDERSHIP CONTINUED TO RECOVER, HOVERING AT ABOUT 51% OF PRE-PANDEMIC RIDERSHIP, AND INCREASED BY 61% IN 2021 AND 13% IN 2022, WITH ABOUT 141 MILLION RIDES SYSTEMWIDE.
BIKES AND SCOOTERS
Capital Bikeshare rebounded systemwide in 2021 to 81% of pre-pandemic ridership levels and over 100% in 2022. In DowntownDC, Capital Bikeshare saw only 62% of its prepandemic ridership in 2021, but that increased to 84% as the District Department of Transportation (DDOT) invested heavily in docking stations in the city’s downtown throughout
2021 CAPITAL BIKESHARE RIDERSHIP LEVELS REBOUNDED TO 81% OF PREPANDEMIC LEVELS AND RECOVERED TO 104% IN 2022.
REGIONAL CAPITAL BIKESHARE SYSTEM DATA
2022; 45 new stations were added systemwide in 2022 (current total: 721 stations). A long-awaited protected bike lane on 9th Street NW was completed in 2022.The year’s busiest month was October, with 328,000 riders systemwide and 41,000 in DowntownDC.
Scooters continue to be in high demand across D.C. Over 12,000 scooters provided almost 6 million trips in 2022. The busiest month for scooters in both 2021 and 2022 was July. In early 2023, the District partnered with Veo to bring 720 e-bikes and 720 standing scooters to the city. This will support increased demand and ridership levels into 2023.
CRASH AND PEDESTRIAN SAFETY
Vehicle-related accidents have declined significantly in the last five years. However, they increased slightly in 2022.
The BID is dedicated to lowering these incidences in 2023 by implementing pilot pedestrian-safety projects at three hot-spot locations outlined in a pedestrian safety and experience study conducted in late 2022/ early 2023, with results to be published this year.
44 STATE OF DOWNTOWN 2022 DOWNTOWNDC.ORG
Number of Bic ycles Number of Sta tions Source s: C a pit al Bike s hare and D ow ntown D C BI D 526 3,70 0 4,170 4,150 49 0 2016 2017 2018 2019 2020 4, 30 0 578 4, 736 596 2021 5,270 623 2022 5,400 700 4 0 5
CITYWIDE ACCIDENTS DECREASED BY 11% BETWEEN 2020 AND 2021 BUT INCREASED BY 6% IN 2022.
IN DOWNTOWNDC, VEHICLERELATED ACCIDENTS DECLINED BY 16% BETWEEN 2020 AND 2021 BUT INCREASED BY 40% IN 2022.
THERE WERE 40 INCIDENTS RELATED TO PEDESTRIANS IN 2022, COMPARED WITH 32 IN 2021.
ONGOING STREETCAPE PROJECTS IN DOWNTOWNDC
DDOT continued to enhance the efficiency, safety, and reliability of bus and bike travel in DowntownDC throughout 2022.
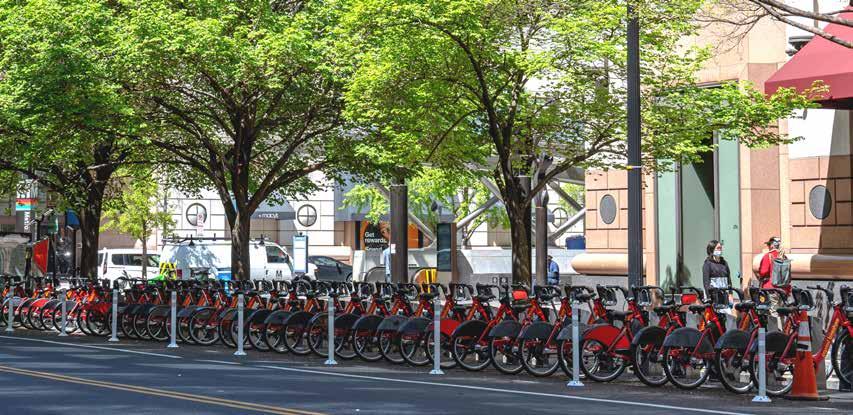
K Street NW is a crucial east-west downtown corridor, connecting residents, visitors, and employees to essential services and exciting destinations. The transitway will feature dedicated bus lanes, medians and curbside enhancements including lighting, landscaping, and green infrastructure. In 2022, DDOT collaborated with the DowntownDC BID, the Golden Triangle BID, and downtown stakeholders to oversee the design review. However, the feasibility of the project moving into construction is still in discussions by city leaders.
The 11th Street Bus Priority Project kicked off in January 2022. Its focus is improving bus operations and safety between Pennsylvania Avenue and L Street NW. In spring 2022, initial concepts were proposed, and DDOT is currently in the process of finalizing the design and plans. The proposed design features dedicated bus lanes, bus bulbouts, stop relocations, and protected bus lanes. The BID will continue coordinating with DDOT on this project, represent stakeholder needs, and relay project updates.
45 DOWNTOWNDC.ORG STATE OF DOWNTOWN 2022
PUBLIC REALM
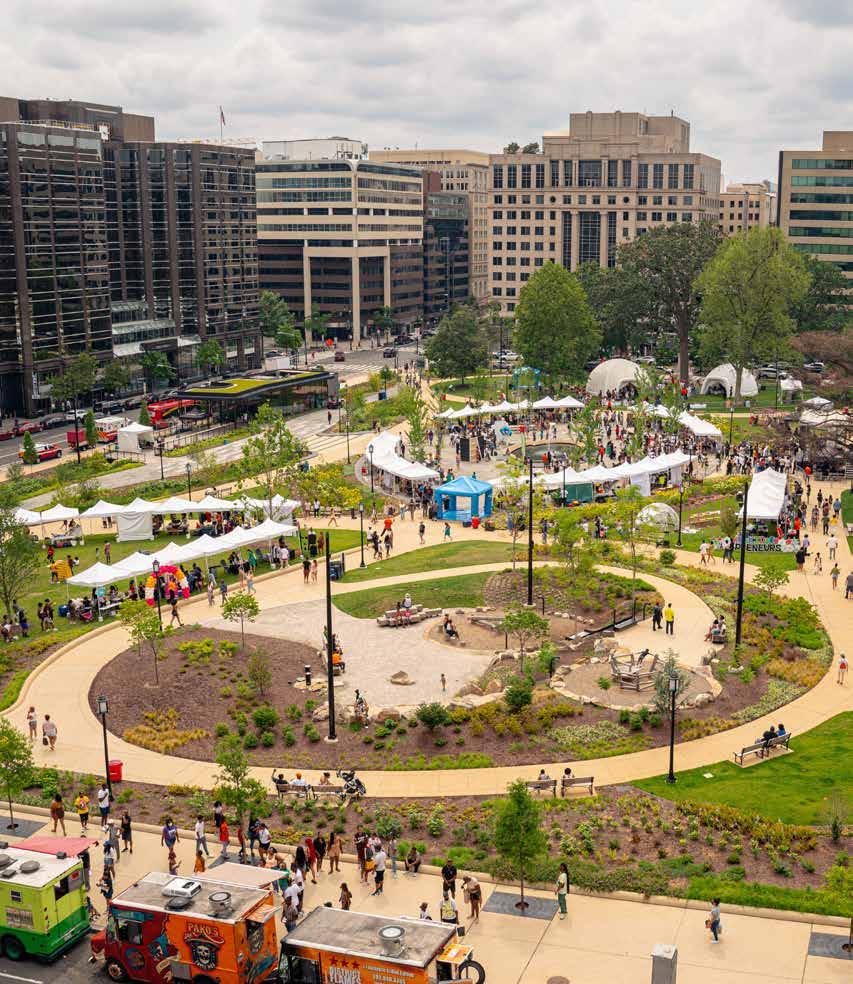
46 STATE OF DOWNTOWN 2022 DOWNTOWNDC.ORG
Black on the Block DC presented by Stefon Diggs event at Franklin Park
VISITORS
Prior to the pandemic, DowntownDC received around 100 million visitors, employees, and residents each year. In 2020 ,BID visitors declined by 65%, attracting 34 million people compared with over 98 million the previous year. In 2022, visitor counts increased by 52%, totaling 59 million people, but still only 60% of prepandemic levels.
Downtown parks and open spaces showed similar trends, with ongoing park improvements and programming to increase visitors and economic recovery in 2022. Approximately 3.3 million visitors came downtown in 2019. Park visitors decreased by almost 70% in 2020, but recovered in 2021 and 2022: park visits increased by 18% in 2021 and 42% in 2022, about 52% of pre-pandemic levels. In 2022, the most visited parks and plazas included Freedom Plaza, the World War I Memorial, Mount Vernon Square, Franklin Park, and McPherson Square.


PARKS AND PROGRAMMING FRANKLIN PARK
Since the highly anticipated reopening of Franklin Park in fall of 2021, the DowntownDC BID has successfully operated and managed programming, kicking off with numerous events and activations that ran throughout 2022, attracting residents, families, and visitors. Highlights included Blossoms in the Park (a National Cherry Blossom Festival event), the return of DowntownDC Summer Flicks, the Black on the Block Festival, the Rock the Park music festival, and many more. Black on the Block featured more than 80 black and brown local vendors and attracted over 5,000 attendees, With a full slate of events underway in 2023, the BID intends to open Franklin Park’s feature eatery, which
is located on the southwest corner and will include an outdoor patio with seating.
PARKS MASTER PLAN
From fall 2021 through 2022, the BID engaged in a year-long process to inventory and reimagine the 27 acres of parks and open spaces within the DowntownDC’s 138 blocks. The effort engaged with the National Park Service, the city’s Department of Parks and Recreation, and DowntownDC stakeholders to identify challenges and opportunities to improve parks, open spaces, and streetscapes to make the public realm more engaging, adaptable, connected, authentic, and iconic.
In recent years, the Trust for Public Land has on multiple occasions ranked D.C. as having the best park system in the U.S. for investment, equity, and access. Yet despite the redevelopment of several park spaces across the city, parks and plazas within the DowntownDC BID remain relatively underdeveloped and underutilized, partly because many are historically significant spaces requiring additional layers of planning and approvals. The DowntownDC Parks Master Plan, which was officially
47 DOWNTOWNDC.ORG STATE OF DOWNTOWN 2022
released in March 2023, was developed to spark interest in developing an intentional, vibrant, and meaningful downtown park system. The plan offers size system wide recommendations based on community engagement and coordination with concurrent planning efforts.
MAYOR BOWSER’S DOWNTOWN COMEBACK PLAN
Establishing clear capital improvement priorities and identifying bold investment strategies is the next step in successfully implementing the DowntownDC Parks Master Plan. Mayor Bowser’s Comeback Plan, released in January 2023, is a catalyst for future investment in downtown. The Comeback Plan is the city’s five-year economic development strategy and acknowledges downtown’s historic economic contributions to the District. The Comeback Plan lists several goals and initiatives for downtown and specifically calls for a Downtown Action Plan to make recommendations on how to reach the Comeback Plan’s goals and implement its initiatives. The Action Plan will identify a long-term funding strategy for maintaining the parks at a worldclass standard for the enjoyment of all District workers, employees, residents, and visitors.
GALLERY PLACE –CHINATOWN CORRIDOR STUDY
In fall 2021 through 2022, the DowntownDC BID engaged in a year-long study of the Gallery Place –Chinatown corridor, defined by 5th and 9th streets NW and Pennsylvania and Massachusetts avenues NW. The project researched the corridor’s economic development, its current public space issues, and the opportunities it offers. The BID partnered with land owners, tenants, and several District
government agencies to imagine the next evolution of this economically vital part of DowntownDC. This area is at the center of the greater Washington region, a place where residents, employees, and visitors from around the globe experience the nation’s capital as a city, not just as the seat of government. The corridor’s combination of regional attractions and robust connectivity gives it a magnified visibility among D.C. visitors, and perceptions of this corridor, whether positive or negative, reflect on the entire city.
Today, the Gallery Place – Chinatown corridor and DowntownDC face important challenges as each recovers from the impacts of several long-term trends and the pandemic’s economic stresses. This study, released in March 2023, documents a stakeholderdriven vision for future economic development investments, public space priorities, and capital improvements
needed to strengthen the corridor. After more than 30 stakeholder interviews, more than 500 online survey responses, four focus group sessions, three Advisory Committee meetings, and two public meetings, the study includes 11 action items. The action items will be prioritized in the development of the Downtown Action Plan and will heavily influence capital improvements in 2023 and beyond.
STREETS FOR PEOPLE GRANT
In 2022, the BID was awarded funding from the Streets for People Grant from the D.C. Office of Planning, which allowed the BID to implement the Pop of Spring and Los Trompos activations. Pop of Spring was a 10-daylong event that transformed the 800 block of F Street NW into a festival at the height of the National Cherry Blossom Festival that brought residents

48 STATE OF DOWNTOWN 2022 DOWNTOWNDC.ORG
and visitors to the city’s heart for live entertainment, video games, movies, performances, and space to relax. This event successfully activated the right-of-way with 14,000+ visitors, a significant increase compared with the previous year, which saw a total of 2,500 visitors over the same period. All nearby metro stations also saw an increase in ridership compared to prior months. Los Trompos, which means “spinning tops” in Spanish, featured eight rotating modules located at both Franklin Park and Indiana Plaza, that encouraged group play and highlighted the work of Mexican artisans. Between the park and the plaza, the activation saw an average of 3,300+ visitors per day, compared with an average of 2,300+ visitors per day during that time the previous year. Overall, this interactive art attracted more than 15,000 people and drove economic recovery downtown. The BID plans to continue successful activations throughout the neighborhood, like those made possible by the 2022 Streets for People Grant.
DOWNTOWNDC FOUNDATION
The DowntownDC Foundation, a 501(c)(3) organization launched in 2019, continued to fulfill its mission to serve and celebrate our vibrant and diverse community by providing homeless services, revitalizing parks, and enhancing public spaces and experiences.
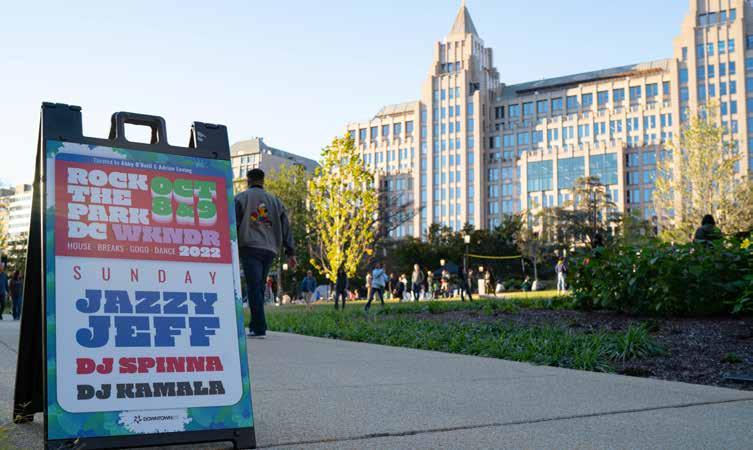
The pilot Terrell A. Waters Impact Clinic, which provides dental and mental health services to individuals experiencing homelessness and is funded by CareFirst BlueCross BlueShield, was completed in February 2022, after which time dental services became a weekly offering at the Downtown Day Services Center. In the area of homeless services, the Foundation continued its successful “Welcome Home Kit” program to transition individuals from homelessness to housing by sending housewares and
more to individuals’ new addresses, funded a crucial homelessness survey in downtown and continued supplying the Center with nutritional shakes, overnight kits, catered holiday meals, coats, shoes, and more.
In 2022, the Foundation also funded Franklin Park’s first year of beautification and landscaping needs through a grant from Amazon; secured sponsors for key events including DowntownDC Summer Flicks; and supported 27 free events hosted in the park’s Children’s Garden. With increasing revenue and partnerships from private, public, and individual supporters, in 2023 the Foundation will be working to secure support for additional parks and plaza in DowntownDC, including McPherson Square, enhancing services and programs for individuals experiencing homelessness, and enhancing programming opportunities throughout DowntownDC.
49 DOWNTOWNDC.ORG STATE OF DOWNTOWN 2022
Rock the Park DC WKNDR event
DOWNTOWN DAY SERVICES CENTER
The DowntownDC BID continues to operate the Downtown Day Services Center as part of its efforts to connect individuals experiencing homelessness to housing and vital services. Launched in 2019 with a five-year, $10 million grant from the D.C. Department of Human Services (DHS), the Center continues to thrive with operational grant funding from DHS, programmatic financial support from the DowntownDC Foundation, and in-kind contributions from many members of the DowntownDC community. The BID also contributes $1 million in matching dollars to the Center annually. The Center is a key part of the mayor’s goal to end homelessness in the city.
Located on the lower level of the New York Avenue Presbyterian Church (1313 New York Avenue NW), the Center proudly serves as a single access point for multiple essential services, including showers, laundry, dental, medical, and mental health treatment, vital records support, and housing, employment, and legal counseling, and provides a daily meals to unhoused guests. Now open six days a week, the Center has become a safe space for homeless individuals to gather and connect to resources serving an average of 250 guests daily. Since its opening in 2019, the DDSC has provided resources to over 70,000 homeless individuals, served over 600,000 meals, and engaged over 20,000 homeless individuals with housing services support.
The Center is staffed by full-time, experienced facility assistant professionals, who engage unhoused individuals to encourage use of daily services and provide them with mentoring support. There are
three important contracted program support organizations for the Center, including Pathways to Housing DC, the Center’s housing provider, HIPS, harm-reduction experts who offer counseling and casework management services, and H3 Project, which provides direct intervention and homeless street outreach. In addition, the BID’s Homeless Services department provides support to citywide planning to reduce homelessness, conducts a monthly homeless count to understand the number of people sleeping downtown better, and manages the convening of multiple community stakeholder groups to address challenges arising from increased homelessness and encampments in the downtown area. In February 2023, the BID provided priority Center services to homeless individuals that resided in the largest D.C. encampment in history, McPherson Square.
DOWNTOWNDC CONTINUES STAKEHOLDER OUTREACH
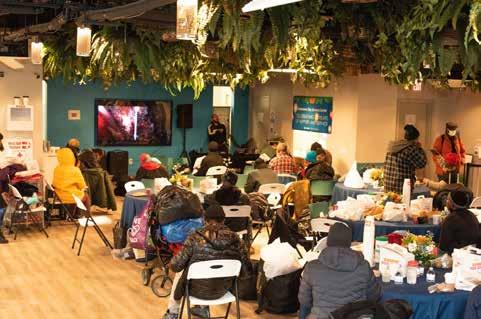
Since its founding in 1997, the DowntownDC BID has prioritized work with stakeholders, including the Metropolitan Police Department, the Metro Transit Police Department, and the U.S. Park Police to keep downtown clean and safe. Since 2016 through 2022, there has been a significant decrease in robberies, assaults, and theft. However, the last three years have shown a slight increase in reported crime.
In 2022, there were 1,394 crimes, primarily property crimes, in DowntownDC. There were 804 incidents of theft, an increase from 642 in 2021. There were 54 robberies, a 50% increase from 2021, and 34 assaults, an increase of 10%. Burglary incidents increased to 38 reported, a 65% increase. In downtown, crime increased between 2021 and 2022 by 6.3%. The BID coordinates with MPD and engages with city leaders while supporting public safety through public realm improvements and programming.
50 STATE OF DOWNTOWN 2022 DOWNTOWNDC.ORG
SINCE 2019, THE DDSC HAS PROVIDED RESOURCES TO OVER 70,000 HOMELESS INDIVIDUALS.
AT A GLANCE / MPD CRIME STATES
51 DOWNTOWNDC.ORG STATE OF DOWNTOWN 2022
DC ANNUAL CRIME INCIDENTS 25,000 CRIME BREAKOUT DOWNTOWNDC BID BY THE NUMBERS
Source: Metropolitan Police Department and DowntownDC BID 2021 2022 +10% 31 34 ROBBERY 2021 2022 +25% 642 804 THEFT ASSAULT WITH WEAPON 2021 2022 +50% 36 54 BURGLARY 2021 2022 +65% 23 38 2016 2020 2019 2018 37,118 AVERAGE 2015-2019 2015 37,187 2017 33,023 33,831 33,831 27,818 2021 34,998 28,413 27,302 2022 15,000 45,000 35,000 0 DOWNTOWNDC ANNUAL CRIME INCIDENTS 1,500 2016 2020 2019 2018 2,404 AVERAGE 2015-2019 2015 2,059 2017 1,815 1,879 2,266 1,167 2021 2,085 1,174 2022 1,000 2,500 2,000 0 1,394
AT A GLANCE / MPD CRIME STATS
THE DOWNTOWNDC BID THANKS THE FOLLOWING FOR THEIR CONTRIBUTIONS TO THIS REPORT.
AARP
Akridge
Avison Young
Carr Properties
CityCenterDC
Clyde’s Restaurant Group
CoStar Group, Inc.
Cube Libre Restaurant & Rum Bar
Cushman & Wakefield
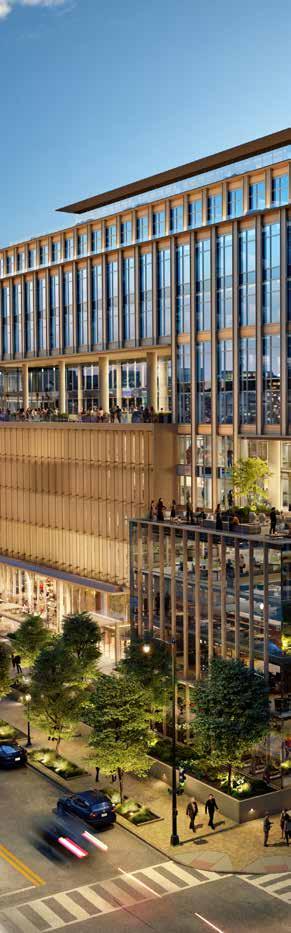
DC Office of the Chief Financial Officer
DC History Center
Delta Associates
Destination DC
District Department of Transportation
Dochter & Alexander Retail Advisors
ESRI
Events DC
Ford’s Theatre
Hines
International Spy Museum
JBG Smith
JLL
The Mayhood Company
Lincoln Property Company
Macy’s
Metropolitan Police Department of DC
Metropolitan Washington Council of Governments
Monumental Sports & Entertainment
National Building Museum
National Children’s Museum
National Gallery of Art
National Law Enforcement Museum
National Museum of Women in the Arts
National Portrait Gallery
National Theatre
Naval Heritage Center
Oxford Properties
Planet Word
Quadrangle Development Corporation
The Residences at CityCenter
Rockefeller Group
Shakespeare Theatre Company
Sixth & I Historic Synagogue
Smithsonian Institution
Stephen S. Fuller Institute
str (former Smith Travel Research)
ThinkFoodGroup
U.S. Bureau of Labor Statistics
U.S. Census Bureau
U.S. Department of Commerce, Office of Travel and Tourism Industries
U.S. General Services Administration
U.S. National Archives
U.S. National Park Service
U.S. Holocaust Memorial Museum
Warner Theatre
Washington Metropolitan Area
Transit Authority
Washington DC Economic Partnership
Woolly Mammoth Theatre
52 STATE OF DOWNTOWN 2022 DOWNTOWNDC.ORG
STAFF DOWNTOWNDC BUSINESS IMPROVEMENT DISTRICT SENIOR LEADERSHIP
Gerren Price, President & Chief Executive Officer
Nabavi Oliver, Chief Operating Officer
Ella Faulkner, Vice President Planning and Economic Development
Debra Kilpatrick Byrd, Director of Homeless Services
Rachel Hartman, DowntownDC Foundation, Executive Director
Lulu Liu, Senior Accountant
Braulio Agnese, Director of Marketing and Communications
Susan Hampton, Deputy Director of Public Space Operations
Gerry Widdicombe, Director of Economic Development
PUBLICATION STAFF
Gerry Widdicombe, Braulio Agnese, Karyn Le Blanc (KGL), Ella Faulkner, Maria Espinoza
PRODUCTION
KGL Communications
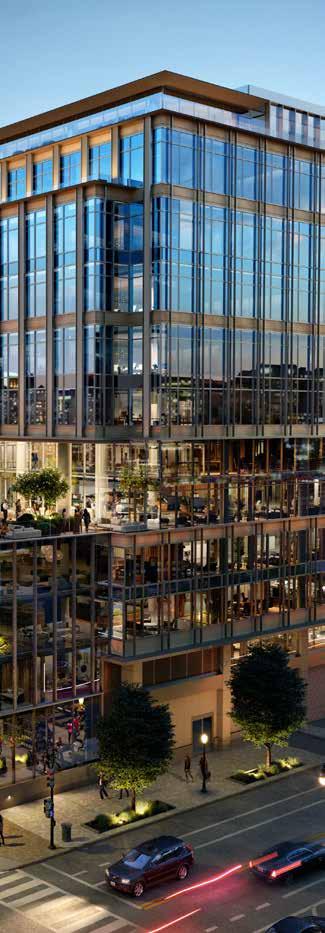
CREATIVE DIRECTION AND EDITORIAL DESIGN
DesignInDC
RESEARCH & ANALYSIS
Gerry Widdicombe, Maria Espinoza, Karyn Le Blanc (KGL), Debra Kilpatrick Byrd
PHOTOGRAPHY
DowntownDC BID, Good Matters Media, Connor Good THANK YOU FOR YOUR CONTRIBUTIONS IN 2022 AND 2023, AND YOUR CONTINUED SUPPORT IN THE FUTURE.
53
Rockefeller Group and Stonebridge broke ground June 13, 2023, on a $375 million gut renovation of the former WMATA headquarters building at 600 5th Street NW that will result in a 400,000 SF trophy office building.
54 STATE OF DOWNTOWN 2022 DOWNTOWNDC.ORG
55 DOWNTOWNDC.ORG STATE OF DOWNTOWN 2022 WWW.DOWNTOWNDC.ORG DOWNTOWN BUSINESS IMPROVEMENT DISTRICT CORPORATION 1275 K STREET NW SUITE 1000 WASHINGTON, DC 20005
