Capital One Arena is anchoring the neighborhood through 2050
Crime rates are down
First office to residential conversion completed
Downtown is a growing magnet for university satellite campuses
Tourism & visitation remain very strong
CHALLENGES & POTENTIAL
Fluctuating changes around the federal workforce & footprint
Downtown remains over-officed, with declining values posing challenges
Virginia and Maryland are outpacing District job growth and investment
Setting a new bar for
MARKET UPDATES
Downtown’s fiscal impact turns a corner, with more to do
Mixed progress on our investment & development pipeline
Employment grew on pace with region, still lags 2019
Office vacancy rates remain high
Tourism & hotels remains a key bright spot
Retail headwinds continue with green sprouts emerging
Residential demand supports top-of-market rents
Transportation grew in micromobility while weekday metro ridership lagged
Credits
About the BID
Downtown D.C. is the most diverse and exciting neighborhood in one of the most important cities in the world.
Here, locals and visitors find all the best experiences of D.C. in 140 walkable and transit-rich blocks: business, education, and government; shopping and dining; parks, art, music, sports, theater, history— and a bright future.
The DowntownDC Business Improvement District (BID) was founded in 1997 as the city’s first private nonprofit organization where property owners agree to tax themselves to fund services that enhance
people’s experiences in the neighborhood. The BID’s area includes 530 properties and is defined by Massachusetts Avenue on the north, including the Walter E. Washington Convention Center at Mount Vernon Square, to Constitution Avenue on the south, and from Louisiana Avenue on the east to 16th Street on the west.
1 .0
SQUARE MILE
530
PROPERTIES
140 BLOCK AREA
98M SQUARE FEET
→ Letter from Leadership
Mostly sunny skies, a few clouds emerge
Big things happen in Downtown D.C. all the time. And yet 2024 felt especially full of big events, both on the positive and the challenging sides of the scorecard.
As we evaluate where things went in 2024, the State of Downtown Report’s net assessment is positive—tempered by unknowns that will always be part of life in a dynamic urban environment like ours.
Our report last year was marked by uncertainty despite progress in some areas. This year, we are feeling the full energy of our pandemic comeback as the leading magnet for people wanting to have a great time in D.C.
Tourism and attendance at the Capital One Arena, museums, theaters, and BID events grew yet again, continuing the strong trends from 2023, including a spectacularly successful relaunched DowntownDC Holiday Market that welcomed more than 340,000 people over four weeks in November and December.
Universities are increasingly turning downtown office space into satellite campuses that leverage the deep thirst for education in our city and we
welcomed the first opening of an office to residential conversion.
It’s not yet the kind of critical mass we need, though, to offset the distressed office building market that still plagues us like it does other big cities. We are hopeful that these first steps toward new uses, a critical component of the Downtown Action Plan supported through a series of city investments in 2024, will continue to build through 2025 and beyond.
Another very big 2024 improvement was a noteworthy reduction in crime thanks to strategic moves thanks to initiatives by MPD and strategic actions by the D.C. Council, working hand-in-hand with the BID. Our new Penn Quarter-Chinatown Safety Team, also funded by a Downtown Action Plan-associated City grant, is a visible and proactive team of ten who’s spotting and addressing public safety issues quickly.
One card that has typically been a dependably steady player has become a wild one: the federal government is making moves that could have huge benefits for Downtown D.C. and some that put our 2024 progress in more uncertain light.
Return to office expectations could put more workers on Metro and our sidewalks, while office building dispositions and workforce reductions might change that entirely.
We continue to work closely with the mayor’s office, Council, and our federal government partners to understand what’s next and advocate for the decisions that support Downtown’s role as an economic powerhouse.
The reality is that change will always be present, asking us to be thoughtful, collegial, and optimistic advocates for the health and vitality of this neighborhood at the heart of our great city. We’re committed and we’re ready to continue making big things happen in Downtown D.C.
Michael McCarthy Chairman, Board of Directors DowntownDC BID
Gerren Price President & CEO DowntownDC BID
→ Vision & Strengths
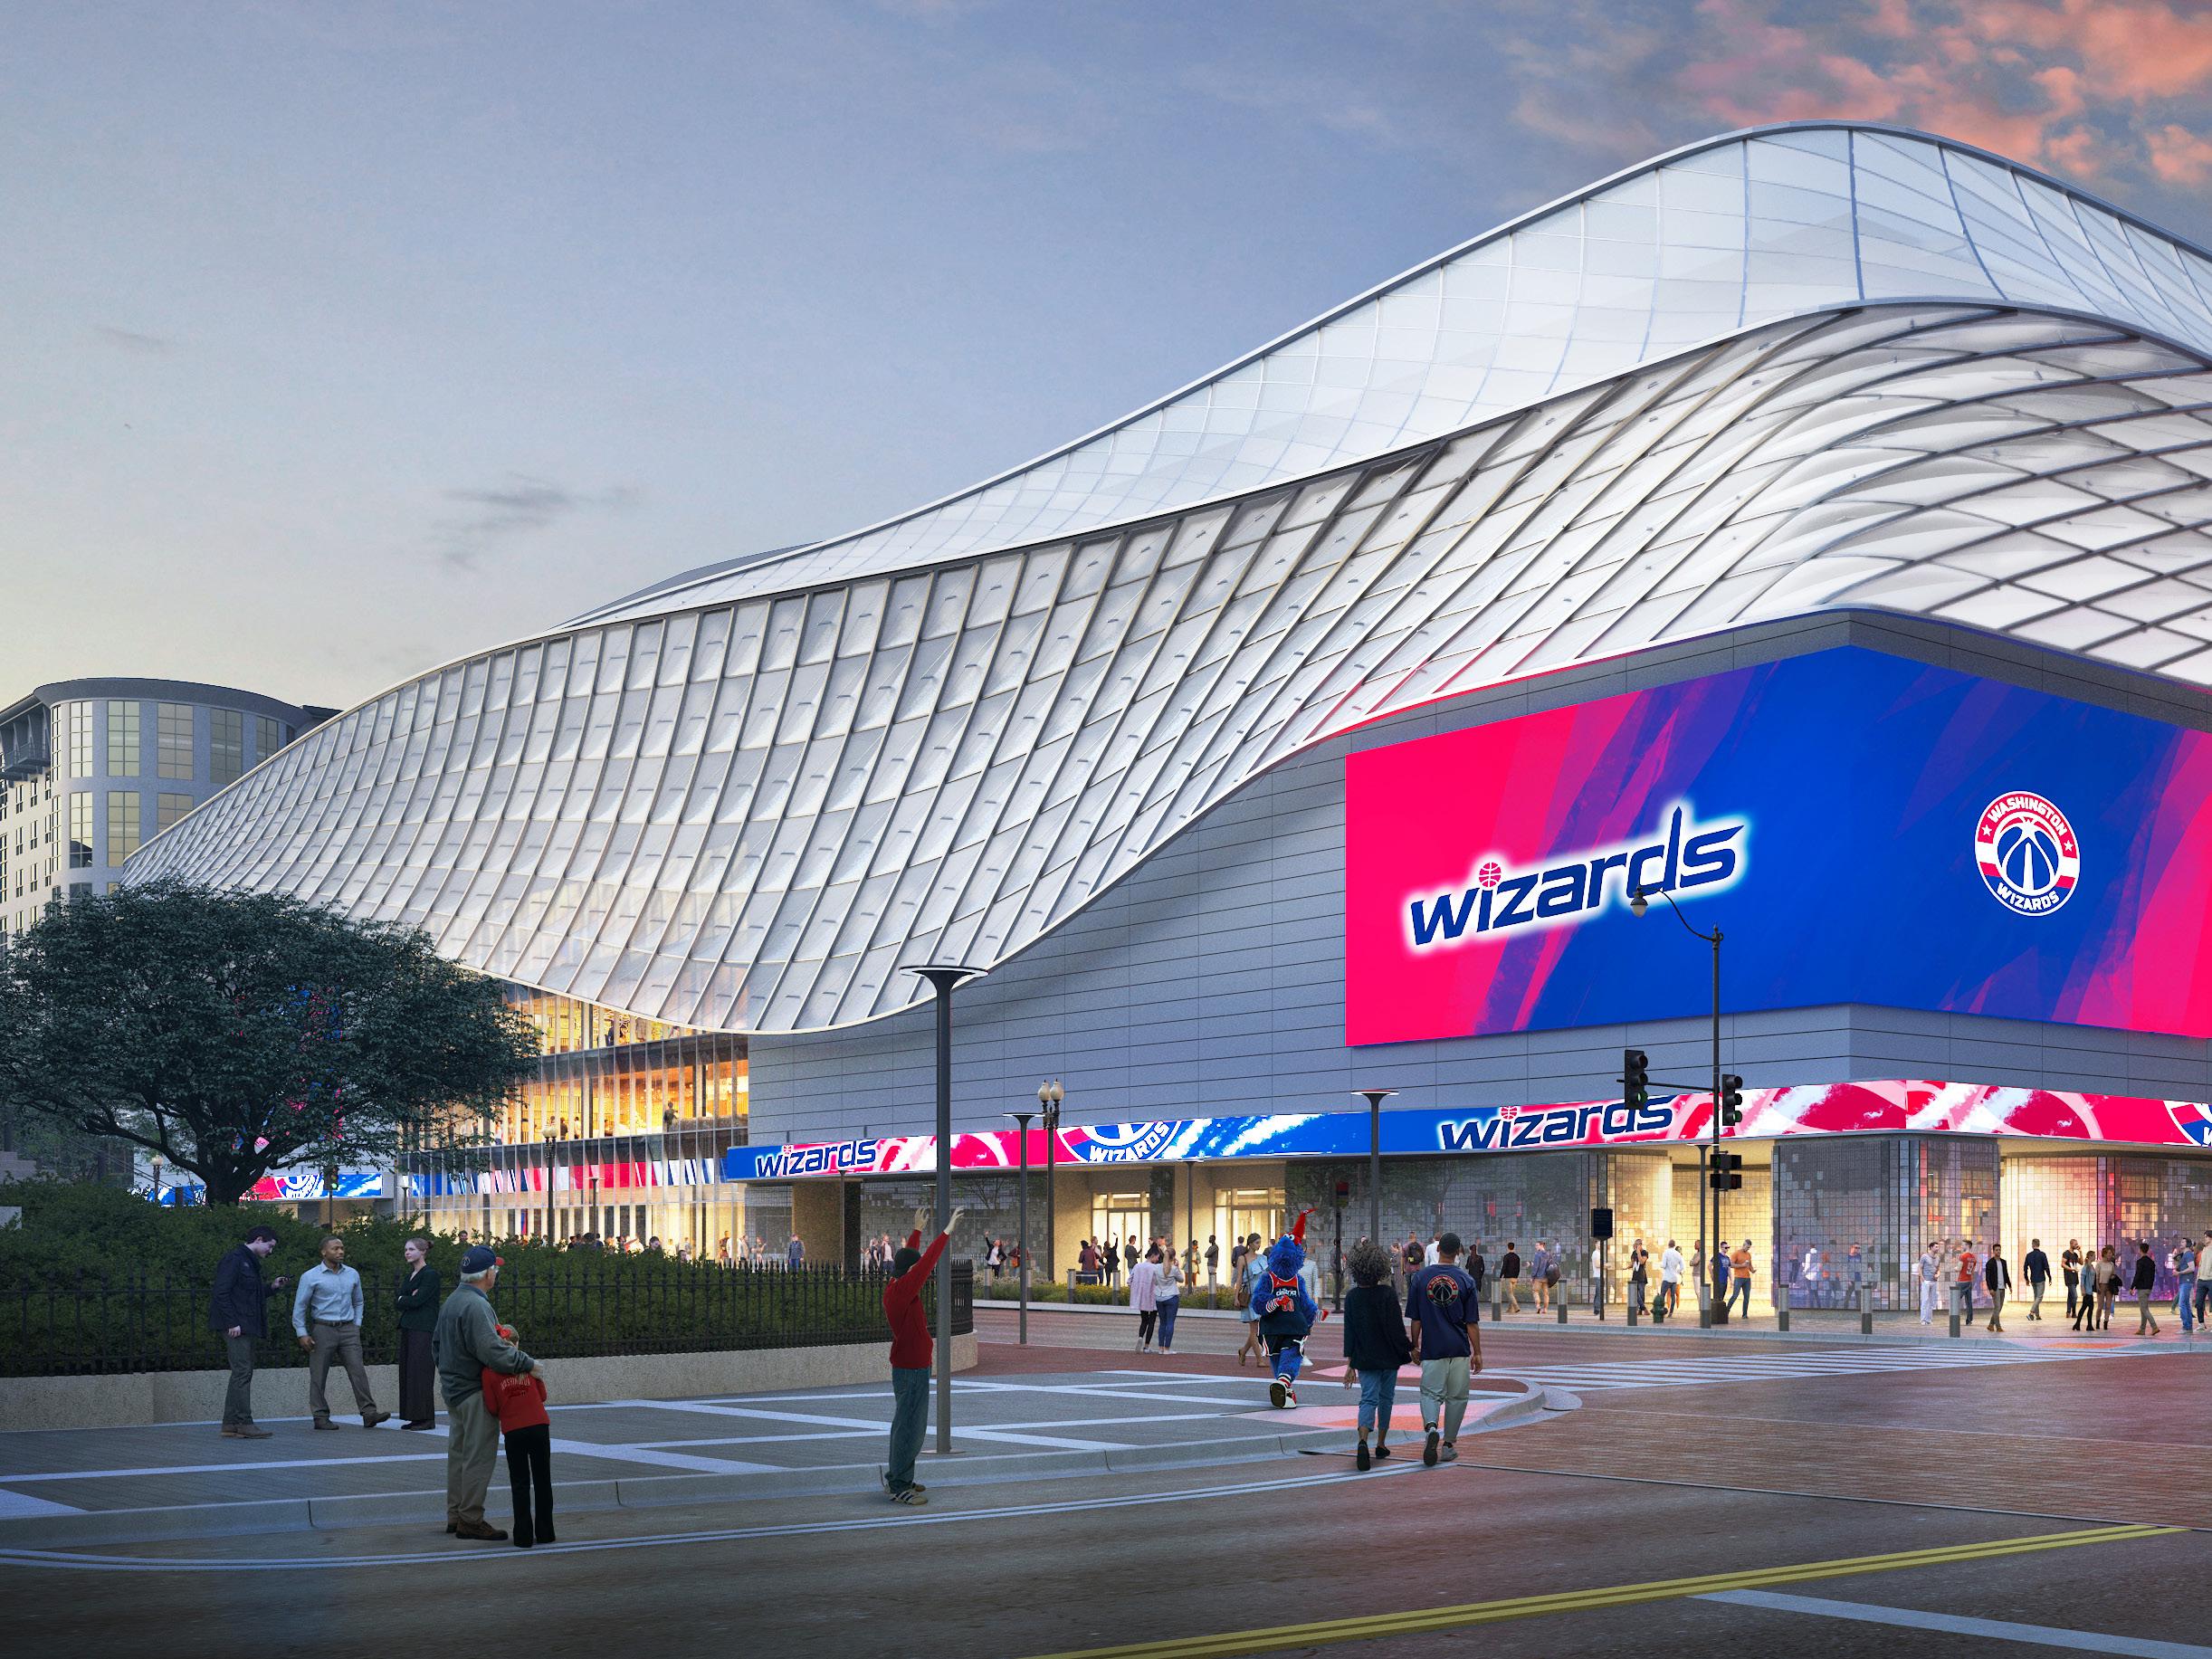
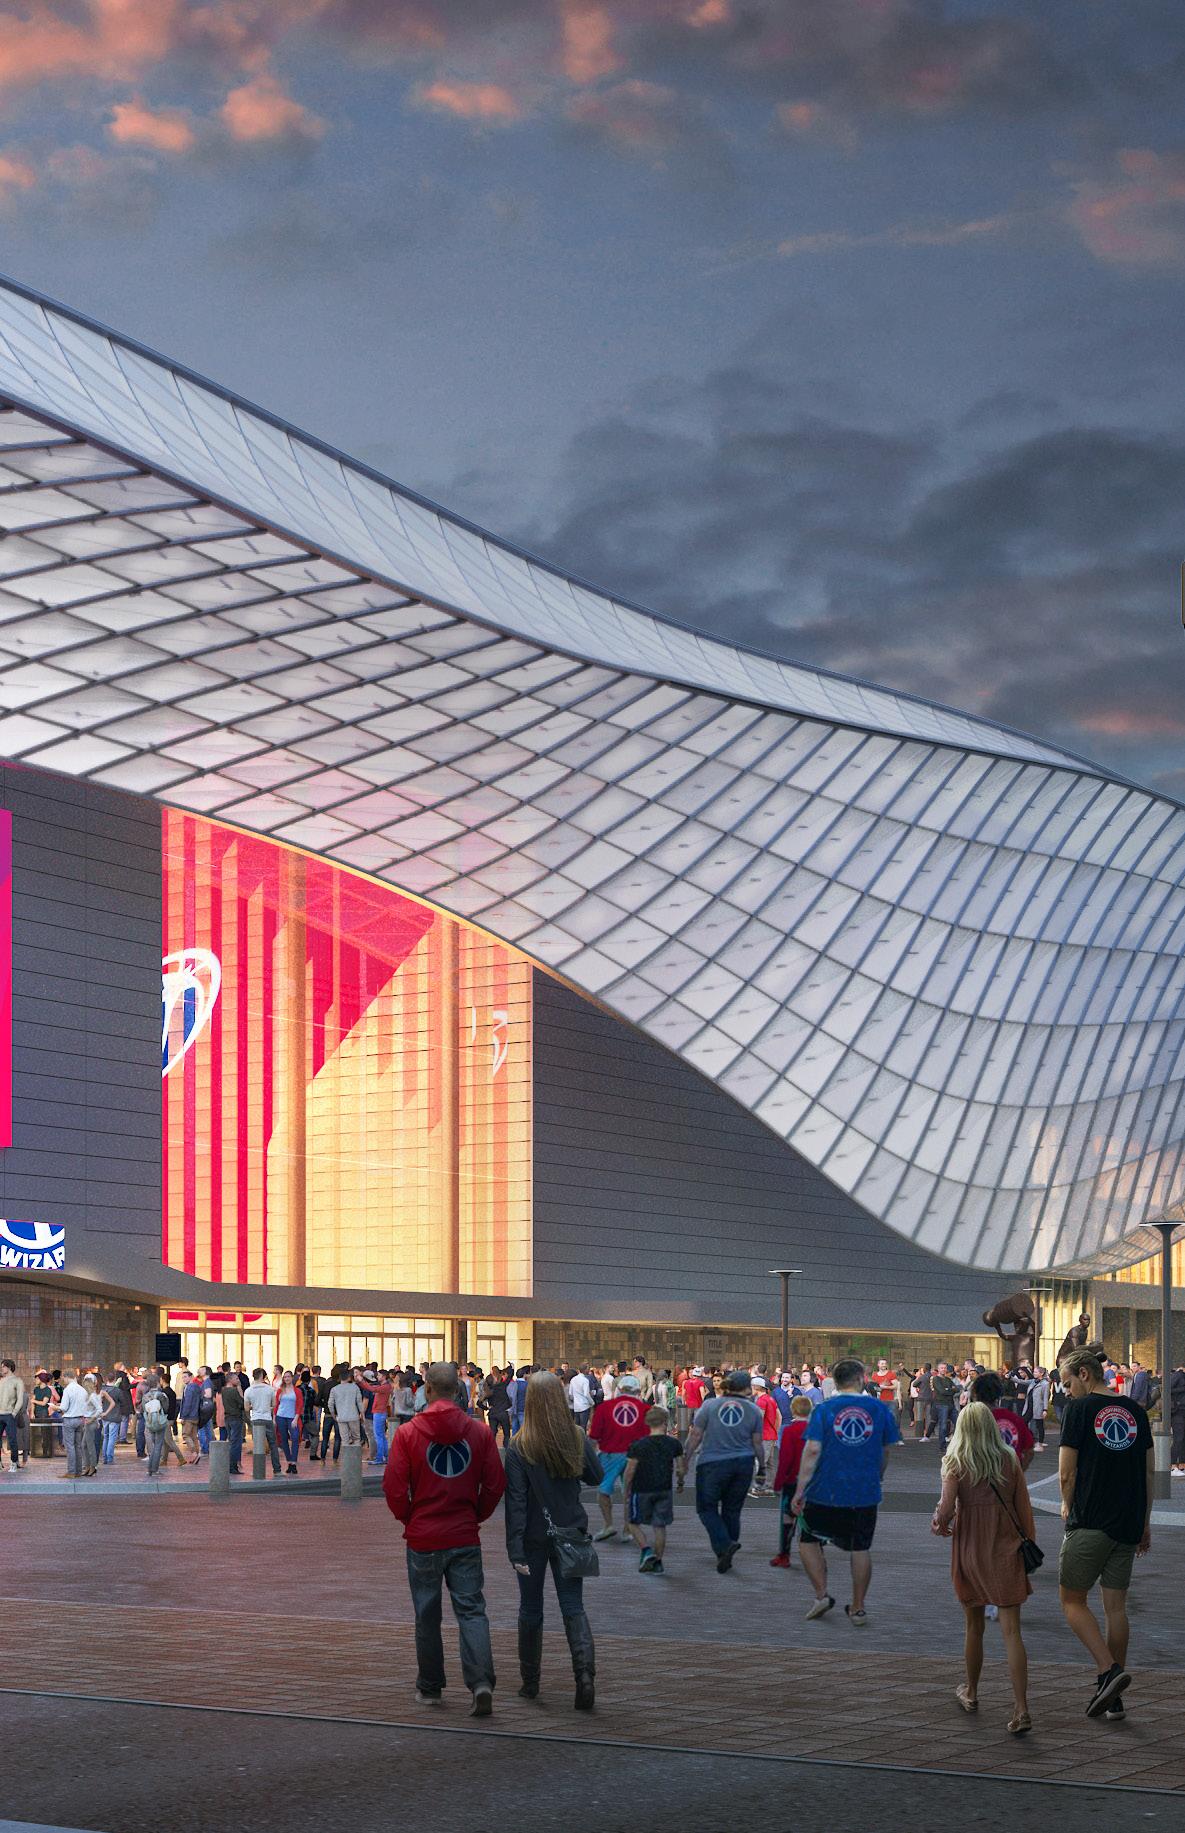
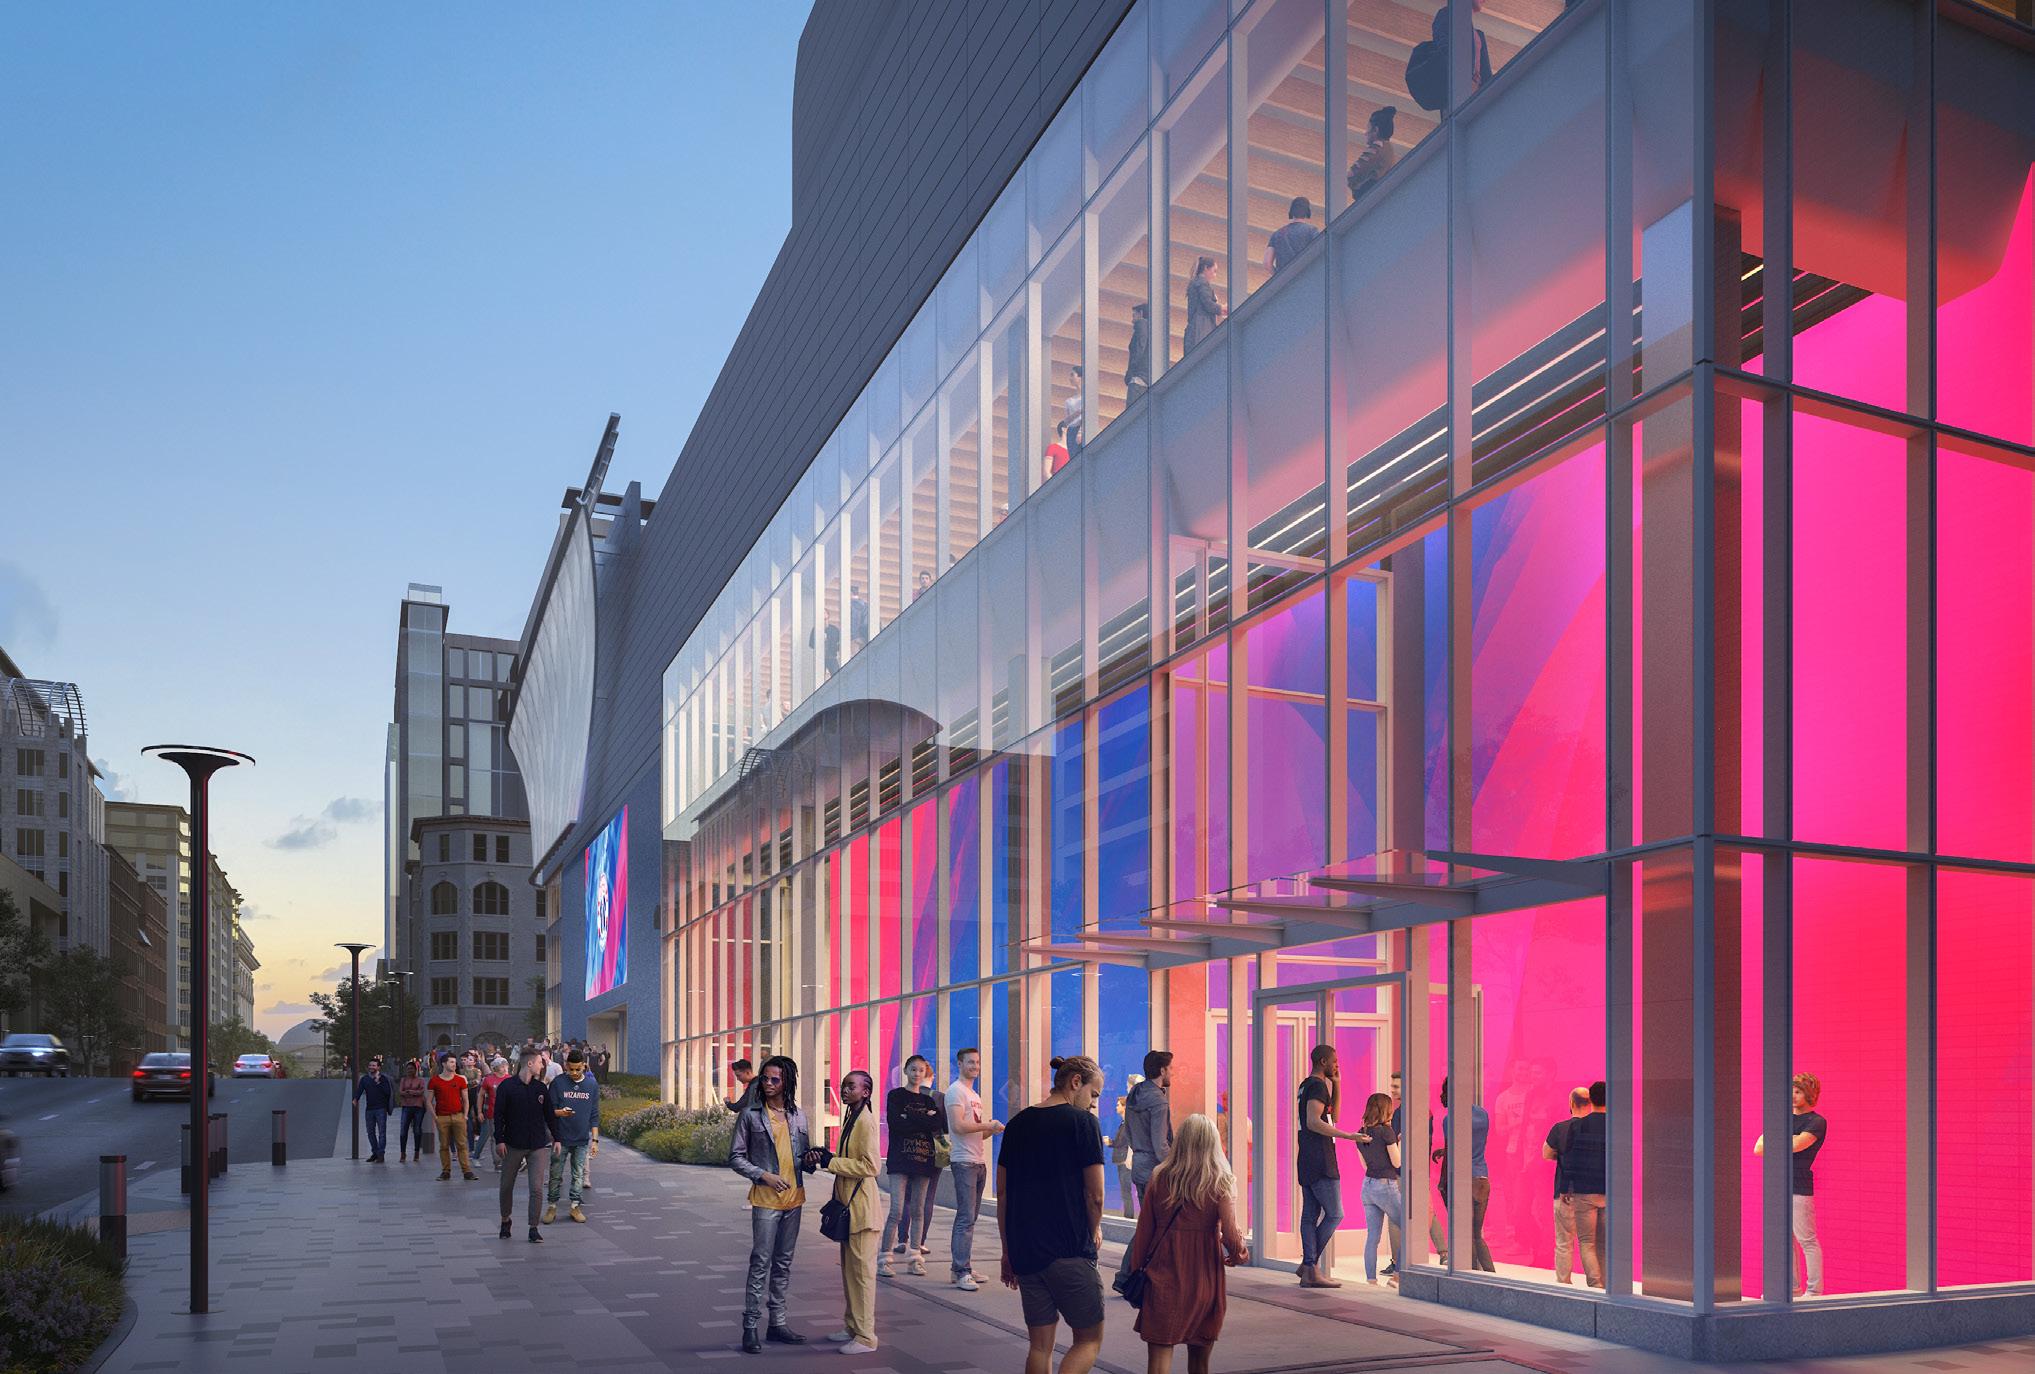
Capital One Arena
Anchoring the neighborhood through 2050, the transformation is underway
In October 2024, the D.C. government and Monumental Sports & Entertainment executed a landmark agreement to keep the Washington Capitals and Washington Wizards at Capital One Arena in Downtown D.C. through 2050.
The agreement framework, approved unanimously by the D.C. Council in April 2024, facilitates the first major renovation and modernization of the arena since its 1997 opening transformed the Gallery Place-Chinatown area into a mixed-use entertainment destination.
The renovation will bolster the connection to Gallery Place, creating a unified fan experience before and after events. The new ‘halo’ around the facade mimics the atrium of the neighboring Smithsonian building, creating an iconic new look for the area.
It’s good for our teams, it’s good for our fans, it’s good for our residents. It’s good for our entire region.”
– MURIEL BOWSER “
Source: Monumental Sports & Entertainment
→ Vision & Strengths
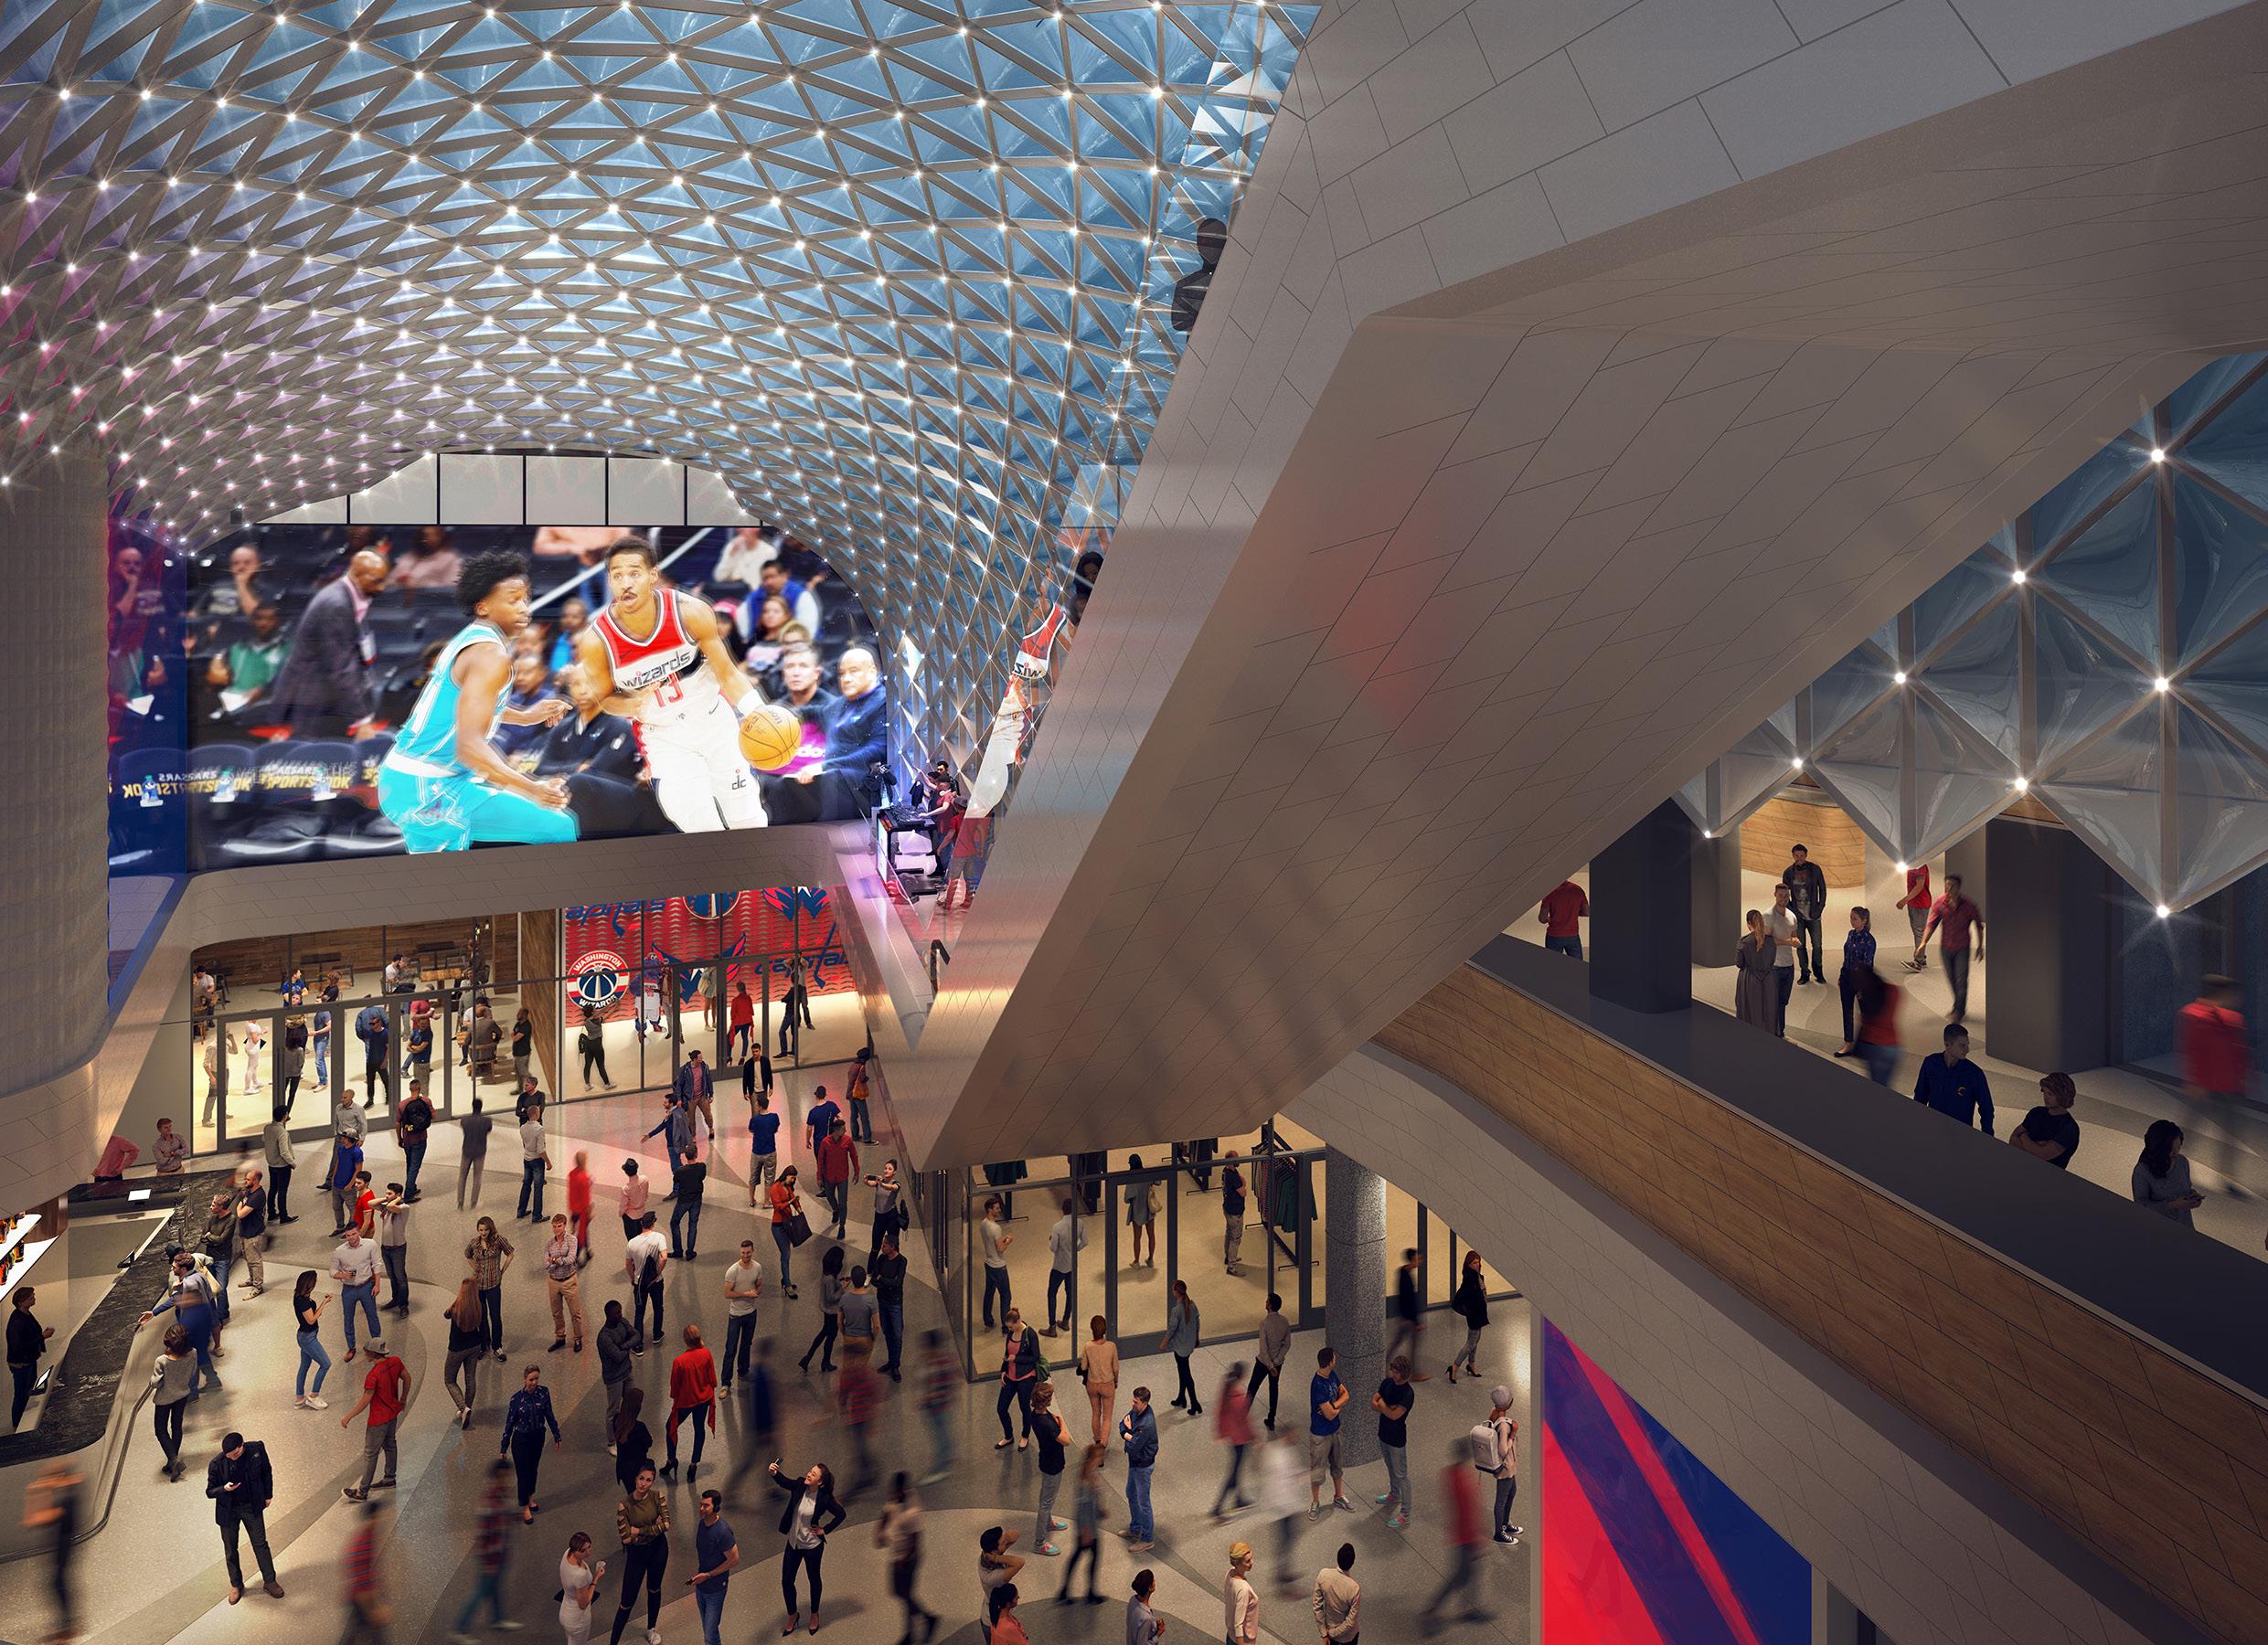
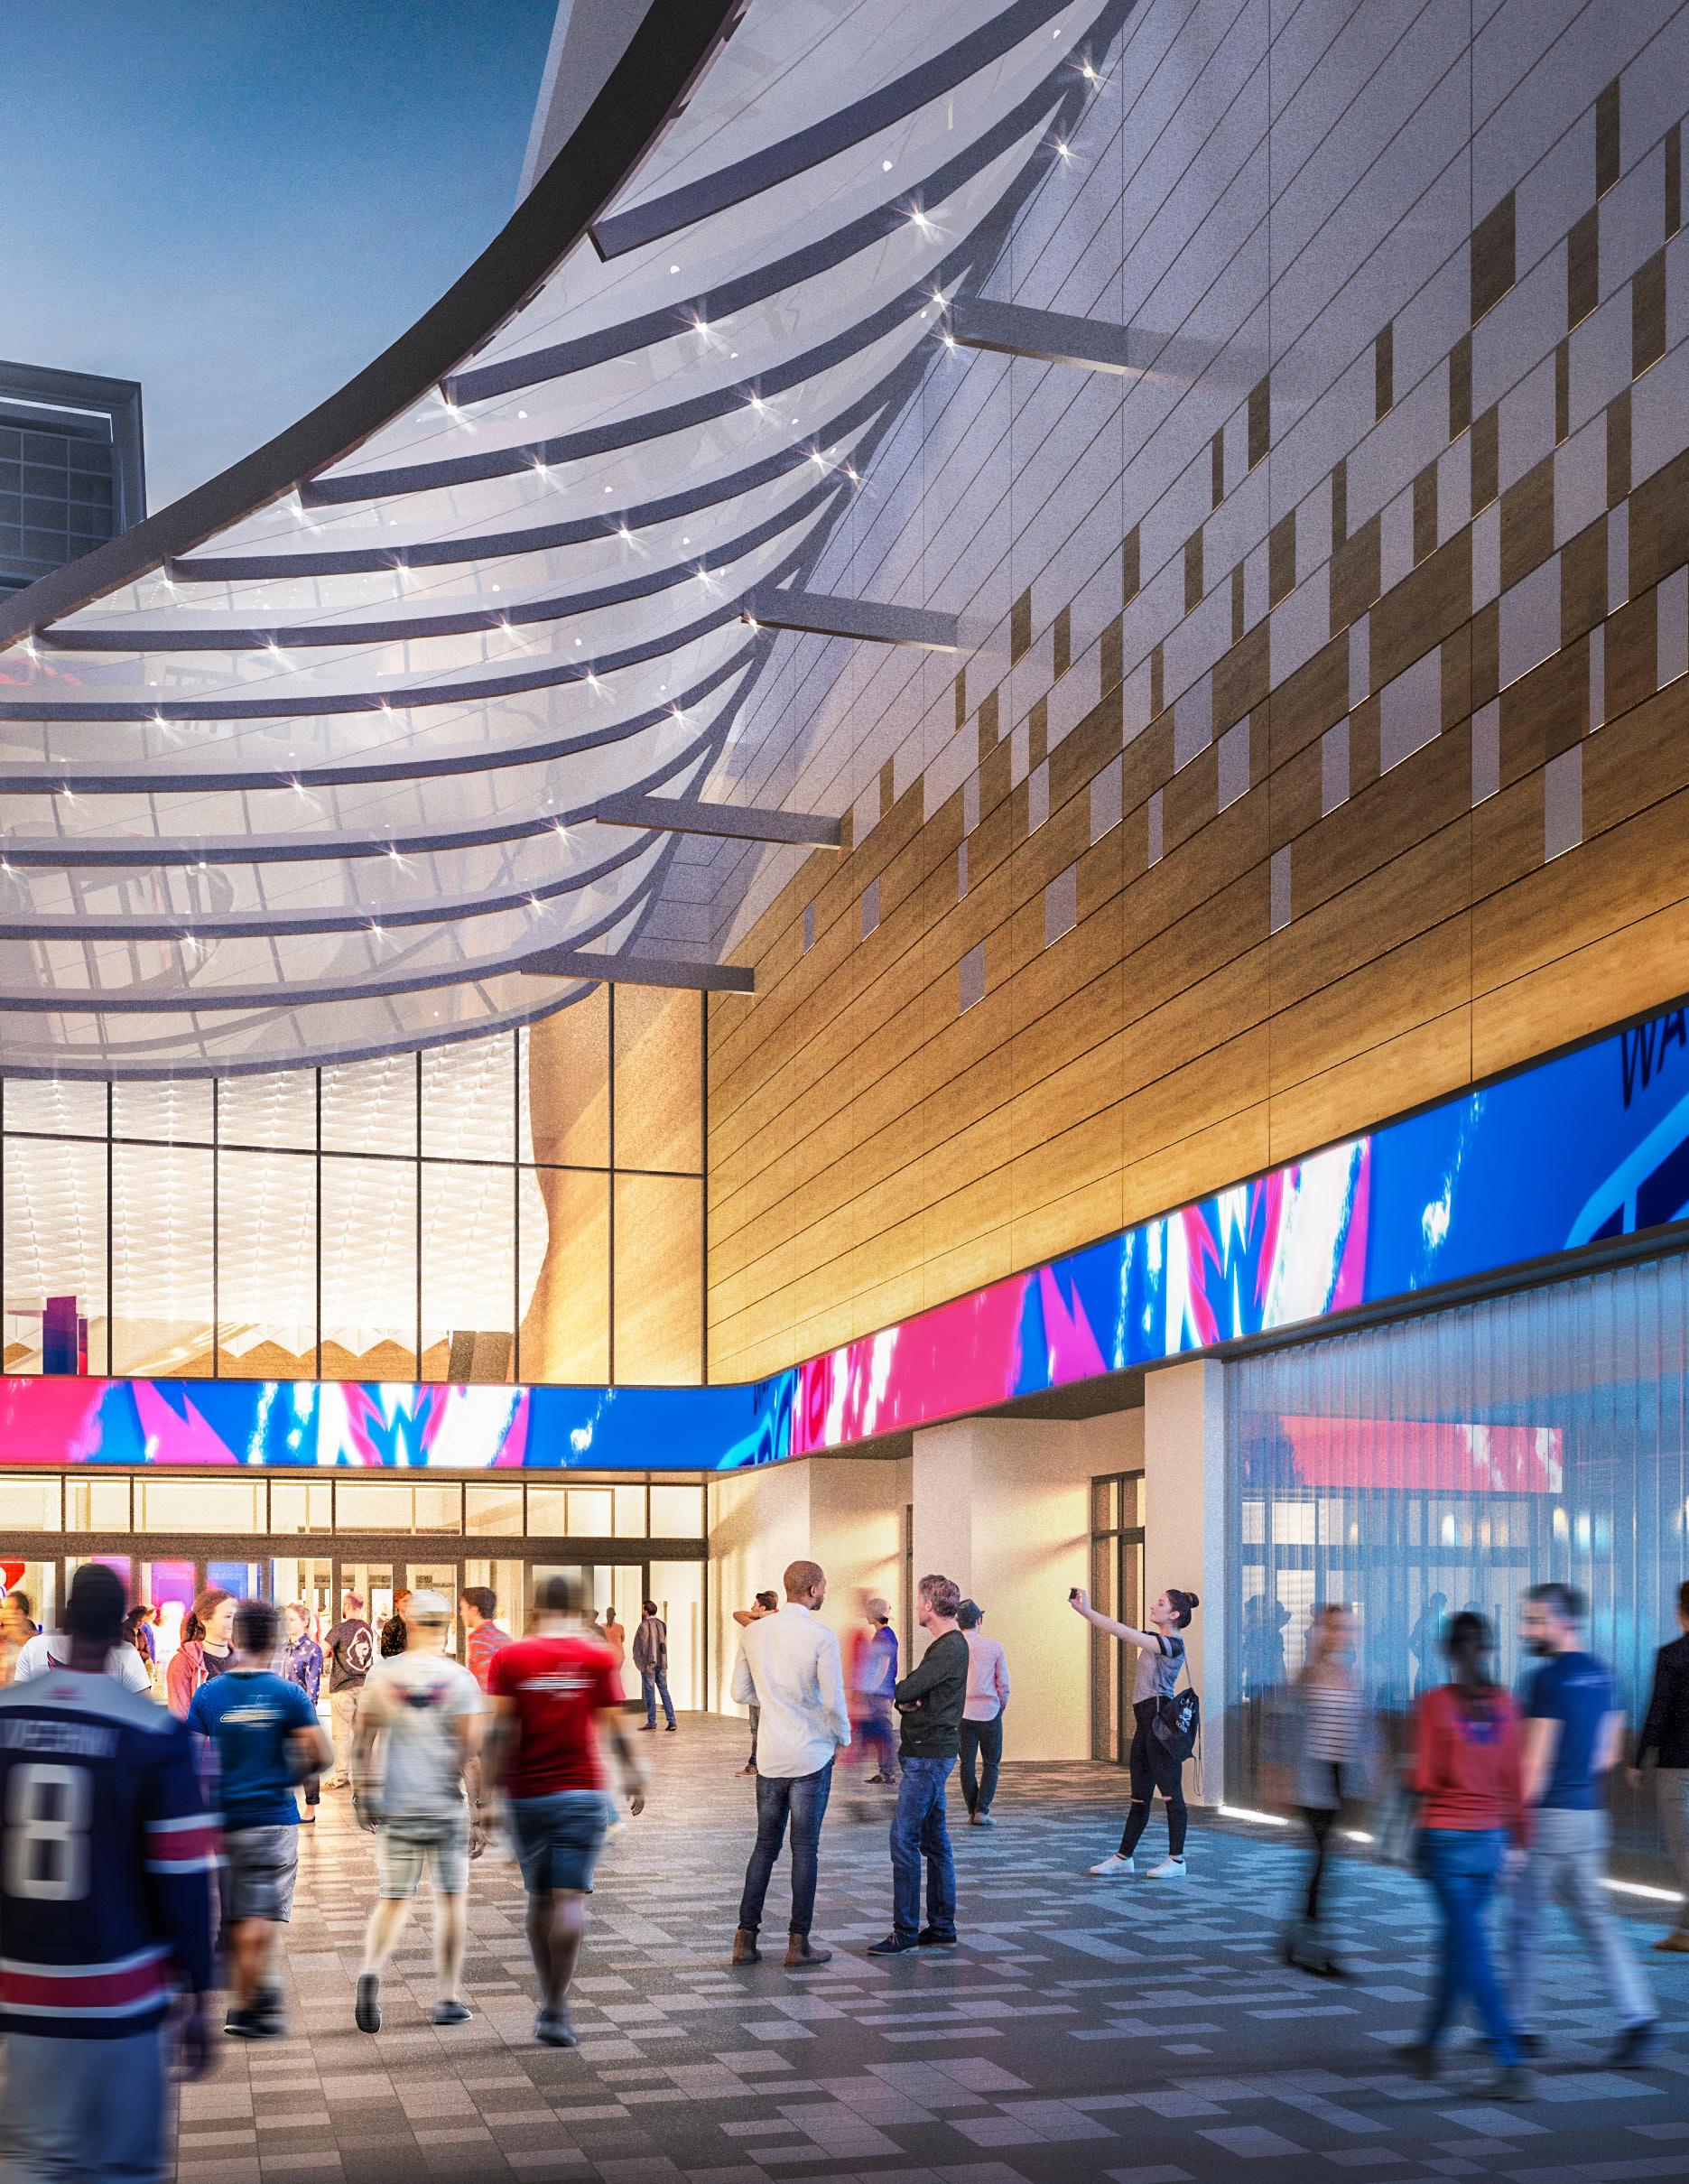
A new best-in-class arena for fans, athletes, and teams coming in 2027
+65%
MORE CONCESSION SPACE
+30%
MORE RESTROOMS
OTHER IMPROVEMENTS INCLUDE:
• Expanded entrances
• Enhanced seating options for comfort and inclusivity
• Improved training facilities and locker rooms for athletes
• New fan zones
• Upgraded digital infrastructure
• New social decks with views of the arena floor
Source: Monumental Sports & Entertainment
The $800M modernization will start construction in the summer of 2025 and include at least $285 million contributed by Monumental. The redesign will create a strikingly better experience for fans, world-class facilities for athletes, and expanded back-of-the-house capacity that improves employee and customer experience. The six phase renovation is expected to conclude by the 2027-28 sports season. The arena will be closed each summer from 2025 to 2027 but will maintain operations during NBA and NHL seasons.
→ Vision & Strengths
Public Safety
Crime rates are down, with violent crime rates falling more than 50% below pre-pandemic levels
In March 2024, the D.C. Council passed the Secure DC Omnibus legislation, specifically addressing crimes that degrade the quality of public life in our city’s commercial corridors. And in April, the BID launched the Penn QuarterChinatown Safety Team through the city’s new Safe Commercial Corridors Grant program. Throughout the year, this safety team proactively spotted and addressed public safety concerns while serving as a friendly face in the community.
These policies and investments, alongside other initiatives, contributed toward an increased sense of safety citywide, where a 32% decrease in violent crime across D.C. brought it to the lowest level in over 30 years.
Source: DowntownDC BID
Source: Metropolitan Police Department
LOWER VIOLENT CRIME INCIDENTS
Violent crime incidents in Downtown D.C. fell by 57% in 2024. There were 67 violent crime incidents in 2024, fewer than half the overall number of incidents in 2019 (159).
LOWER TOTAL CRIME INCIDENTS
After a 10% increase in total crime incidents in Downtown D.C. in 2023, total crime incidents fell by 12% in 2024.
Data Source: MPD
→ Vision & Strengths
Residential Conversions
The first office to residential conversion opened, and more than 1,700 housing units are in the pipeline
Residential conversions are key to downtown revitalization. The removal of obsolete office buildings helps shore up the office market, while simultaneously building a more resilient residential base for local businesses.
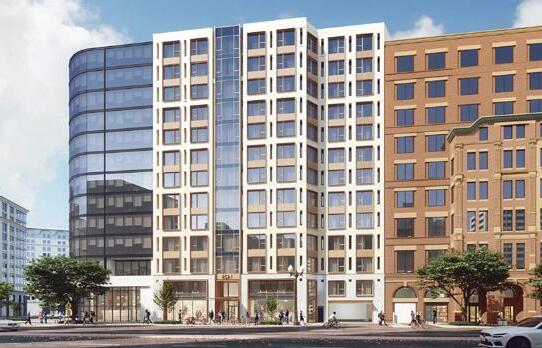
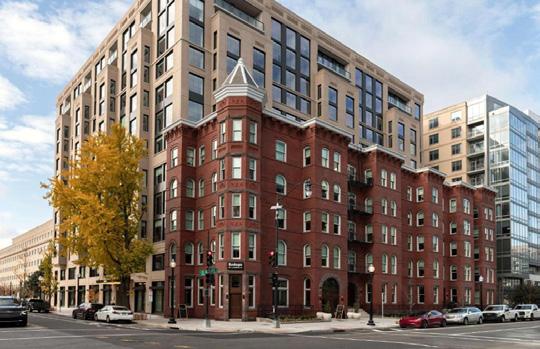
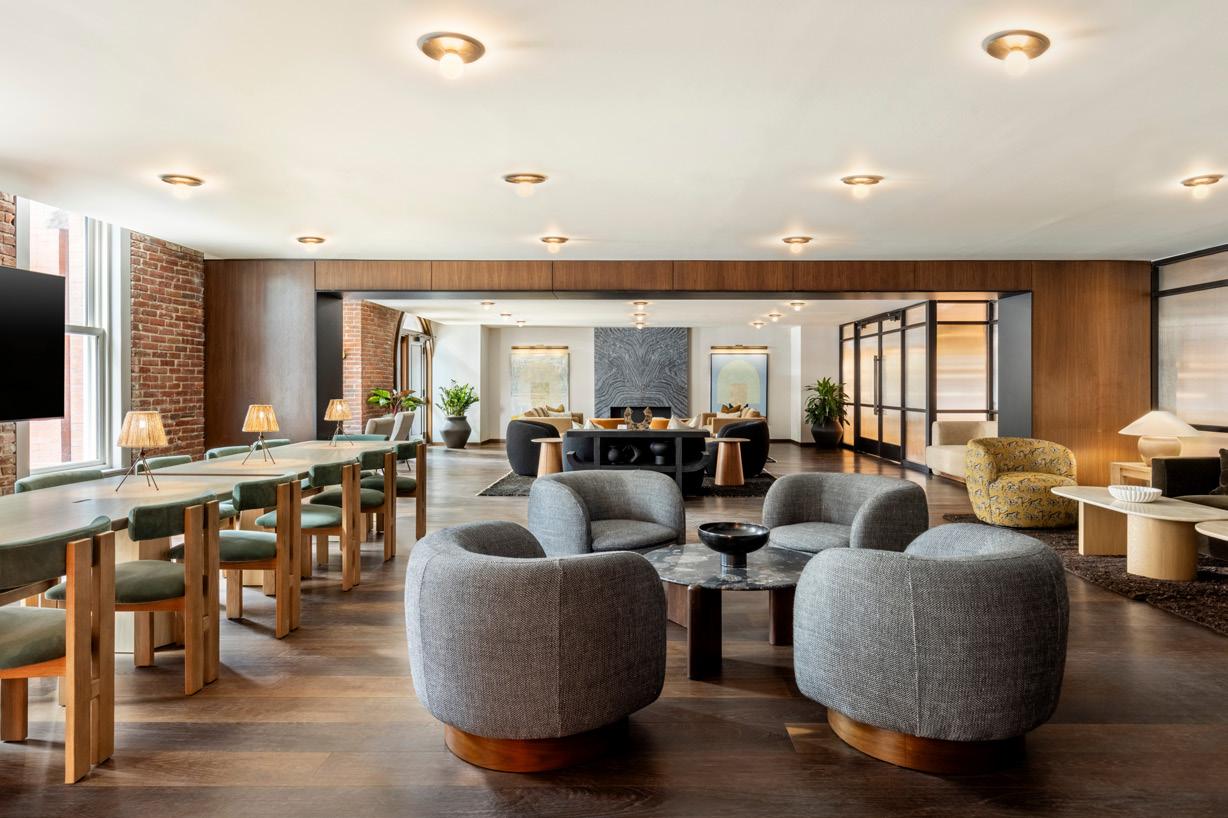
In 2024, Downtown D.C. celebrated the opening of the 222-unit Balsa at 1313 L Street NW, marking both the first
office-to-residential project Downtown and the first new apartment building in Downtown D.C. since 2013. More than 1,700 new housing units have been proposed or are under construction in Downtown D.C. These projects, along with others in the broader Downtown Action Plan area, demonstrate strong momentum for Mayor Bowser’s goal for 15,000 new residents downtown.
Source: Balsa
Source: Willow Bridge Property Company
Data Source: DowntownDC BID
Note: Data for units planned and under construction is representative of pipeline as of March 2025. Elsewhere in the Downtown Action Plan area, another 226 residential conversion units are under construction and 1,602 units have been announced.
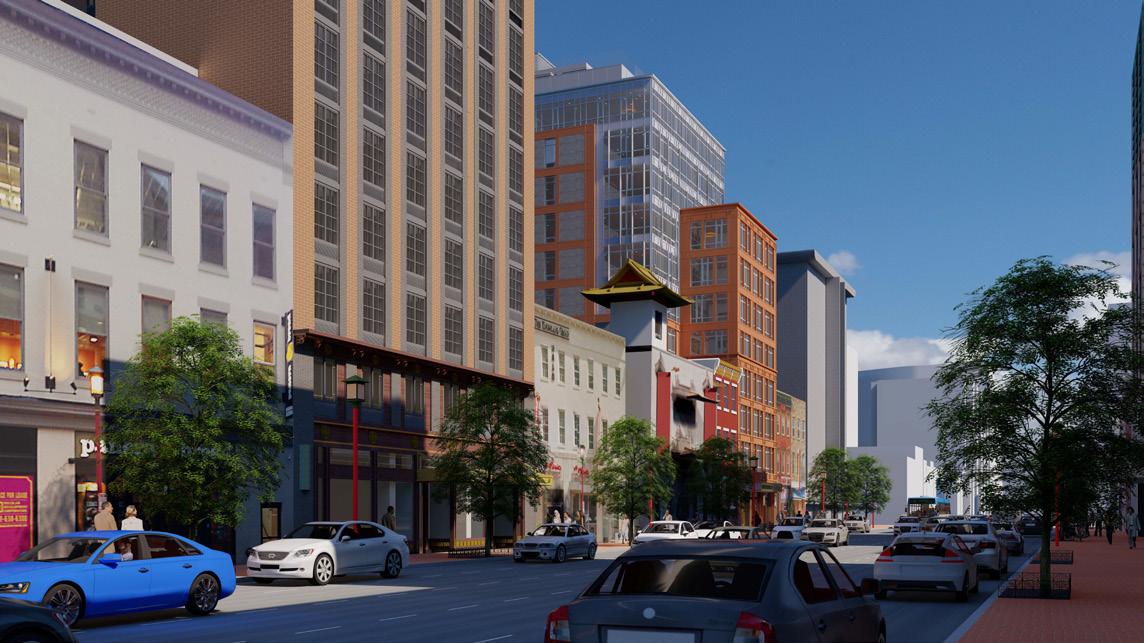
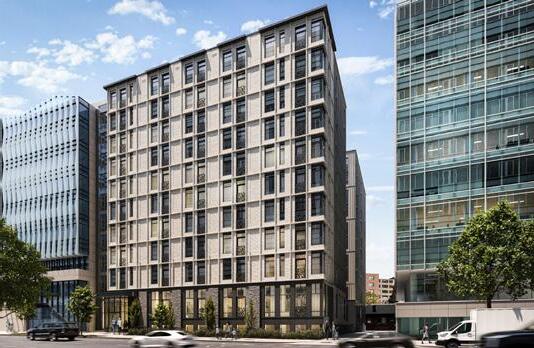
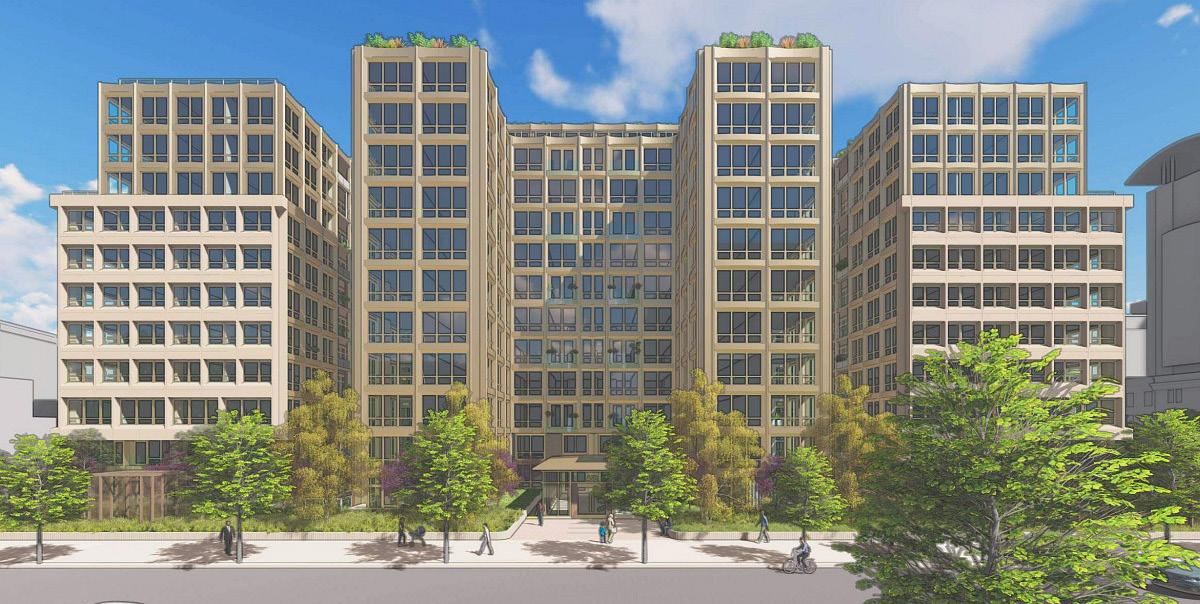
The Housing in Downtown (HID) Program launched in early 2024, offering a 20-year tax abatement for office-to-residential conversions. The HID program has already been awarded to four major office-toresidential conversions in the District. As an example, 615 H Street (right) will be redeveloped by Monument Realty into 72 residential units, including at least 8 affordable units.
Source: Monument Realty
→ Vision & Strengths
Higher Education
Downtown is a growing magnet for local universities and satellite campuses
Georgetown University opened its new home for the McCourt School of Public Policy at its Capitol Campus in Downtown D.C. University expansion in D.C. totaled nearly 400,000 SF in 2024.
The new building at 125 E. Street NW offers 150,000 SF of space, 20 classrooms, a 400-seat auditorium, and many conference rooms. The headquarters prioritizes community connection to Downtown for experiential learning opportunities and joins the Law Center, School of Continuing Studies and Capitol Applied Learning Labs at Georgetown’s Capitol Campus.
125 E. STREET NEW BUILDING OFFERINGS
SQUARE FEET OF SPACE
AUDITORIUM SEATS
Georgetown’s growing Capitol Campus, located in Downtown East, comes amidst a surge in colleges and universities expanding and establishing satellite
20 CLASSROOMS
campuses across the broader Downtown Action Plan area. More than a dozen universities, with over 5M in combined SF now call Downtown home.
Source: Georgetown University
EXISTING UNIVERSITIES with over 10,000 SF of space in Downtown D.C.
• Georgetown University Law Center
4.8M SF – 600 New Jersey Avenue NW
• Johns Hopkins University
Bloomberg Center
435,000 SF – 555 Pennsylvania Avenue NW
• New York University
75,000 SF – 1307 L Street NW
• Bay Atlantic University
29,000 SF – 1510 H Street NW
• Duke University
14,400 SF – 1201 Pennsylvania Avenue NW
OTHER 2024 EXPANSIONS in Downtown as defined in D.C.’s Downtown Action Plan
• George Washington University
161,000 SF – 2001 Pennsylvania Avenue NW
• Syracuse University
16,000 SF – 1333 New Hampshire Avenue NW
• Indiana University
59,000 SF – 1619 Massachusetts Avenue NW
• Stanford University
12,000 SF – 1128 16th Street NW
Tourism & Visitation
Strong demand continues from local, national and international visitors
Tourism and visitation to Downtown D.C. remained a bright spot in 2024, continuing to recover to near pre-pandemic levels, with significant opportunity for future growth in the years ahead.
Hotels saw revenues exceed pre-pandemic levels for the second year in a row, while visits to Downtown museums and theaters increased 15% year-over-year, just below pre-pandemic levels.
DOWNTOWN D.C.
33M
VISITORS TO NATIONAL MALL MEMORIALS
+ 2% from 2023
+ 10% from pre-pandemic 10-year average
11M
VISITORS TO NATIONAL MALL MUSEUMS
- 5% from 2023
- 49% from pre-pandemic 10-year average
2.2M
ATTENDEES AT CAPITAL ONE ARENA
+ 11% from 2023 + 25% from 2019
3.8M
ATTENDEES TO PERFORMING ARTS VENUES AND MUSEUMS DOWNTOWN
+ 15% from 2023
- 16% from 2019
In 2025, the District will host World Pride, a multi-week celebration that is expected to bring two million visitors to the city, in addition to another million attendees from the D.C. region.
Source: DowntownDC BID
→ Challenges & Potential Federal Footprint
Fluctuating changes around the federal workforce and real estate
Executive orders in early 2025 are bringing more federal workers to the office, but federal government cuts and repositioning of federal properties could have a significant impact on the region and Downtown.
Federal government employment, which has historically served as a steady economic anchor in the region, is increasingly a source of uncertainty with changes implemented by the new administration. More workers returning to the office provides a boost to Downtown
businesses, but a decline in total employment could offset those benefits.
D.C. federal employment has ranged between 190,000 to 200,000 employees over the last 10 years, spiking briefly during the pandemic and now returning to about a quarter of overall D.C. employment. In Downtown D.C., federal employment makes up an even larger share, approximately one-third of employment. So, while the net outcome of various federal initiatives for Downtown D.C. is not fully clear, any change will have an impact.
21M SQUARE FEET OF OFFICE SPACE OWNED OR LEASED BY THE FEDERAL GOVERNMENT IN DOWNTOWN D.C., 28% OF TOTAL OFFICE SPACE
66K TOTAL FEDERAL WORKERS IN DOWNTOWN D.C.
32%
FEDERAL WORKER SHARE OF TOTAL DOWNTOWN D.C. EMPLOYMENT
Note: All data on federal government office space and employment reflects status at the end of 2024.
FEDERAL SHARE OF D.C. EMPLOYMENT, 2014-2024
Data Source: Bureau of Labor Statistics
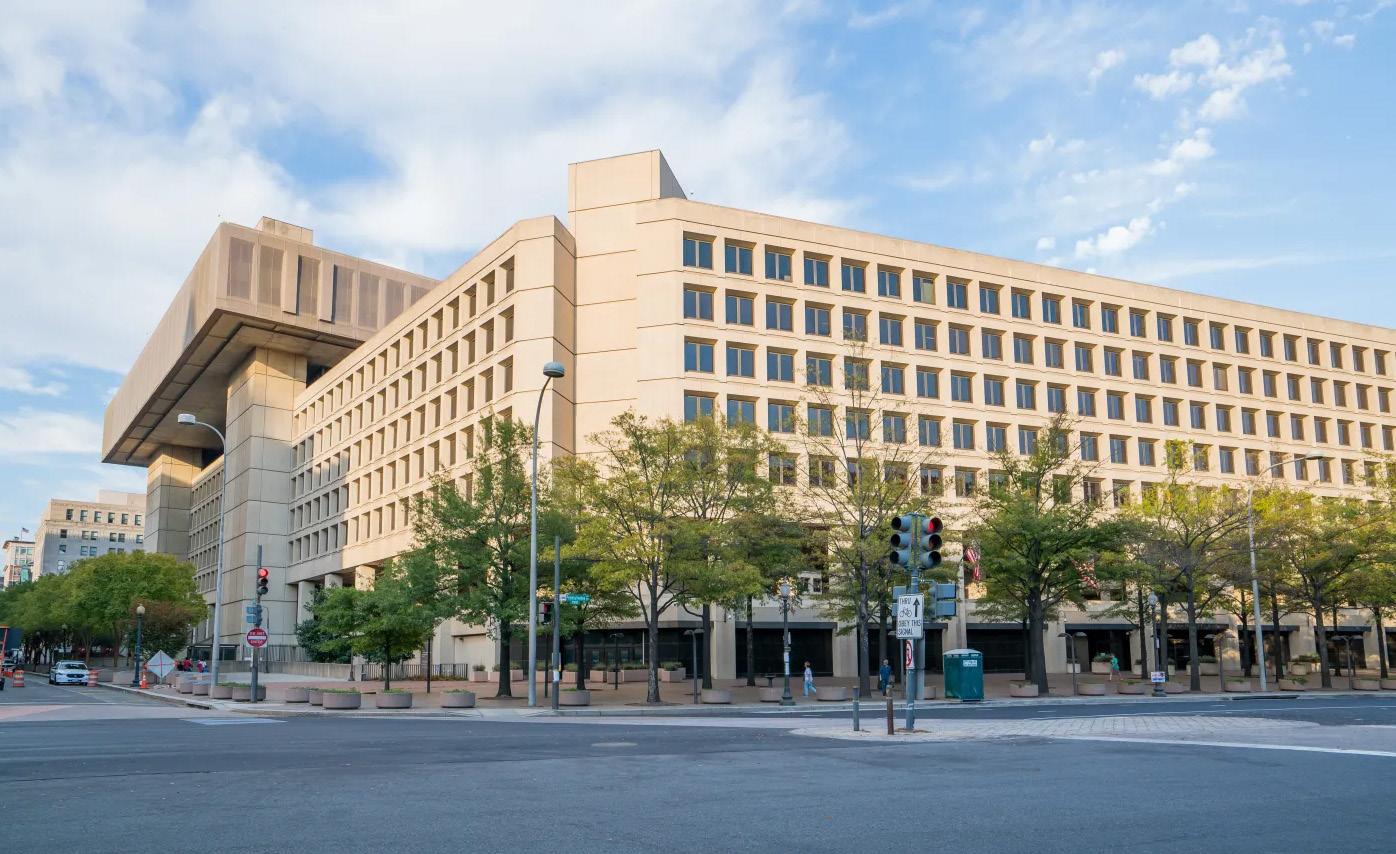
In February 2025, the DowntownDC BID participated in a Technical Assistance Panel convened by the Urban Land Institute and sponsored by the National Capital Planning Commission to assess strategies for redevelopment of the
Forrestal Building complex in Southwest as an example model for repositioning and redevelopment of federal buildings in the BID, such as the FBI HQ and Department of Labor.
Source: Fortune
→ Challenges & Potential
Excessive Office Inventory
Downtown remains over-officed, with declining values signaling challenges ahead
Across the country and in Downtown D.C., declining office values and maturing debt notes present a near-term stormy picture.
Based on recent office property sales, assessed values will continue to decline to align with market realities.
Since 2020, D.C. has had a $7 billion decline in total assessed value from large office buildings, a decrease of 12%. That decrease in values has translated to a loss of $143 million in annual property tax revenue since 2020.
2024 OFFICE SALES IN DOWNTOWN D.C. (as defined by Downtown Action Plan)
2025 Assessed Value Recent Sale Price Data Source: CoStar, Office of Tax and Revenue
DISTRICT PROGRAMS TO REDUCE VACANT OFFICE
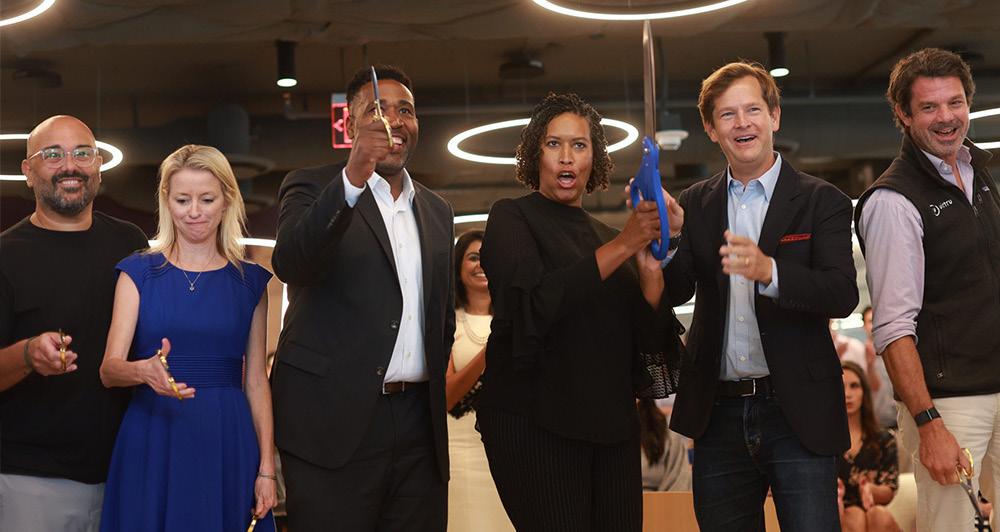
• To support existing and new office-using companies, the city launched the Vitality Fund in 2022, which has since supported six office expansions and one office relocation to Washington, D.C., resulting in 596 new jobs, 291 retained jobs, and 155,000 square feet of additional leased office space in central Washington.
• In early 2025, Mayor Bowser introduced the $19M Office to Anything Program to complement the Housing in Downtown Program and incentivize conversion of obsolete office space into commercial, hotel, entertainment, retail, and other nonresidential uses.
Source: Virtru
→ Challenges & Potential Regional Competition
Virginia and Maryland are outpacing D.C. in jobs and investment
Overall employment in D.C. is still below pre-pandemic levels and is well behind neighboring jurisdictions in postpandemic job growth. Northern Virginia has added over 83,000 jobs since 2019.
Conversely, D.C.’s total employment is nearly 28,000 jobs below 2019 levels. It is still unclear how changes to Federal employment will impact each jurisdiction.
Data Source: Bureau of Labor Statistics | Note: Not seasonally adjusted.
REGIONAL MULTIFAMILY CONSTRUCTION STARTS (housing
Data Source: CoStar
Northern Virginia also has an increasing share of new multifamily residential construction in the region. While total regional construction levels have decreased since 2019, D.C. had a significant decline in the share of new apartment and condo construction, falling from over half of construction activity in 2019 to less than a quarter in in 2024.
District government policies and investments are working to spur new jobs and development activity that support Downtown D.C. In February 2025, Mayor Bower introduced the RENTAL Act to reform a number of housing policies and processes geared toward increasing new housing development.
MULTIFAMILY CLASS A UNDER CONSTRUCTION AT YE 2024 (housing units)
Data Source: CoStar
→ Key Updates
Downtown Action Plan
Implementing policies & investments to keep Downtown moving forward
The Downtown Action Plan is helping drive progress in public safety, business growth, residential conversions, and transportation. Private investment since the release of the WHAT IS THE ACTION PLAN?
• Transformation is happening now in D.C.’s downtown and aligns with goals presented in the Downtown Action Plan, released in early 2024 by the DowntownDC and Golden Triangle BIDs in collaboration with the Federal City Council and District Government.
• Implementation of the policy and investment recommendations from the Downtown Action Plan will continue to drive new uses and economic activity, building a resilient downtown over the next decade and beyond.
plan has resulted in 385 new residential units delivered, 50 new retail businesses opened, 445 new hotel rooms constructed, and 5 university expansions.
PROGRESS HIGHLIGHTS
• Downtown has received direct investment in businesses, events, and the public realm, including:
• $6M in Vitality Fund awards
• $3.9M for placemaking, streetscape improvements and activations
• $2M in Safe Commercial Corridor Grant
• $1M for Chinatown businesses
• Downtown is emerging as a premier mixed-use destination with an increased residential base; cultural, sports, and entertainment corridors; enhanced public spaces; and a growing technology and innovation economy.
INITIATIVES UNDERWAY FOR 2025
• The Office of the Deputy Mayor for Planning and Economic Development is commencing a Downtown Transportation Study in 2025 to design a holistic transportation network maximizing economic development opportunities.
• The Bowser administration is committed to policy reform, such as updates to housing laws to support increased residential investment and development.
DOWNTOWN ACTION PLAN BOUNDARY
• Activation of public areas and formerly vacant retail spaces to enliven the neighborhood during the Capital One Arena summer shutdown for its renovations.
• Further refining a vision for Downtown East that is anchored by higher education institutions.
DOWNTOWN D.C. BID
GOLDEN TRIANGLE BID
PLAN AREA BOUNDARY
→ Key Updates
Placemaking
Setting a new bar for activations & popups
Downtown D.C. showed once again we’re the place to be for the holidays.
The DowntownDC Holiday Market returned in 2024 with more vendors, a new look, and more cheer than ever before. And just a few blocks away, the grand opening of the National Mistletoe,
a stunning 10-foot-wide art sculpture, took place at Anthem Row.
In another first, the National Building Museum hosted the DowntownDC Holiday Skate Spectacular, a new synthetic ice rink featuring day and nighttime themed skating activities during the holiday season.
100+
VENDORS at the DowntownDC Holiday Market, in partnership with one of the nation’s leading market operators, The Makers Show.
11K
AVERAGE DAILY VISITS across the 31-day holiday market, compared to 7,000 for the 2023 event. The busiest day had almost 30,000 visitors.
$7.6M
TOTAL SPENDING at the holiday market
$8.4M
ESTIMATED ADDITIONAL SPENDING elsewhere in Downtown D.C. from holiday market visitors.
DOWNTOWNDC HOLIDAY MARKET AVERAGE DAILY VISITS
Data Source: DowntownDC BID
Source: DowntownDC BID
→ Market Updates
Downtown Fiscal Impact
Tax revenue generated in Downtown D.C. continues to be a major driver for D.C.’s tax base but remains far below FY 2019 levels
As a net contributor to the City’s budget, the decline in tax revenues emphasizes the importance of supporting and investing in a strong Downtown.
Increasingly, properties are being sold significantly out of step with their assessed value, with D.C. CFO Glen Lee projecting that in FY 2025 the District will collect up
to $300 million less in commercial property taxes annually than it did in FY 2021.
If Downtown D.C. was achieving its pre-pandemic level of tax revenues, its additional fiscal impact would nearly offset the $325 million budget gap D.C. is facing for FY 2026, based on the February 2025 revenue estimates.
$645M
PROJECTED NET FISCAL IMPACT of Downtown D.C. in FY 2025
–$310M
CHANGE IN NET FISCAL IMPACT since FY 2019, largely driven by declines in office and retail property values
12.9% OF CITY REVENUES
Downtown D.C. is a net economic contributor to the City, driving 12.9% of City revenues
6.3% OF CITY EXPENDITURES
Downtown D.C. is responsible for 6.3% of City expenditures, less than half of the share of the City’s revenue that it generates.
DOWNTOWN D.C.’S NET FISCAL IMPACT (in millions, FY 2025 dollars)
DOWNTOWN D.C.’S NET FISCAL IMPACT AS A % OF DC
Data Source: RCLCO; Bureau of Labor Statistics; Office of the Chief Financial Officer
Note: Estimated local fund revenues for FY 2025 are based on data available as of March 2025, including the February 2025 revised revenue estimates from the Office of the Chief Financial Advisor (CFO).
→ Market Updates
DEVELOPMENT & INVESTMENT PIPELINE
1,828
OFFICE-TO-RESIDENTIAL UNITS IN THE PIPELINE ELSEWHERE IN THE DOWNTOWN ACTION PLAN AREA
1313 L Street NW 222 Units, Completed 2024 UNDER CONSTRUCTION
1425 New York Ave NW 243 Units, Complete 2025 UNDER CONSTRUCTION
1125 15th Street NW 264 Units, Complete 2025/26
615 H Street NW 72 Units, Complete 2026
600 5th Street NW 400K SF, Complete 2026
1201 L Street NW 145 Units, Complete TBD 600 E Street NW 400 Units, Complete TBD 620 I Street NW 95 Units, Complete TBD 450 5th Street
(120 F
→ Market Updates
Employment
Job gains continued a slow and steady pace, especially in the knowledge sector
Downtown D.C. added 2,200 jobs in 2024, growing for the fourth straight year and gaining in key knowledge economy sectors.
• Downtown D.C. Employment: Employment in the BID grew 1% in 2024 up to almost 204,000 jobs, capturing a large share of D.C. growth. Retail, food service, and accommodation jobs drove about a quarter of this growth, but jobs in these sectors are still far below 2019 levels. Downtown D.C. added nearly 900 jobs in 2024 in the “knowledge economy”, including professional services and education-related jobs, a major focus of the Downtown Action Plan and the District’s larger economic development strategy.
• D.C. Employment: D.C. overall employment grew by almost 3,000 jobs in 2024, but remains below pre-pandemic levels. The unemployment rate was up slightly to 5.2% in 2024. Federal employment accounted for 25% of all jobs, compared to one-third of Downtown D.C. jobs, both of which are largely consistent with historical averages.
+5,000
KNOWLEDGE ECONOMY JOBS, 2019-2024
Downtown D.C. has added about 5,000 jobs in the knowledge economy since 2019, including nearly 900 in 2024.
–5,200
RETAIL, FOOD SERVICE & ACCOMODATION JOBS, 2019-2024
While these sectors saw some growth in Downtown D.C. in 2024, they are still well below 2019 levels.
DOWNTOWN D.C. EMPLOYMENT
D.C. REGIONAL EMPLOYMENT (in thousands)
Data Source: JobsEQ; Bureau of Labor Statistics | Note: Not seasonally adjusted.
→ Market Updates
Office Vacancy rates remain high, with ‘Class B’ buildings suffering most
The Downtown D.C. office market continued to experience significant challenges in 2024, reaching a record vacancy rate of 22%.
Downtown D.C. has over 11 million SF of vacant office space. Net absorption in Downtown D.C. continued to be negative in 2024, a worrying trend considering that the rest of D.C. experienced positive net absorption for the first time since 2019.
• Federal Government Impacts:
Downtown D.C. had a slight increase of in-person workers in 2024 and this will likely increase with the Return to Office
Source: BXP
federal government mandate. Though, the net impacts of federal employment changes in 2025 remain unclear.
• Growing Sales:
Office investment sales volume in Downtown D.C. grew in 2024, with D.C. capturing a larger share of the region’s sales volume. Sales prices in the Downtown Action Plan area in 2024 averaged 44% of assessed values.
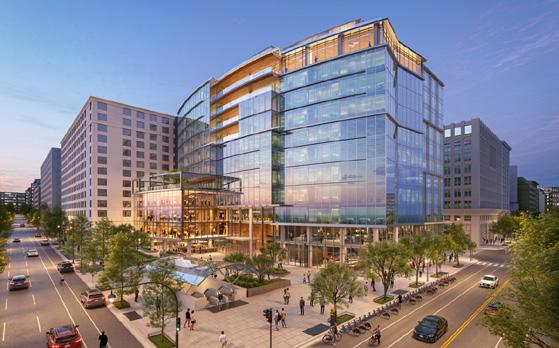
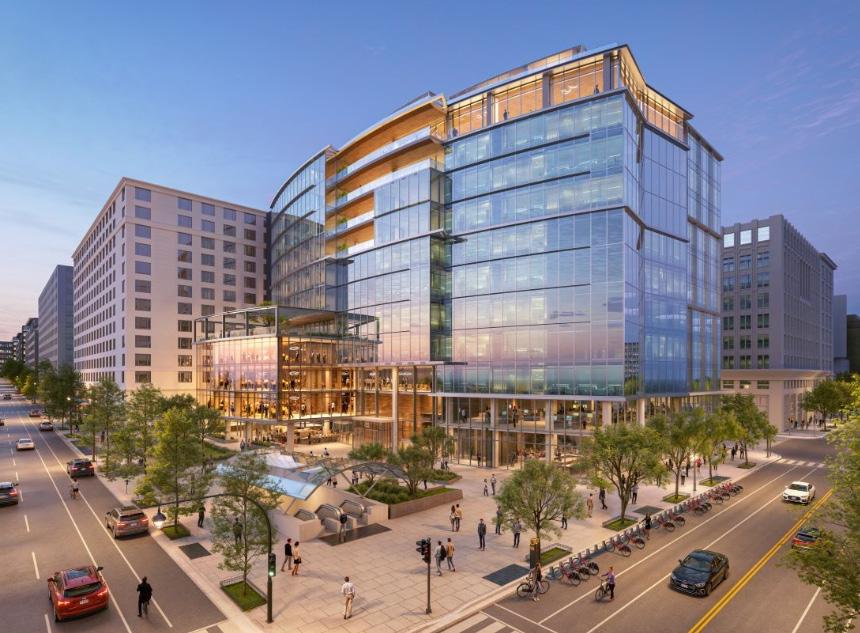
• Trophy Office:
Trophy office in D.C. had a vacancy rate of just under 12% at the end of 2024, significantly lower than the rest of the office market.
Trophy office space is a bright spot in an otherwise challenging market. In early 2025, BXP announced it would build 320,000 SF of new trophy office space at 725 12th Street, with McDermott Will & Emery as an anchor tenant occupying 150,000 SF of space. While new office construction activity is promising, trophy market opportunities are likely limited to select projects.
DOWNTOWN D.C. OFFICE SPACE VACANCY RATE (by building class)
REGIONAL OFFICE VACANCY RATES, 2023-2024
SF of vacant space added in 2024
Data Source: CoStar | Note: Data is for office buildings over 20,000 SF that are not owner occupied.
0 DELIVERIES
Downtown D.C. had no new office deliveries in 2024, compared to a historical average of over 500,000 SF per year from 2010-2019.
2 PIPELINE BUILDINGS
The former Washington Metropolitan Area Transit Authority headquarters is still under construction, the only office space under construction in D.C.
+700K
SF VACANT OFFICE SPACE
Office vacancies are still increasing, but at a slower rate. Downtown D.C. had nearly 700,000 SF more vacant office space in 2024, reaching 22% vacancy.
Reston Downtown D.C. Rest of D.C.
Tysons RosslynBallston
→ Market Updates
A significant increase in Downtown D.C. office sales volume in 2024, which surpassed 2019 levels, is encouraging. Lower prices may be perceived by purchasers as a phenomenal value opportunity in the long-term.
After low sales volume across the entire region in 2023, D.C., Suburban Maryland and Northern Virginia rebounded in 2024. D.C.’s share of sales volume in the region also increased in 2024 by 11 percentage points to 36%.
3.4M
SQUARE FEET OFFICE SALES VOLUME IN DOWNTOWN D.C.
compared to just 600,000 SF of sales in 2023 and 2.6M SF in 2019.
52%
D.C. OFFICE SALES VOLUME CAPTURED BY DOWNTOWN D.C.
Downtown D.C.’s share of office sales volume in D.C. has fluctuated from 14% to 36% since 2019.
REGIONAL OFFICE SALES VOLUME (in millions of square feet)
45%
OFFICE ACTIVITY COMPARED TO PRE-PANDEMIC LEVELS
This upward trend is poised to continue with the new administration’s in-person work mandates. The rest of D.C. averaged 50% activity in 2024.
While Downtown’s return-to-office rates continue to slowly increase, the impacts of federal government changes remain uncertain. The swift actions of the new administration portend negative fluctuations in the federal government’s office-using space Downtown in 2025 and beyond. At the end of 2024, the federal government owned about 23% of office space in Downtown D.C. and leased another 5%.
DOWNTOWN D.C. RETURN TO OFFICE ATTENDANCE
Data Source: Kastle Note: Data represents office activity as a percentage of February 2020 activity.
D.C.
Data Source: CoStar, General Services Administration
Tourism & Hotels
Hospitality remained a key bright spot in the post-pandemic narrative
D.C. tourism and convention performance has largely stabilized, and the Downtown D.C. hotel market continued its growth above pre-pandemic levels.
• Downtown D.C. culture & entertainment anchors continued growth, with room for more: Visitation to Downtown D.C. culture and entertainment destinations has recovered at varying rates compared to 2019, with Capital One Arena attendance up 25%, theater and performing arts attendance about the same, and museum attendance still down 19%.
DELIVERIES & PIPELINE
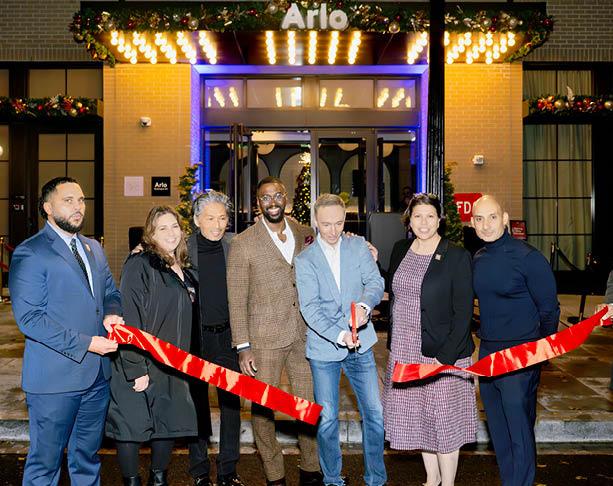
• Arlo Hotel’s opening (right) at 333 G Street NW in December 2024 increased the total number of hotel rooms Downtown by 445.
• The Mint House (1010 Vermont Avenue), a hotel conversion , is under construction with 85 rooms and is anticipated to deliver in Spring 2025.
• Convention business stable: Convention center attendance appears to be reaching a stabilized level of around 700,000 annual attendees in the postpandemic environment, which is two thirds of pre-pandemic levels.
• Mall and memorial visits up, museums slowed: Visitors to National Mall memorials continue to increase, while museum visitor recovery has slowed.
• Hotels stay strong: The hotel market generated revenues above pre-pandemic levels, maintained healthy occupancy, and celebrated the delivery of 445 new rooms in 2024.
Source: Arlo Hotel
33 MILLION MEMORIAL VISITORS
Memorials on the National Mall brought nearly 33 million visitors in 2024, increasing by about 600,000 since 2023 and showing continued improvement over 2010-2019 levels.
11 MILLION MUSEUM VISITORS
Museum attendance along the Mall experienced a small drop in 2024 and remains well below average pre-pandemic attendance.
Data Source: National Park Service; Smithsonian Institution
DOWNTOWN
D.C. CULTURE & ENTERTAINMENT
VENUES
2.2M
CAPITAL ONE ARENA ATTENDEES
Capital One Arena attendance grew 11% in 2024, comfortably surpassing 2019 levels.
700K
DOWNTOWN D.C. THEATER AND PERFORMING ARTS ATTENDEES
Theater and performing arts in Downtown D.C. had a strong 2024, growing attendance by 24% and meeting 2019 levels.
3.1M
MUSEUM ATTENDEES
Downtown D.C. museum attendance increased 11% from 2023 activity but is still below pre-pandemic levels.
Data Source: Monumental Sports & Entertainment; individual museums and performing arts venues
→ Market Updates
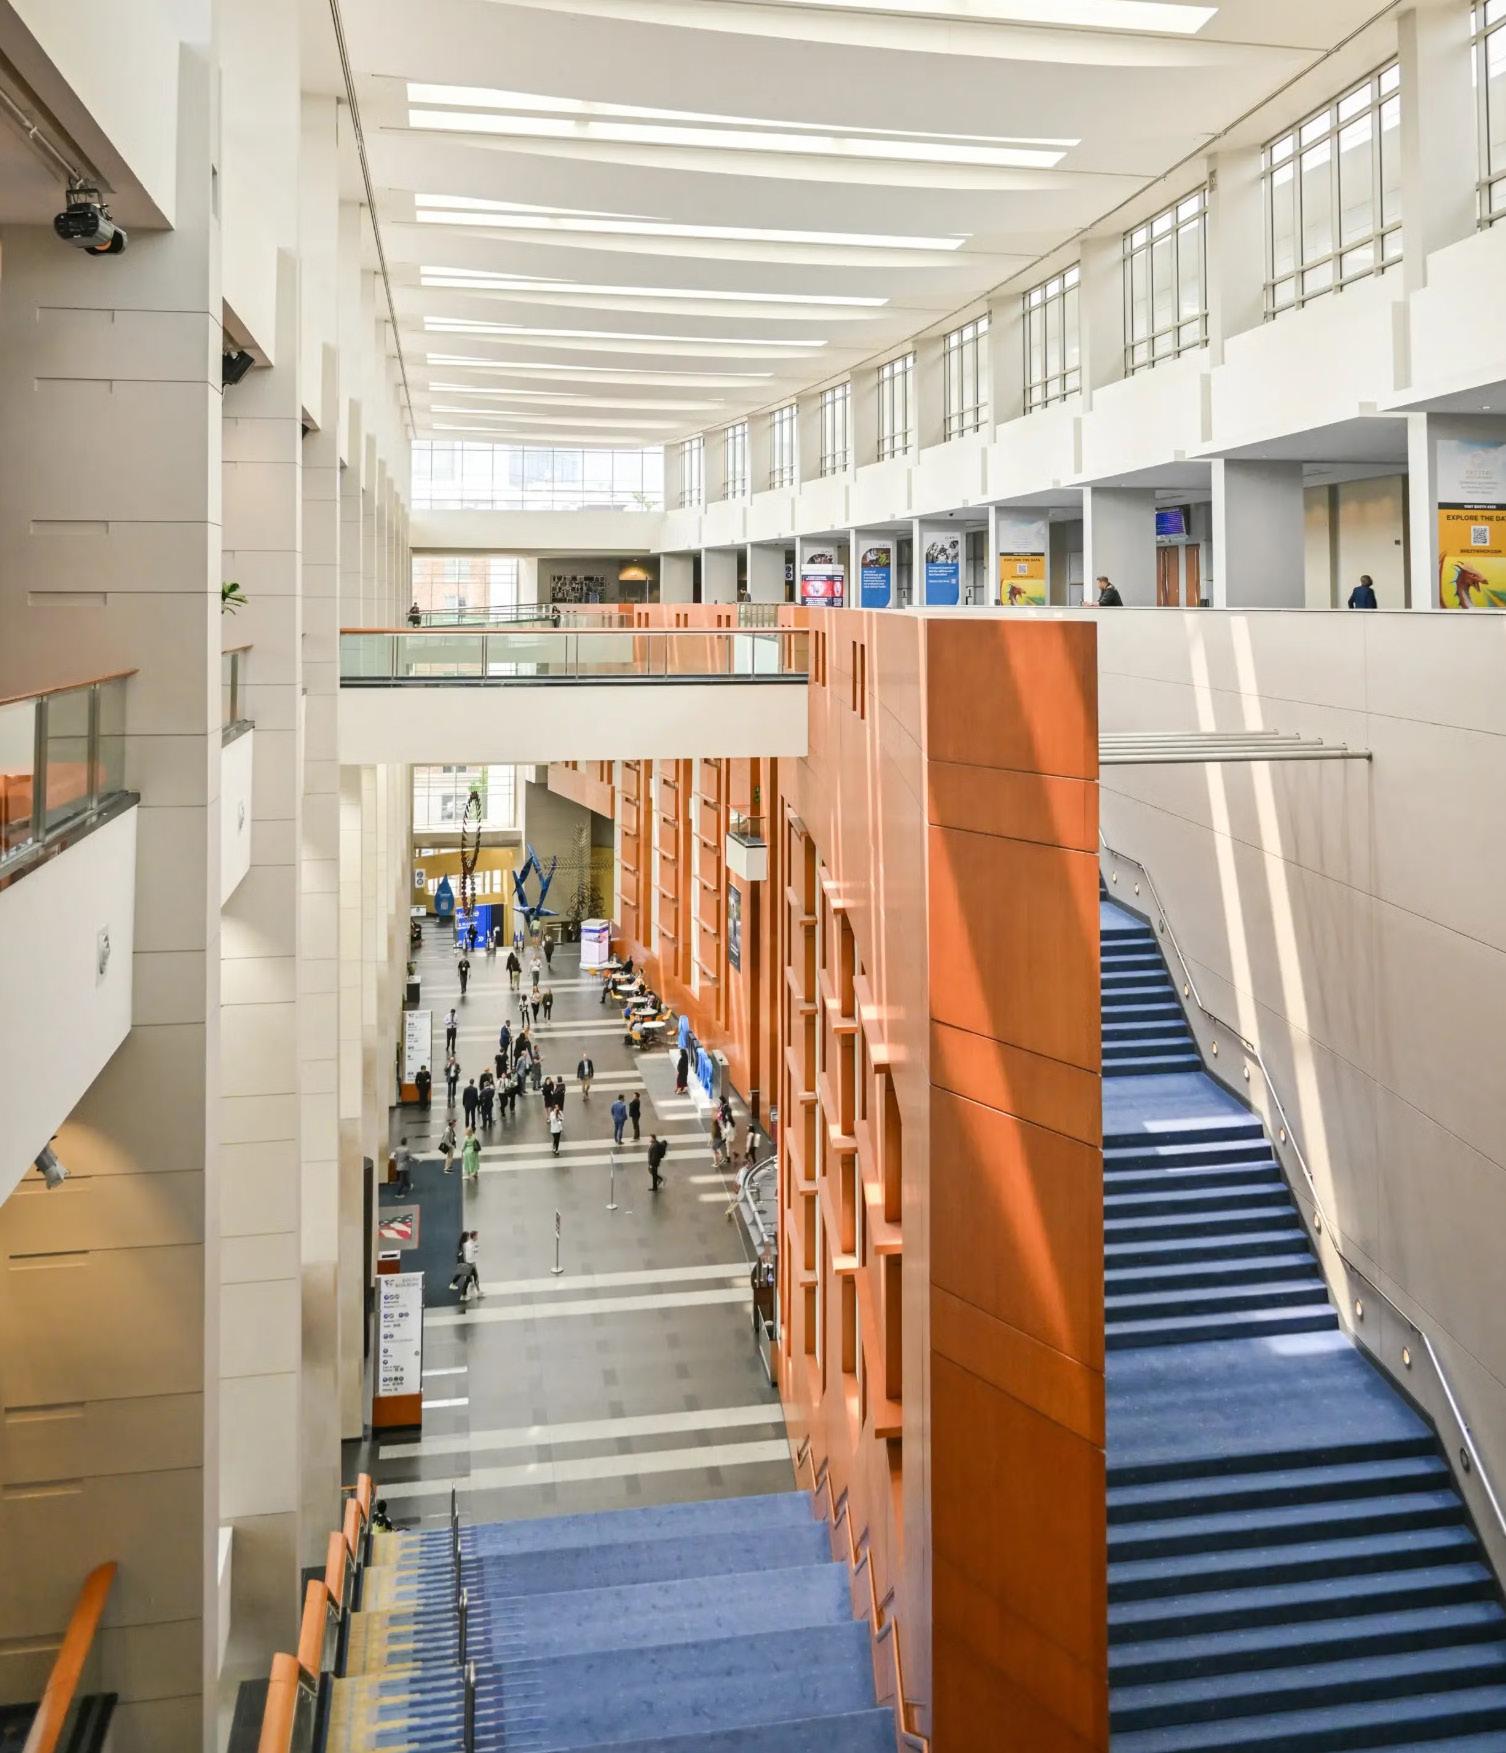
CONVENTION CENTER ATTENDEES
Convention center attendance was down 3.5% in 2024 to 693,000. While convention and exhibition business has somewhat rebounded since the pandemic, some larger weekend shows have not returned. Events DC projects 2025 attendance will be 700,000, but federal changes could impact attendance at major scientific, educational and medical conferences.
Source: Events DC
Data Source: Events DC
WALTER E. WASHINGTON CONVENTION CENTER ATTENDANCE
DOWNTOWN D.C. HOTEL REVENUES & OCCUPANCY ( compared to pre-pandemic) ABOVE 2019 BELOW 2019
Hotel revenues fully recovered from the pandemic in 2023 and continued to grow in 2024. Although occupancy rates are slightly below pre-pandemic levels, Downtown D.C. hotel revenue has
$275/NIGHT
Downtown D.C. hotel rates now average nearly $275/night, a 3% growth from 2023 and well above the pre-pandemic level of $232/night in 2019.
71% OCCUPANCY
Occupancy increased slightly from 70% in 2023, following more substantial growth over the last few years, to a near full recovery in 2023.
increased to $788M, 15% above pre-pandemic levels, due to higher nightly rates. Downtown D.C. hotel revenues consistently make up about a third of D.C.’s overall hotel revenues.
Source: Arlo Hotels
→ Market Updates
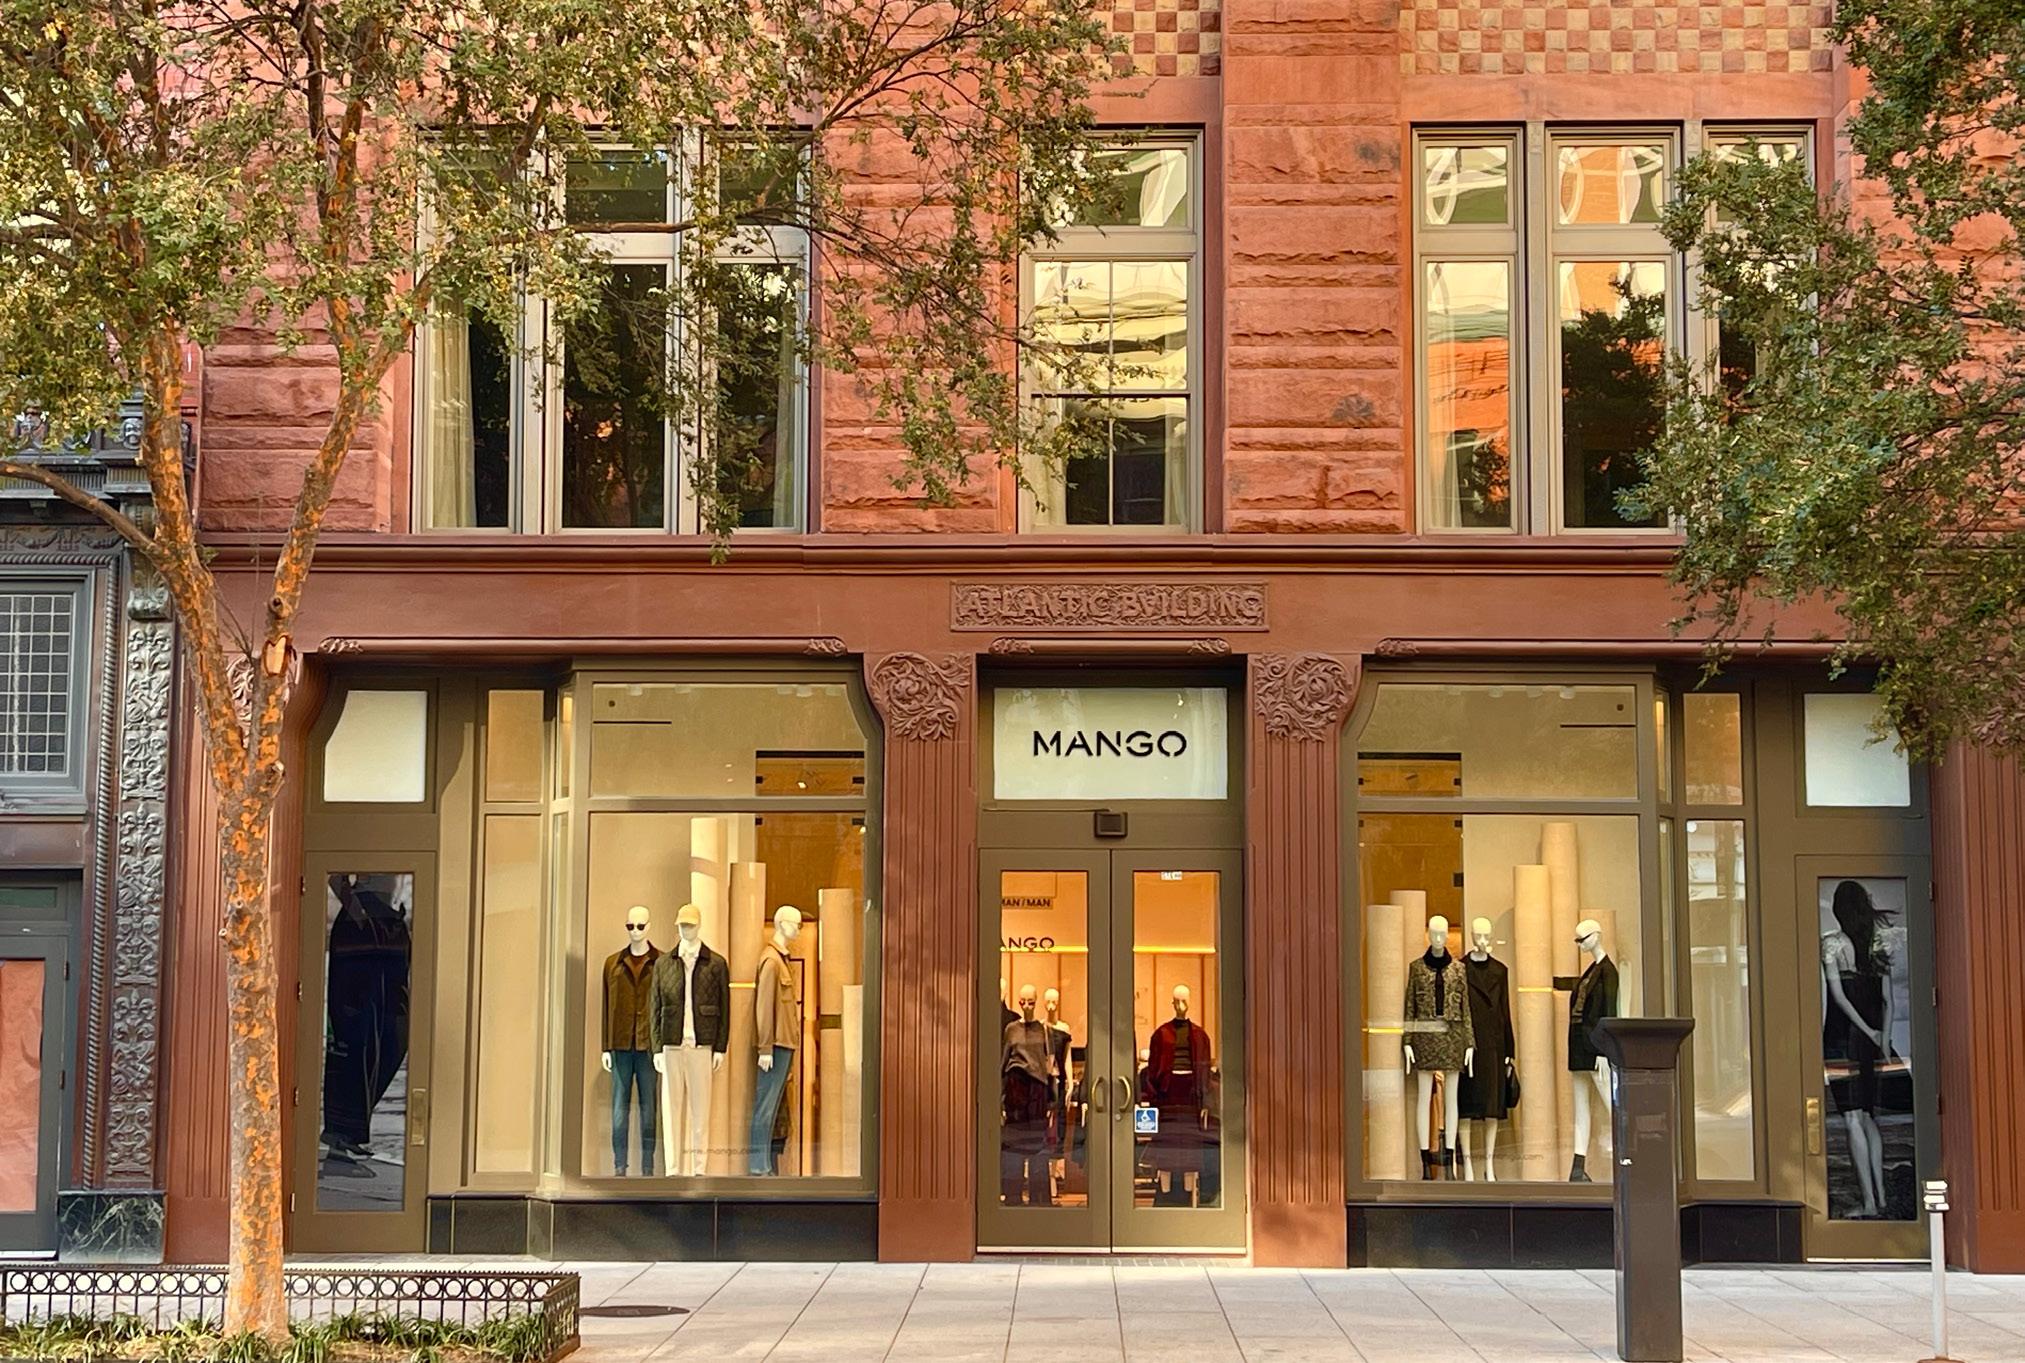
Retail Headwinds continue with some early signs of green sprouts
Downtown D.C. retail vacancy remains high, but recent and announced openings such as Mango and Barnes & Noble provide reason for optimism. Casual food & beverage retailers also stand to benefit from an increase in the number of workers returning to the office.
• Vacancy grew: Vacancy climbed to 25% in 2024, compared to 22.5% in early 2023. Downtown D.C. has lost 550,000 SF of occupied retail space since 2019.
Apparel, quick-service restaurants, and fitness have suffered the most. Despite the overall downturn in the retail market, casual dining, coffee, and entertainment retail have increased space since 2019.
• More restaurant openings than closings through Spring 2025: Downtown D.C. experienced a net increase of six new restaurant openings. However, other types of retail had more closings than openings.
Data Source: Dochter & Alexander Retail Advisors
Source: Mango
The Downtown D.C. retail vacancy rate remains high and continues to slowly climb. Downtown D.C. retail saw fewer closings, but non-restaurant retail is not keeping pace.
Between Spring 2024 and Spring 2025, the Downtown D.C. retail market had 43 openings and 49 closings. Restaurants trended more positively, with 30 openings and 24 closings.
DOWNTOWN D.C. RETAIL OPENINGS & CLOSINGS
RESTAURANTS OTHER RETAIL
Data Source: Dochter & Alexander Retail Advisors
→ Market Updates
RETAIL OPENINGS & CLOSINGS
(Spring 2024 - Spring 2025)
→ Market Updates
Residential
Strong demand supports top-of-market rents
Downtown D.C. experienced growth in apartment rents and condo resale prices in 2024, and has the opportunity to capture a larger share of regional new construction and office conversions.
• Rents and resale prices up: Class A apartment rents are up 3.2% and condo resale prices Downtown are up 2.5% from 2023.
• Office to residential pipeline grows: The 222-unit Balsa opened in 2024 was the first Class A apartment delivery
for Downtown D.C. since 2013. Three more office-to-residential conversions have broken ground (579 units total) and another 1,100+ units have been announced, but Downtown is not fully realizing its residential opportunities compared to local and regional submarkets.
• Worrying lack of new starts: New construction starts in D.C. are historically lower relative to the region, though recent policy changes proposed by Mayor Bowser aim to address the discrepancy.
Data Source: CoStar
Note:
$3.59
/SF CLASS A RENTS
Class A rents in Downtown D.C. are up 3% from 2023. Rents in Downtown D.C. remain just below D.C.’s overall multifamily Class A market and just about on par with NoMa/ Union Market and Navy Yard.
5%
CLASS A VACANCY
Vacancy for stabilized properties (built before Dec. 2022) fell in both Downtown D.C. and D.C. overall.
CLASS A APARTMENT EFFECTIVE RENTS ($/sf/month)
Data Source: CoStar
Note: Vacancy reflects stabilized properties, defined as all Class A projects built 2 years prior to the year vacancy reported. CLASS A APARTMENT VACANCY RATE
→ Market Updates
Source: Commission of Fine Arts
Balsa marked Downtown D.C.’s first apartment delivery since 2013, in contrast to more steady growth in local and regional submarkets.
NoMa/Union Market and the Rosslyn-Ballston corridor have experienced standout residential deliveries since 2019.
MULTIFAMILY CLASS A DELIVERIES, 2019-2024 (units)
Data Source: CoStar
NoMa/ Union Market
Downtown D.C.
Navy Yard
RosslynBallston
Chevy Chase
$653/SF CONDO RESALE PRICE
Condo resale prices Downtown increased, but not as quickly as surrounding regional submarkets. Downtown D.C. condo resale prices reached an average of $653/SF, up 2.5% from 2023. Condos along the Rosslyn-Ballston corridor jumped to an average of $701/SF in 2024, a 14% increase from the previous year.
REGIONAL CONDO RESALE PRICES ($/sf)
Data Source: Cavalry
Downtown
Rosslyn-Ballston
Source: Balsa
→ Market Updates
Transportation
Weekday metro ridership lags while micromobility and off-peak ridership returned
All forms of transportation aside from weekday Metrorail ridership have recovered to pre-pandemic levels in Downtown D.C.
• Strong weekends for Metrorail: Weekend ridership is consistently near or above pre-pandemic levels, reaching a monthly high of 123% in December 2024, while weekday ridership hovers at around two-thirds of pre-pandemic levels, reaching a monthly high of 64% in December 2024.
• Bikeshare’s best month ever: Capital Bikeshare ridership in Downtown D.C. continues to grow past pre-pandemic levels and had its best month ever in October 2024, with nearly 84,000 trips. Capital Bikeshare ridership, which can be used to approximate the growth of overall bicycle ridership, climbed to another record high in 2024 of more than 815,000 trips in Downtown D.C., up from 782,000 in 2023.
• Micromobility explodes to 2.1X of pre-pandemic ridership: Across the region, ridership of private bikes and scooters, and Capital Bikeshare, has continued to grow significantly, more than doubling pre-pandemic levels.
While information on micromobility ridership specific to Downtown D.C. is not available, regional data provides insight into its growth and reflects trends seen across Downtown D.C. As of 2024, trips on privately operated fleets, such as Lime and Spin, now make up 65% of all micromobility trips.
METRORAIL RIDERSHIP
98%
OF PRE-PANDEMIC RIDERSHIP
In 2024, average daily weekend Metrorail ridership was about 31,000 trips, about 98% of an average weekend day in 2019.
WEEKDAY METRORAIL RIDERSHIP
59%
OF PRE-PANDEMIC RIDERSHIP
In 2024, average daily weekday Metrorail ridership was about 52,000 trips, 59% of an average weekday in 2019.
WEEKEND
DOWNTOWN
D.C. METRORAIL RIDERSHIP (compared to pre-pandemic levels)
Data Source: WMATA
2019
2019
REGIONAL MICROMOBILITY RIDERSHIP (in millions)
Data Source: District Department of Transportation, Ride Report
THE DOWNTOWNDC BID THANKS THE FOLLOWING FOR THEIR CONTRIBUTIONS TO THIS REPORT
CBRE
CoStar Group, Inc.
DC Office of the Chief Financial Officer (OFCO)
Destination DC
District Department of Transportation (DDOT)
Dochter & Alexander Retail Advisors
ESRI
Events DC
Ford’s Theatre
Jones Lang Lasalle (JLL)
Kastle
Metropolitan Police Department (MPD)
Monumental Sports & Entertainment (MSE)
National Archives
National Building Museum
National Museum of Women in the Arts (NMWA)
National Portrait Gallery
National Theatre
RCLCO
Shakespeare Theatre Company
Sixth & I Historic Synagogue
Smithsonian Institution
The Hamilton Live
U.S. Bureau of Labor Statistics (BLS)
U.S. General Services Administration (GSA)
U.S. National Park Service (NPS)
Warner Theatre
Washington Metropolitan Area Transit Authority (WMATA)
Washington DC Economic Partnership (WDCEP)
Woolly Mammoth Theatre
DOWNTOWNDC
Gerren Price
BID SENIOR LEADERSHIP
President & Chief Executive Officer
Rachel Hartman
Chief Strategy Officer and Executive Director, DowntownDC Foundation