13 minute read
Groundbreaking pipeline insight


R. J. Pidcock, S. Blaney, B. Bilsbrough and E. Taylor, RSK Group, UK and E. Segal, Y. Lorig, ASTERRA, Israel, offer a desk-study-based assessment for pipeline design, construction and operation phases using ASTERRA EarthWorks soil moisture data and Groundsat mapping and analysis.
Groundsat is an innovative mapping and analysis system that includes ASTERRA EarthWorks high spatial resolution soil moisture data, that was developed following nearly half a decade of research and development. The development of Groundsat was focused on providing a system that could inform a proactive assessment by searching for the causes of problematic ground conditions rather than monitoring the effects. Groundsat can map changes in soil moisture and provide analysis of the data alongside other datasets, which is key to understanding geotechnical risk. EarthWorks exploits two basic principles. First: the dielectric constant is different for different materials, and through the development of patented algorithms it is possible to map the signature of water in the ground. Second: L-band synthetic aperture radar (SAR) offers advantages over other frequency bands such as X- or C-band as the wavelength of L-band is significantly greater (15 - 30 cm). This increased wavelength gives L-band radar
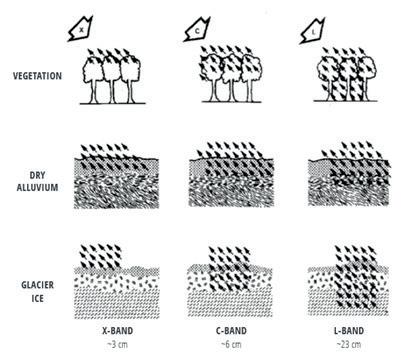
Figure 1. SAR penetration as a factor of the wavelength (λ) and penetrated medium (Aukema, Wilson, & Irwin, 2019).
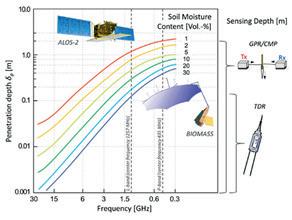
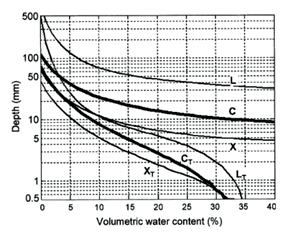
Figures 2 and 3. The penetration depth as a factor of the transmitted frequency and the soil moisture content (left figure from Nolan and Fatland, 2003, right figure from Koyama et al., 2017).
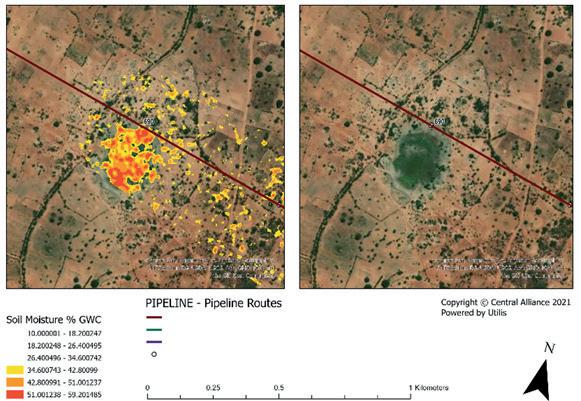
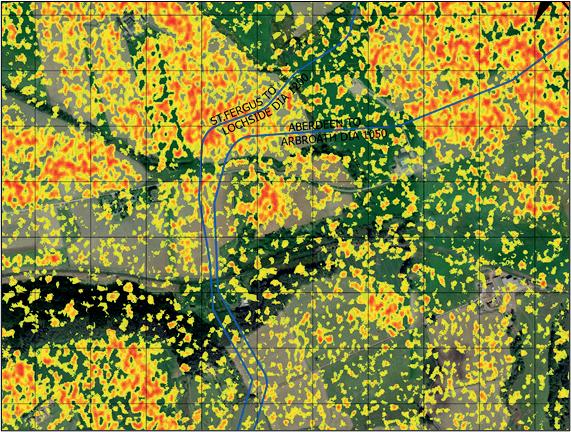
Figure 4. Example of EarthWorks soil moisture mapping data with relative soil moisture values shown above 30% GWC (yellow into red), overlaid onto an optical satellite image within Groundsat with pipelines shown in dark blue (ASTERRA and Central Alliance). the ability to penetrate vegetation and into the ground, a significant difference when compared with Interferometric SAR (InSAR) surface deformation monitoring.
Long-wave SAR has penetration capabilities depending on its frequency, land coverage, soil type, soil wetness (Koyama et al., 2017; Aukema, Wilson and Irwin, 2019; Nolan and Fatland, 2003) and incidence angle. L-band SAR has proven its penetration capabilities, starting at the Shuttle Imaging Radar (SIR-A) in 1982 that was flown in the Columbia space shuttle and uncovered ancient riverbeds with its penetration (McCauley et al., 1982).
L-band backscatter data providing high correlation with gravimetric and volumetric measurements on field soil samples have been demonstrated in a variety of research (Sonobe et al., 2008; Ponganan et al., 2016; El Hajj et al., 2019; Zribi et al., 2019).
EarthWorks data have also provided high correlations and repeatability when correlated to field soil samples, both when tested in the laboratory for gravimetric water content (GWC) and with in-situ soil moisture probes measuring volumetric water content (VWC). Field data were collected within a two hour window of the satellite image acquisition. The relationship between microwaves and soil moisture content has been studied over several decades. The use of satellite microwave remote sensing technologies for quantitative soil moisture mapping was introduced in the 1980s with SAR technology. This method was applied and proven accurately on the upper soil thin layer (5 - 10 cm depth) (Behari, 2005). The main limitation was the spatial resolution, which was too coarse. Other limitations were soil texture, surface roughness and vegetation coverage. The use of novel full (quad) polarimetric SAR imagery and L-band, which is known for its capabilities for soil moisture content detection and penetrates both the vegetation coverage and the topsoil layer, plays a major role in the improved accuracy of the results.
The ability to estimate soil electrical conductivity using L-band SAR and specifically the ALOS-2 PALSAR satellite has been proven using actual field measurements (Phonphan, 2017; GUO, et al., 2013). Data acquisition for a changing world The use of satellite-based data, such as EarthWorks soil moisture mapping, is an innovative technique that has the power to change how we operate in difficult times, to the benefit of all stakeholders. Groundsat helps address the significant challenges that infrastructure owners and operators face with the increasing impact of climate
change, in terms of both acquiring pre-construction data for design and for assessing asset resilience. The technique utilises existing earth observation satellites and requires no access to the site, no travel and no exposure to risk; it covers large areas and therefore reduces costs and carbon footprints for both data acquisition companies and asset owners, while also providing a safer means of acquiring data through all phases of design, construction and operation.
Pipeline analysis Pipelines are a key part of critical global infrastructure and offer a mode of transportation for fluids with significant economic benefits over other methods of transportation.
“Pipeline damage statistics from Canada, Europe and the United States indicate that about one-eighth of all pipeline damage incidents over the last 30 years have been due to geotechnical hazards. It has been noted that pipeline failures induced due to ground movements would typically lead to damage costs more than double those arising from other hazards” (Dharma Wijewickreme).
Understanding soil moisture and ground conditions is essential in both the design and construction and operation phases of buried pipelines. The consequences of pipeline failure can be expensive from both economic and environmental perspectives. For applications in pipeline route assessment, soil moisture hazard analysis and preconstruction spoil management, Groundsat can provide valuable intelligence to constructors and operators of large diameter pipelines, over long distances.
Design, pre-construction and construction phases The interaction between buried pipes and the surrounding soil is complex. Buried pipelines and foundations for overground pipelines interact with the soil surrounding them and are subject to the additional stresses transmitted by the movement of the ground. These can be exacerbated with increased shrink-swell potential of the soil in addition to more extreme circumstances, such as the translation of the soil in the event of shallow landslides on slopes and liquefaction during earthquakes.
Using Groundsat, it is possible to identify areas of concern where high soil moisture and increased pipe stresses coincide, such as at the position of a change of pipeline direction or a change of longitudinal gradient. Furthermore, using EarthWorks high-resolution soil moisture data combined with spatial data, it is possible to inform the placement of right-of-way drainage or the requirement for revetments where areas of high soil moisture exist that are deemed likely to influence soil stability.
Soft and boggy ground can pose operational problems during construction and understanding the soil moisture during the route selection stage is critical for planning, budgeting for safe construction and to meet required construction programmes. Figure 4 provides an example of soil moisture data overlaid onto an optical satellite image showing land cover.
During route selection, geohazards are a key aspect to consider. Pipelines must be designed to accommodate the additional load from the surrounding soil. Groundwater and pore pressures need to be considered in design, along with the potential for change in groundwater regimes and pressures. Additionally, buoyancy forces due to groundwater need to be carefully considered. Where hydrostatic uplift from groundwater exceeds the downward forces of the pipe, its contents and soil overburden, this can lead to critical situations, exacerbated when the pipe is empty or filled with air or gas.
Figure 5 provides an example of Groundsat-processed data from a similar area to Figure 4. At this location,
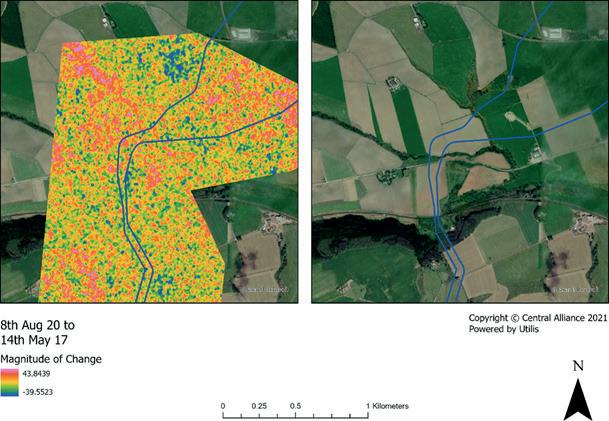
Figure 5. Example of EarthWorks magnitude of change soil moisture mapping data, showing the change between two images at different times of the year, highlighting where seasonal variation is at its highest. The optical satellite image on the right shows land cover. Correlations can often be observed within Groundsat, but land cover type, including crop type and stage of growth, along with geology can be seen to influence soil moisture and change over time. Pipelines are shown in dark blue (ASTERRA and Central Alliance).
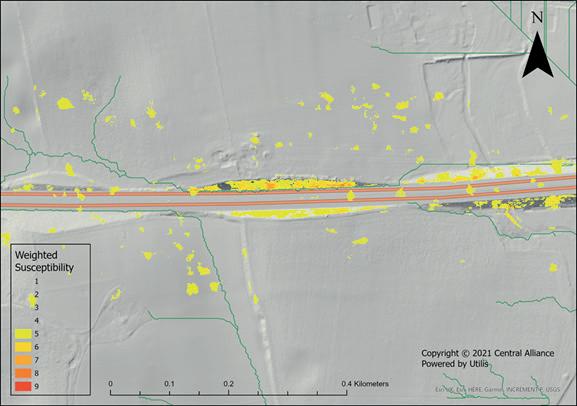
Figure 6. Example Groundsat soil moisture-based weighted susceptibility mapping, incorporating soil moisture values and slope angle (from lidar DEM), each scaled 1–10 and weighted 50–50, highlighting where high soil moisture and slope angle combine (ASTERRA and Central Alliance).
significant seasonal change in soil moisture values between wet and dry seasons can be observed. Understanding this change is critical for both pipeline design, route selection and monitoring during operation, particularly in terms of asset resilience to climate change. Figure 5 highlights the magnitude of change between soil moisture values calculated from two separate L-band SAR images.
Soil moisture mapping provides information that can help establish these risks, along with other geotechnical considerations and geohazards such as landslides, earthquake-induced liquefaction and ground movements.
When considering landslide susceptibility, Groundsat analysis of soil moisture data in the geographic information system (GIS) enables other datasets such as lidar-based digital elevation models (DEM) to be incorporated. Combining EarthWorks soil moisture data and the slope angle enables susceptibility mapping to be carried out, highlighting where high soil moisture and a high slope angle combine. Soil moisture mapping data provide a further source of information to aid in the identification of high-risk areas that together with more conventional survey and investigation methods enables improvements in prioritising targeted intervention. Furthermore, the Groundsat system provides the designer with another layer of information that would be difficult and costly to obtain using other, more terrestrial, techniques.
Temporary placement of spoil material removed from trenching activities can present additional hazards when placed on saturated ground and subsequently becoming saturated itself, as is highlighted by recent failures. Soil moisture mapping data combined with GIS and hydrological analysis can be used to inform the best location for spoil to avoid areas of high soil moisture and slopes combining, thus reducing the risk of geotechnical failure of the spoil deposits. This assessment can be valuable both during and post-construction where permanent excess spoil remains in place.
Wide area coverage also enables the assessment of soil moisture and run-off from watershed areas or catchments that directly affect the pipeline corridor, enabling management of run-off, an essential requirement with a changing climate and more severe weather events. Operation phase Pipeline corrosion in soil is a complex phenomenon comprising several mechanisms. Alongside parameters such as soil acidity, soluble salt concentration and electrical resistivity, soil humidity and thus soil moisture plays a significant role in corrosion rates in soils, as demonstrated by Murray and Moran (1989). The study reveals that pipeline steel corrosion could occur at a rate of three orders of magnitude higher in soils in near-saturated Put Down Your Work Gloves. (We’ve got this.)
Maintaining a pipeline is no easy task. With so many things to worry about, you need products you can depend on. Always. Our solid-state decouplers help improve your cathodic protection system’s performance and stand up to AC faults and lightning strikes, in all sorts of conditions.
We make them rugged so that you can trust them to perform. Always.
Applications Include:
• AC Voltage Mitigation • Insulated Joint Protection • Decoupling Equipment
Grounding Systems • Gradient Control Mat Isolation
Learn more about our Always Rugged Promise: Dairyland.com/AlwaysRugged

condition than those located in near-dry conditions. From this study, the detection of high soil moisture areas throughout the proposed route of the pipeline is useful to aid the preparation of a sampling regime and a better focused ground investigation campaign, where required.
Pipelines used for the transportation of waxy, highly viscous oil need to be heated to reduce the viscosity of the oil sufficiently for it to flow freely through the pipeline. Moisture around an underground pipeline sometimes experiences heating from the pipe, causing evaporation. It has been shown that in areas of increased saturation, this results in a decrease of compressive forces, which is considered a benefit to the stability of a pipeline, according to Zhu et al. (2019). Using Groundsat to identify areas of saturation can help with route planning. Unexpected changes to moisture content may indicate areas of increased heating. Early identification of these areas could enable inspections of specific sections where insulating material may be failing or other faults are developing. Figure 7 provides an example of soil moisture mapping data for potential use in both assessing corrosion and heat-loss susceptibility. Conclusion Groundsat mapping and analysis system, incorporating ASTERRA’s EarthWorks soil moisture data, is a proactive data acquisition technology that searches for the causes of problematic ground conditions rather than monitoring the effects.
Understanding soil moisture and ground conditions is essential in both the design and construction and operation phases of buried pipelines. High resolution soil moisture mapping forms an important dataset during
the design, pre-construction, construction, and operation phases of a pipeline lifecycle to assess geotechnical risk. Analysing the data alongside other datasets extracts further value. The combination of soil moisture data and an accurate digital elevation model enables a comprehensive desk-based GIS assessment to be undertaken, which may highlight areas where soil is sensitive to increasing moisture. Based on this susceptibility analysis, remedial solutions, such as drainage, can be used to address issues related to increased soil moisture or in the case of pre-construction, used to inform route design to enable improved spoil management during construction. Figure 7. Example EarthWorks soil moisture mapping data with relative soil moisture values shown above 34.6% GWC (yellow into red), overlaid onto an optical satellite image showing land cover (ASTERRA). EarthWorks combined with GIS analysis can provide insights into the risk of landslides and geohazards on natural ground surrounding a pipeline. Wide area coverage enables the assessment of soil moisture and run-off from watershed areas or catchments that directly affect the pipeline corridor, enabling the management of run-off, an essential requirement with a changing climate and more severe weather events. Bibliography AUKEMA, J., WILSON, S. and IRWIN, D. (2019). The Synthetic Aperture Radar (SAR) Handbook: Comprehensive Methodologies for Forest Monitoring and Biomass Estimation. Huntsville, AL: SERVIR Global Science Coordination Office. BEHARI, J. (2005). Microwave Dielectric Behaviour of Wet Soils. New Delhi: Springer. GUO, Y., SHI, Z., ZHOU, L.-q., JIN, X., TIAN, Y.-f. and TENG, H.-f. (2013). Integrating Remote Sensing and Proximal Sensors for the Detection of Soil Moisture and Salinity Variability in Coastal Areas. Journal of Integrative Agriculture, pp. 723 - 731. KOYAMA, C. N., LIU, H., TAKAHASHI, K., SHIMADA, M., WATANABE, M., KHUUT, T. and SATO, M. (2017). In-Situ Measurement of Soil Permittivity at Various Depths for the Calibration and Validation of Low-Frequency SAR Soil Moisture Models by Using GPR. Remote Sensing, p. 580. MCCAULEY, J. F., SCHABER, G. G., BREED, C. S., GROLIER, M. J., HAYNES, C. V., ISSAWI, B., … BLOM, R. (1982). Subsurface Valleys and Geoarcheology of the Eastern Sahara Revealed by Shuttle Radar. Science. MURRAY, J.N., MORAN, P.J. (1989). Influence of moisture on corrosion of pipeline steel in soils using in situ impedance spectroscopy. Corrosion Science. Volume 45, pp. 34 - 43. NOLAN, M. and FATLAND, D. R. (2003). Penetration depth as a DInSAR observable and proxy for soil moisture. IEEE Trans. Geoscience and Remote Sensing, pp. 532 - 537. PHONPHAN, W. (2017). Using Regression Models to Predict Electrical Conductivity of Soil Through ALOS PALSAR Satellite. Journal of Engineering and Applied Sciences, 12, pp. 7276 - 7279. PONGANAN, N., PRASEARTKUL, P., PIPATSITEE, P., TAOTA, K., KONGPUGDEE, S., SAKULLEERUNGROJ, K. and EIUMNOH, A. (2016). The determination of soil water content in various depth levels in cassava fields using ALOS-2 PALSAR Imageries. Asian Association on Remote Sensing 2016 Conference proceedings. SWEENEY, M., GASCA, A.H., GARCIA-LOPEZ, M. and PALMER, A.C. (2005). Pipelines and landslides in rugged terrain: a database, historic risks and pipeline vulnerability. Terrain and Geohazard Challenges Facing Onshore Oil and Gas Pipelines. Thomas Telford, London, pp. 641 - 660. SONOBE, R., TANI, H., WANG, X., FUKUDA, M. (2008). Estimation of Soil Moisture for Bare Soil Fields Using ALOS/PALSAR HH Polarisation Data. Agricultural Information Research 17(4). WIJEWICKREME, D. Role of Geotechnical Engineering in assuring the Integrity of Buried Pipeline Systems. University of British Columbia. ZHU, B., YE, Z., WANG, L., KONG, D., XU, W., KOLDITZ, O., NAGEL, T. and CHEN, Y. (2020). Hydro-mechanical behaviour of unsaturated soil surrounding a heated pipeline considering moisture evaporation and condensation. Computers and Geotechnics, Volume 119.