9 minute read
A buried solution


Steve Strachan, Sensor Networks, Inc., explains how midstream operators can harness the power of installed buried ultrasonic corrosion monitoring.
Many asset owners/operators struggle to identify the cause of fluctuating corrosion rates due to unreliable or infrequent data. Midstream groups around the world are tasked with monitoring thousands of miles of pipelines using this same data. Many times, the only data these teams have to rely on are inspection reports from ILI (inline inspection) and NDE (non-destructive examination) techniques such as manual ultrasonic testing and/or radiographs. While these techniques can provide valuable ‘snapshots’ of the condition of locations, limitations and inherent error with these techniques can compound, leading to ill-advised decision making. ILIs (pigging) are long-range non-destructive mass screening techniques performed periodically (and as spread out as possible) due to the cost of the process and downtime of the assets. When an ILI is performed (using a smart pig with ultrasound, MFL (magnetic flux leakage), etc.) and anomalies are found, a direct assessment (or dig) must take place at each of the locations under question.
After a couple of days of excavation and prepping, a technician is sent into the hole to take manual ultrasonic thickness data to compare with the ILI. Depending on a host of different variables, the operator must decide between two options: ) The pipeline is fit for continued service as is and can be buried (perhaps instead of a seven-year ILI interval, a five-year interval will be required due to the wall thinning and unknown general corrosion rate).
) The segment under investigation is fixed, sleeved, or repaired (now the same inspection interval is granted because the remediation had taken place).
In either case, these are expensive propositions. Moving from a seven to five-year inspection interval could mean hundreds of thousands or millions of dollars of extra costs associated with ILI over the useful life of that segment of pipeline. Electing to fix,
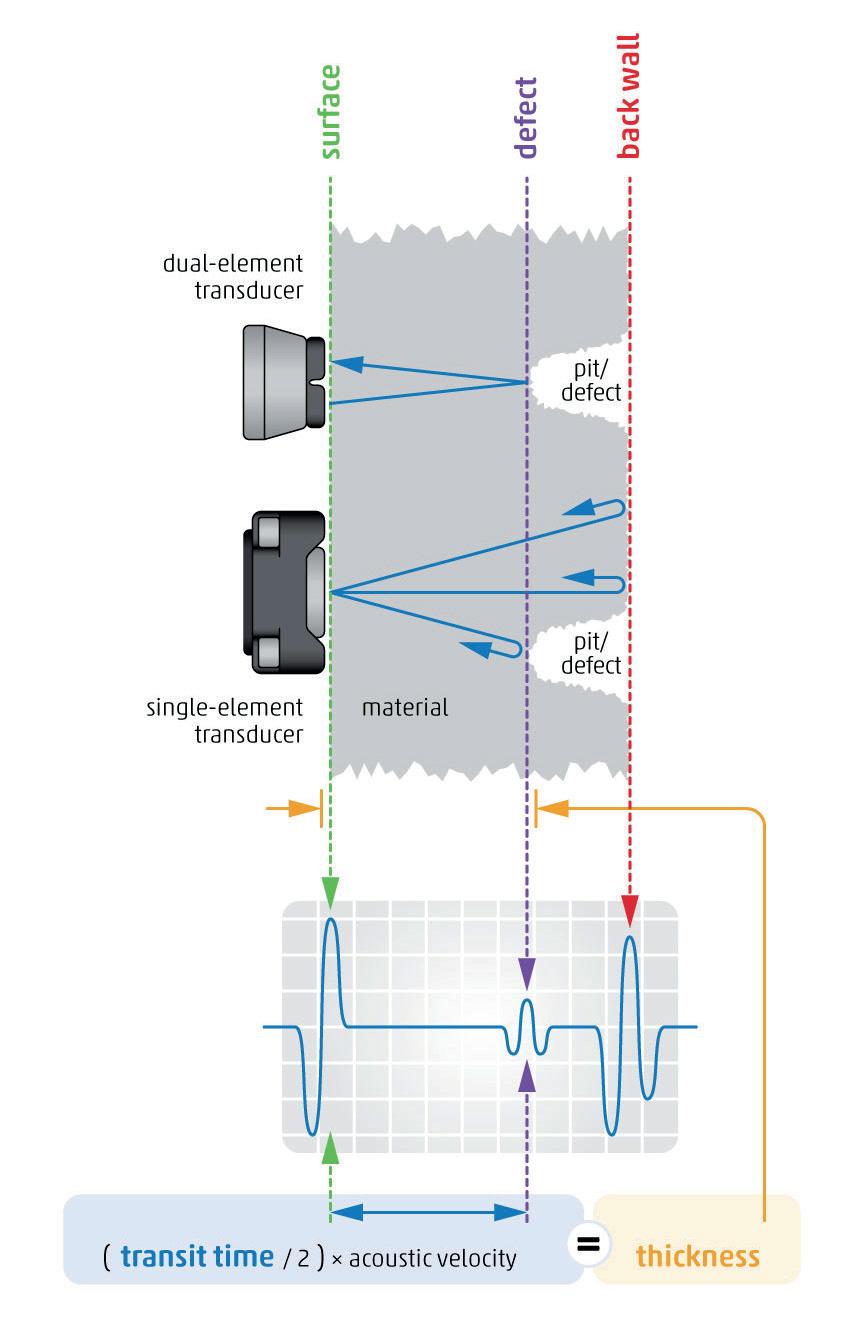
Figure 1. Principles of ultrasonic thickness measurement.
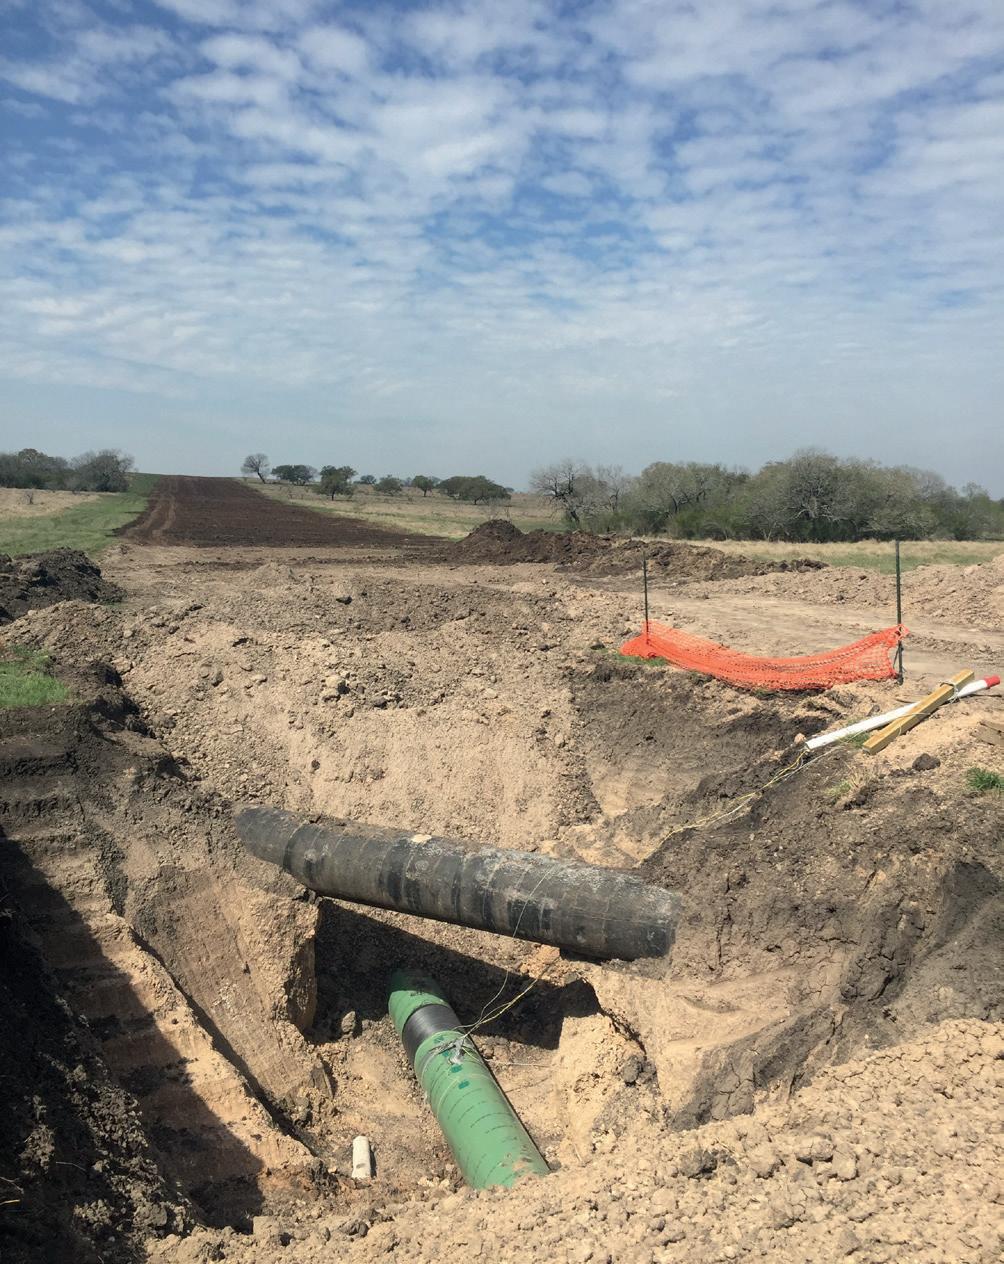
Figure 2. A newly constructed pipe with sensors installed at the low spot of the pipeline segment. sleeve, or repair means additional costs in downtime, materials, labour, and inspection.
Until recently, these were the only two options for owners/ operators. Today, many are opting for a third option which allows them to continue operating on their normal inspection interval even when anomalies are identified, without having to take immediate remediation. Why? Because they are electing to monitor these locations using buried ultrasonic sensors.
In this third option, the workflow is simple; perform ILI, execute a direct assessment, mark locations under question, decide which ones to install sensors to monitor, and bury. When it is time to report the ILI findings and there are anomalies present, the regulating body will ask what remediation tactic was used, and the answer is “we are actively monitoring it with buried UT sensors.”
If owners/operators see an active or episodic anomaly, they can send cleaning tools, inject inhibitors, etc. to remediate. If they cannot, they don’t need to run another tool. All that is necessary is to dig exactly where the sensors are and replace the pipe segment.
In many cases, owners/operators are being proactive and deciding that when they do a direct assessment, they will invest in sensors to leave behind.
To fully understand midstream asset-integrity corrosion monitoring from an NDT (non-destructive testing) perspective, let’s look at ultrasonic technology and how it is applied in an ‘installed’ (permanent or temporary) fashion.
Installed ultrasonic sensors Like manual ultrasonic thickness gauging, installed ultrasonic sensors utilise the same rudiments. Ultrasonic waves are sent through the material; then using the round-trip time it takes to travel through the material and the material velocity, the distance (thickness) can be determined (Figure 1).
Equation: T = (V) x (t/2)
Where: T = Thickness, V = Material Velocity, and t = Time
Despite the similarities, the technique is fundamentally different: the transducers and instrumentation are deployed permanently or temporarily with automatic data backhaul. This addresses several of the shortcomings of existing manually deployed solutions. Some of the major advantages are as follows:
) Instrumentation and probes are deployed on the asset in a permanent or semi-permanent fashion and can be accessed remotely. The cost of access is therefore reduced over time, and operators are not deployed to the point of the inspection. Once the instrumentation is deployed, data can be remotely accessed via the Internet (IoT).
) Due to the fixed transducer position and instrumentation, operator-to-operator, probe-to-probe, and instrumentto-instrument variability are eliminated. This removes significant sources of error and allows for improved measurement resolution, precision, and accuracy which is
particularly important for corrosion-rate trending and asset management.
) Data can be collected on a more frequent basis (>1X per day) for automated systems. This allows for more accurate corrosion-rate trending through statistical data analysis.
) The system is deployed with an integrated temperature measurement device so that changes in material acoustic velocity due to temperature variation can be automatically removed from the measurement, thus eliminating another significant source of error.
) The data is easily accessible. Wireless installed sensor systems can make use of various forms of data backhaul including the facility’s wired or wireless intranet, industrial wireless networks, satellite, or cellular networks for remote collection points, allowing real-time data/asset health availability.
Monitoring during new construction Considerable work goes into planning where a new pipeline will be laid. Factors such as environmental issues, residential limitations, topography, and many other components must be considered when ensuring pipelines’ long-term viability and safety. Many owners/operators get ahead of the curve by looking for areas they think might be prone to future corrosion attacks. Areas that have been identified as low spots or troublesome locations during pipeline plotting make for ideal locations to place sensors while it is being constructed and put into the ground (or left topside). Many of these locations are also in similar locations as the cathodic protection locations, which makes data collection more streamlined.
Figure 2 is a perfect example of a gradient change from the top of the hill in the background to the foreground where the pipeline was not only moving steadily downhill but also had to be laid below an existing line. As the pipeline continued into the foreground it went up to the top of another hill, making this location a perfect location to monitor for internal water or buildup which could potentially become corrosive in the future.
In many cases during new construction monitoring planning, a different type of sensor is used when there are no exact locations but rather a general area to be monitored. In these situations, an area monitoring sensor is recommended. Area monitoring mats have multiple elements all localised together to form a pattern or shape that collects multiple readings from the same general area.
Low spot or ‘pit’ monitoring When an anomaly is found that has surpassed maximum pit depth, a decision must be made. The anomaly must be fixed, sleeved, or repaired. If it has not reached its minimum allowed thickness, it can be monitored to gauge how ‘active’ the pit is. In many cases, corrosion is not always continuous and can be episodic in nature. To monitor the activity of the pit requires two pieces of information: identifying the pit, and extreme measurement accuracy.
Manual readings vary greatly. When a sensor moves by 1 mm in any direction, the thickness value changes. Once the pit is found, it is marked and then a dual-element sensor is attached using a magnetic housing and epoxy (Figure 4). It is then buried with the data collection box located above ground for periodic data collection.
Data management The ability to discern a viable and accurate corrosion rate is quite achievable. There have been many examples of how this
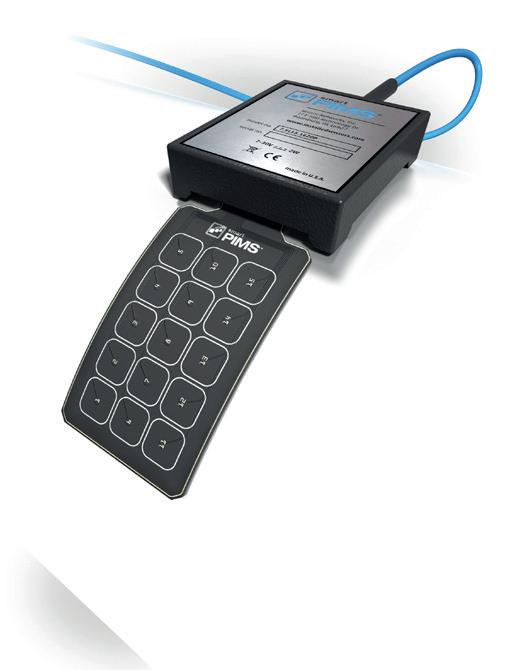
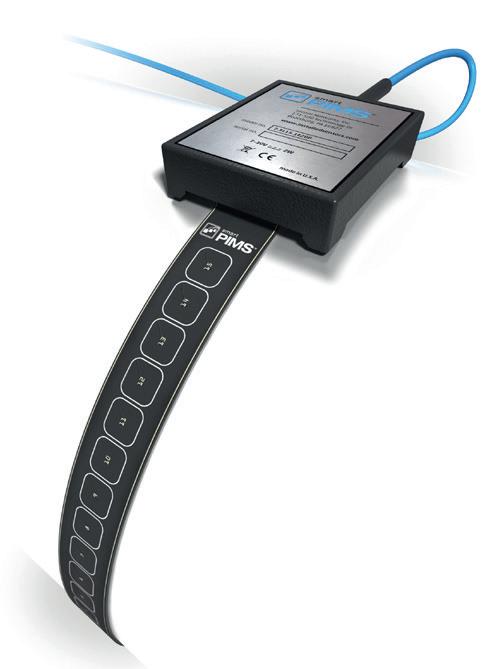
Figure 3. Area monitoring sensors.
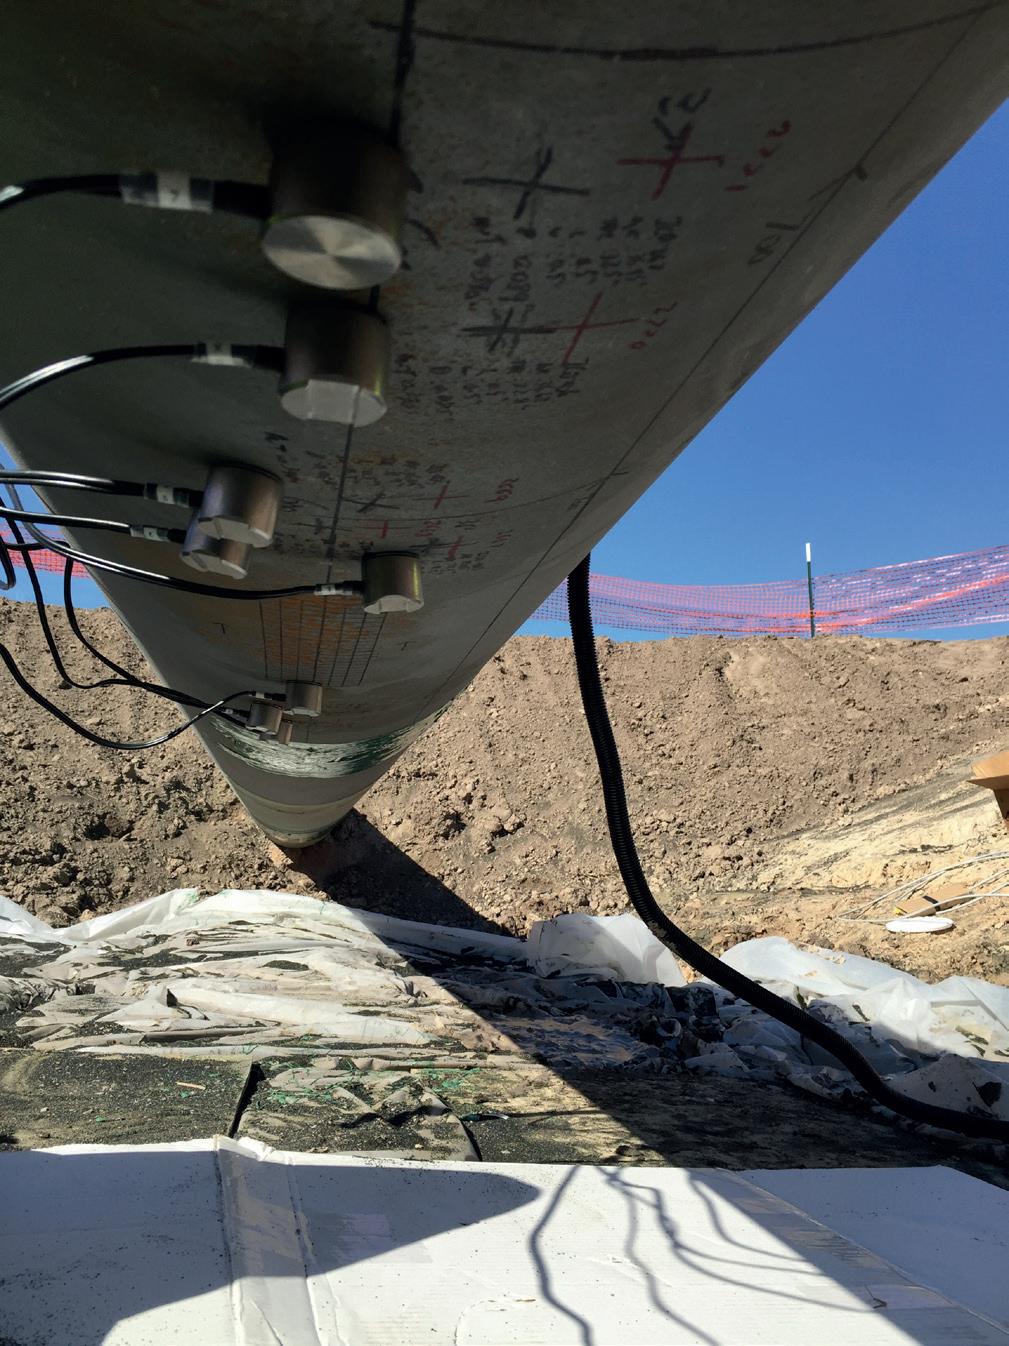
Figure 4. Dual-element corrosion sensors attached using magnetic housing and epoxy.
type of data has been able to help owners/operators not only monitor but also mitigate corrosion.
There are multiple ways to ‘slow down’ corrosion. Two of the ways are regularly scheduled cleaning pig intervals and the use of chemical inhibitors. Owners/operators know how often a cleaning is required but how much chemical inhibitor is needed to adequately protect their assets is largely unknown. In the example shown in Figures 5 and 6, an operator was taking daily readings to show the effectiveness of chemical inhibitor. As you can see, the corrosion rate significantly changed based on the amount of chemical inhibitors used at a given time. Conclusion Corrosion and/or erosion is a widespread and costly problem for all segments in the oil and gas chain. Currently, inline inspection, manual ultrasonics, and radiography are widely deployed to measure asset integrity for wall-thickness degradation, but all have their limitations as inspection methods. While these techniques are common and accepted, there are drawbacks in the accuracy and precision of these measurements; they only take a periodic snapshot view of asset health. Asset managers desire a more real-time view of the health of their facilities and equipment like the key performance indicator (KPI) view that they get when monitoring process variables. Additionally, the difficulty and cost of access, safety concerns, and regulatory environment changes are further driving interest in installed monitoring systems. Installed ultrasonic sensors have the potential for improved asset-health monitoring as compared to current manual inspection techniques. Ultrasonic sensors are non-intrusive and permanently installed with automated or semi-automated data-collection schemes which reduce key variables, resulting in improved measurement accuracy and precision. Thus, installed ultrasonic monitoring systems can provide increased and better data, allowing the use of statistical tools to provide corrosion-rate measurements on par with other technologies, further allowing enhanced trending and feedback to process variables. The technologies described in this paper represent commercially available options for owners/ operators to apply to their current asset integrity or inspection/monitoring programs and systems. These owners/operators are not only complying with the new PHMSA ‘Mega Rule’ and other regulations, but they are changing the way they operate to save time (resource allocation), reduce cost (monitor vs. inspect), and increase safety and efficiencies (predictive based vs. time-based maintenance) by deploying this technology. Owners/operators and regulatory organisations are looking for different ways to work smarter. As shown, there are many ways to accomplish this objective by harnessing the power of installed buried ultrasonic corrosion monitoring sensors for midstream applications.
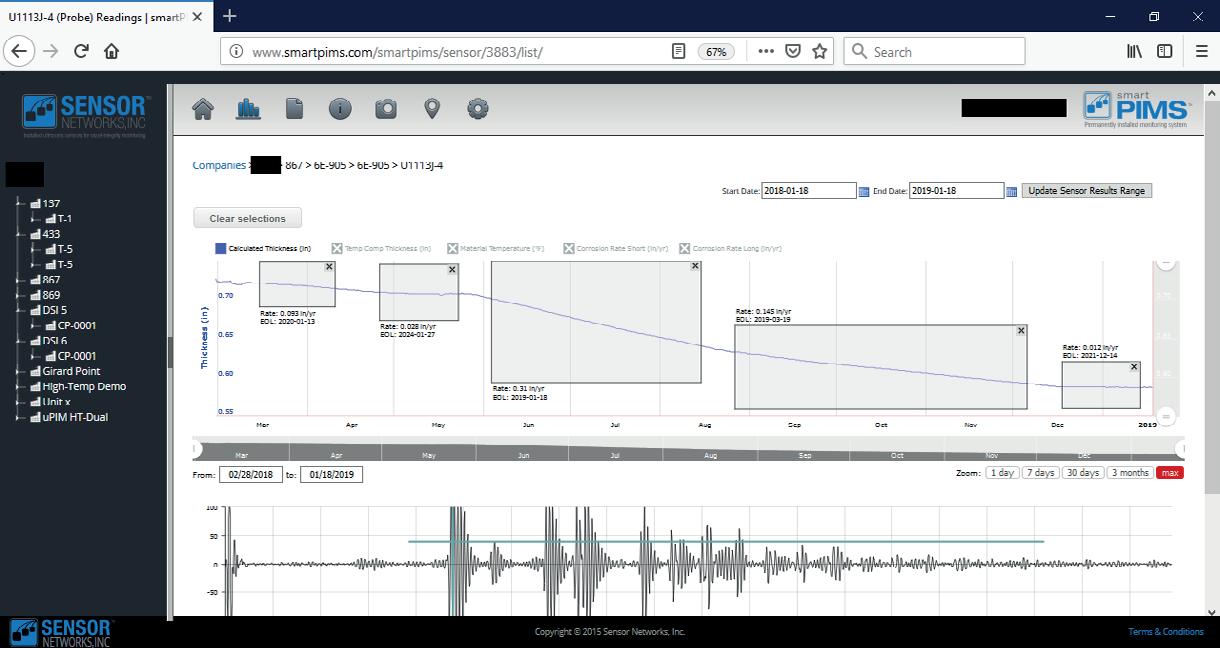
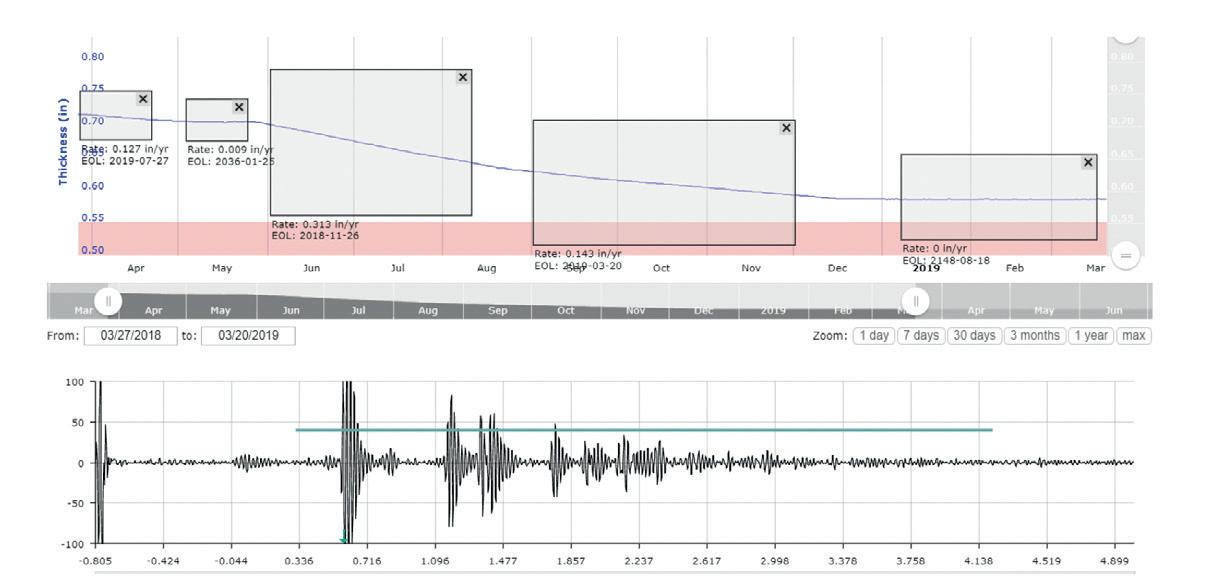
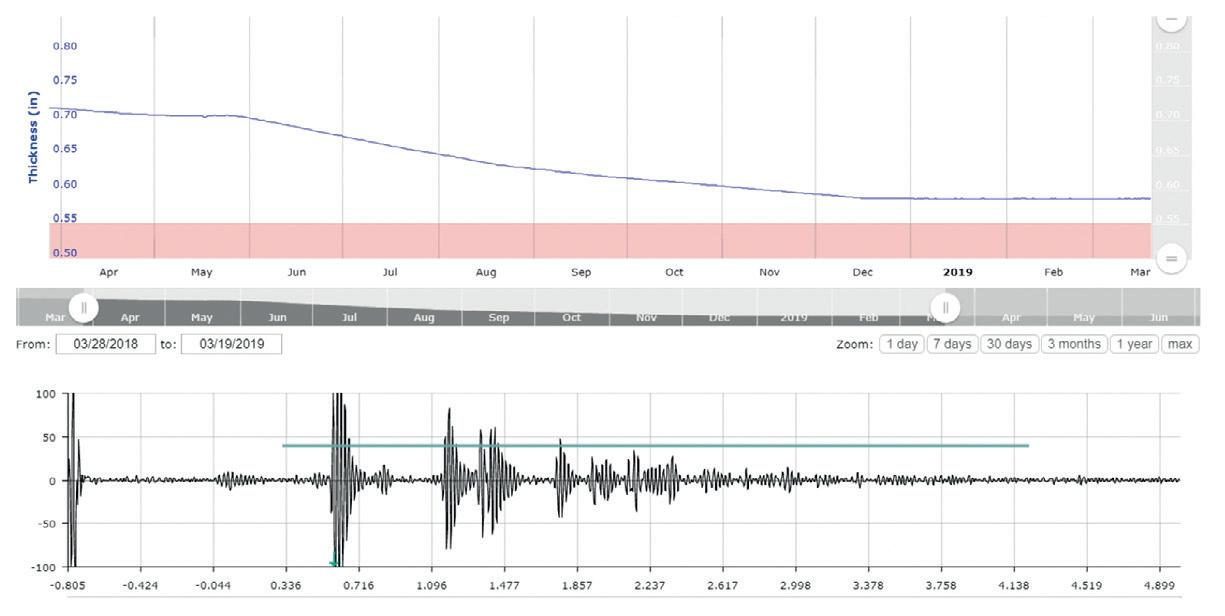
Figure 5. Corrosion rate trending (thickness on Y-axis, time on X-axis).
Figure 6. Corrosion trending using software for time-calculated rates.
Figure 7. Example of varying corrosion rates. Bibliography
“Electrical Resistance Probes” Science Direct. https://www.sciencedirect.com/ topics/engineering/electrical-resistance-probe H.R. Vanei. “A review on pipeline corrosion, in-line inspection (ILI), and corrosion growth rate models”. Science Direct. https://www.sciencedirect. com/science/article/pii/S0308016116302150 “Overview of In-Line Inspection”. Inspectioneering Journal. https:// inspectioneering.com/tag/ili Regulatory Info Document 49 CFR 192, “Transportation of Hazardous Gasses by Pipeline”. https://www.govinfo.gov/app/details/CFR-2011-title49-vol3/CFR2011-title49-vol3-part192 Regulatory Info Document 49 CFR 195 “Transportation of Hazardous Liquids by Pipeline”. https://www.govinfo.gov/app/details/CFR-2011-title49-vol3/CFR2011-title49-vol3-part195 “Ultrasonic Testing”. Wikipedia. https://en.wikipedia.org/wiki/Ultrasonic_ testing