
6 minute read
A new (virtual) reality


Michael Smith, ROSEN Group, UK, describes the development of an entirely digital inline inspection method.
Advances in inline inspection (ILI) technology have almost always been driven by improvements to hardware components such as magnets, transducers, sensors and batteries, or the software that converts sensor data into anomaly measurements. The next great leap in inspection technology will, however, have very little to do with hardware and sensor data. In fact, the next generation of inspection ‘tools’ will have none of these things at all.
Virtual ILI offers the promise of establishing a pipeline’s condition without having to think about the constraints of location, flowrate, tight bends, valves or tees, or any of the other features that traditionally create obstacles for an ILI tool.
Why? Because there is no ILI tool – at least not in the conventional sense. Instead, virtual ILI is an entirely digital inspection that relies on supervised machine learning in order to generate its ‘measurements’.
Supervised machine learning A commonality across many industries is the need to quantify relationships between variables and formalise these relationships within predictive models. We may want to model, for example, how world events affect the stock market, how nutritional choices influence heart health, or how demographic information influences which TV series or movies a user might enjoy.
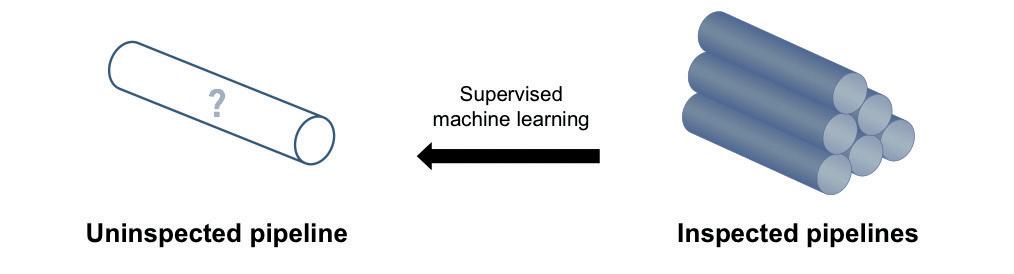
Figure 1. Principle of virtual ILI.
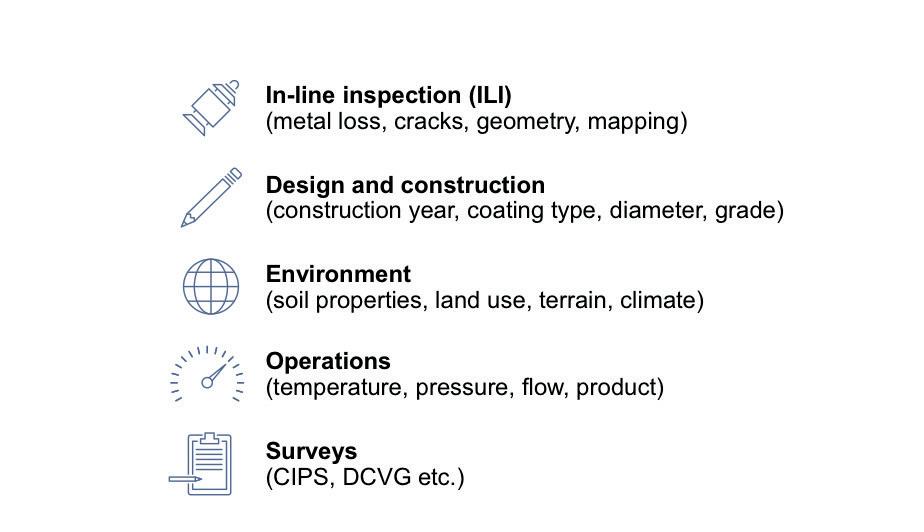
Figure 2. Contents of the integrity data warehouse.
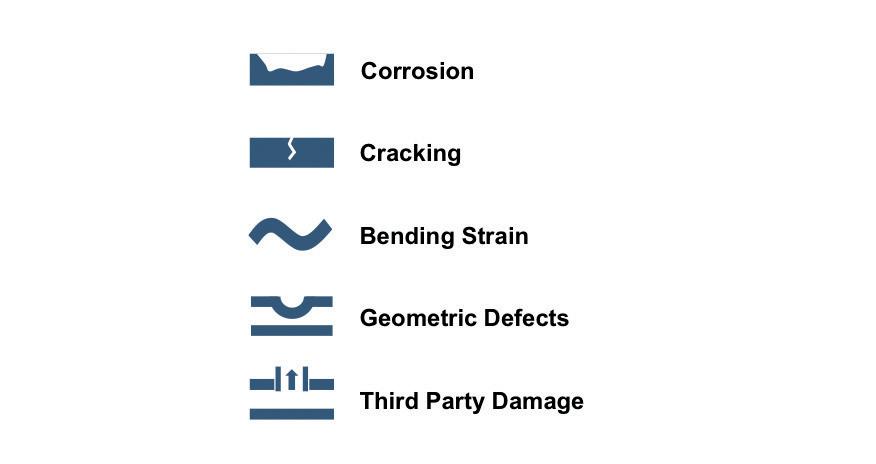
Figure 3. Pipeline threats.
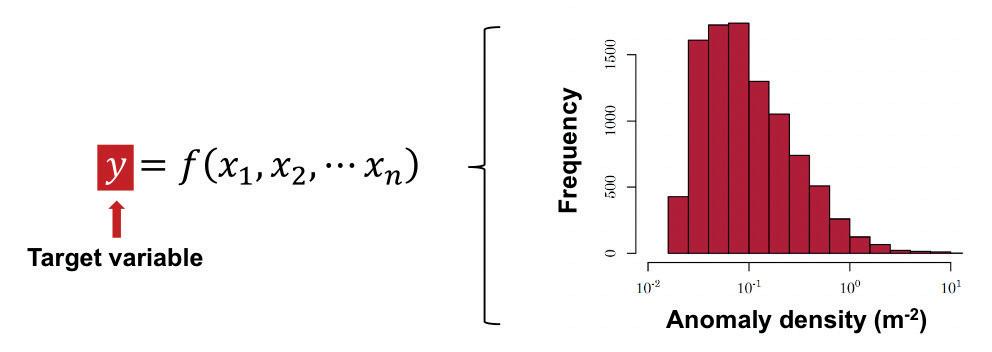
Figure 4. Anomaly density as a target variable for external corrosion prediction.
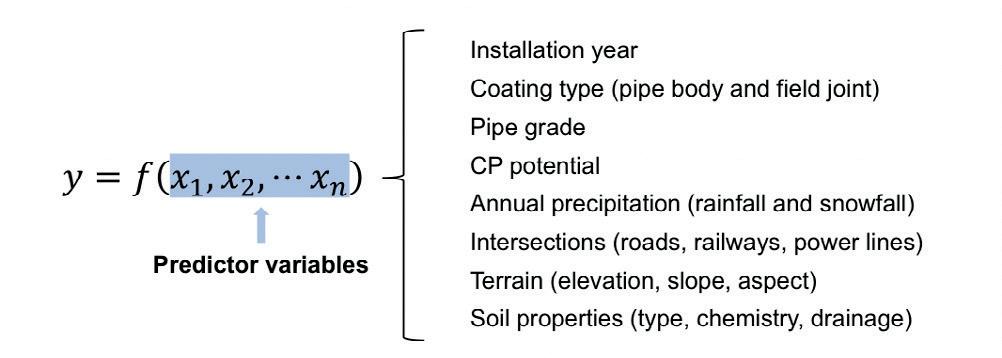
Figure 5. Predictor variables for external corrosion prediction.
In each of these cases, the relationship between the predictor variables (e.g. age, gender, native language) and target variable (e.g. favorite sci-fi epic) can be expressed using a function, f. For multiple predictor variables (x1, x2…x n), and a single target variable (y) we can write:
y = f(x1, x2…x n)
With enough historical data (i.e. examples of previous cases) the function f can be approximated and used to make predictions for unseen cases.
This is the principle of supervised machine learning, and it is exactly how virtual ILI works. With enough examples of inspected pipelines, we can identify trends between pipeline characteristics and pipeline condition, and embed these trends within predictive models (Figure 1). We can then deploy these models as a digital alternative to ILI.
Integrity data warehouse (IDW) In order to create meaningful predictive models, we need a relevant and reliable dataset of examples.
The integrity data warehouse, or IDW, is ROSEN’s global repository of ILI results and integrity management information. At the time of this writing, the IDW contains results from almost 15 000 inspections, in addition to design, construction, environmental and operational information for around 10 000 inspected pipelines (Figure 2).
The IDW is still being developed and is estimated to be less than 50% complete, but with a total inspected length exceeding 20 times the circumference of the Earth, the data already offer a rich feedstock for predictive modelling.
Models can be created for many different pipeline threats (Figure 3), but ROSEN’s most advanced virtual ILI technologies – owing to the quantity, availability and accuracy of historical data – are trained for corrosion prediction.
External corrosion prediction ROSEN’s virtual ILI service for external corrosion prediction can be used to generate corrosion predictions for full pipelines, smaller pipeline segments or even individual pipe joints.
Whereas a real ILI will report a list of anomalies within a pipeline segment, virtual ILI estimates condition metrics. Condition metrics are single-valued, numerical descriptors representing unique aspects of pipeline condition. Examples include anomaly density (the number of anomalies per unit area) and maximum depth (the maximum anomaly depth within the segment). Each condition metric reflects a slightly different aspect of corrosion. For example, anomaly density represents the quantity of corrosion within a segment, while maximum depth represents severity.
In the language of supervised machine learning, these condition metrics are target variables for the models (Figure 4).
On the other side of the equation are the predictor variables. These are characteristics of the pipeline segment that may influence (or at least correlate with) external corrosion (Figure 5).
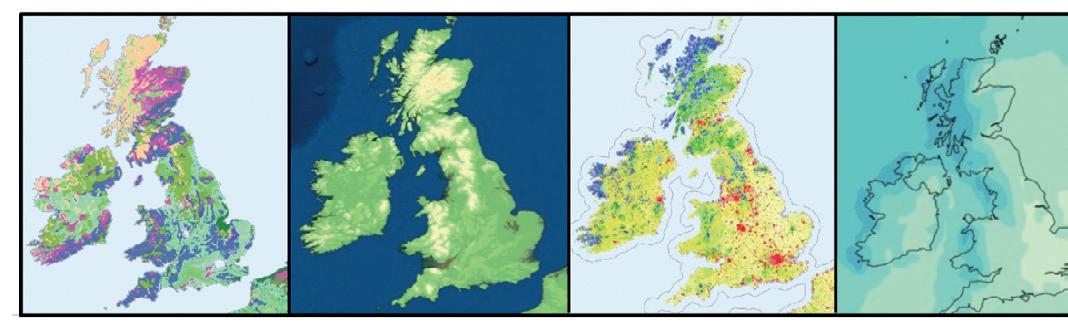
Figure 6. Open-source environmental datasets for the United Kingdom – from left to right, soil type, elevation, land use and precipitation.
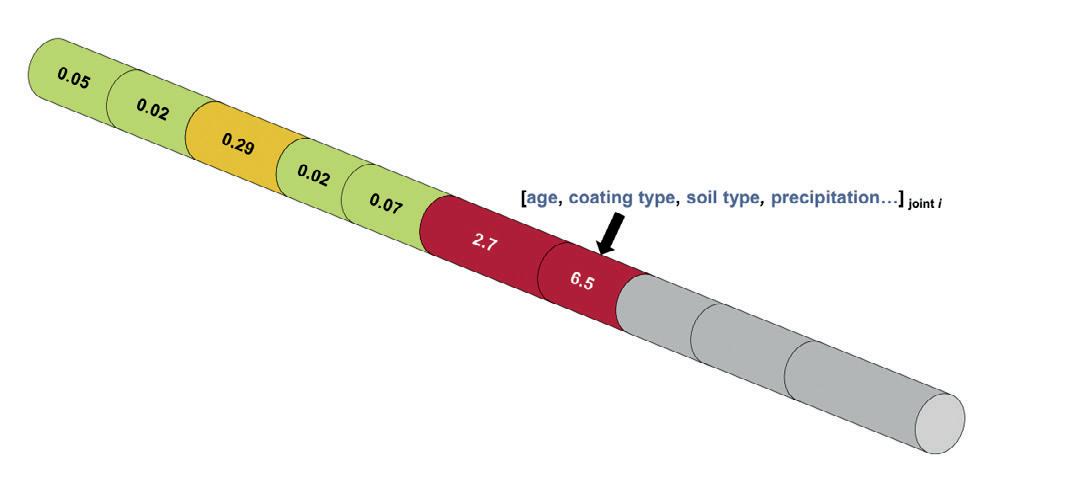
Figure 7. Virtual ILI for anomaly density (anomalies m-2) prediction at pipe joint resolution.
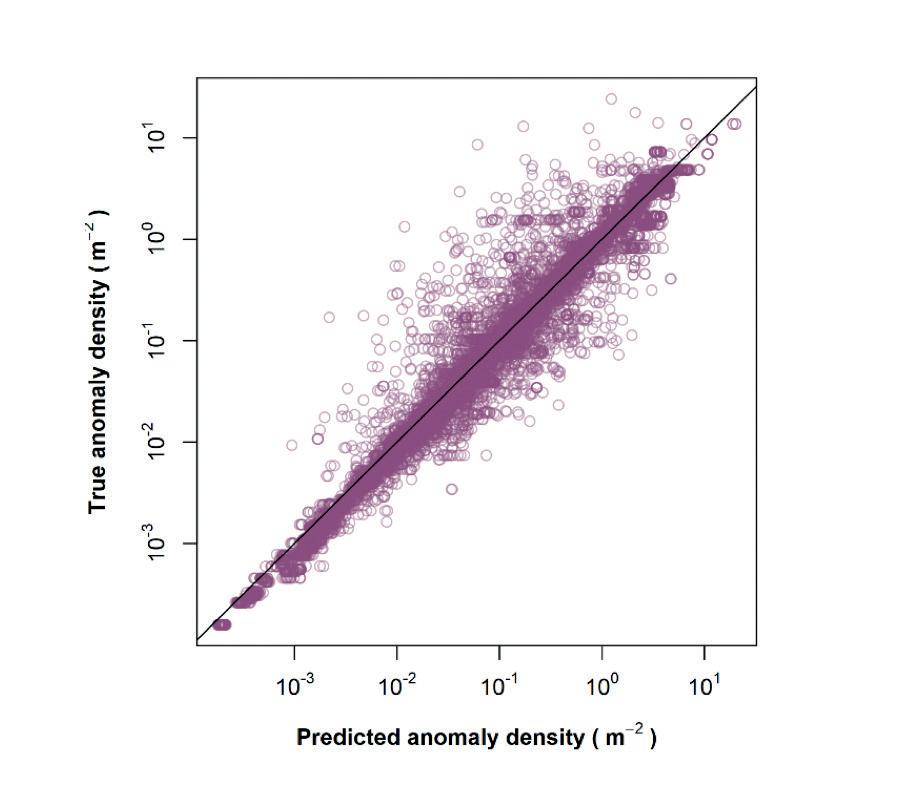
Figure 8. Predicted anomaly density (virtual ILI) vs. true anomaly density (real ILI) per pipe joint.
Predictor variables can be related to design and construction (such as age, coating type and pipe grade), cathodic protection, or even the local environment.
Once the target and predictor variables are defined, the model can be trained. This means showing the model as many examples as possible of historical corrosion, as detected by real inspections. In the case of external corrosion prediction, the models are trained using more than 100 million metal loss anomalies detected over the past 20 years.
In addition to the condition metrics, the model must see the characteristics (predictor variables) for the inspected pipelines, so that it can learn to identify trends. Does anomaly density increase as pipelines get older? Does it decrease for pipelines with more modern coatings? What happens when rainfall is high? What about the influence of soil type? In this respect the models make use of a wealth of open-source environmental datasets containing valuable information on soil types and chemistries, elevation, land use, and precipitation (Figure 6), as well as the locations of roads, railways, water bodies and power lines.
Once trained, the virtual ILI model is capable of taking a list of characteristics and returning an estimate of the target variable – such as anomaly density (Figure 7). But is it accurate?
Clearly, a virtual ILI cannot surpass the accuracy of a real ILI under optimal conditions, but when we test the models on an unseen sample of pipelines (i.e. pipelines that were not used to train the model), the performance is strong. This is exemplified in Figure 8, which shows anomaly density predictions for pipe joints within several hundred unseen pipelines around the world.
In Figure 8, more than 99% of anomaly density values are predicted within ±1 order of magnitude of the true (ILI) value – an enviable performance when compared to traditional modelling techniques for uninspected pipelines. Anomaly severity can also be predicted with a high level of confidence. This shows that the complex beast of external corrosion prediction can in fact be tamed. The pipe joint level of detail means that useful choices can be made regarding future actions.
Nevertheless, outliers are an inevitability in early machine learning applications, and virtual ILI is no exception. Figure 8 shows some significant under- and over-estimates of anomaly density. They are relatively rare, but still problematic.
In the case of corrosion prediction, these outliers are most likely caused by unique corrosion processes that the model has never seen, or by ‘hidden’ variables that are not currently captured in the models. This serves to highlight the importance of continuous improvement. Virtual ILI must continuously improve as new ILI datasets become available and new predictor variables are collected.
Over time, more and more of these rogue predictions will be brought into line, and the already excellent performance will further improve. It also shows that the role of the subject matter expert remains critical. An expert review of the results can identify cases with unexpectedly low or high anomaly density or severity, reducing the potential for significant errors.
We already know the power of ILI for integrity management of pipelines, and virtual ILI may be the next best thing.
The results from virtual ILI promise to be an excellent basis for quantitative risk and integrity assessments, allowing decisions on mitigation, rehabilitation and future monitoring to be made with more confidence than ever before.


