10 minute read
Machine learning keeps things flowing


Dr Yanfeng Liang, Mathematician at TÜV SÜD National Engineering Laboratory, UK, profiles using machine learning models to predict flowmeter installation error type.


Every day, vast amounts of data are generated across different sectors, containing valuable information that could aid businesses in their operational and strategical decision-making. In order to unlock and extract the value that lies within data, advanced modelling techniques such as machine learning models have become increasingly important, where information such as the condition of instruments, fault detection and diagnosis, and a forecast of future performance based on historical trends, can be obtained. Flowmeters, such as ultrasonic flowmeters (USMs), are capable of outputting digital data sets with the potential to be used for diagnostic purposes to indicate device performance and installation conditions. To maintain their accuracy and reliability, flowmeters are typically calibrated and maintained under fixed time-intervals, for example once every year; this is known as time-based monitoring. However, this type of calibration procedure is a crude method, neglecting many important factors, such as frequency of usage and operational conditions, that can directly impact the health of flowmeters and instrumentation. Failure to consider these factors can result in wasted time and money through unnecessary maintenance on flowmeters that are performing well, while neglecting those which require earlier inspection due to their operating in harsher environments. Advanced modelling techniques offer an opportunity to develop the next generation of flowmeter calibration and maintenance methods, by making better use of their diagnostic data to infer


the current condition of the meter; this is known as condition-based monitoring.
TÜV SÜD National Engineering Laboratory holds the UK’s national standard for measurement for density and flow. Over the years, our data acquisition systems have logged and archived 20 years’ worth of data detailing various flowmeters’ performance, test facility configuration and operating conditions. It was observed that any potential flow measurement errors are usually manifested as drifts from baseline values. However, rectification actions are often delayed due to the inability to identify the error responsible for the drift. This is because different types of error can induce the same drift within the same diagnostic variables. Therefore, despite end-users being made aware of a potential problem, they are unable to pinpoint the most likely cause of error.
This challenge is described visually in Figure 1. Using basic observational diagnostic assessments, it is difficult to distinguish between different errors. This could severely impact the operational efficiency of the facility and therefore increase the cost of operation for end-users. To correctly identify the potential cause of error, we cannot simply rely on one single variable; a combination of variables must be considered and as there often exists multiple interrelationships between variables, this requires advanced statistical analysis.
To demonstrate the capability of using machine learning models to overcome the ambiguity challenge represented in Figure 1, a case study was conducted within TÜV SÜD National Engineering Laboratory, whereby a machine learning model was built and used to predict, with high confidence, the type of installation error that was responsible for the drifts seen in different diagnostic variables.
Case study: using machine learning models to predict the types of installation error in a USM In this case study, a USM was deliberately installed in four different configurations: ideal installation set-up as instructed by the meter manufacturer, vertical misalignment, horizontal misalignment, and step change.
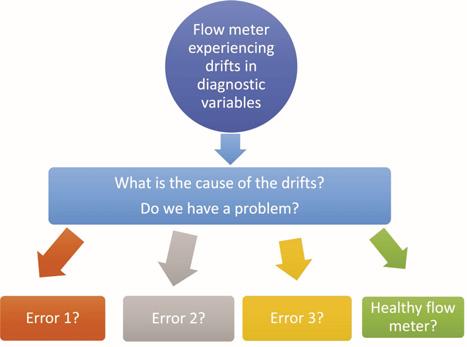
Figure 1. The challenge of determining the cause of drifts in diagnostic variables. Vertical misalignment and horizontal misalignment were achieved by deliberately using smaller bolts to connect the meter to the upstream pipe, causing the meters to misalign in a vertical or horizontal orientation. Step change error was induced by changing the line build which, due to the difference in pipe thickness, caused a small expansion in the pipe internals.
Data was collected under each operating condition, where 70% of the data was used to build and train a machine learning model to learn the patterns, trends and correlations in variables when the USM was exposed to different installation set-ups. The remaining 30% of the data was then used to test the model’s prediction capability. When building a machine learning model, it is a common procedure to split the data into training data and validation data, to tune and verify the performance of the model.
Based on the training data, the model had an error rate of 4.32% in predicting the correct installation condition responsible for the drifts seen in diagnostic variables, and an accuracy rate of 90.32% when testing with the validation data. To mimic the situation where we wish to use the model to predict the most likely cause of drifts, four different sets of data were set aside with the error condition unknown to the model, known as unseen data sets.
The prediction results are given in Figure 2, where the x-axis denotes the four types of installation set-up and the y-axis denotes the probability or the likelihood of the stated condition to be the cause of patterns and drifts seen in data. For example, for Unseen Data 1, based on the trends and patterns detected within the diagnostic variables, the model predicted with a probability of 0.9933 that this data set was gathered when the USM was installed in the ideal set-up as instructed by the meter manufacturer. This is the correct prediction; this USM was operated with no underlying error and no further action is required.
However, for Unseen Data 2, the model predicted with a probability of 0.8989 that this data set was most likely gathered when the USM was installed incorrectly (specifically vertical misalignment). In addition, the model had also predicted that the likelihood of this particular data to be collected when the USM was installed in other configurations to be highly unlikely. This is the correct prediction, enabling end-users to intervene and rectify the problem promptly. Similar interpretations can be made on the other unseen data sets, where results have the potential to improve end-users’ fault diagnosis and decisionmaking processes by pinpointing, with high certainty and confidence, the exact cause of drifts in diagnostic variables.
Using machine learning models to determine the significance and roles of variables The data used to train and build the machine learning model contained 11 different diagnostic variables, where in practice, flowmeters can produce hundreds of different diagnostic variables, each containing different levels of information.
Wherever you are, World Pipelines is with you.


The print issue is distributed to a global audience of industry professionals (verifi ed by ABC). Register to receive a print copy here: worldpipelines.com. magazine/world-pipelines/register


Prefer to read the issue online? The digital fl ipbook version is available here: worldpipelines.com/magazine/world-pipelines
Download the World Pipelines app for Android (Google Play) or iOS (App Store) to access World Pipelines from your mobile device.


For end-users who do not possess the necessary knowledge and experience in flow measurement, it is challenging to determine which variables are the most significant in different operating conditions.
The accuracy of the model can sometimes be improved further by reducing the number of variables; with fewer patterns and trends to learn, and less misleading and confusing information, the model accuracy can be enhanced. However, the ability to determine and decide which variables can be eliminated is difficult and often requires expert input. In addition, the role of variables might change depending on the operating conditions. For example, Variable A might play a significant role in distinguishing between installation errors, but it might perform poorly in distinguishing erosion-related errors.
Machine learning models can be used to overcome some of the described challenges, by highlighting the most
affected variables under a specific condition or error, providing end-users with confidence on the role of each variable. For this case study, an additional modelling result was obtained which indicated which variables were the most crucial in identifying different installation conditions. Figure 3 presents the five most important variables in determining and distinguishing between the four installation set-ups, where the most important variable is listed at the top. The order of importance is based on how much prediction accuracy the model would lose if the said variable was removed. Figure 2. Case study – USM prediction results from machine learning algorithm. For example, if the variable “average speed of sound” was omitted in the modelling process, then the model’s mean prediction accuracy would decrease by approximately 66%, followed by a decrease of around 38% if the variable “symmetry” was omitted in the modelling algorithm. The more accuracy the model loses, then the more important that variable is to the prediction algorithm. By identifying the most important variables, end-users can focus on changes in key variables if they wish to identify if there are any specific installation related errors. Through the use of machine learning models like the one illustrated in this case study, end-users can identify and pinpoint with greater certainty, the most likely reasons for Figure 3. The most important variables in distinguishing different drifts seen in different diagnostic variables. In addition, such installation conditions in the case study. models can improve end-users’ understanding of the roles of variables under different operating conditions. Results from advanced data-driven models can enable condition-based monitoring to replace the less efficient time-based monitoring. It is important to point out that each flowmeter has its own unique properties and different operating principles, where in previous studies, we have found that even the same type of flowmeter produced by different manufacturers, performed differently under the same operating conditions. Consequently, prediction results gathered from one flowmeter type and manufacturer should not be generalised and applied to other flowmeters. At present, research being undertaken by the Digital Services Team at TÜV SÜD National Engineering Laboratory is focused on creating a more generalised, reliable model, as well as further enhancing our understanding of the effect of different factors and operating conditions on different flowmeters.