8 minute read
Fouling management through digital transformation


E. M. Ishiyama, J. Kennedy, S. J. Pugh and H. U. Zettler, Heat Transfer Research Inc., explore how successful digital transformation is helping ENEOS Group refineries in Japan to eliminate waste, reduce lost time in data processing, and facilitate collaboration between different work groups within the organisation.
The digitalisation of plant data is a key component to operating a process plant. However, how the plant data is handled plays an important role in the Industry 4.0 initiative. Digital transformation is not only about digitalisation, as it is an organisation-wide effort to radically change the work process by implementing a system that: n Fits within the existing workflow and can be adopted without any disruption. n Promotes collaboration between work groups and enhances productivity. n Provides agility.
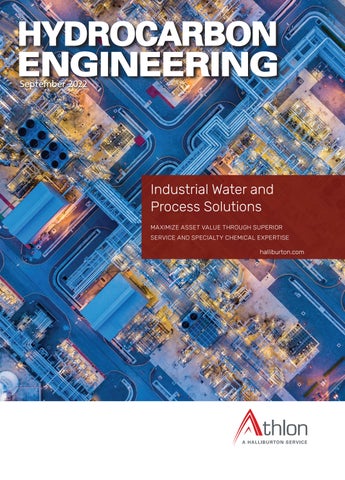
As an example, Figure 1 illustrates how several HTRI software tools connect within each other, with plant data, and with end users – all through a digital platform.
A physical asset (see Figure 1) can be a single heat exchanger, a network of heat exchangers, furnaces, connected pumps, valves, etc. A digital equivalent of the asset is created using HTRI software tools. The data transfer between the data historian and the digital model is fully automated, creating the digital twin of the system. Having a standard set of tools facilitates work groups (individuals, groups or departments), geographically located anywhere, to collaboratively interact with the
digital twin models to make operational, engineering, financial and environmental decisions. For example, operators looking at real-time optimisation and fouling mitigation may work on collaborative projects at the same time as a maintenance group looking into heat exchanger restoration, and with an engineering group who are looking into OPEX and CAPEX projects. This article provides a summary of a successful digital transformation at ENEOS Group refineries in Japan.
Digital transformation
ENEOS Group refineries used SmartPMTM for refinery-wide digital transformation.1, 2 The group is the largest crude oil refiner in Japan, with 11 refineries located across the country (see Figure 2). SmartPM has been used to construct 13 heat exchanger network models for the Group’s refineries, 11 of them being the crude preheat train. Over 30 SmartPM model users across the company utilise the tool for performance monitoring and process optimisation, including: n Monitoring fouling. n Fouling prediction. n Flow split and cleaning schedule optimisation. n Evaluation of antifoulant usage. n Evaluation of retrofit and revamp projects.
Evaluation of different cleaning scenarios
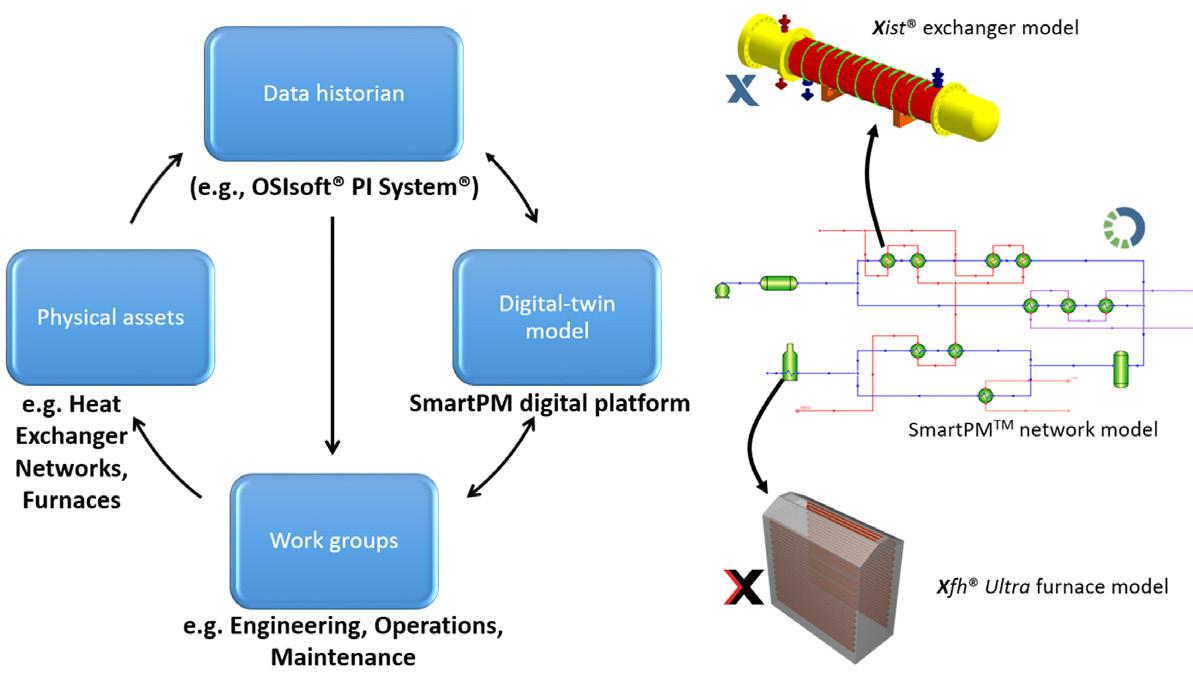
Figure 1. Schematic workflow connecting physical assets to equivalent digital twin models via HTRI technology.
Figure 2. ENEOS Group locations across Japan utilising SmartPM digital twin models. The Group’s Negishi refinery had a cleaning plan before utilising SmartPM (see Figure 3a, Case 1). The software allowed for the generation of a list of heat exchangers and combinations of heat exchangers to clean on a specific date in descending order of the energy benefit, accounting for the network interaction of cleaning a heat exchanger on the entire network thermo-hydraulics. Case 2 (in Figure 3a) discusses the cleaning plan at the refinery, as re-evaluated using SmartPM. Ultimately, the refinery monitored its operation to validate whether the digital model accurately predicted the real performance. Figure 3a is a plot of change in furnace inlet temperature (FIT) over time, including four sets of data. The first set of data illustrated by the dashed line marked ‘No cleaning’ is the FIT profile obtained when no cleaning actions were performed. Above this, marked ‘Case 1: Original expected trend’ shows an approximately 10°C increase in FIT when following the cleaning actions that were initially proposed at the plant. The proposed SmartPM cleaning sequence in Case 2 shows a further 5°C increase compared to Case 1. After the plant followed the cleaning schedule in Case 2, the FIT profile was obtained, shown in the scattered data marked ‘Plant data after cleaning’. When the plant operation reached steady state following the disturbance after cleaning, it was possible to observe that the actual FIT trend followed the software’s prediction. SmartPM enabled the Marifu refinery to significantly reduce the associated workload, for cleaning optimisation. The conventional cleaning method combined chemical and mechanical cleaning over three cleaning events involving the cleaning of 20 shells. Analysis showed that the conventional cleaning method was less beneficial than the SmartPM proposed cleaning schedule, which included the mechanical cleaning of 10 shells over four cleaning events. The benefit achieved was both in terms of improved energy recovery, as shown in the area plot comparison of FIT over time, and the reduced number of cleaning events (see Figure 3b).
Figure 4a is a simple illustration of a section of the preheat train at the Osaka refinery. The crude preheat train divides into three parallel branches following a preflash. The original operation was to maintain equal outlet temperatures of the three parallel branches by adjusting the flow splits (which were set at 63%, 19% and 19%). The SmartPM optimisation
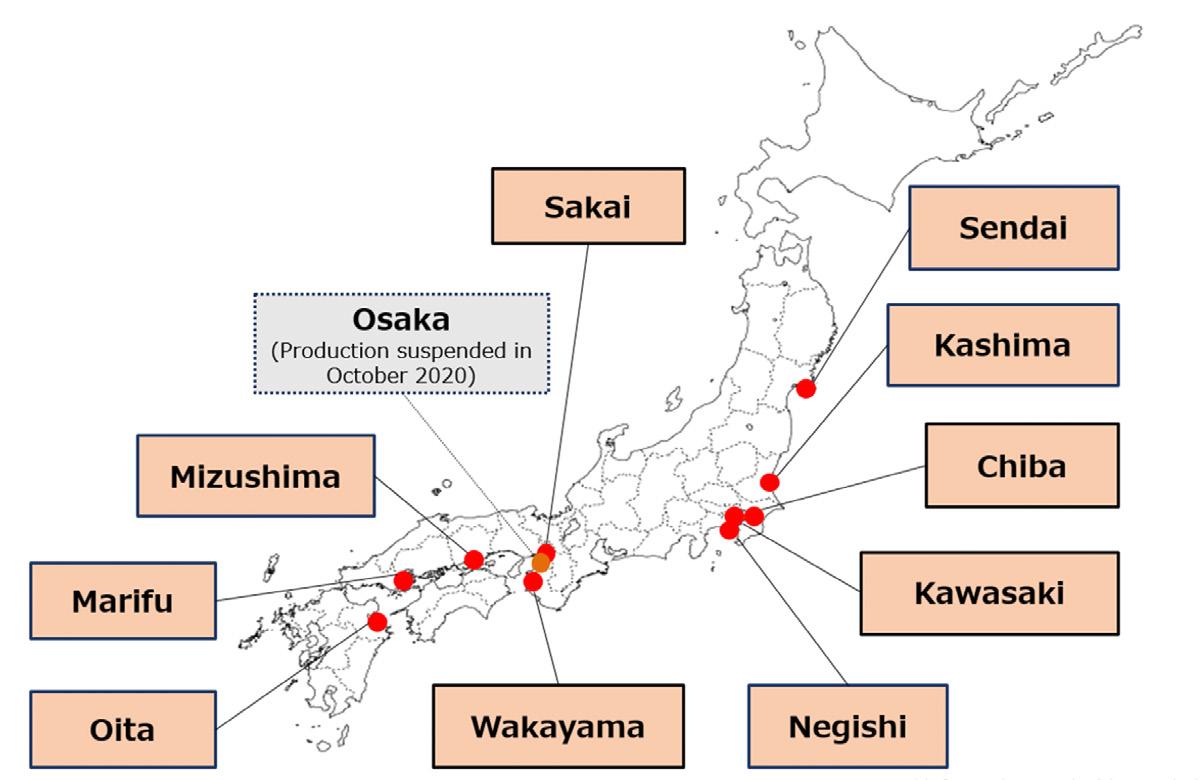

Figure 3. Comparison of FIT at the Negishi refinery preheat train for different cleaning strategies (a). FIT profile comparing the conventional and optimised cleaning process at the Marifu refinery (b).
Figure 4. A schematic of the post-preflash section of a preheat train with three parallel branches (left). Original flow splits of 63%, 19% and 19% were changed to 44%, 27% and 29% in the study. FIT profile before and after monitoring flow split optimisation (right).
Figure 5. Predicted fouling prediction superimposed on monitored fouling resistance profile for two exchangers and two periods when two different antifoulants were used (a). Comparison of FIT for different antifoulant usage (b).

study identified the best flow split to maximise the mixed FIT temperature, resulting in a 44, 27, 29% flow split. Figure 4b shows the FIT variation over time. The bottom line shows the FIT trend under conventional operation. The optimised line, which is 1.5°C above the conventional line, shows the optimised performance. It is also observed that the monitoring data that was obtained following the flow split optimisation followed the SmartPM prediction. Antifoulant usage optimisation at the ENEOS Group Osaka refinery At the Osaka refinery, antifoulants are used on a daily basis, and different antifoulants are used over specific periods. Evaluating the impact of antifoulants was not straightforward, given the dynamic variation in operating conditions. The changes in operating conditions are not limited to changes in flow rates and temperatures but also involve changes in valve openings, exchanger bypasses, exchangers being offline, etc. SmartPM was used to perform data reconciliation and fit ‘dynamic fouling models’ for the crudes for periods when different antifoulants were used. Dynamic fouling models are used to predict fouling under changing operating conditions. The fouling model is defined for a stream. Fouling is a function of the stream chemistry, which is the type of crude/antifoulant blend, operating conditions that represent the changing surface temperatures and flow parameters within units, and the metallurgy of the surface (such as if the unit is CS, SS, special alloy, etc). A detailed description of the dynamic fouling models is presented elsewhere.3, 4
For each antifoulant/crude blend, the tendency of fouling (quantified by the fouling propensity factor) is identified through fouling model analysis utilising historical exchanger operation. Past performance is simulated using the fitted fouling model for model validation prior to performing prediction studies. The result is the fouling prediction superimposed on top of the historical fouling resistances for all exchangers. Two examples shown in Figure 5a represent periods when two different antifoulants were used. These plots of fouling
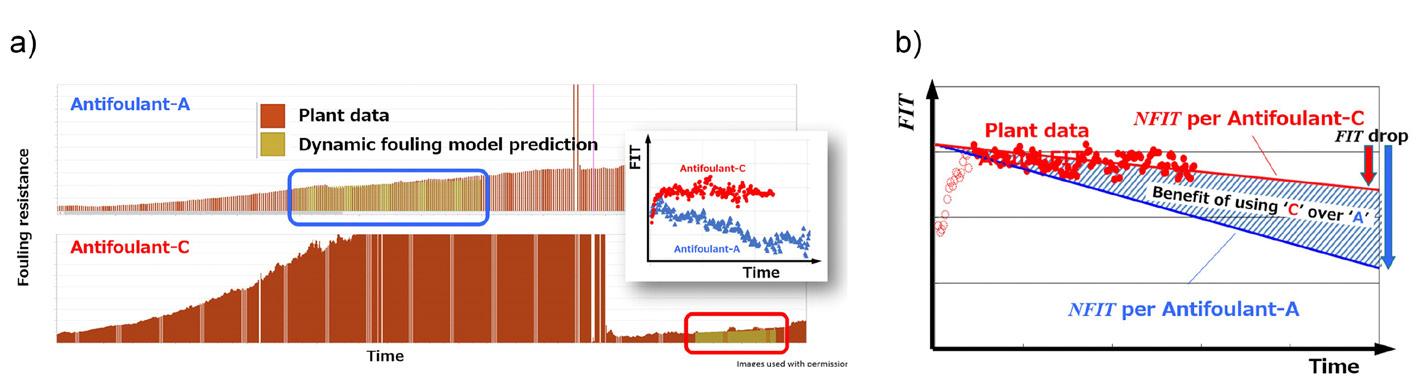
Table 1. Summary of three different antifoulants and evaluated drop in FIT over a specified period
Antifoulant Drop in FIT (°C)
A 19.1
B 17.3
C 7.8
resistances change over time, and it is visible on the FIT plot that the different antifoulants affect how fast the FIT drops, which is related to the fouling resistance changes for each unit.
Table 1 shows the summary performances of three different antifoulants (A, B and C) based on the drop in FIT over time. Figure 5b shows the FIT variation over time for three sets of data. The steepest line, marked NFIT per antifoulant A, is the prediction of FIT under a normalised condition (i.e. at a fixed stream temperature and flow inlet conditions). The NFIT per antifoulant C indicates the prediction of the FIT drop using antifoulant C under the same normalised condition as antifoulant A. The plant data show the actual FIT drop using antifoulant C, which follows the prediction. The difference in FIT drop, in this case using antifoulant C, is a drop of only 7.8°C compared to 19.1°C, resulting in a difference in drop of 11.3°C over a specified cycle period. This change in drop can be converted to economic parameters to quantify the efficacy of using one antifoulant over another, leading to the analysis of the maximum viable cost that can be paid for using a certain antifoulant compared to another.
SmartPMHalfPgResize_final.pdf 1 8/9/22 12:25 PM
Conclusion
The importance of digital transformation has been illustrated in this article through several examples from ENEOS Group refineries. Conventionally, many of the studies involving conventional cleaning, use of additives such as antifoulants, optimising operations such as flow splits, and CAPEX-heavy projects had to be carried out independently of each other. Digital transformation tools are perceived to open possibilities by performing systematic combined optimisation analyses, identifying the overall impact on the network level, while incorporating individual operational strategies and technical constraints.
References
1. OKADA, T., ‘Digital Transformation of Crude Preheat Train
Fouling Management through SmartPM’, 46th Refining Panel
Discussion Meeting, Japan, (2022). 2. ISHIYAMA, E. M., KENNEDY, J., OAKLEY, D., ZETTLER, H. U., and PUGH, S. J., ‘Fouling Management through Digital
Transformation’, 14th International Conference on Heat
Exchanger Fouling and Cleaning, Wagrain, Austria, (2022). 3. WILSON, D. I., ISHIYAMA, E. M., and POLLEY, G. T., ‘Twenty Years of Ebert and Panchal – What Next?’, Heat Transfer Engineering,
Vol. 38, No. 7 – 8, (2017), pp. 669 – 680. 4. ISHIYAMA, E. M., JUHEL, C., AQUINO, B., HAGI, H., PUGH,
S. J., GOMEZ SUAREZ, E., KENNEDY, J., and ZETTLER, H. U.,
‘Advanced Fouling Management through Use of HTRI SmartPM:
Case Studies from Total Refinery CDU Preheat Trains’,
Heat Transfer Engineering, Vol. 0, No. 0, (2021), pp. 1 – 13.