15 minute read
CHARTS


‘Exactly, there is a plan to have a natural ecosystem information, geographic information system. So where all the minerals in Nasarawa State, their locations, their quantum are explored and listed so that it is opened to the world’ ‘I said earlier they should upgrade, we need to have the current facility that will enable the process to function effectively and secondly, we need more of professionals if only they can take time to sample round the state, there are some hidden talents, there are some few professionals that can adequately manipulate the information system, but just to be in 1 place and you know looking round is not enough, let them go round we have, maybe advertize, open up people to come and you know apply. That’s where you test them, and can be able to sample or hand pick the professionals amongst them.’ The resulting overall analysis in terms of sentiment is shown in the charts below.
Advertisement
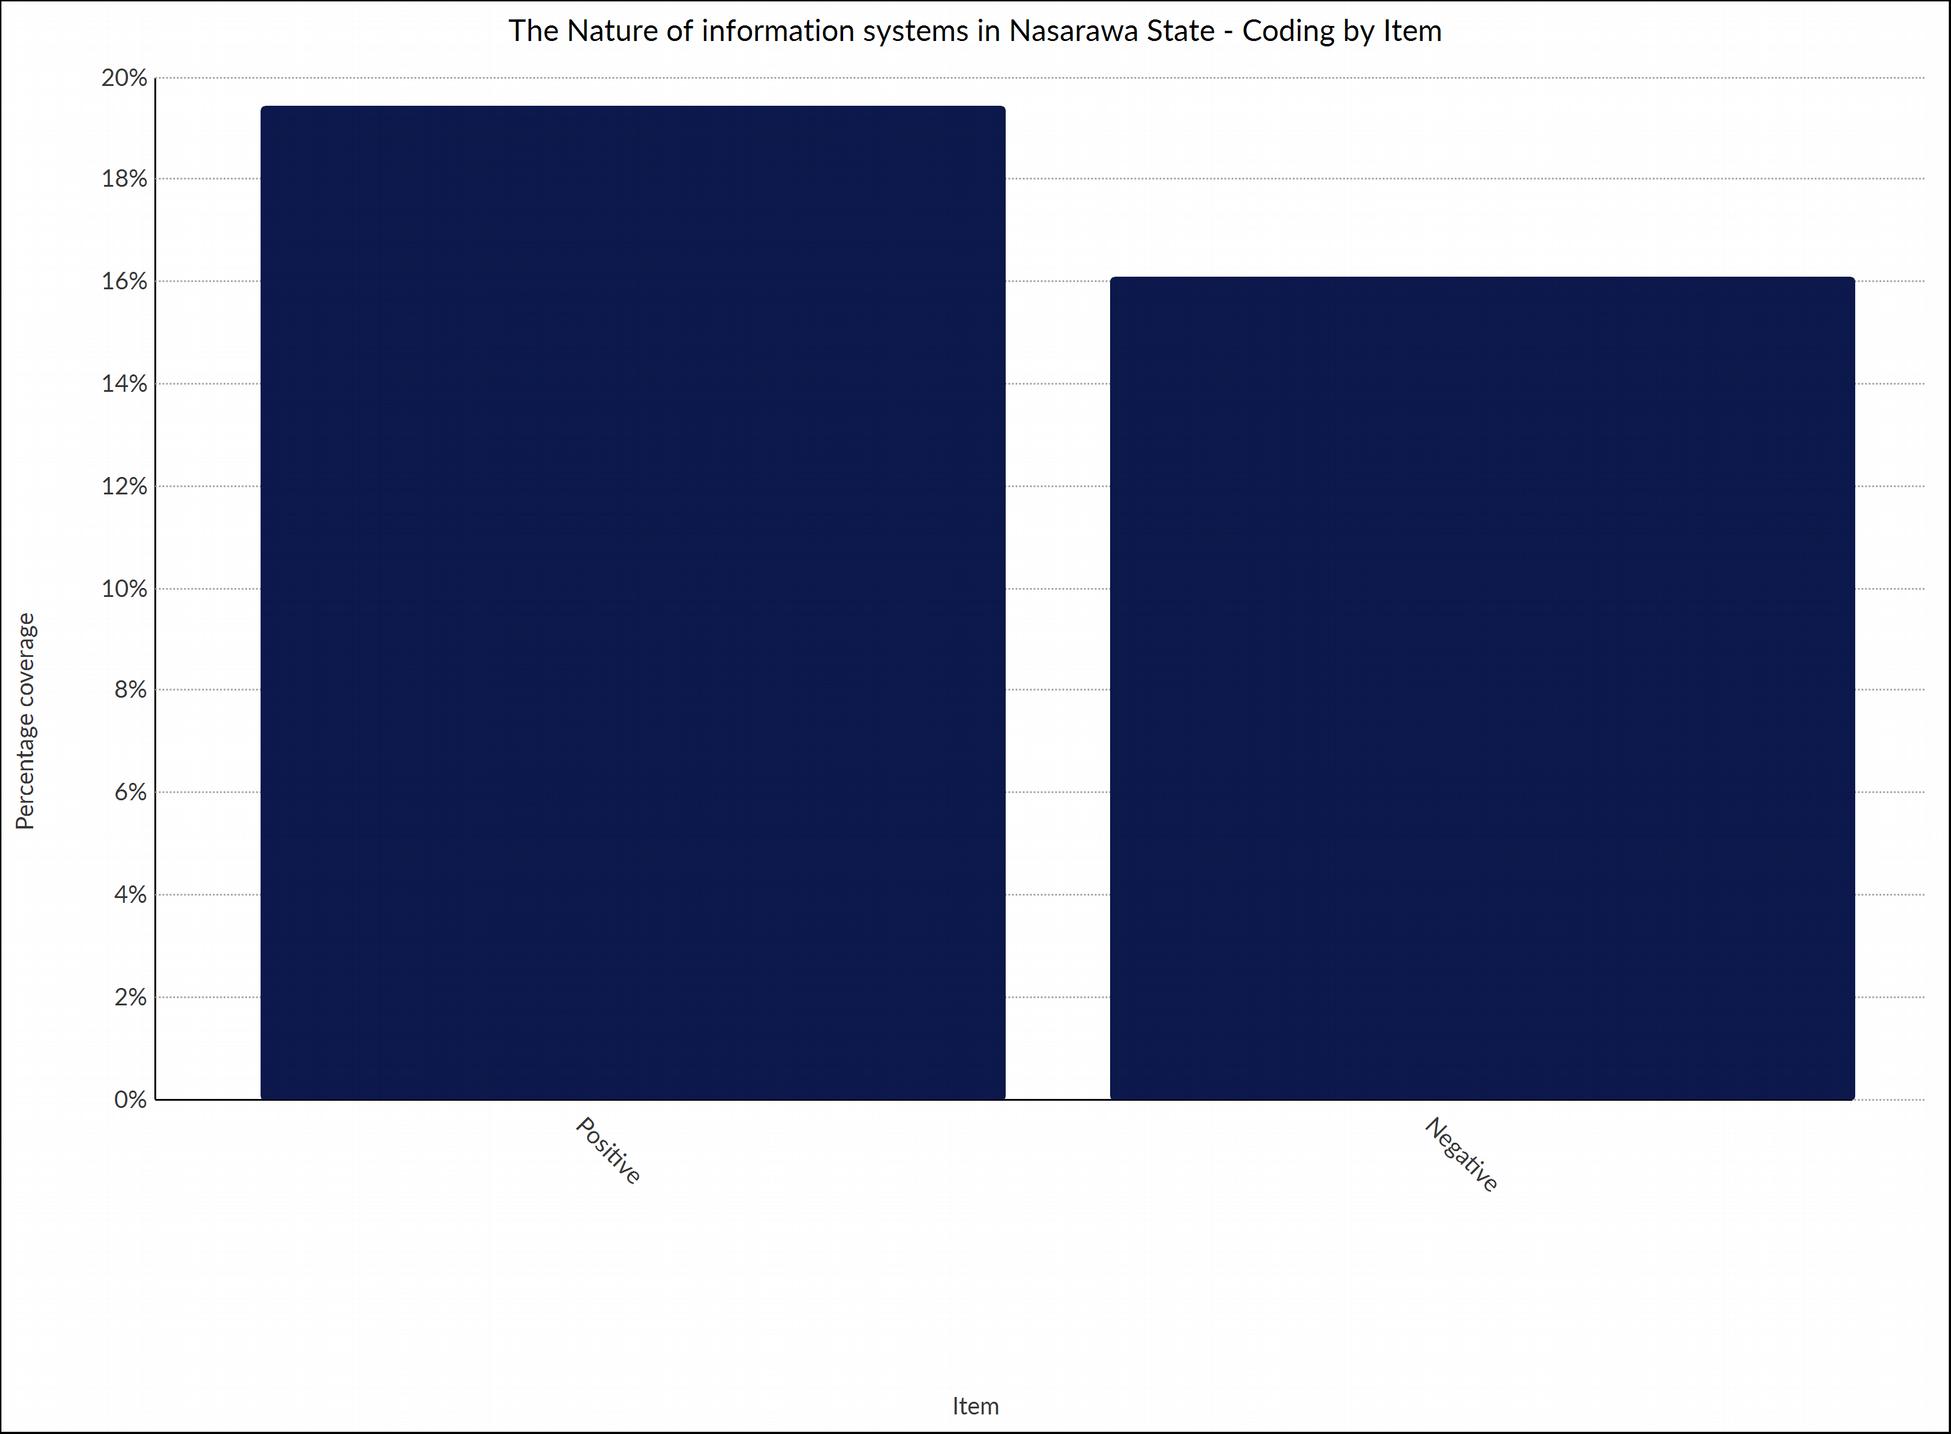
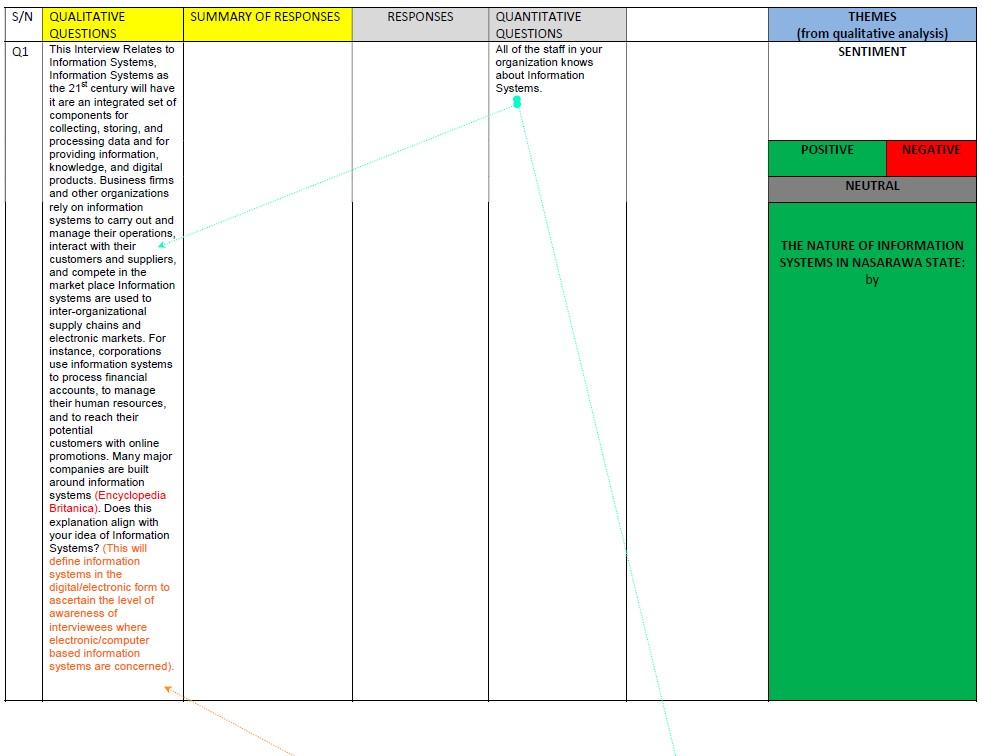
Chart 1 shows Qualitative analysis Q1 sentiment behavior of respondents with regards their idea of Information Systems aligning with 21st century ideal information systems
Chart 2 shows comprehensive Qualitative analysis Q1 sentiment behavior of respondents with regards their idea of Information Systems aligning with 21
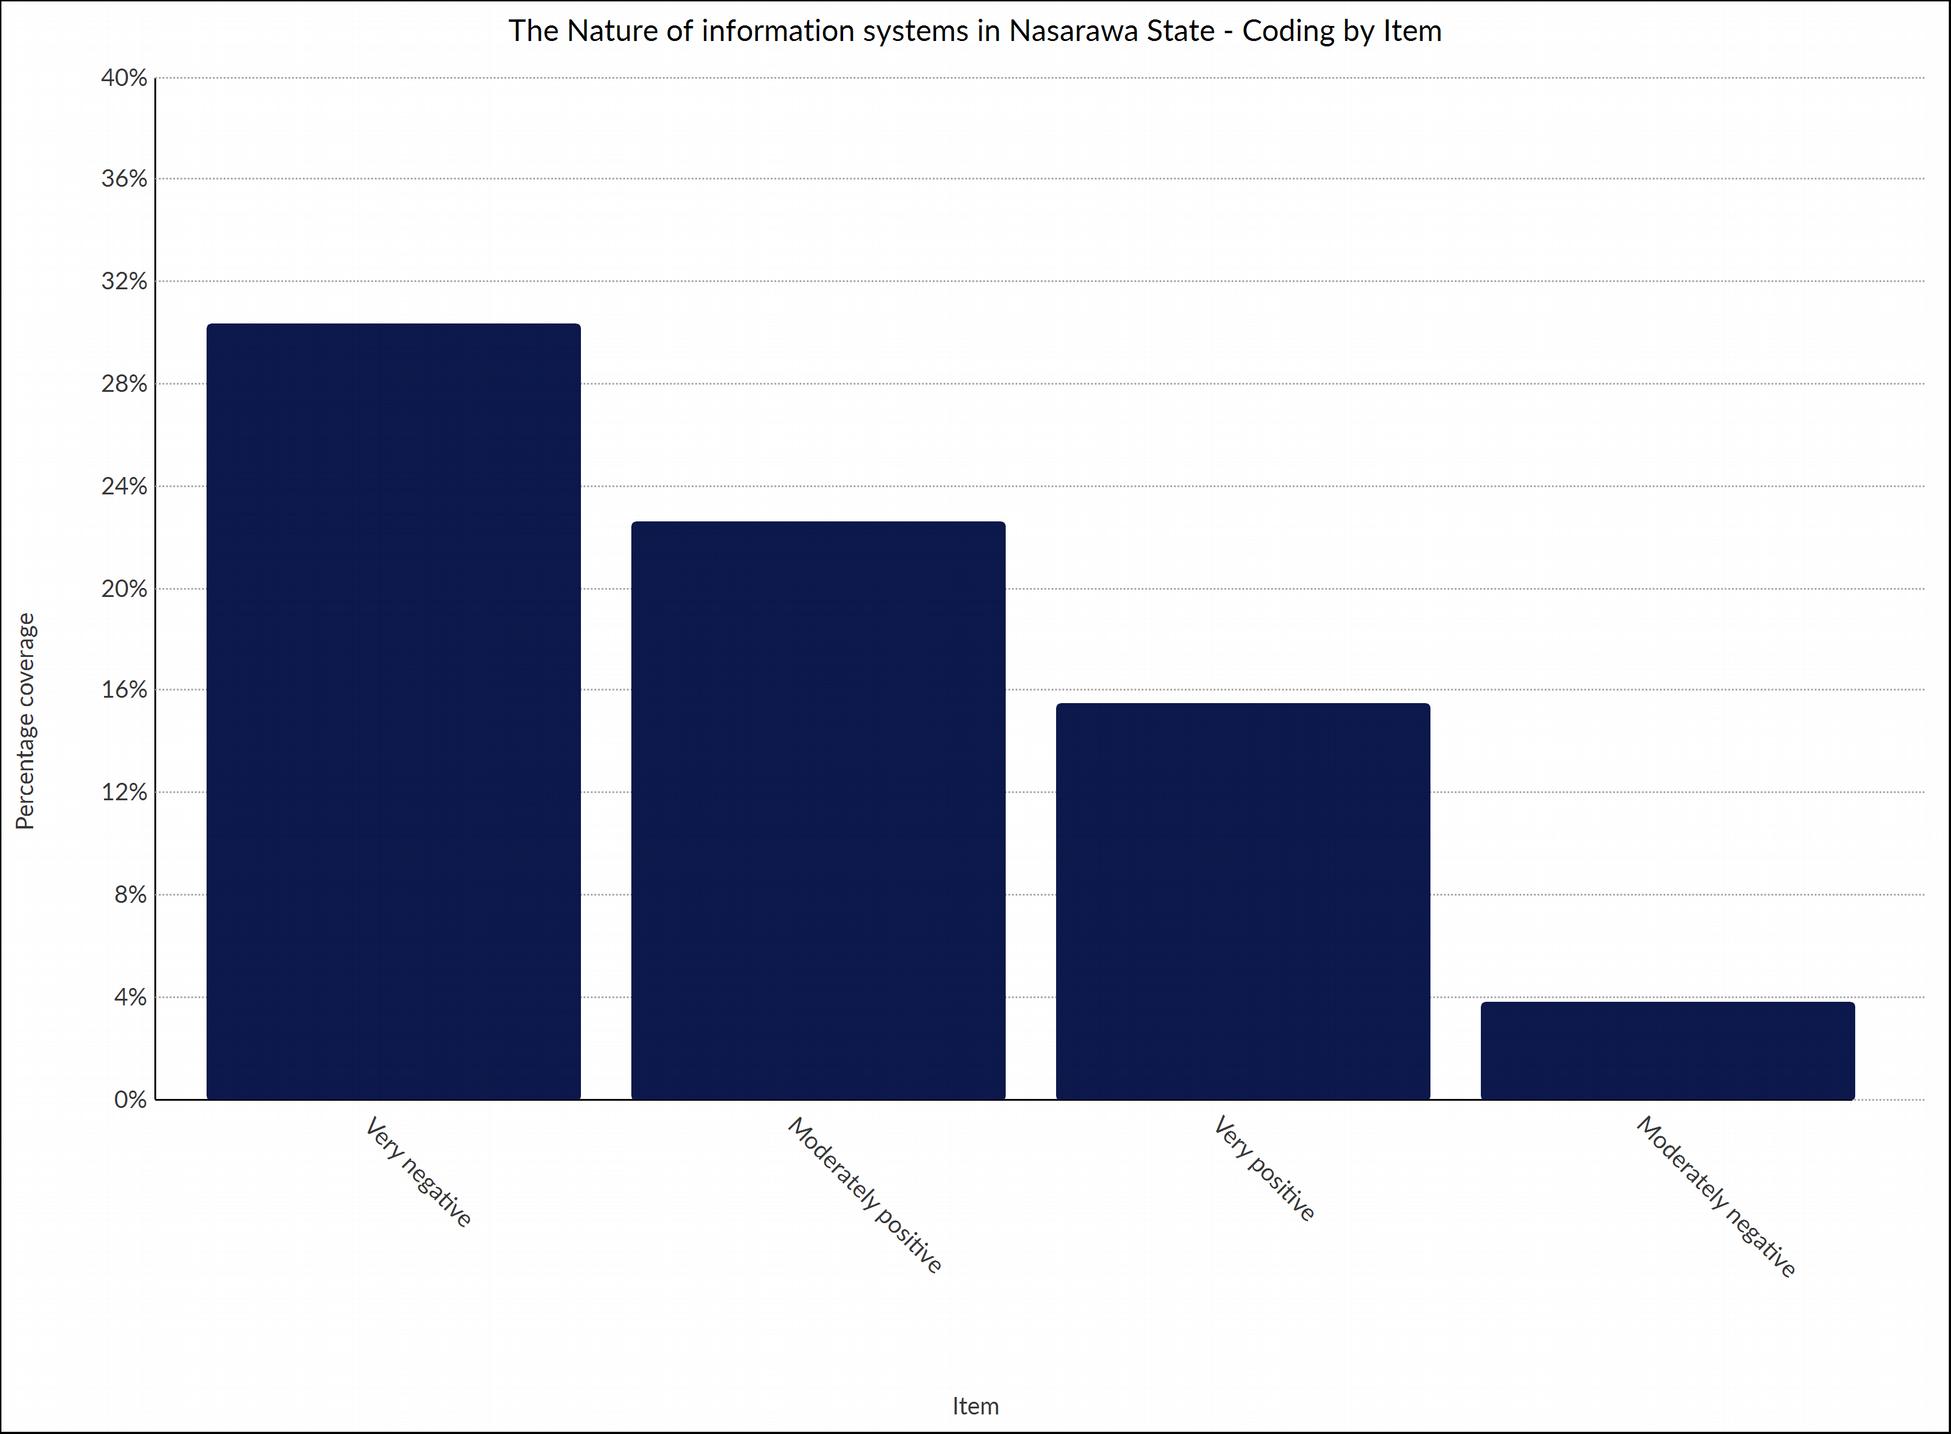
st century ideal information systems
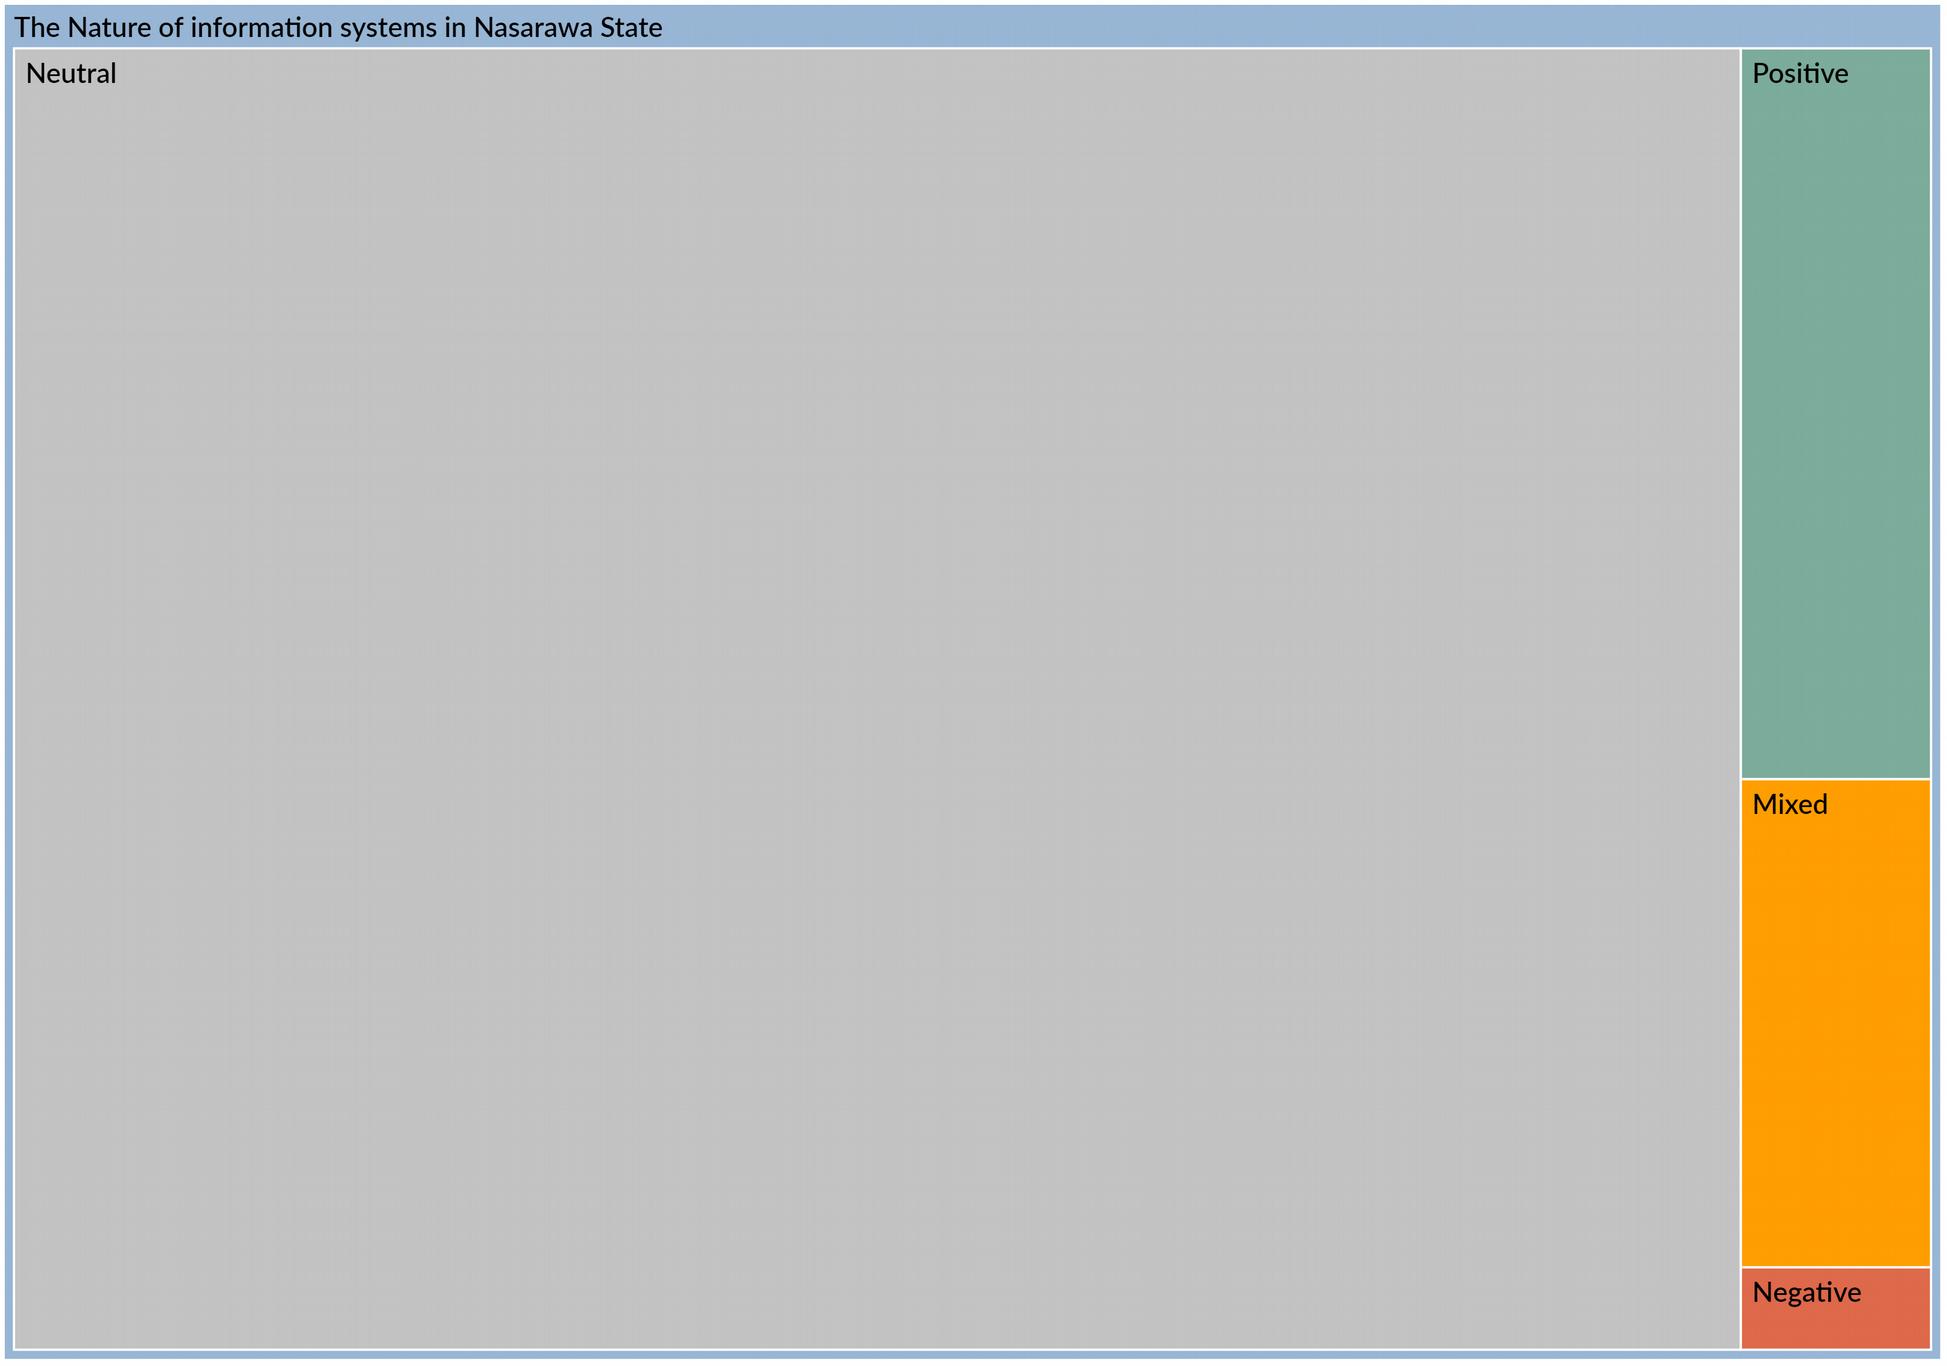
It is important to show the varying responses of the interviewees in this study basing on Mihailescu and Mihailescu’s (2010) attempt to point out theoretical perspectives applied in conceptualizing Information Systems Development Methodologies. With outstanding clarity this study agrees with their deductions that despite the availability of large amounts of knowledge on ISDM, variations in disciplinary interests fragment the assessments of Information Systems making it a multi-perspective cross discipline occurrence (Mihailescu and Mihailescu, 2010). It is difficult at this point to really conclude that the nature of information systems in Nasarawa state is negative. However, following other elements in the sub-themes such as displayed in the charts below:
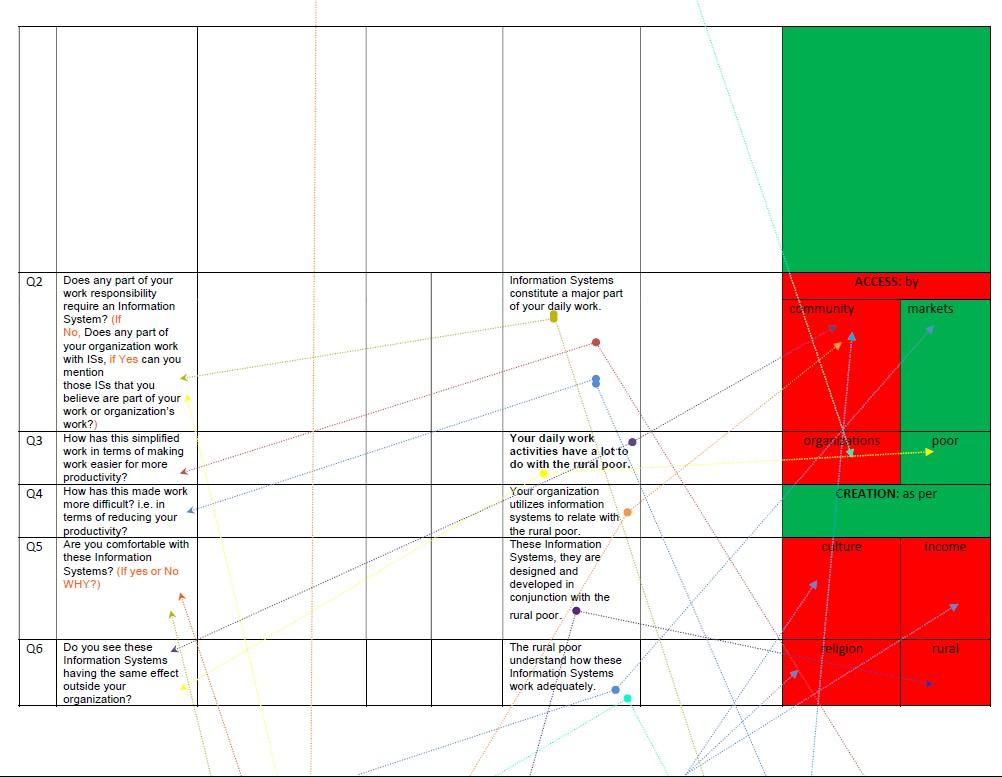
Chart 3 shows sentiment behavior of respondents with regards accessibility by stakeholders to key information systems resource facilities.
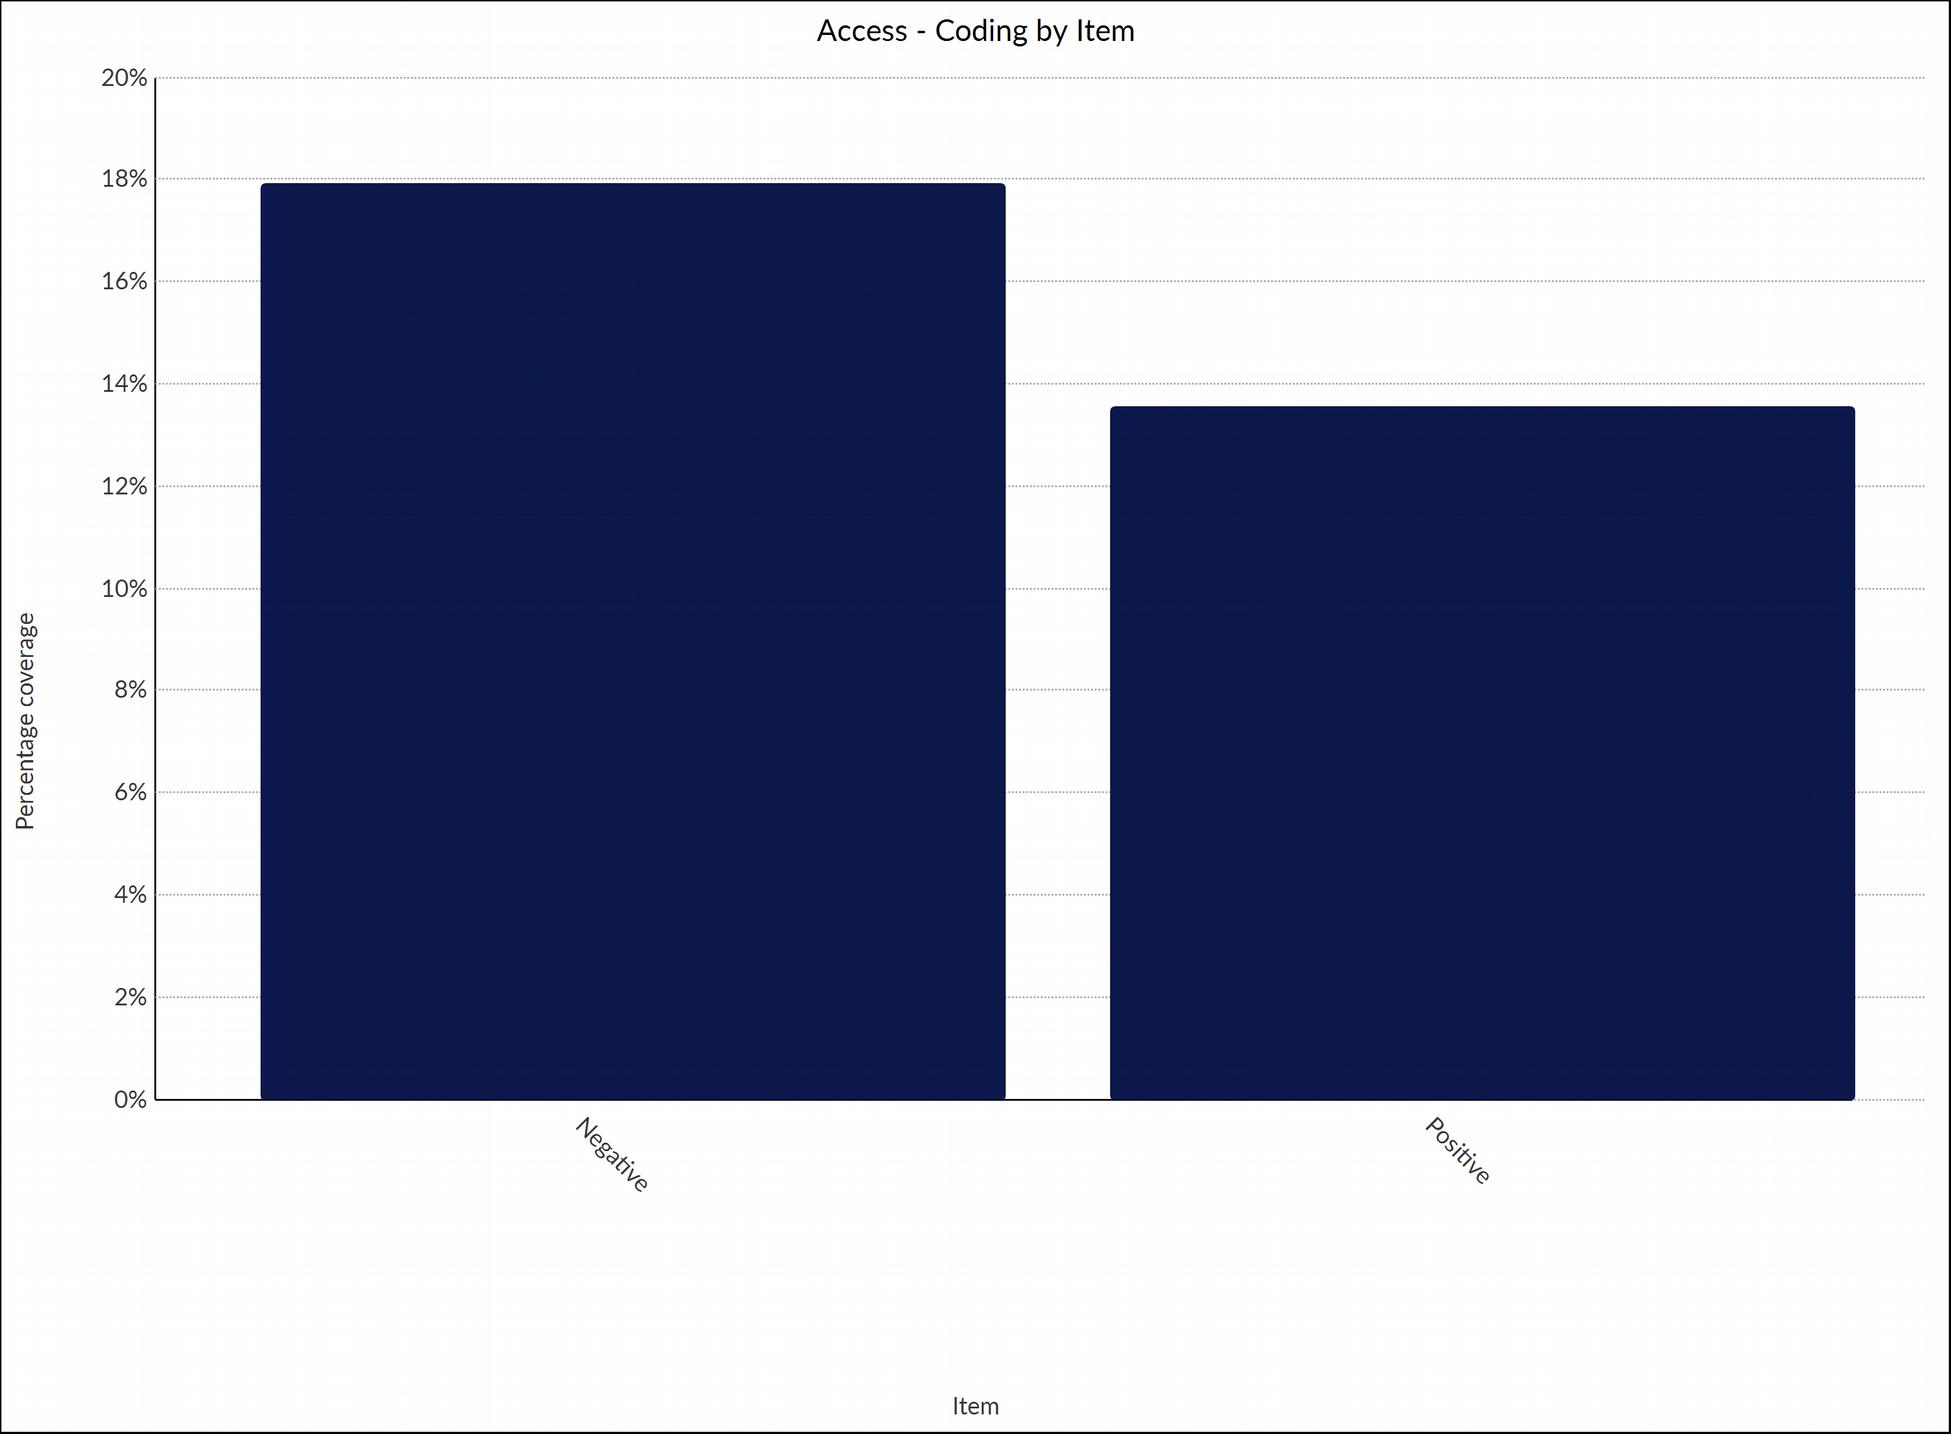
Chart 4 shows comprehensive sentiment behavior of respondents with regards accessibility by stakeholders to key information systems resource facilities.
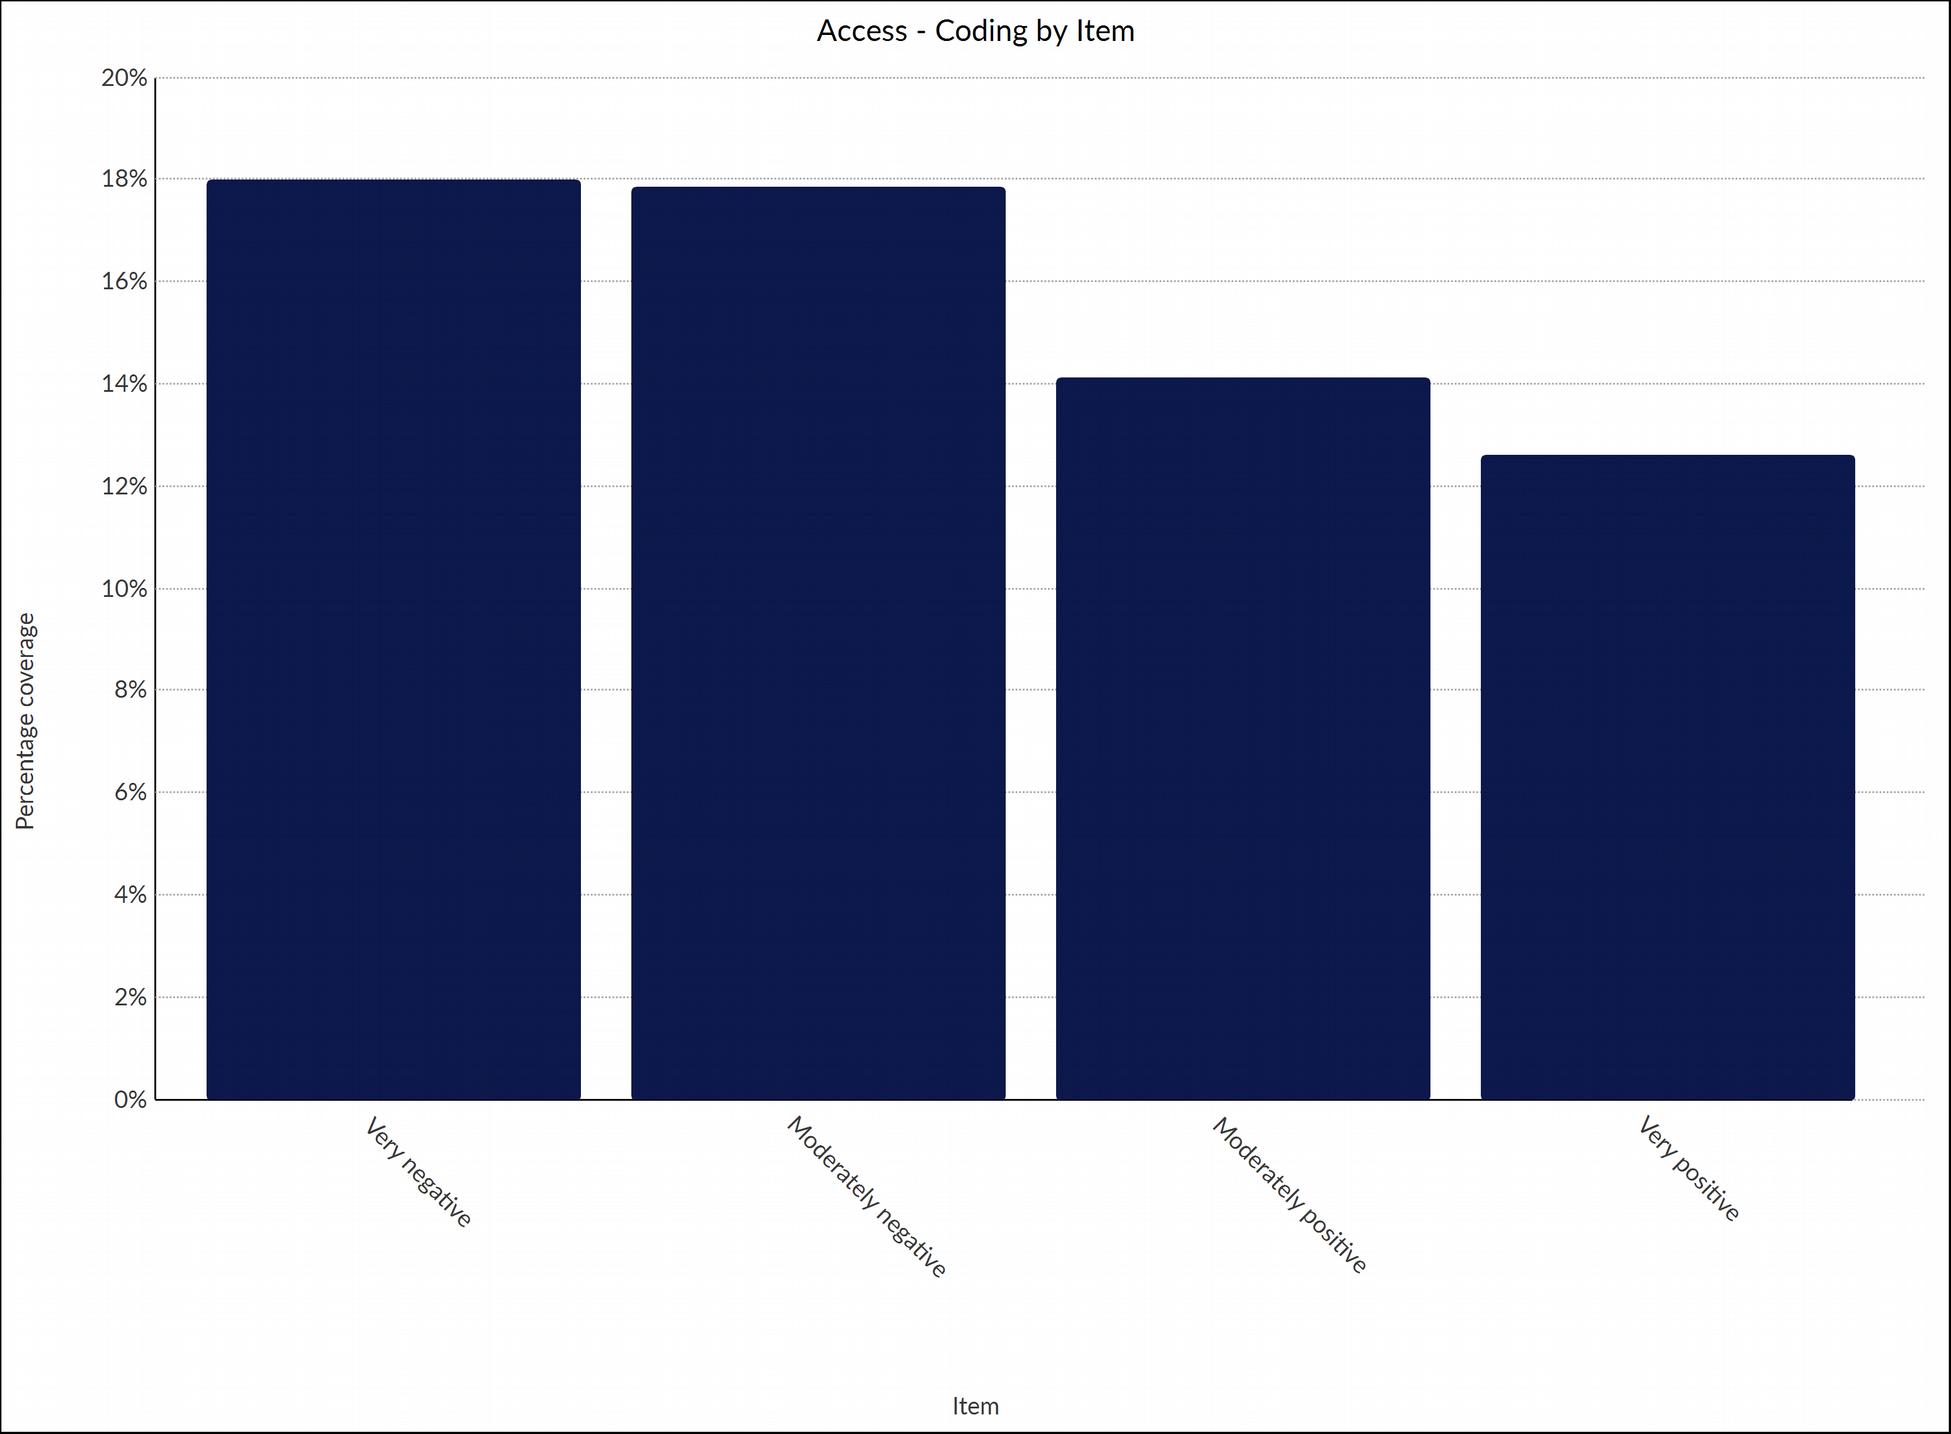
Chart 5 shows sentiment behavior of respondents with regards involvement of stakeholders in the creation of information systems infrastructure.
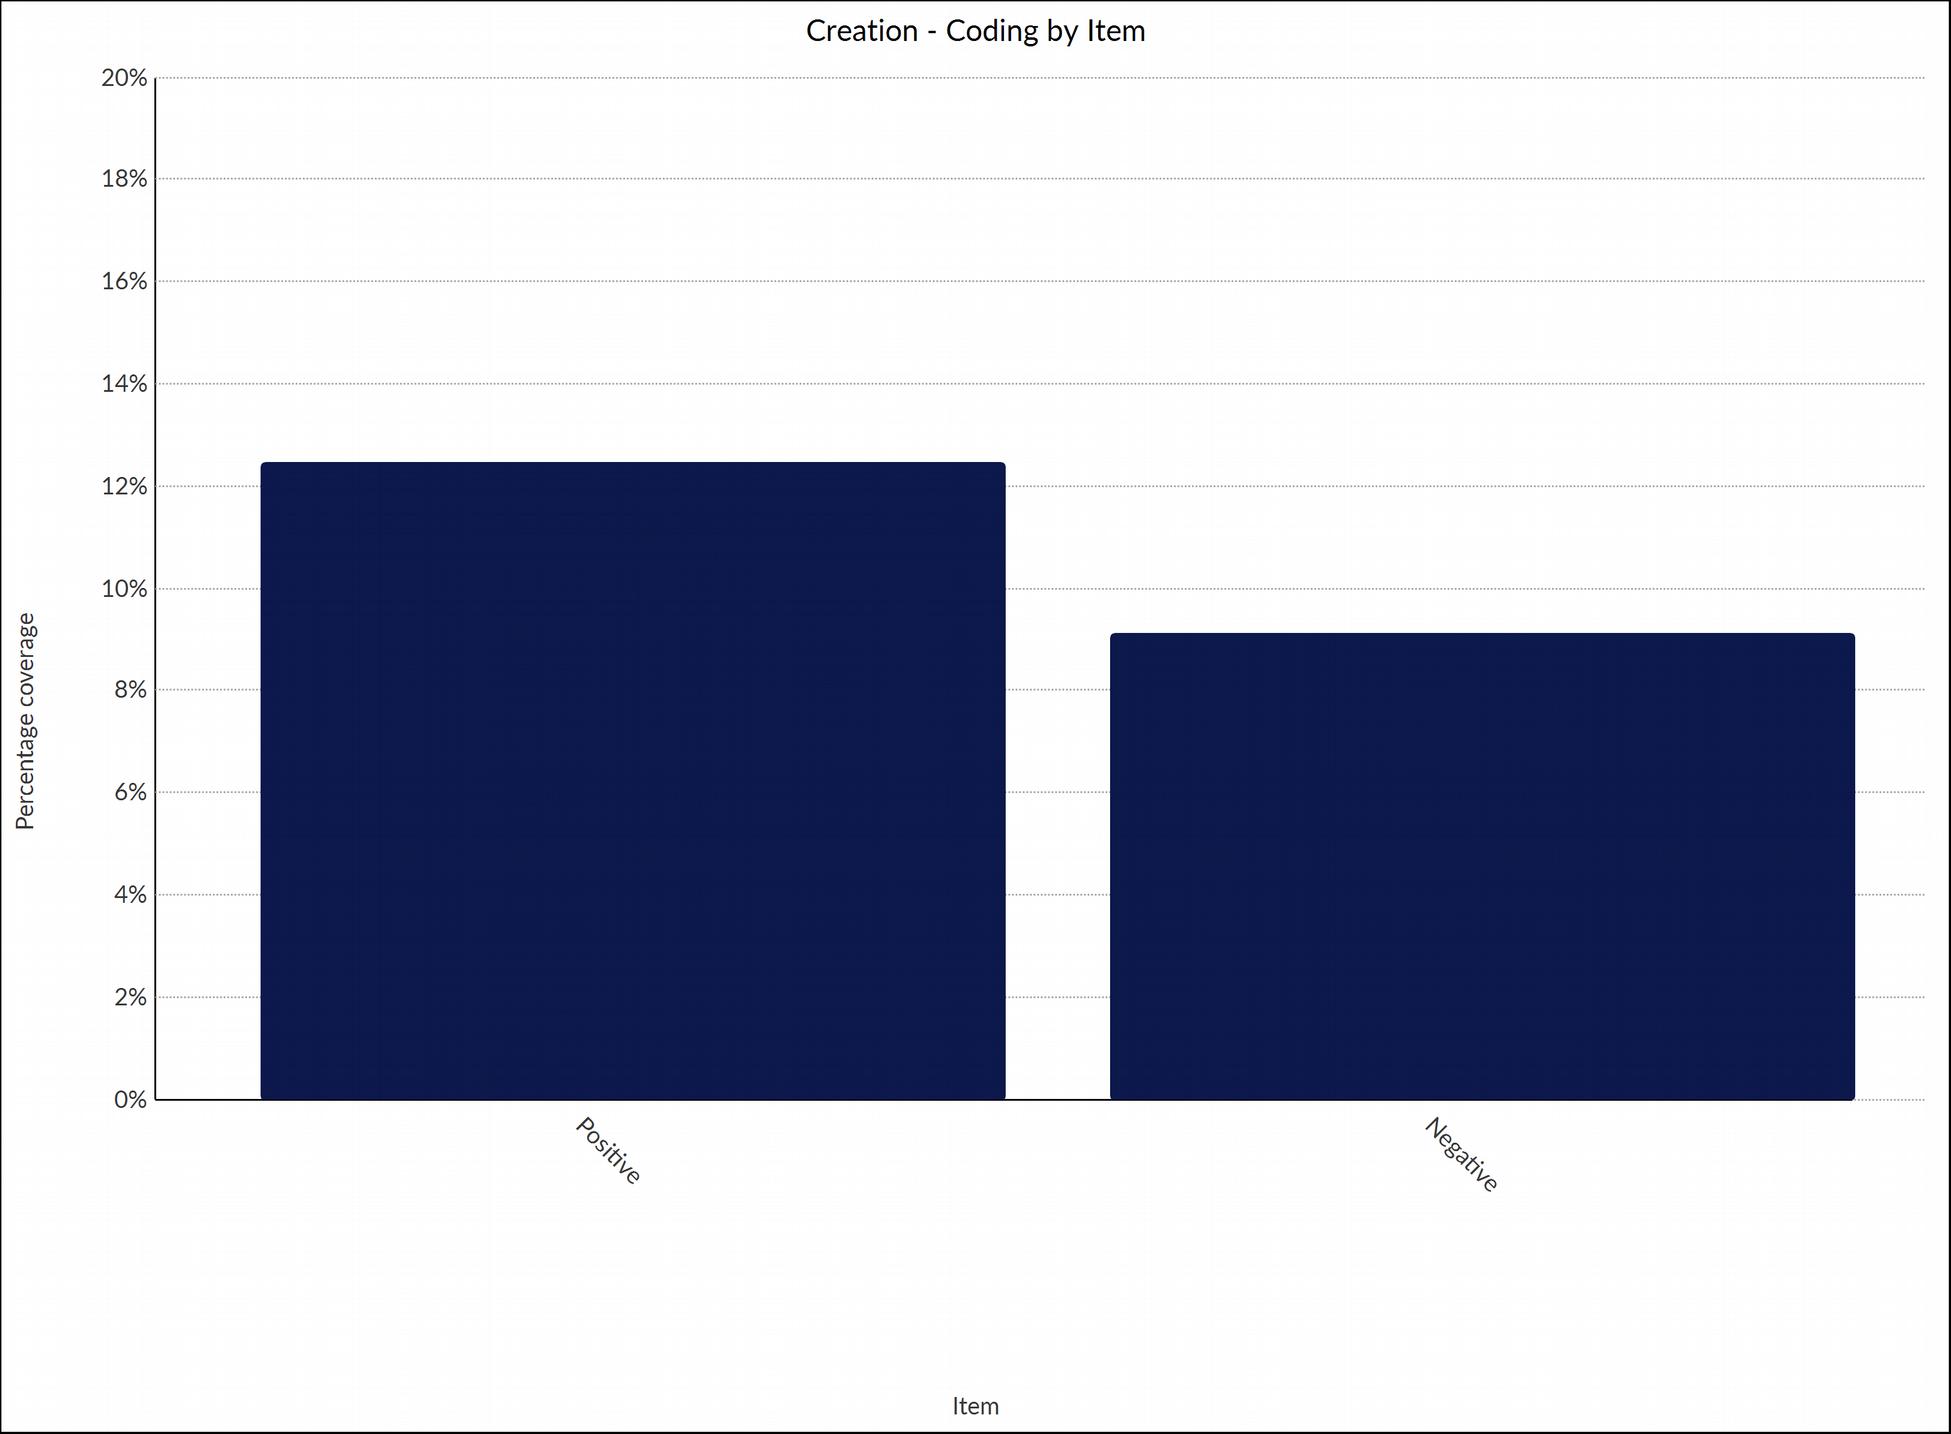
Chart 6 shows comprehensive sentiment behavior of respondents with regards involvement of stakeholders in the creation of information systems infrastructure.
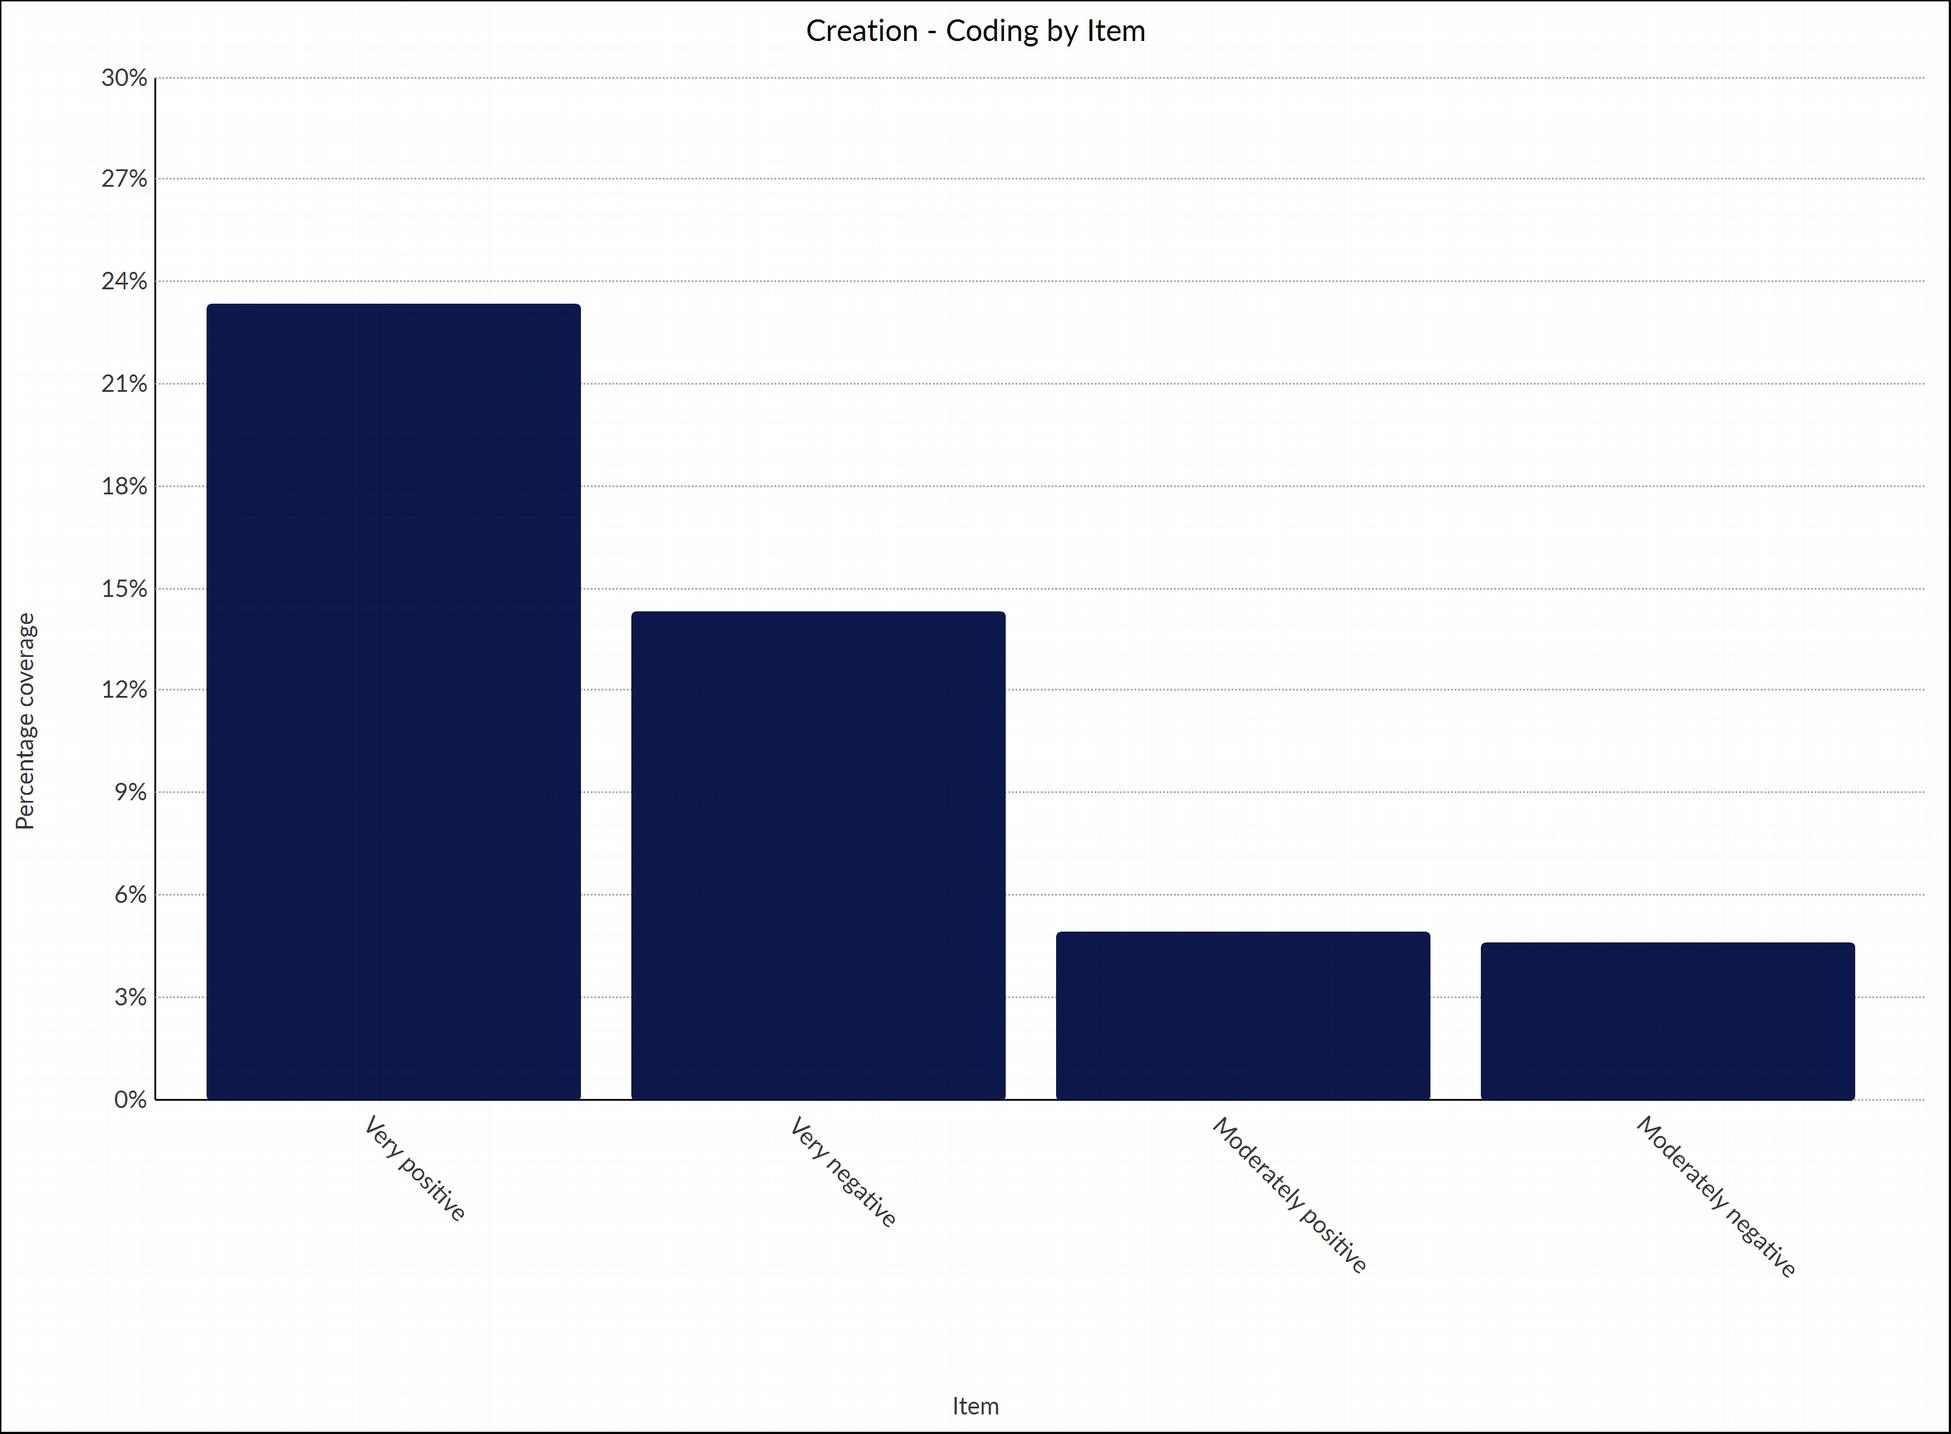
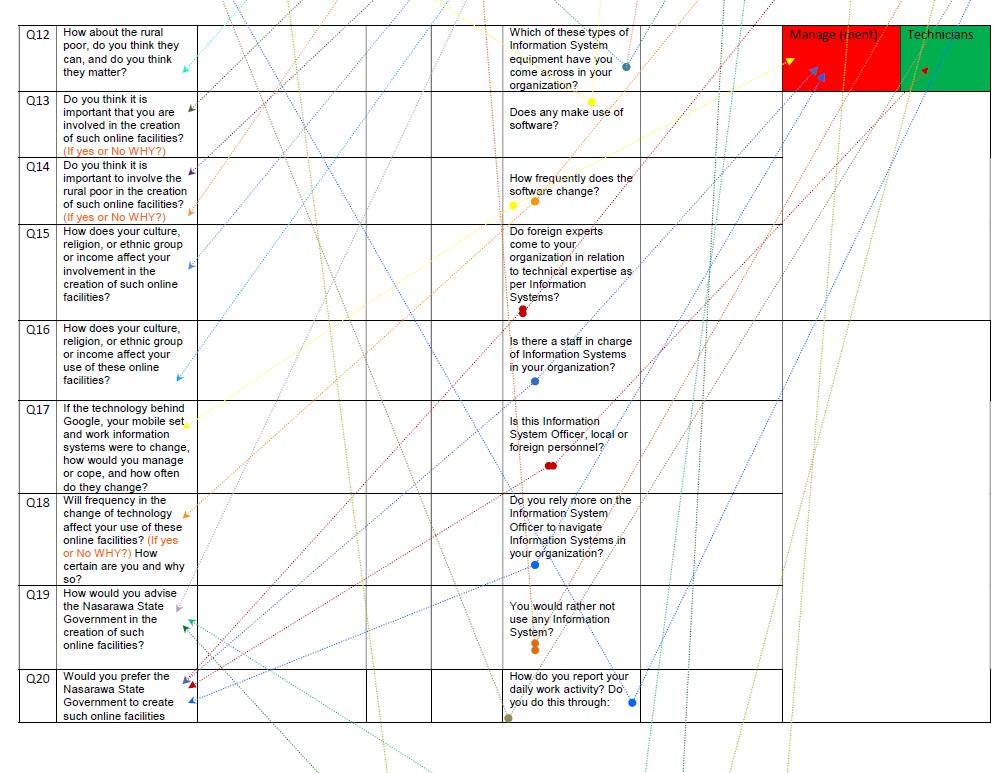
Chart 7 shows sentiment behavior of respondents with regards improvement of capacity and mindset of stakeholders in relation to concepts of information systems.
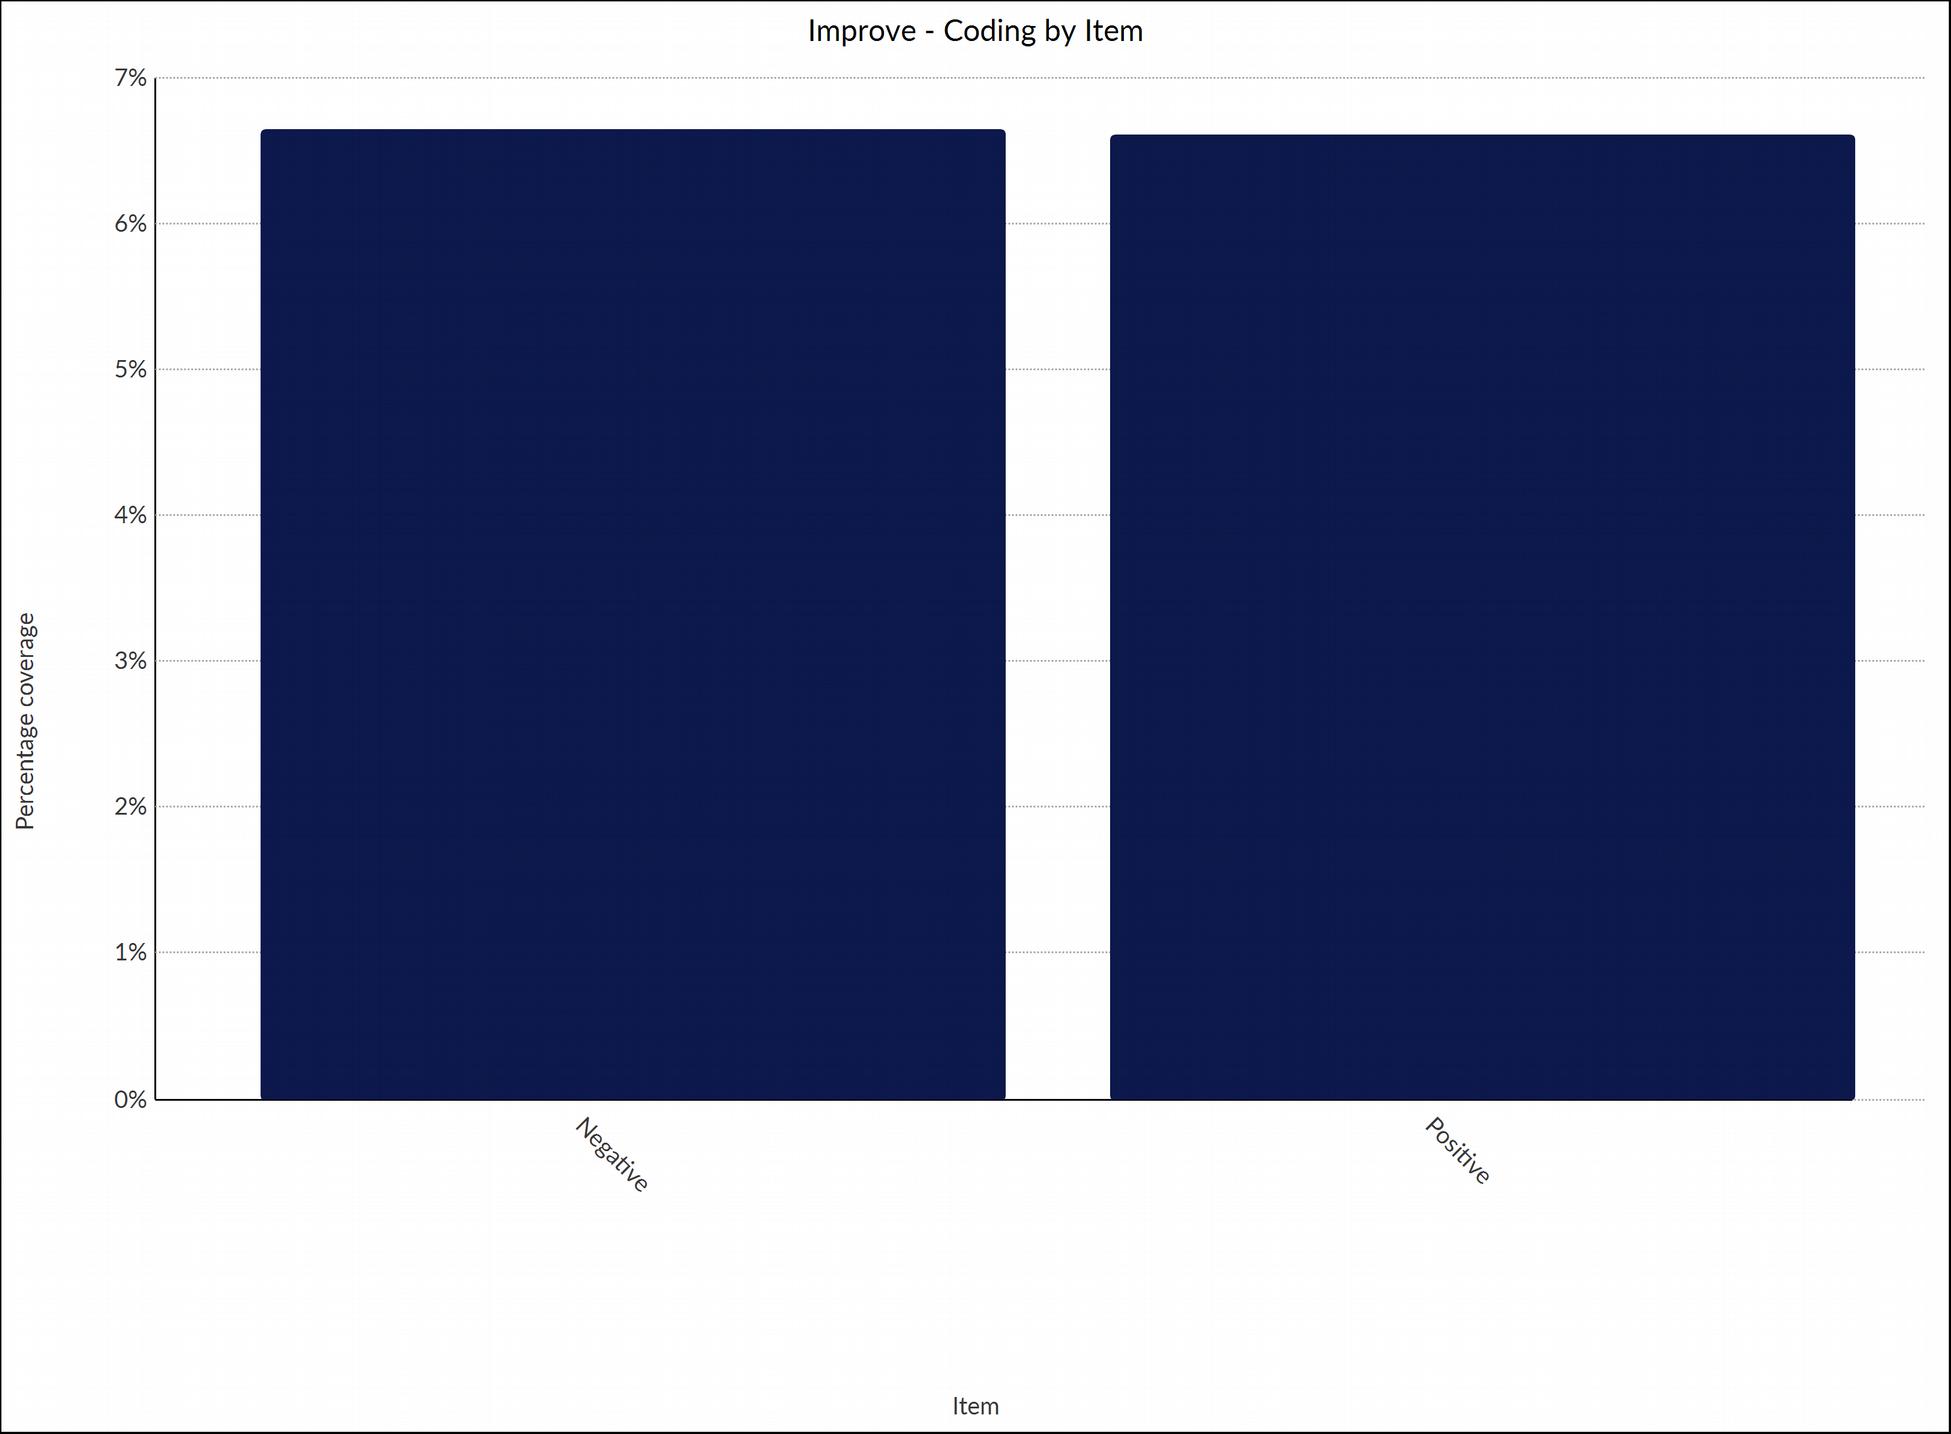
Chart 8 shows comprehensive sentiment behavior of respondents with regards improvement of capacity and mindset of stakeholders in relation to concepts of information systems.
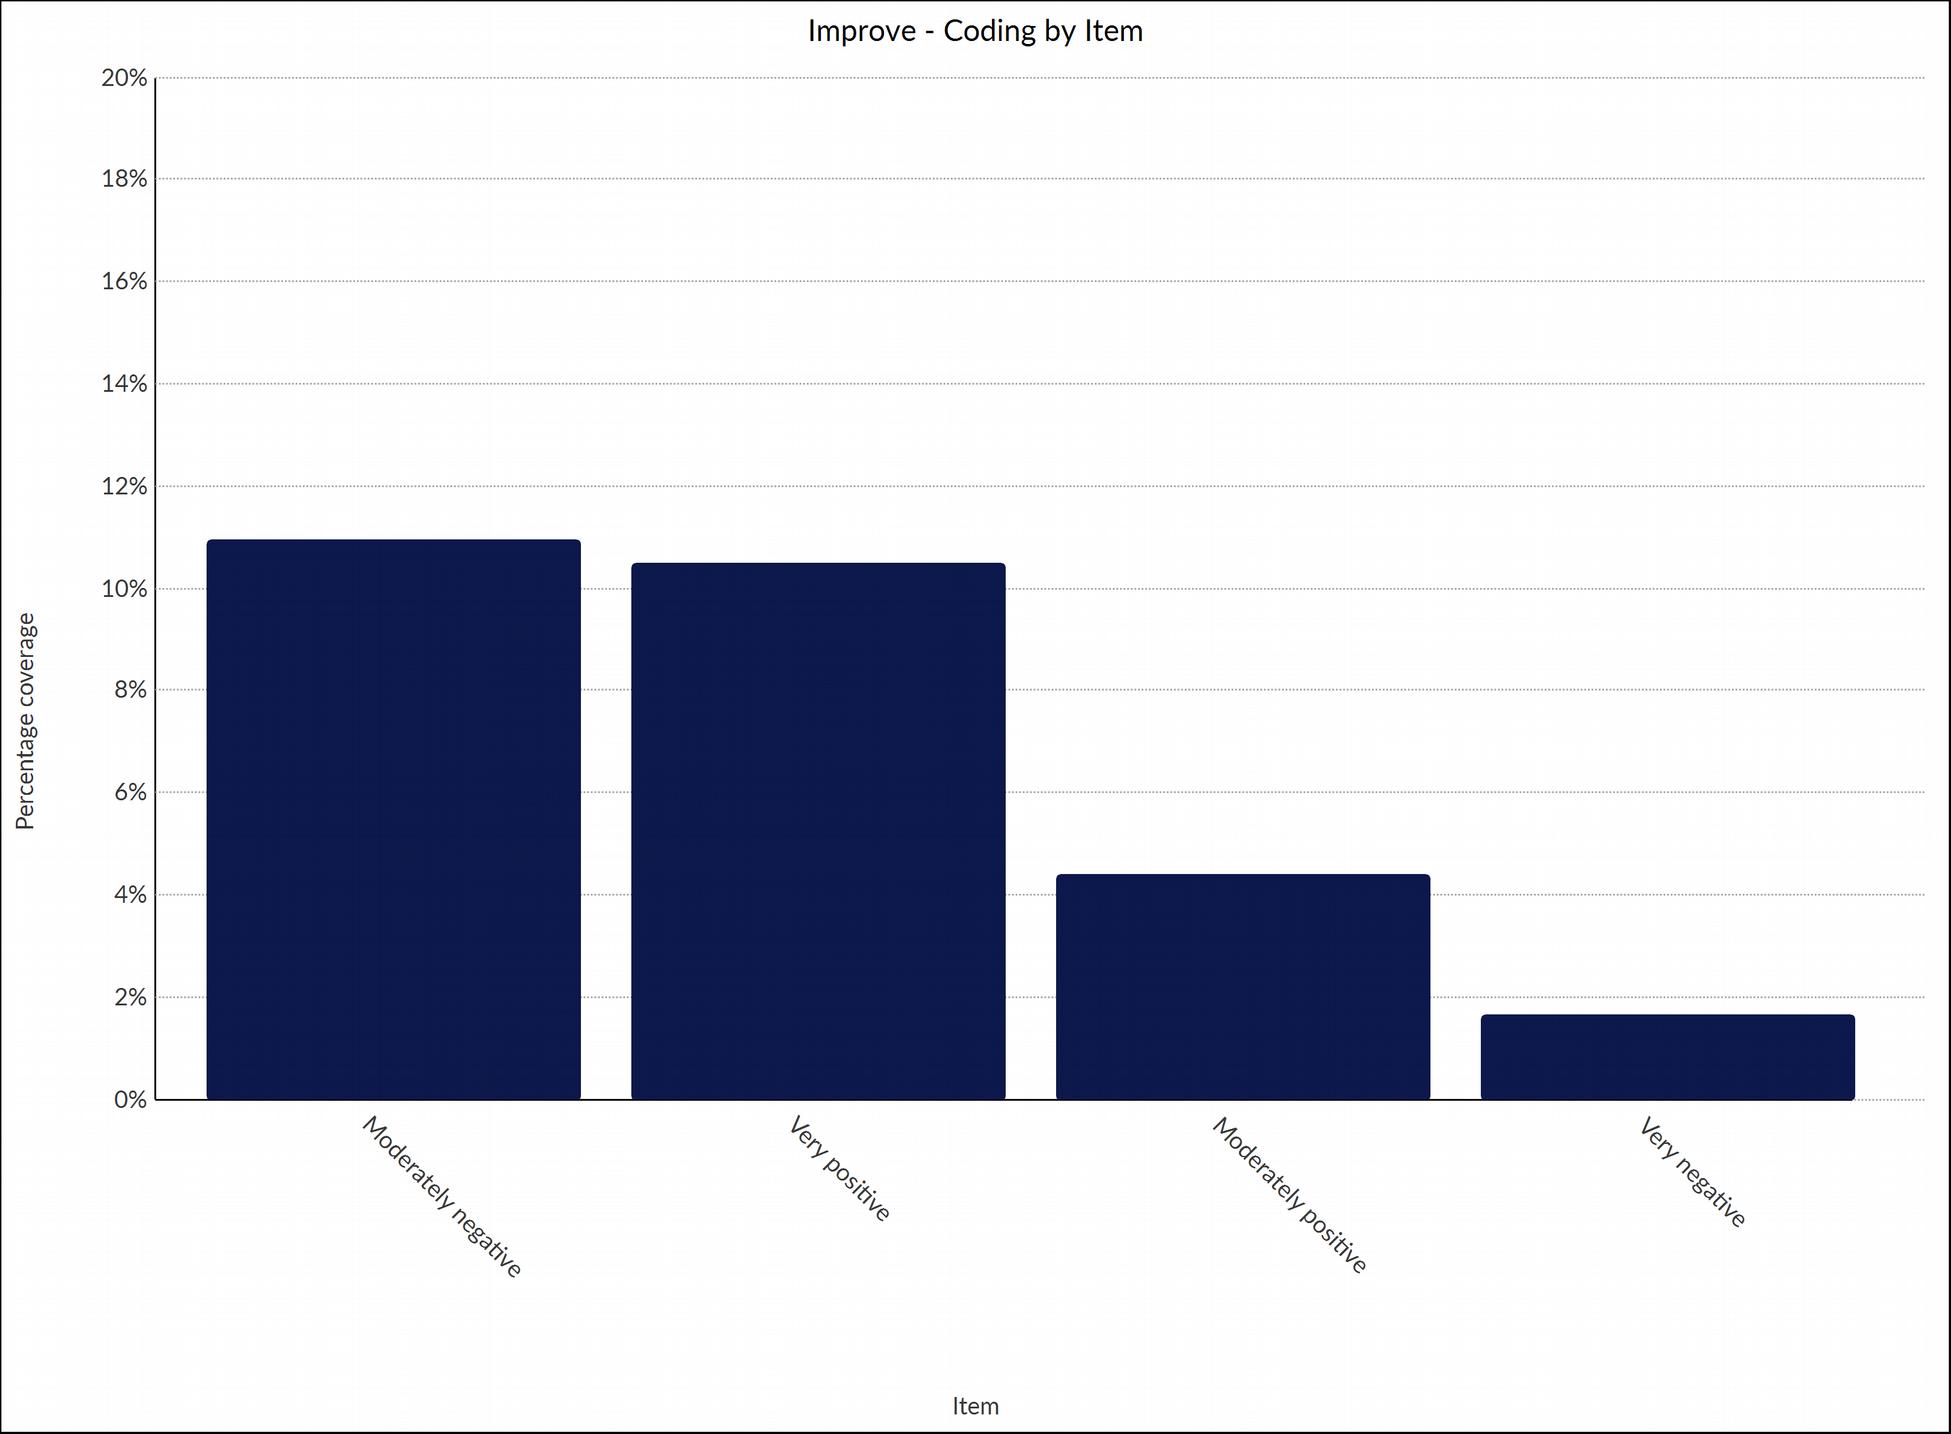
Chart 9 shows sentiment behavior of respondents with regards consideration of key policies, stakeholders and capacity building in relation to the process of creating or improving information systems.
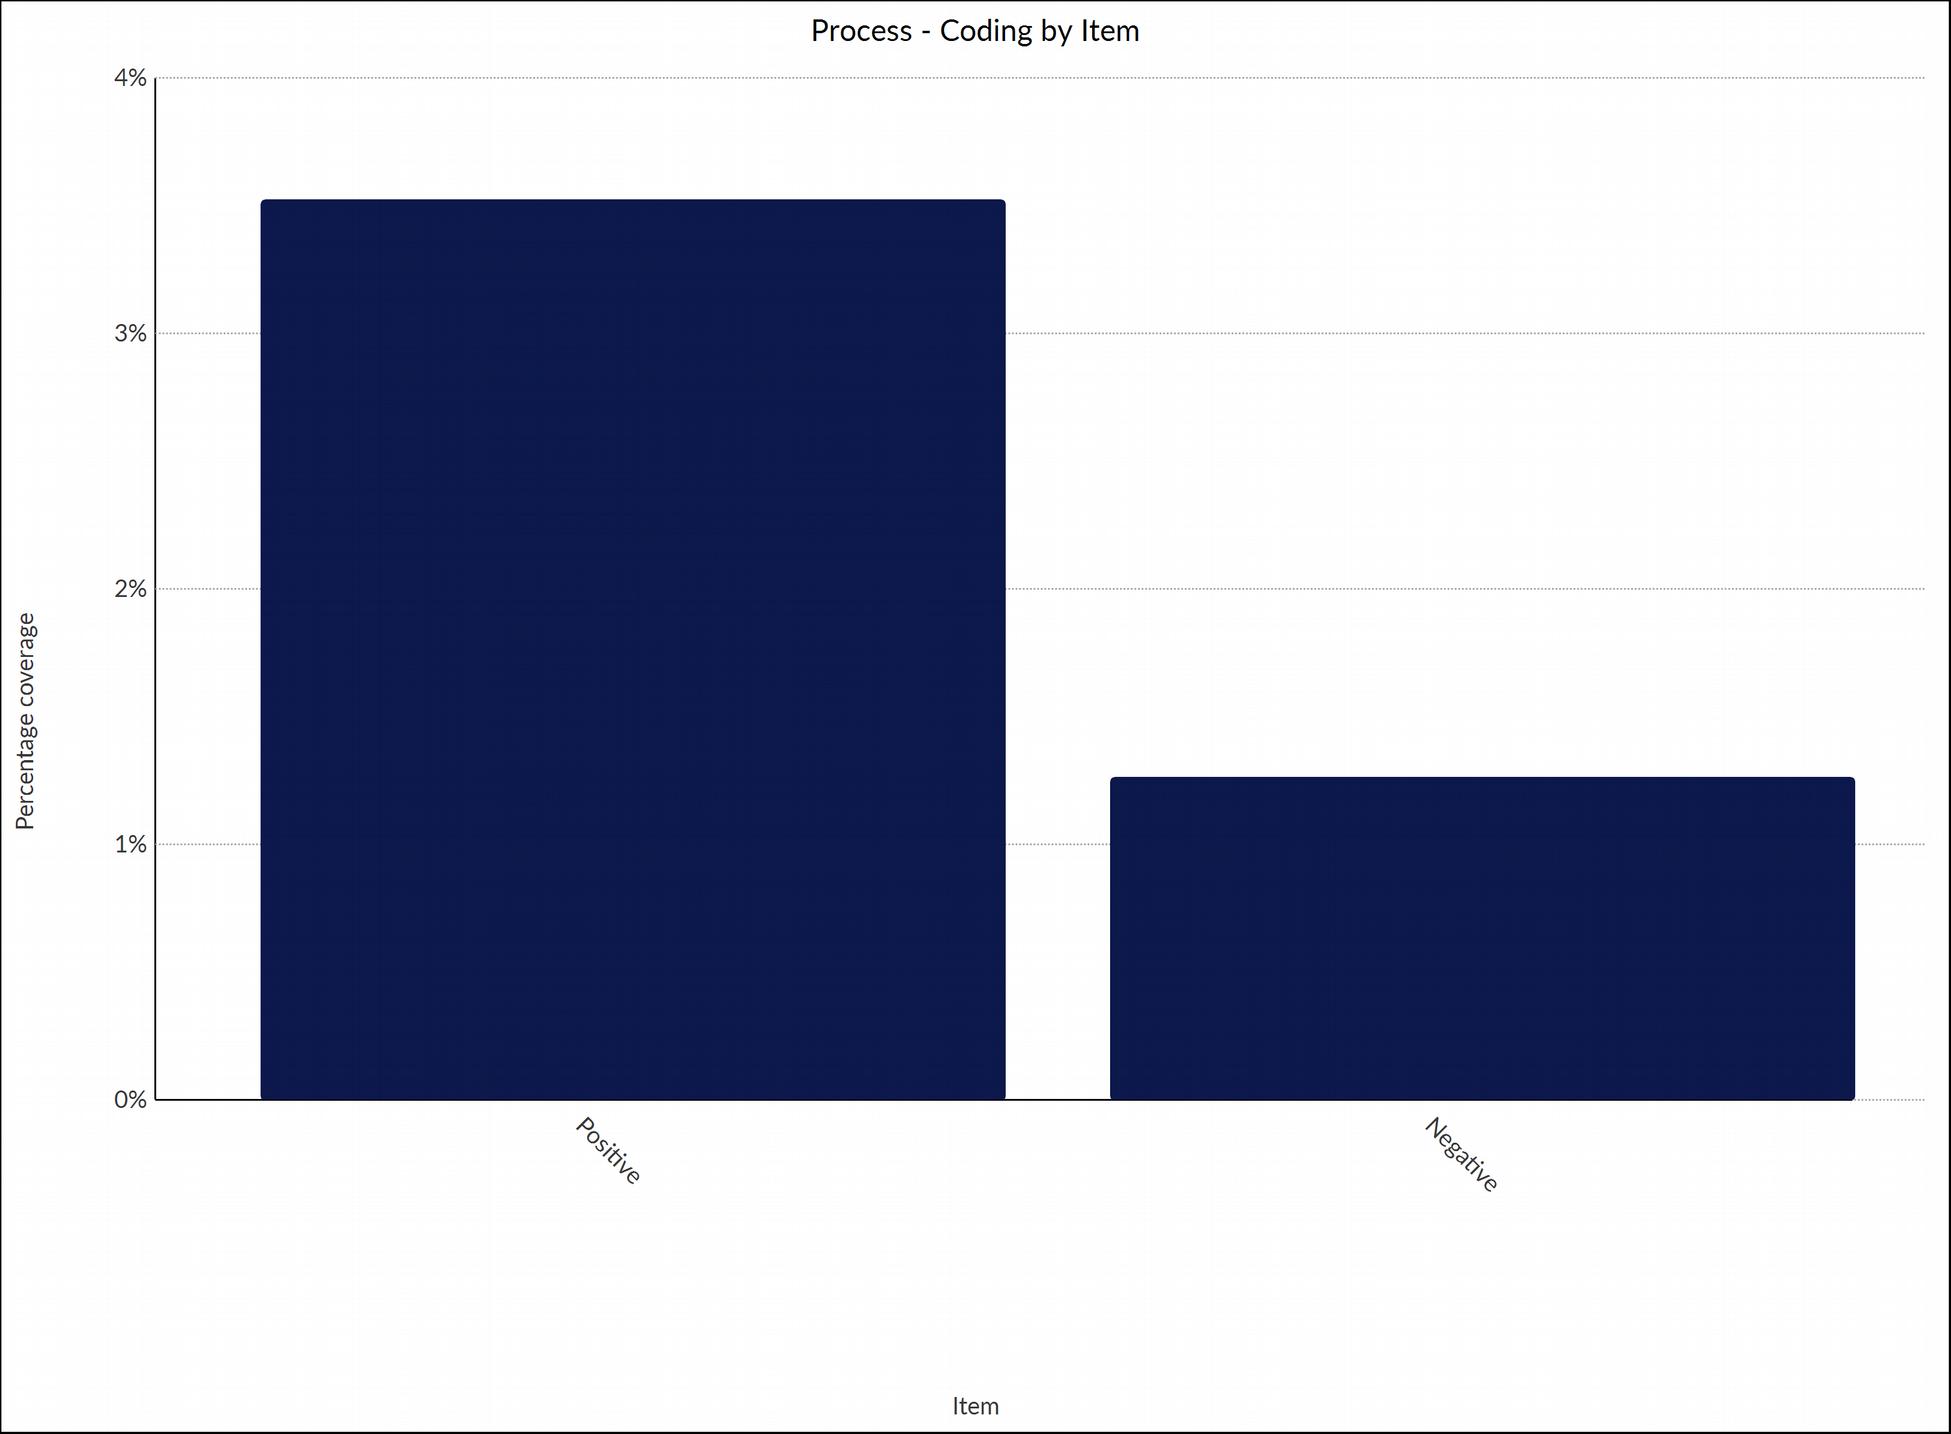
Chart 9 shows comprehensive sentiment behavior of respondents with regards consideration of key policies, stakeholders and capacity building in relation to the process of creating or improving information systems.
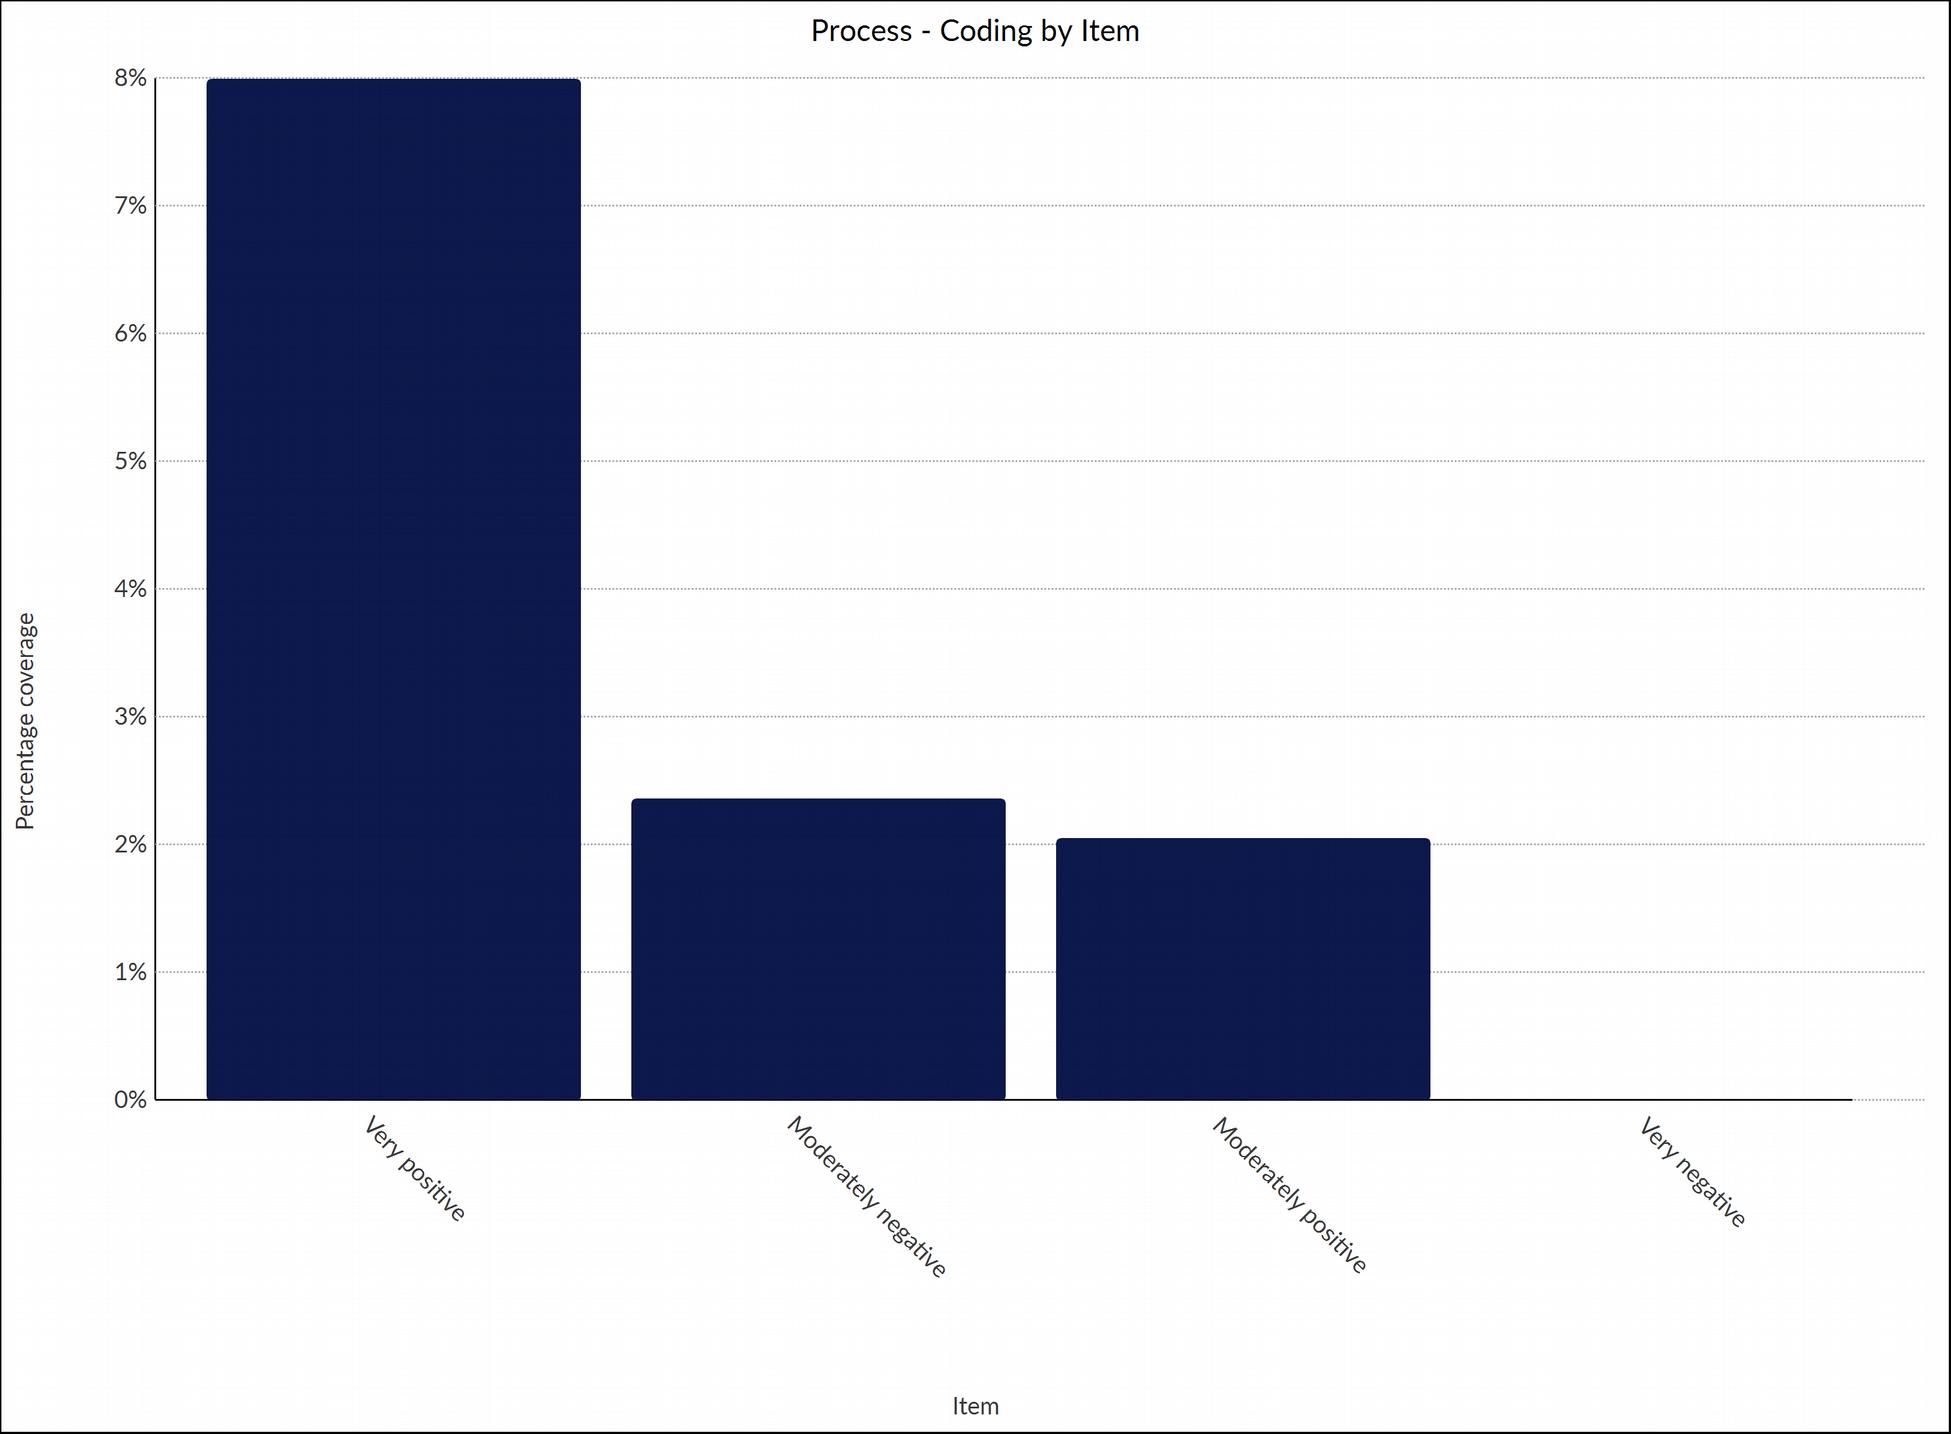
Chart 11 shows sentiment behavior of respondents with regards information systems being electronic, digital, online and adequate enough to meet modern standards.
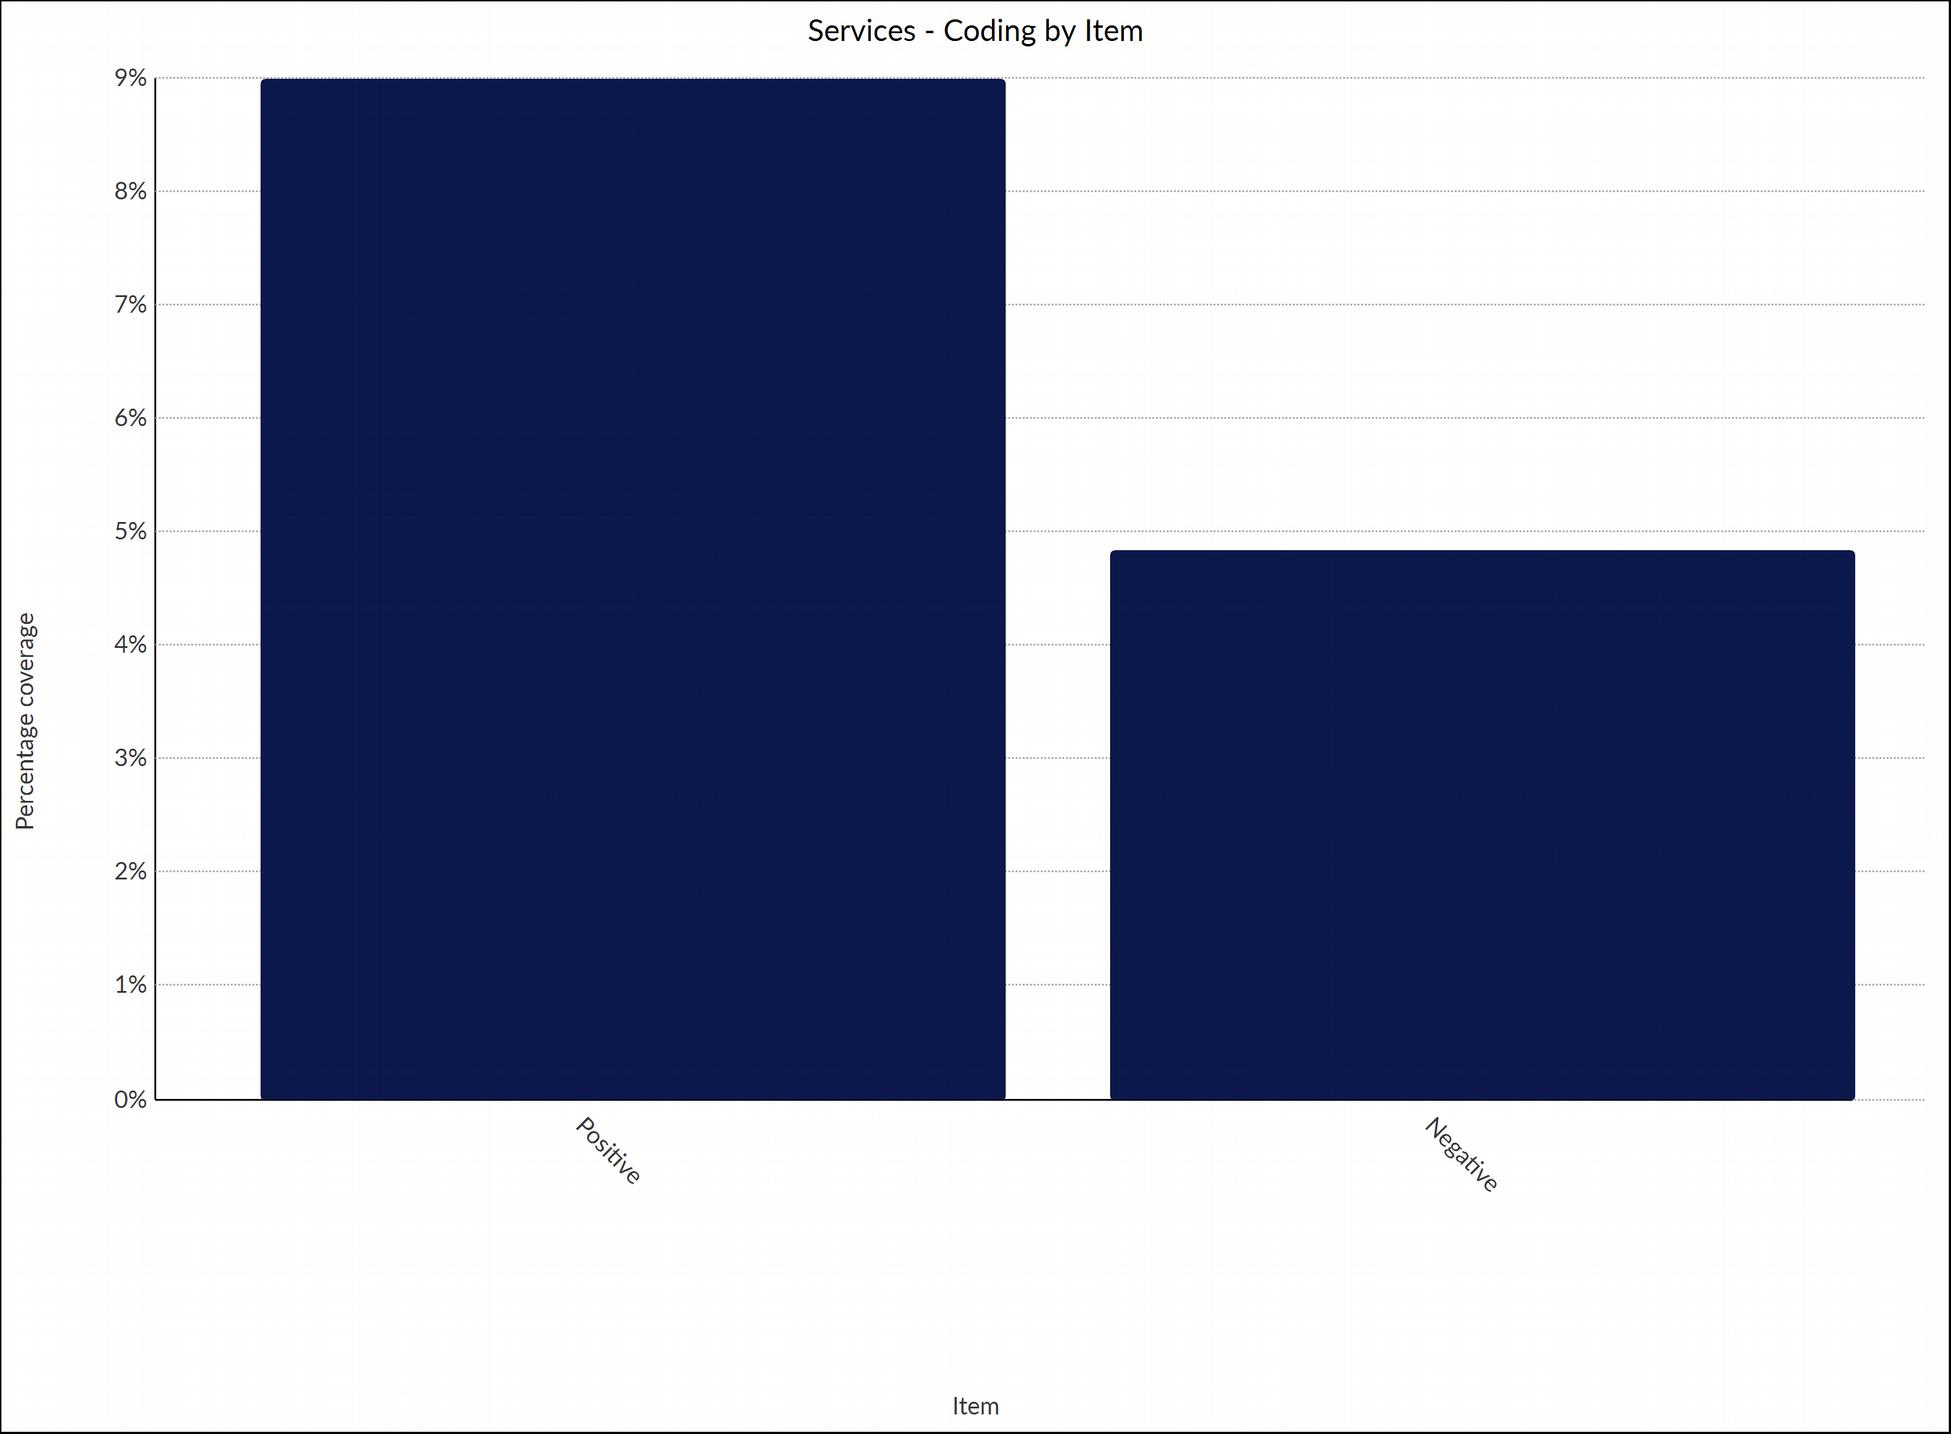
Chart 12 shows comprehensive sentiment behavior of respondents with regards information systems being electronic, digital, online and adequate enough to meet modern standards.
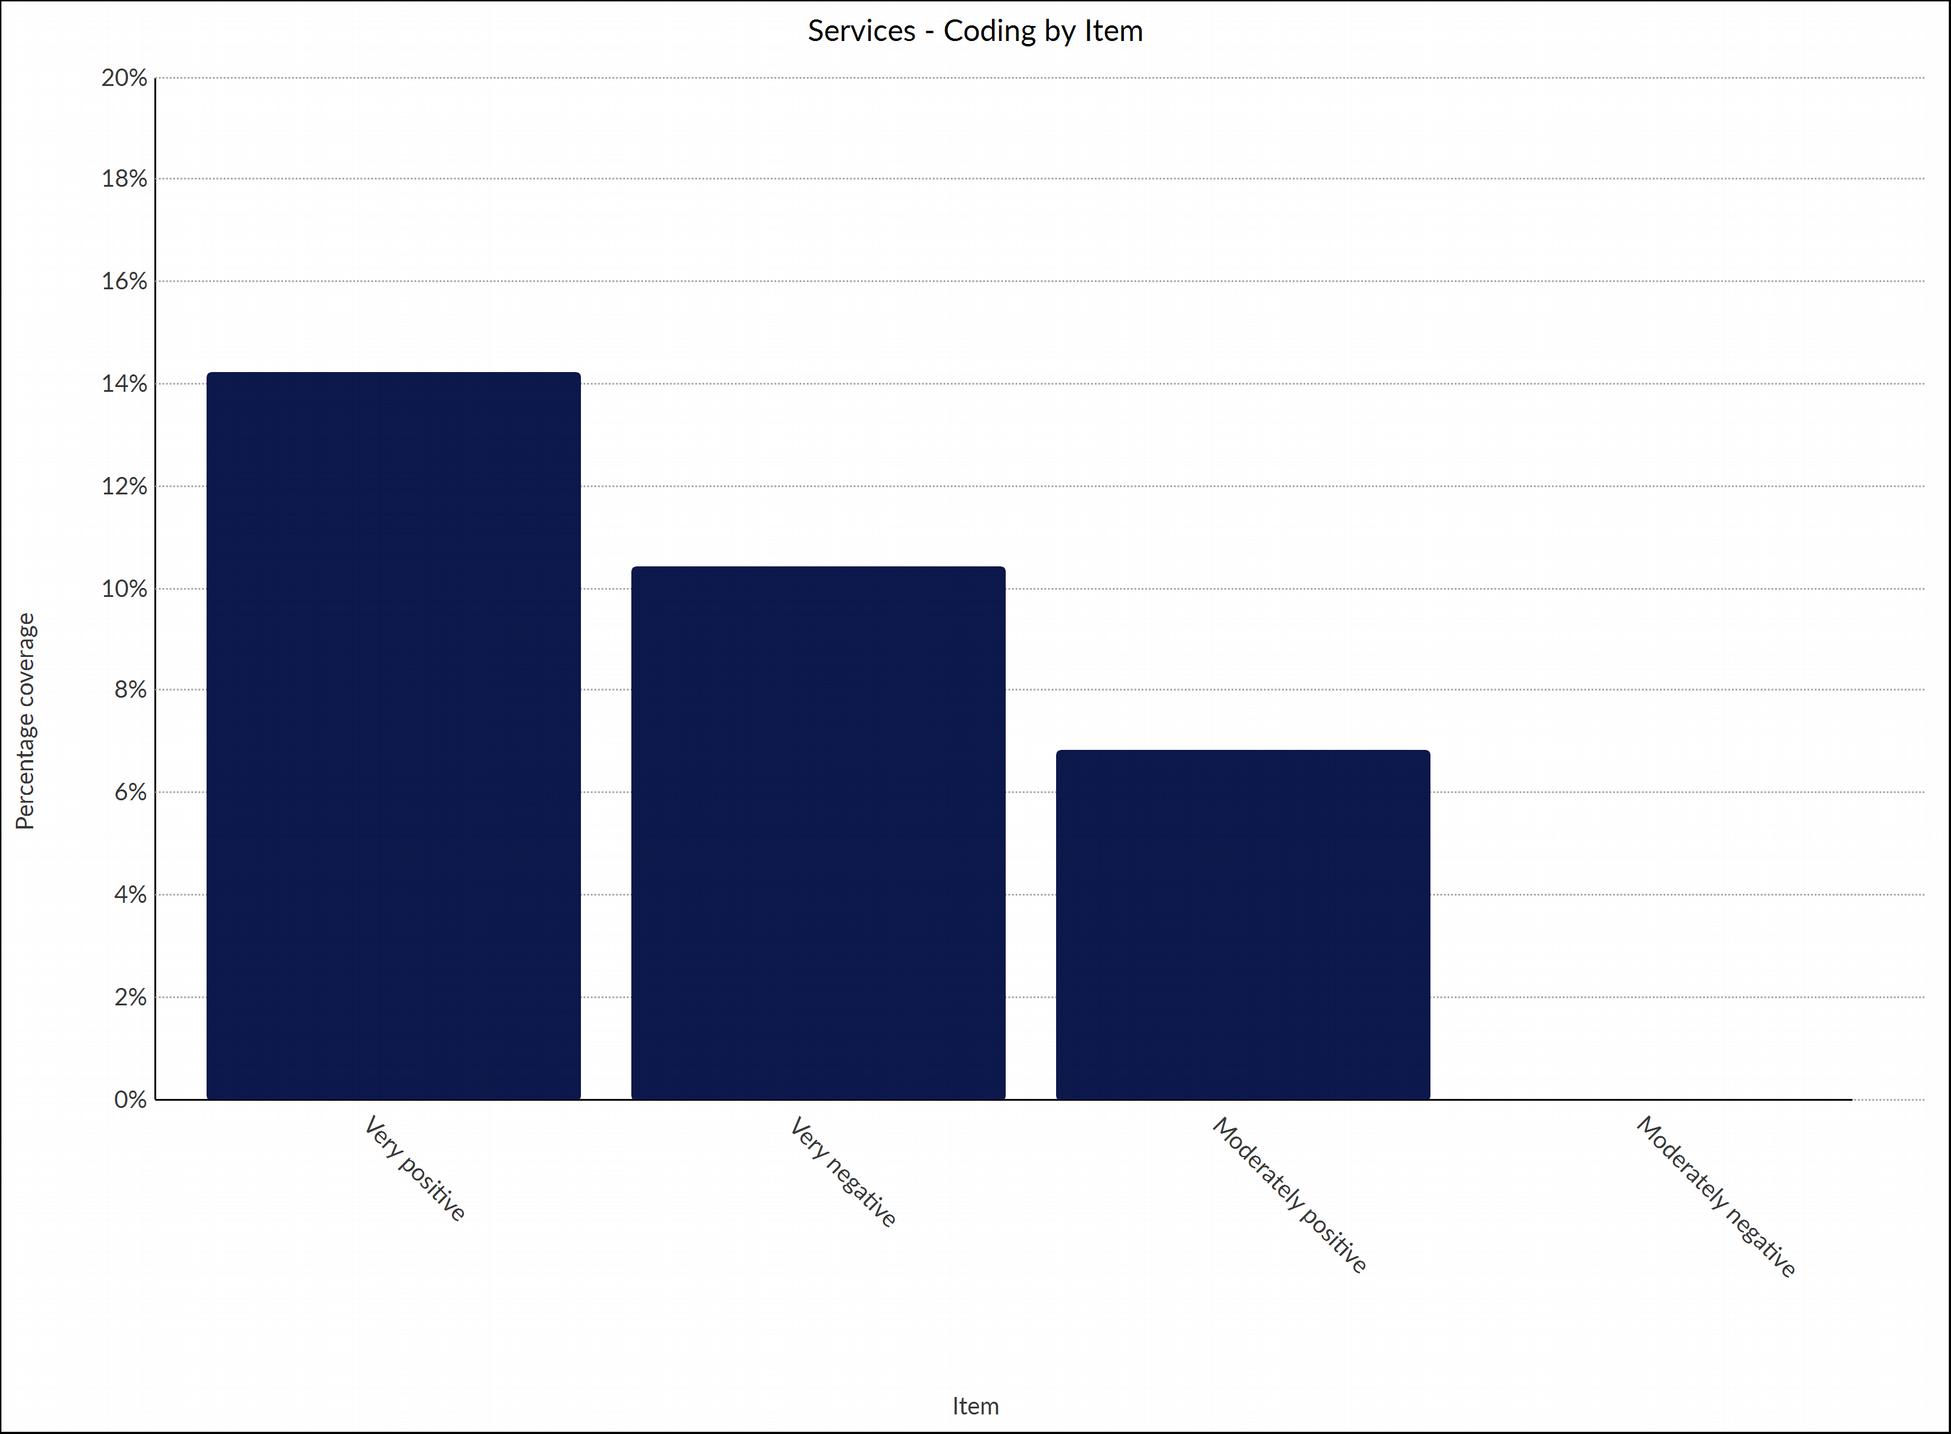
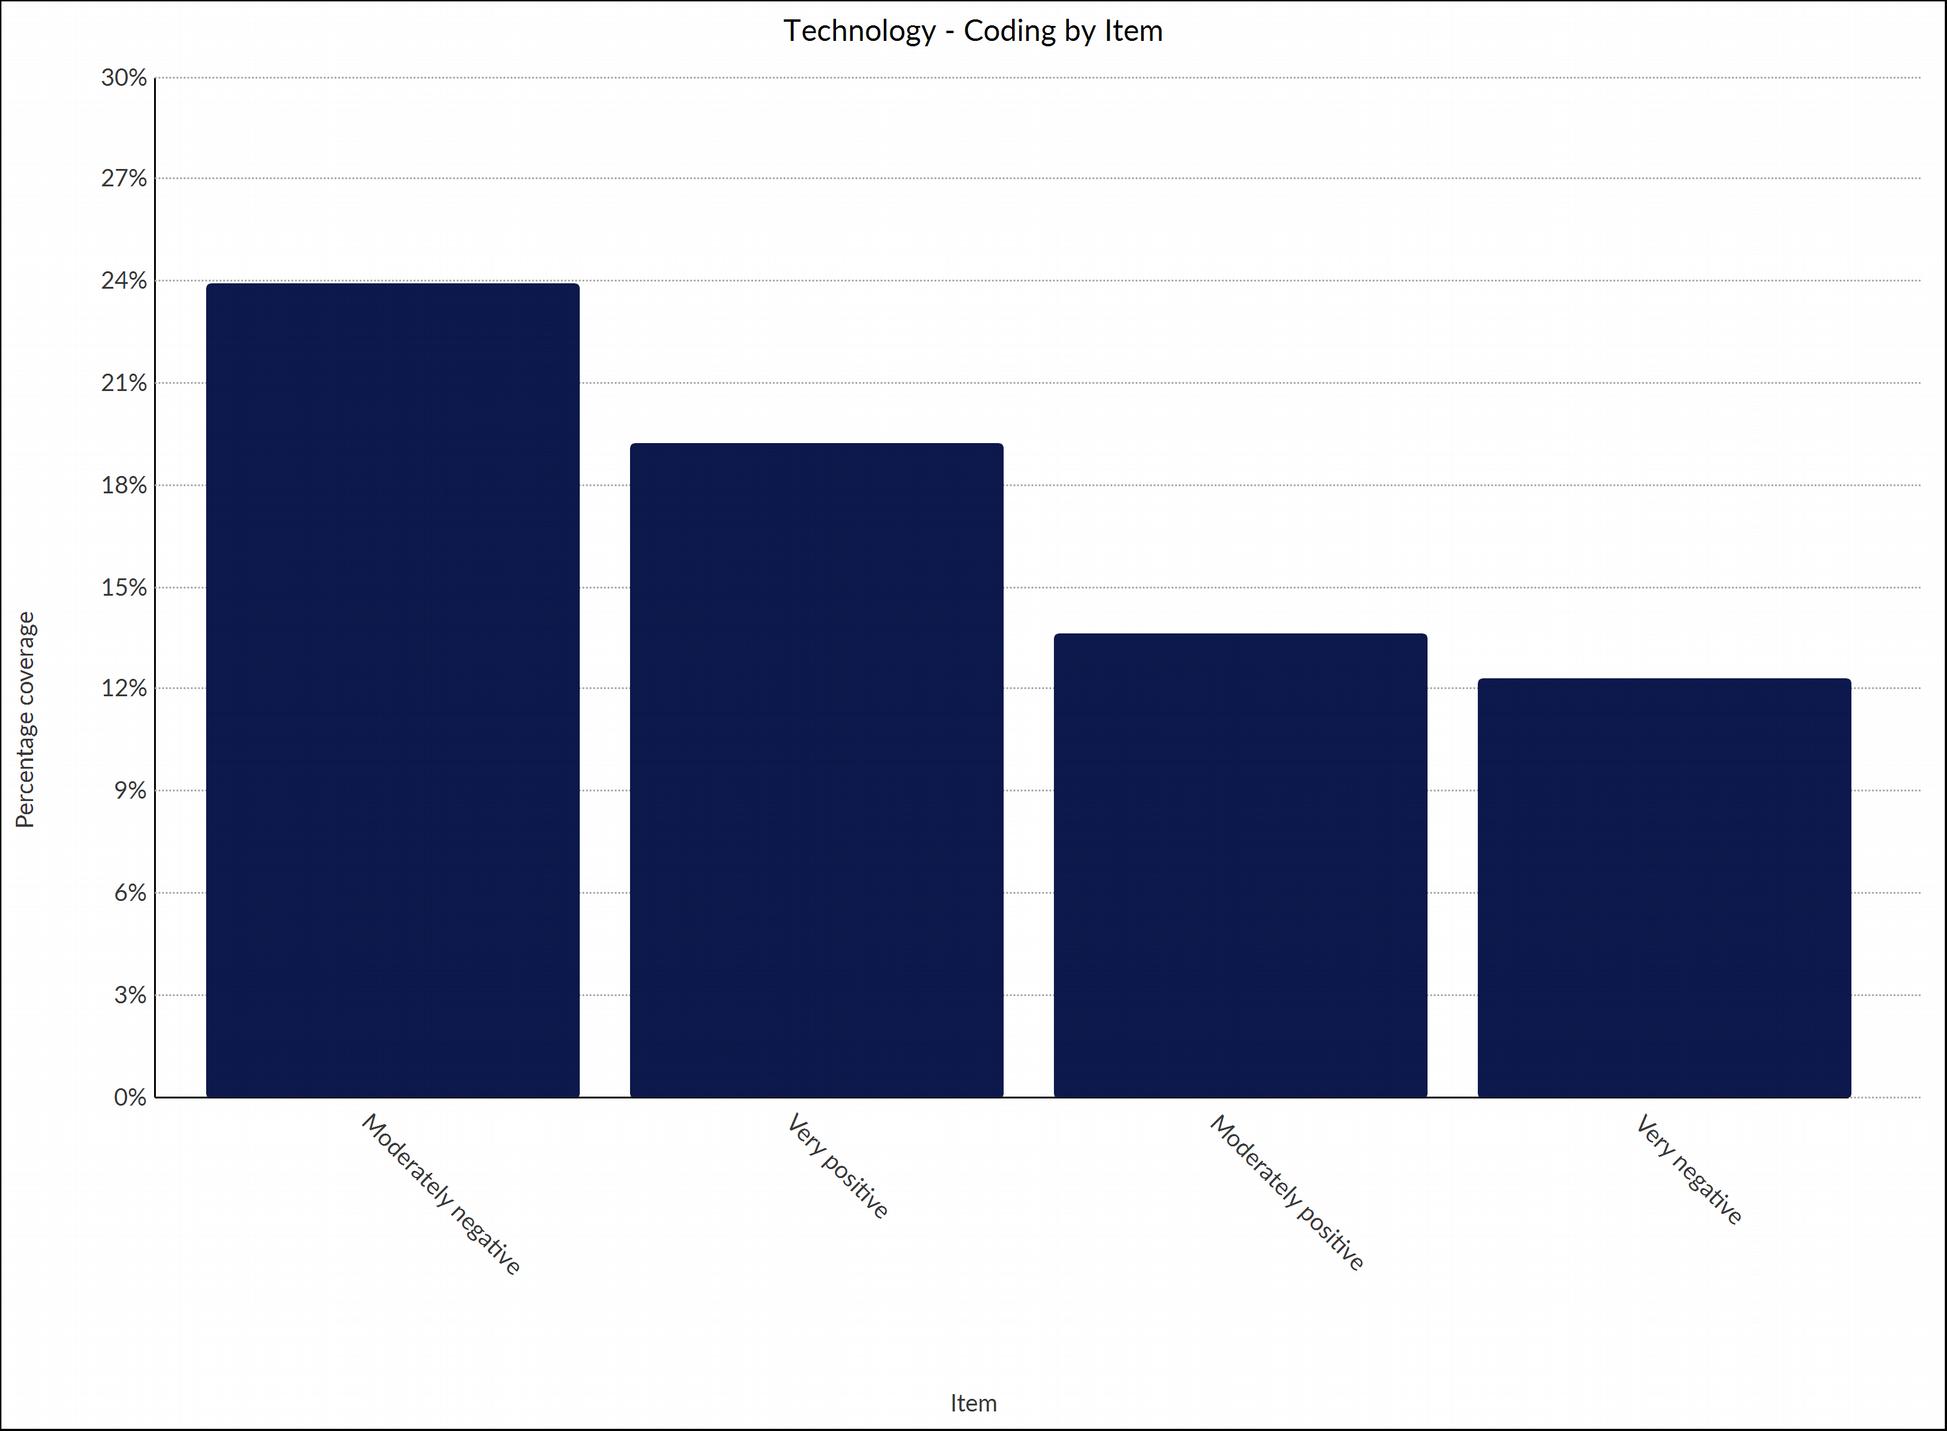
Chart 13 shows sentiment behavior of respondents with regards technology change, foreign technicians, frequency of change and its effect on information systems usage and general understanding.
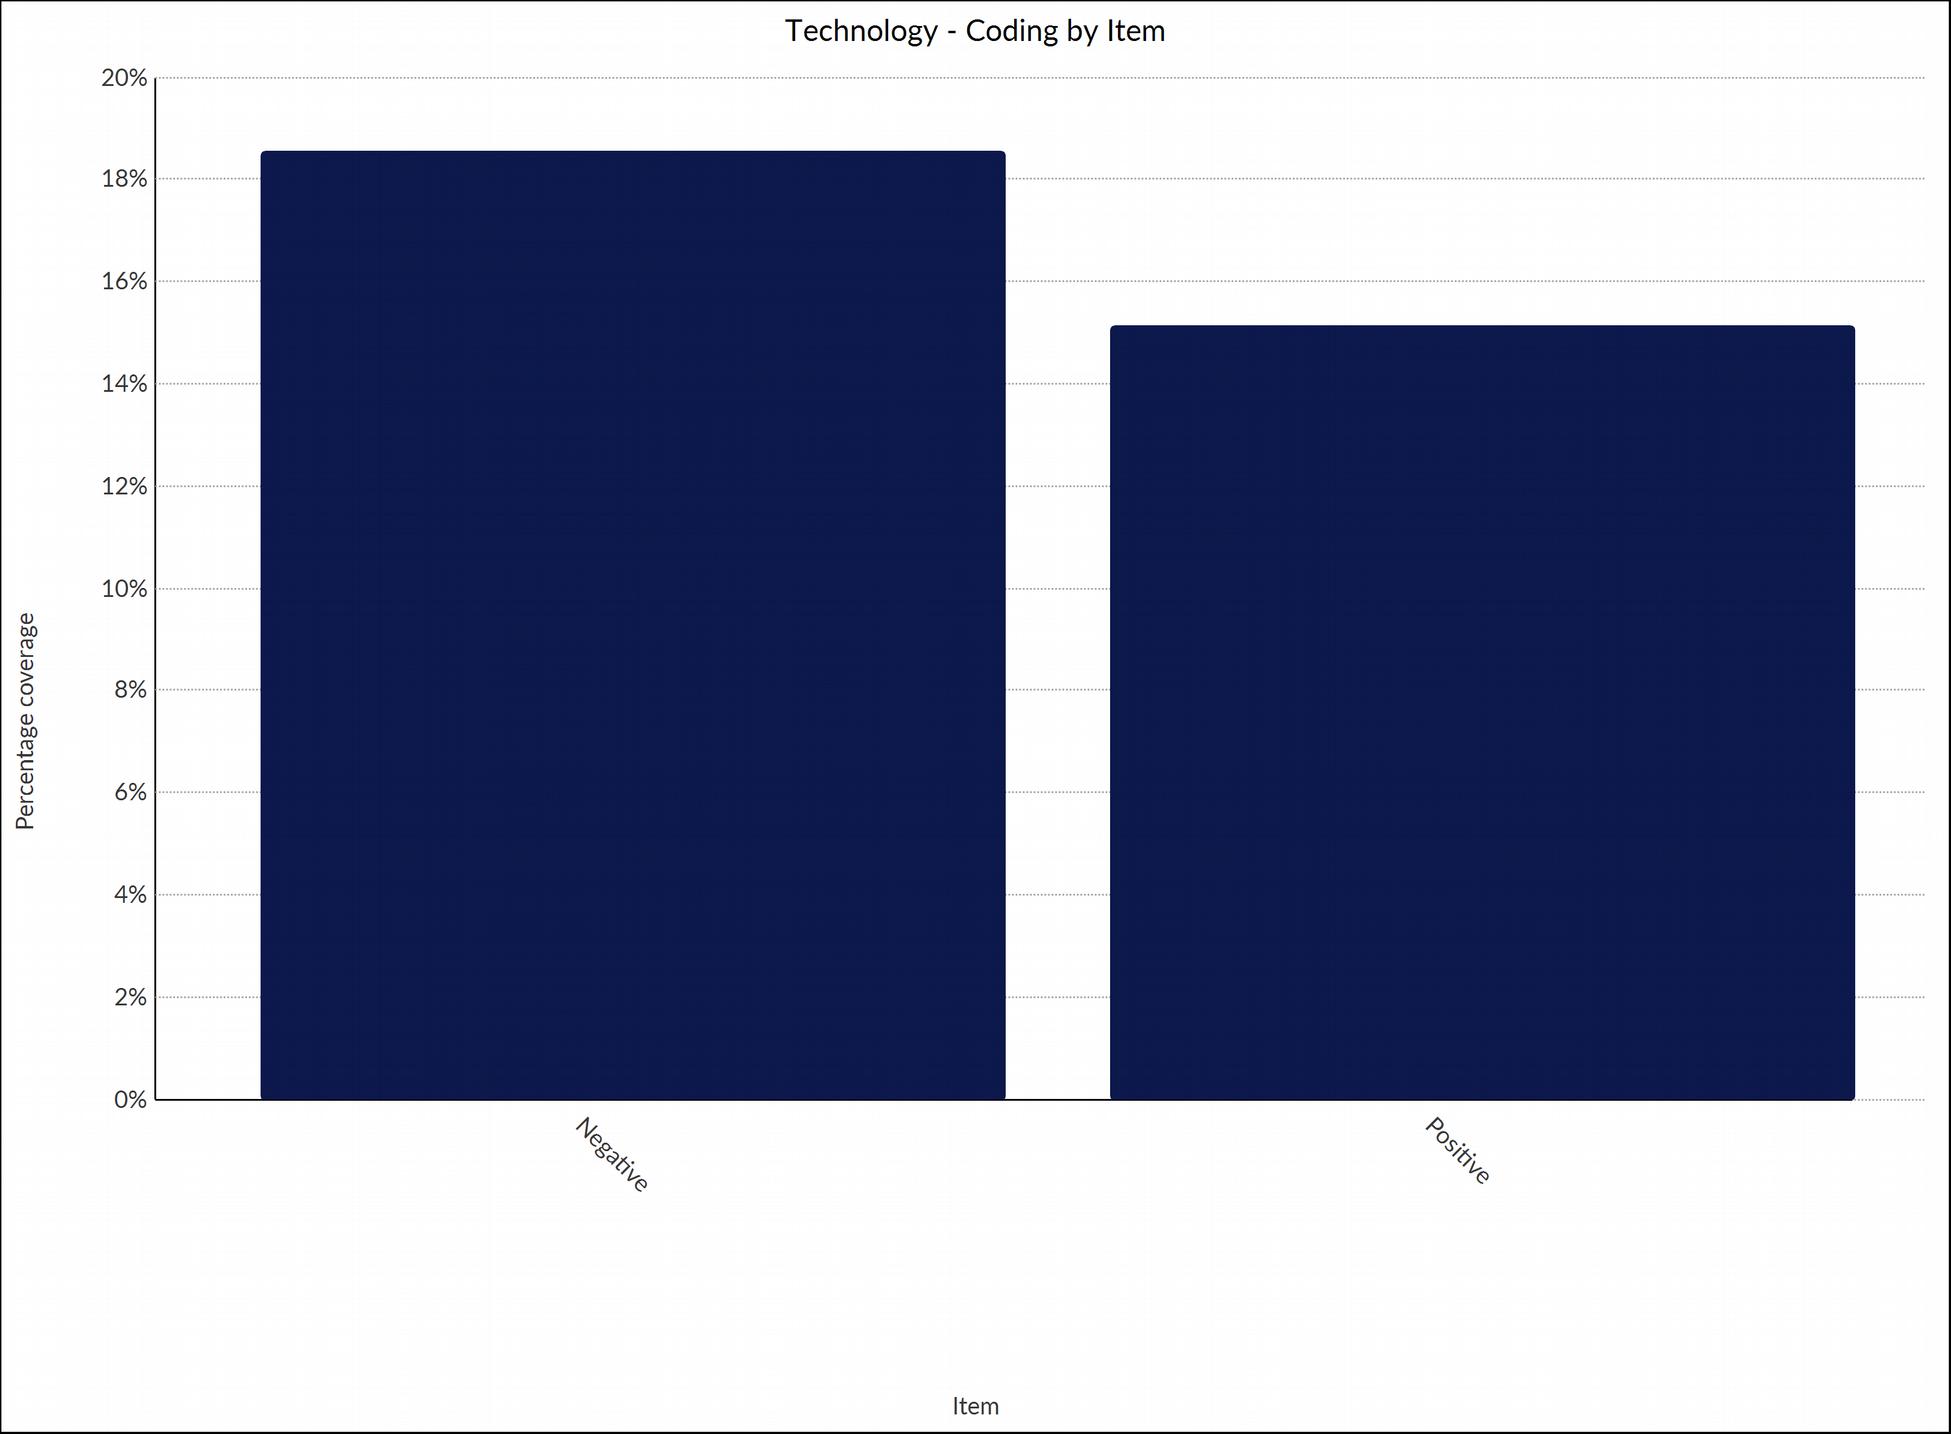
Chart 14 shows comprehensive sentiment behavior of respondents with regards technology change, foreign technicians, frequency of change and its effect on information systems usage and general understanding.
It can further be agreed that in researching a solution to a problem the solution to a large extent depends on the nature of the problem and how the questions toward that solution are addressed, either in: analysis and description; explanation, prediction, explanation and prediction; or design and action (Gregor, 2006). Here, considering the
FACTORS INFLUENCING INFORMATION SYSTEMS FAILURES IN NASARAWA STATE, NIGERIA (A MASTER’S RESEARCH PROJECT)
analysis and description from these charts, that the elements: technology, access and improvement are negative, goes to show that the nature of Information Systems in Nasarawa State is an erratic and unstable phenomenon.
FIGURE 6: HIERARCHY CHART OF SENTIMENTS FOR THE NATURE OF INFORMATION SYSTEMS IN NASARAWA STATE, NIGERIA
This can be backed up by the fact that the demand for technology by information systems has seen growing and desperate interests, and the reliance of these systems on improved technological facilities means; improving these systems to enhance their
FACTORS INFLUENCING INFORMATION SYSTEMS FAILURES IN NASARAWA STATE, NIGERIA (A MASTER’S RESEARCH PROJECT)
efficiency, effectiveness and the quantity/quality of access by organizations and individuals are essential (ADMIN M2 IESC, 2018). However, this stands to further be explored in the integration of the quantitative and qualitative analyses. 4.2.2 QUANTITATIVE RESULTS Based on the operationalization of the research study in terms of sampling and recruitment strategy, the researcher adopted the use of subjective sampling in conducting the quantitative survey for collection of data. Close-ended type questionnaires were distributed by e-mail to 38 respondents based on the following demographics: gender, age, computer literacy, education, work-level, language efficiency and capacity to operate a simple information system. Respondents had 24 questions to respond to and 7 demographic characteristics to provide in 3 parts (See Appendix III). The quantitative data suggests that there is adequate understanding of the concepts of information systems, where government responsibility is fair in relation to being a part of the process, and involvement of key stakeholders. Usage and knowledge of information systems is high especially in conjunction with the external environment, but not in the areas of technical expertise – where foreign involvement has seen little or no favor. Overall assessment of the quantitative data shows positive outcomes from half the percentage of the respondents. The following summarize Parts 1, 2 and 3 responses.
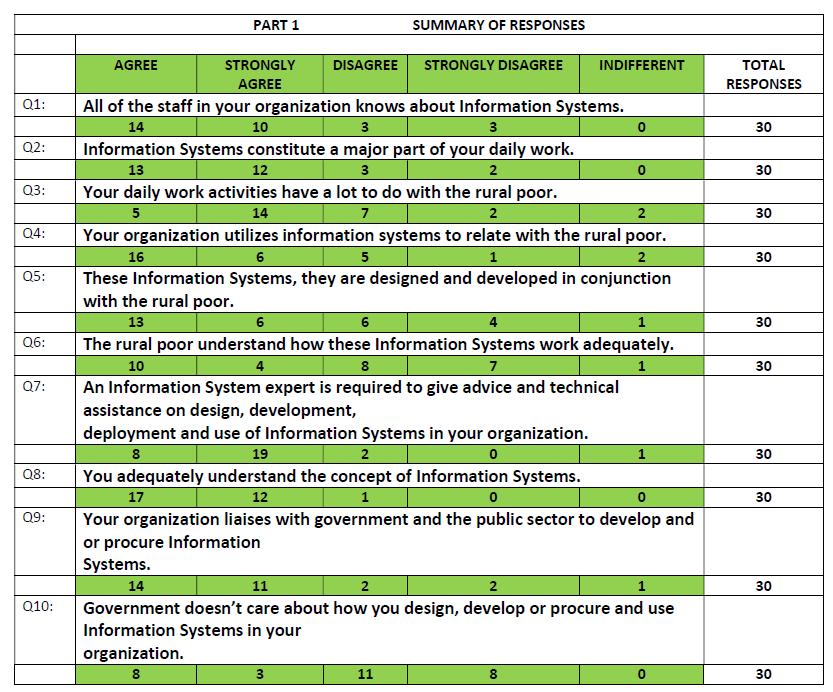
FACTORS INFLUENCING INFORMATION SYSTEMS FAILURES IN NASARAWA STATE, NIGERIA (A MASTER’S RESEARCH PROJECT) FIGURE 7: SUMMARY OF PART 1
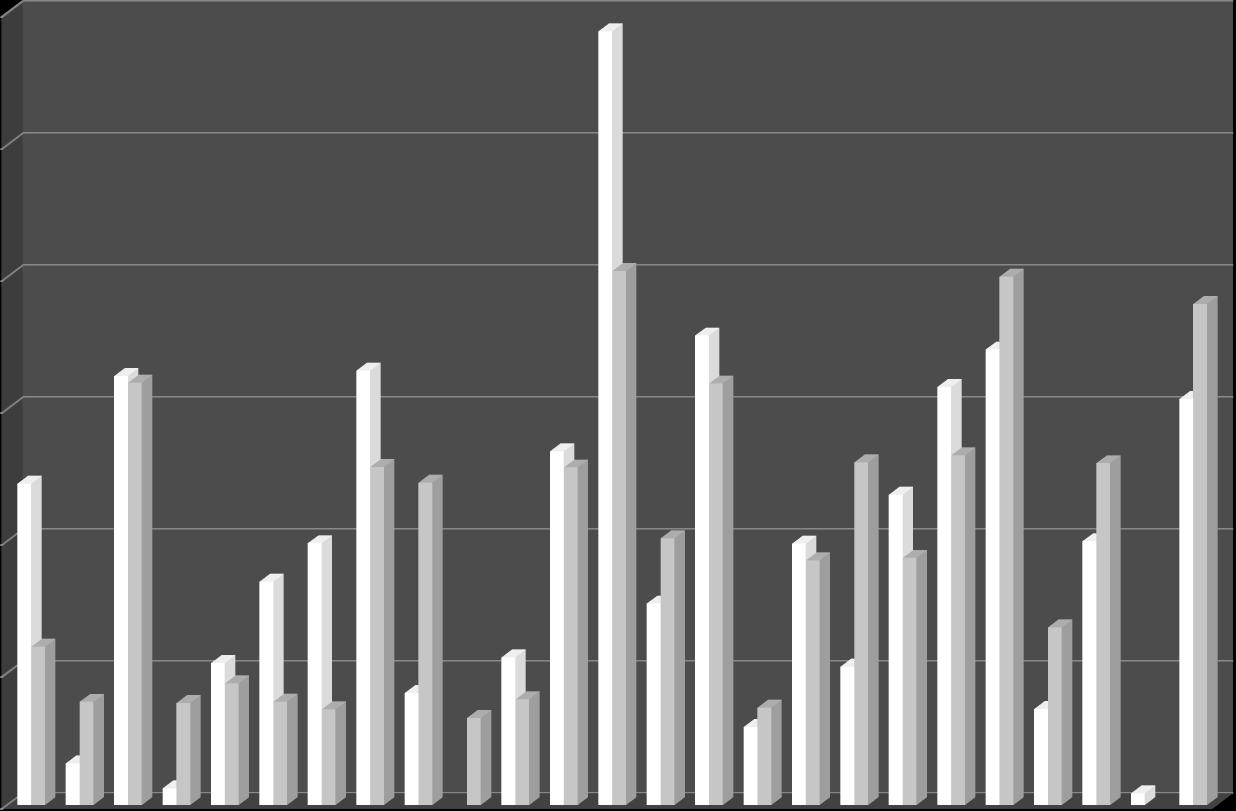
CHART 15: COLUMN CHART SHOWING DISTRIBUTION OF RESPONSES FOR PART 1
Object 3
In part 1, efforts were made to establish interlace within organizations between employees of the internal environment, individuals in the external environment (especially, the rural exclusions) and the government, with information systems. In part 2, efforts were made to establish the nature of these information systems circulating the study area. In part 3, efforts were made to collect suggestions from respondents on how government can meet their responsibility in ensuring information systems that work for the communities of Nasarawa State as a whole. Also demographic data for the individual respondents were collected for deeper analysis where necessary. The following charts show the questions and the varying responses from the respondents.
FACTORS INFLUENCING INFORMATION SYSTEMS FAILURES IN NASARAWA STATE, NIGERIA (A MASTER’S RESEARCH PROJECT) CHART 16: ANALYSING PART 2, QUESTION 11
Object 5
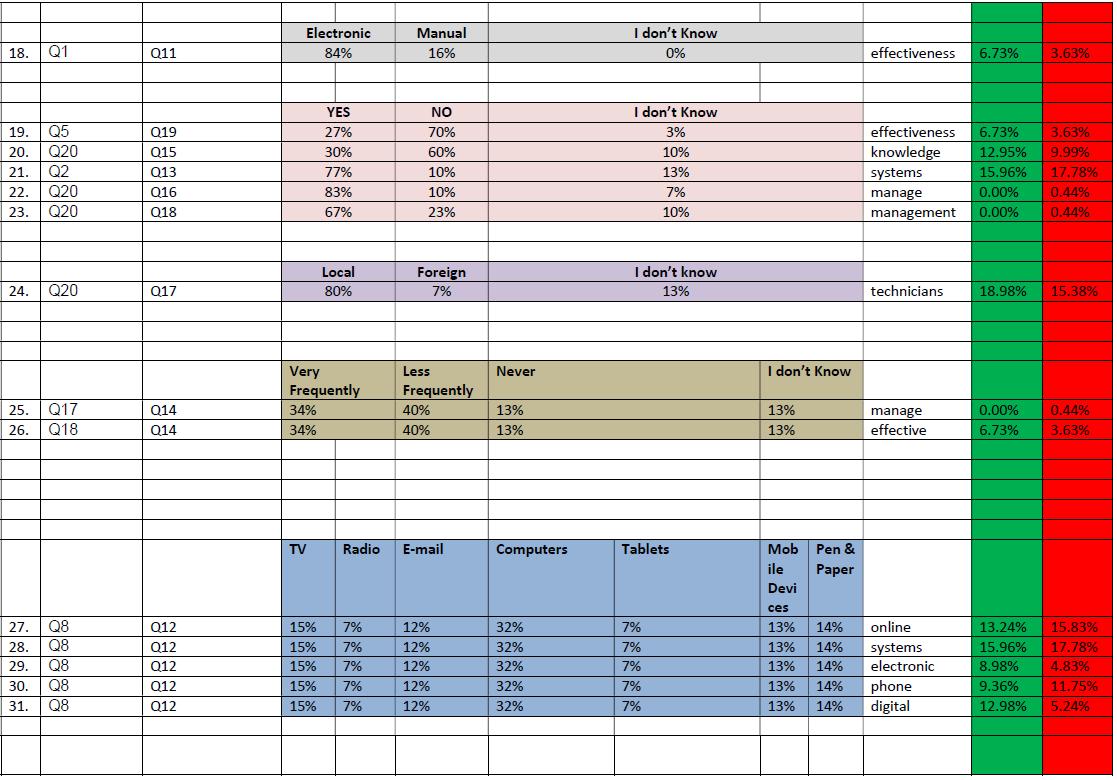
The pie chart above indicates a major percentage of the information systems being electronic in nature.
CHART 16: ANALYSING PART 2, QUESTION 12
Object 7
Here, 13% of mobile devices, 7% of tablets, 32% of computers, 12% of email, 7% of radio and 15% constitute electronic elements of the information systems. Adding these
FACTORS INFLUENCING INFORMATION SYSTEMS FAILURES IN NASARAWA STATE, NIGERIA (A MASTER’S RESEARCH PROJECT)
percentages together gives 86% in correlation to the 84% that show the electronic nature of the information systems.
CHART 16: ANALYSING PART 2, QUESTION 13
Object 9
CHART 16: ANALYSING PART 2, QUESTION 14
Object 11
CHART 16: ANALYSING PART 2, QUESTION 15
Object 13
FACTORS INFLUENCING INFORMATION SYSTEMS FAILURES IN NASARAWA STATE, NIGERIA (A MASTER’S RESEARCH PROJECT) CHART 16: ANALYSING PART 2, QUESTION 16
Object 15
FACTORS INFLUENCING INFORMATION SYSTEMS FAILURES IN NASARAWA STATE, NIGERIA (A MASTER’S RESEARCH PROJECT) CHART 16: ANALYSING PART 2, QUESTION 17
Object 17
CHART 16: ANALYSING PART 2, QUESTION 18
Object 20
CHART 16: ANALYSING PART 2, QUESTION 19
Object 23
CHART 16: ANALYSING PART 2, QUESTION 20
Object 25
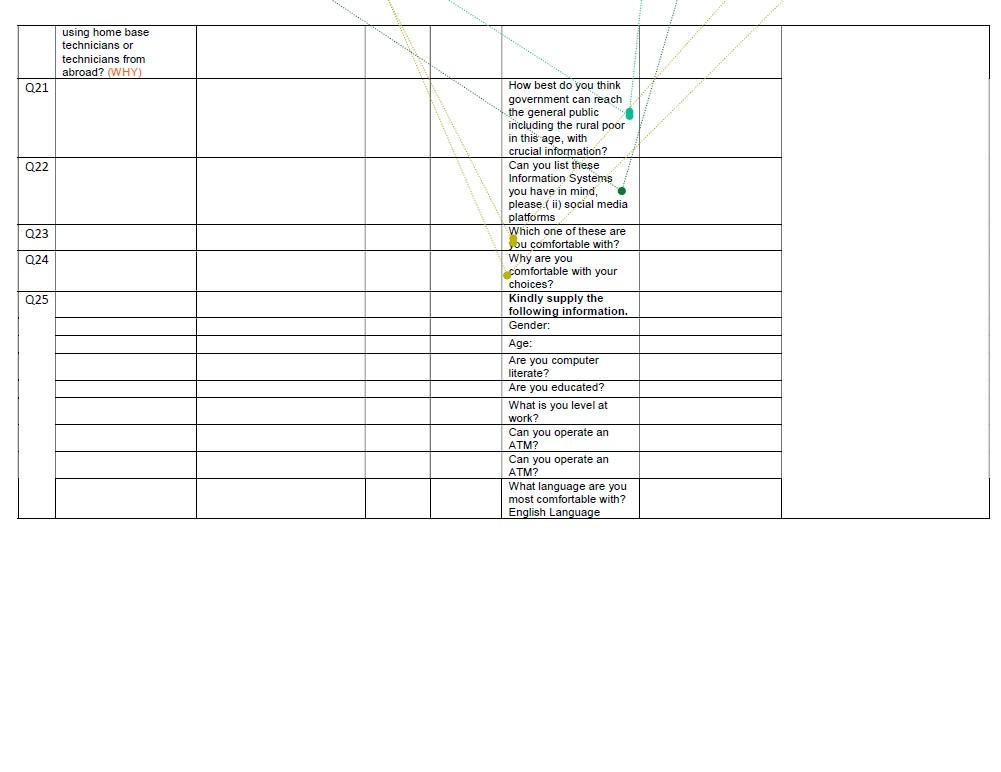
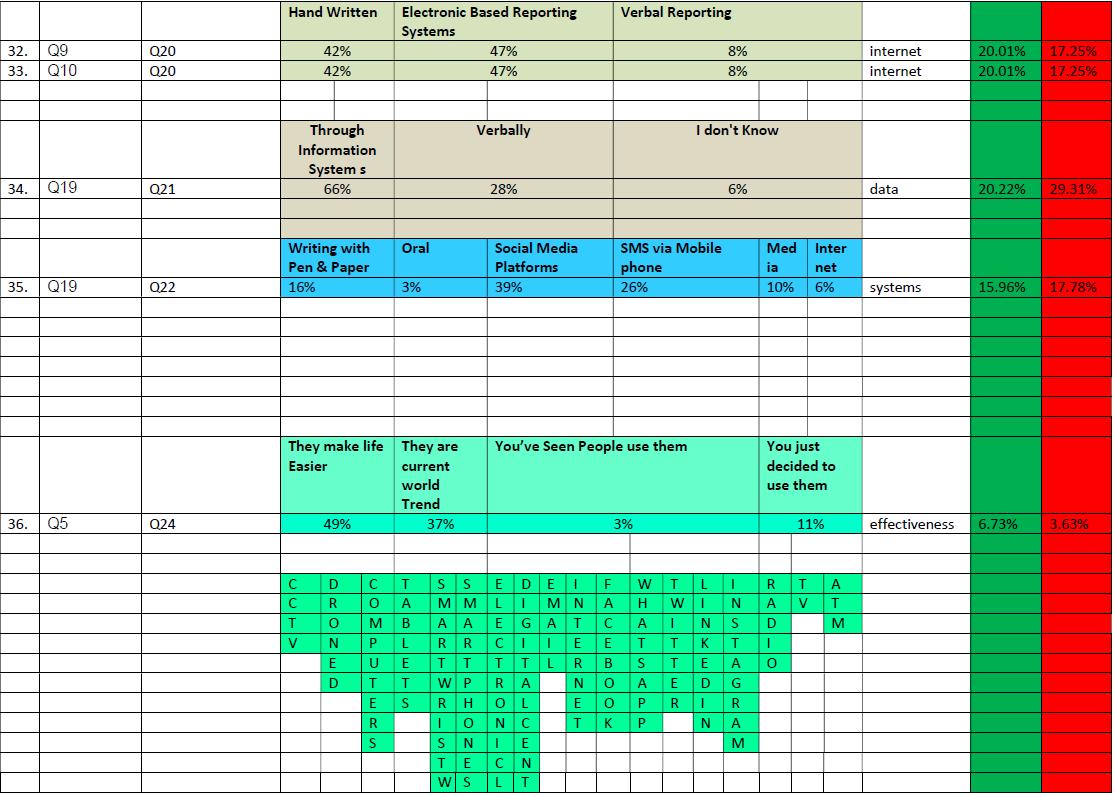
In part 3 of the quantitative survey, efforts were made to establish: the best way in which the rural poor can be reached by the government, how these ways of reaching the
FACTORS INFLUENCING INFORMATION SYSTEMS FAILURES IN NASARAWA STATE, NIGERIA (A MASTER’S RESEARCH PROJECT)
rural poor relate to the Internet of Things, and the personal attributes of the respondents. The following charts depict the analysis.
CHART 17: ANALYSING PART 3, QUESTION 21
Object 27
FACTORS INFLUENCING INFORMATION SYSTEMS FAILURES IN NASARAWA STATE, NIGERIA (A MASTER’S RESEARCH PROJECT) CHART 18: ANALYSING PART 3, QUESTION 22
Object 30
FACTORS INFLUENCING INFORMATION SYSTEMS FAILURES IN NASARAWA STATE, NIGERIA (A MASTER’S RESEARCH PROJECT) CHART 19 a: ANALYSING PART 3, QUESTION 23
Object 32
CHART 19 b: ANALYSING PART 3, QUESTION 23
Object 34
CHART 19 c: ANALYSING PART 3, QUESTION 23
Object 36
CHART 19 d: ANALYSING PART 3, QUESTION 23
Object 38
CHART 20: ANALYSING PART 3, QUESTION 24
Object 40
FACTORS INFLUENCING INFORMATION SYSTEMS FAILURES IN NASARAWA STATE, NIGERIA (A MASTER’S RESEARCH PROJECT) CHART 21 a: ANALYSING PART 3, QUESTION 25
Object 42
FACTORS INFLUENCING INFORMATION SYSTEMS FAILURES IN NASARAWA STATE, NIGERIA (A MASTER’S RESEARCH PROJECT) CHART 21 b: ANALYSING PART 3, QUESTION 25
Object 44
CHART 21 c: ANALYSING PART 3, QUESTION 25
Object 46
FACTORS INFLUENCING INFORMATION SYSTEMS FAILURES IN NASARAWA STATE, NIGERIA (A MASTER’S RESEARCH PROJECT) CHART 21 d: ANALYSING PART 3, QUESTION 25
Object 48
CHART 21 e: ANALYSING PART 3, QUESTION 25
Object 50
FACTORS INFLUENCING INFORMATION SYSTEMS FAILURES IN NASARAWA STATE, NIGERIA (A MASTER’S RESEARCH PROJECT) CHART 21 f: ANALYSING PART 3, QUESTION 25
Object 52
CHART 21 g: ANALYSING PART 3, QUESTION 25
Object 54
4.3 EVALUATION OF FINDINGS 4.3.1 INTEGRATION AND TRIANGULATION OF QUALITATIVE AND QUANTITATIVE RESULTS In an attempt for a systematic integration of the analyzed qualitative and quantitative data, rigorous, alternative designs have been adopted through short-hand notations of
FACTORS INFLUENCING INFORMATION SYSTEMS FAILURES IN NASARAWA STATE, NIGERIA (A MASTER’S RESEARCH PROJECT)
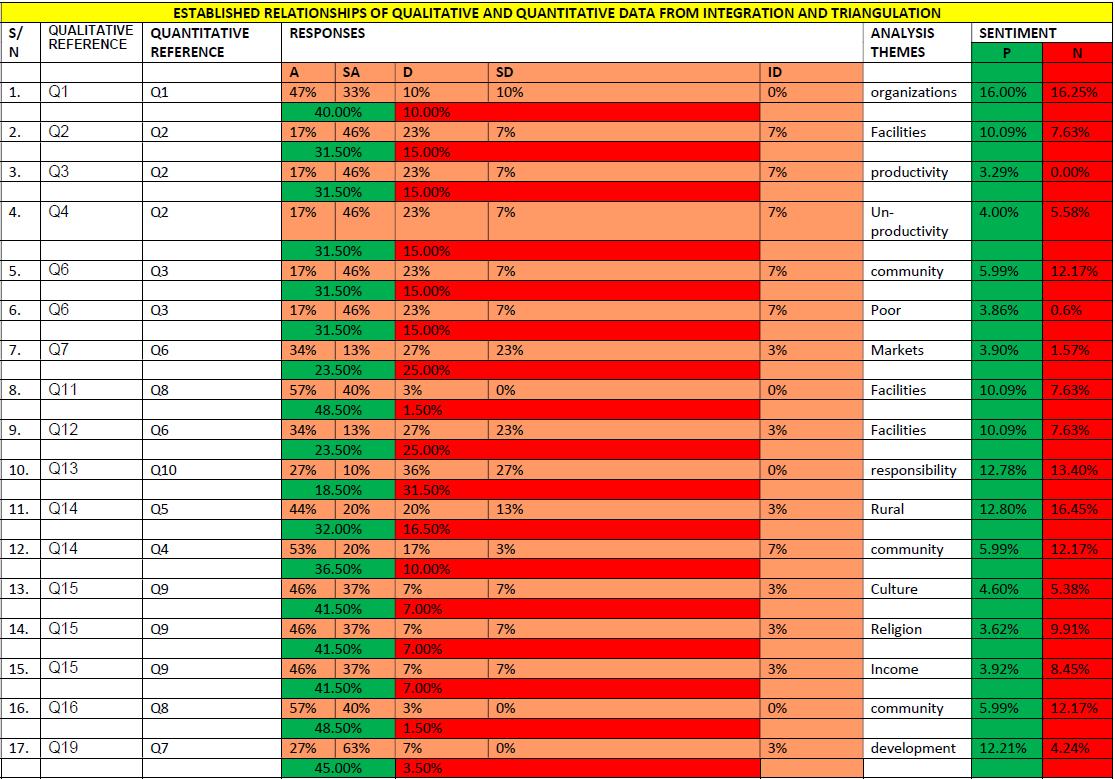
visualization diagrams as in figure 8 and 9; to help communicate particular integrations that can be used to answer the research questions (Wisdom and Creswell, 2013). It is in a bid to validate results that this triangulation design follows a convergent construct (Wisdom and Creswell, 2013) seeing that this can help in adequate terms to explore, dissect and parse complex human emotions and dispositions even with its time consuming and complex nature, the process has been carefully and patiently effectuated in this research study for validation and near accurate purposes (Noble and Healle, 2019). The established relationships are based on averages of multiple responses, where the values of responses like Agree and Strongly Agree, etc are summed up and averaged to come up with percentages that indicate either a positive or negative sentiment (for some elements of the quantitative data). The qualitative data sentiment percentages were obtained from the child and sibling nodes analysis of the main themes identified in figure 8, for a comprehensive visualization of these percentages see chart 22 below. An attempt was made to create an integrated results oriented pattern from qualitative and quantitative questions (Q), were the highest percentages reflect either a positive (P) outcome when both quantitative and qualitative highest percentages are positive, or a negative (N) outcome when both quantitative and qualitative highest percentages are negative and finally an issue-based (I-B) outcome when the highest quantitative or qualitative outcomes are negative and positive; in the context of integrated quantitative and qualitative themes. The use of colors has been adopted because of their unique nature of showing variation. 4.3.2 INTEGRATION AND TRIANGULATION RESULTS
Qualitative Q2 + Quantitative Q2 (Working with ISs in Organizations), theme = facilities, outcome = (P) positive 31.50%, positive 10.09% Qualitative Q3 + Quantitative Q2 (Productivity with regards ISs in Organizations), theme = productivity, outcome = (P) positive 31.50%, positive 3.29% Qualitative Q4 + Quantitative Q2 (Un-productivity with regards ISs in Organizations),
FACTORS INFLUENCING INFORMATION SYSTEMS FAILURES IN NASARAWA STATE, NIGERIA FIGURE 8: INTEGRATION AND TRIANGULATION (A MASTER’S RESEARCH PROJECT)
72 | P a g e
FACTORS INFLUENCING INFORMATION SYSTEMS FAILURES IN NASARAWA STATE, NIGERIA (A MASTER’S RESEARCH PROJECT)
73 | P a g e
FACTORS INFLUENCING INFORMATION SYSTEMS FAILURES IN NASARAWA STATE, NIGERIA (A MASTER’S RESEARCH PROJECT)
74 | P a g e
FACTORS INFLUENCING INFORMATION SYSTEMS FAILURES IN NASARAWA STATE, NIGERIA (A MASTER’S RESEARCH PROJECT)
75 | P a g e
FACTORS INFLUENCING INFORMATION SYSTEMS FAILURES IN NASARAWA STATE, NIGERIA (A MASTER’S RESEARCH PROJECT)FIGURE 9: ESTABLISHED RELATIONSHIPS
76 | P a g e
FACTORS INFLUENCING INFORMATION SYSTEMS FAILURES IN NASARAWA STATE, NIGERIA (A MASTER’S RESEARCH PROJECT)
77 | P a g e
FACTORS INFLUENCING INFORMATION SYSTEMS FAILURES IN NASARAWA STATE, NIGERIA (A MASTER’S RESEARCH PROJECT)
78 | P a g e
FACTORS INFLUENCING INFORMATION SYSTEMS FAILURES IN NASARAWA STATE, NIGERIA (A MASTER’S RESEARCH PROJECT)
79 | P a g e
FACTORS INFLUENCING INFORMATION SYSTEMS FAILURES IN NASARAWA STATE, NIGERIA (A MASTER’S RESEARCH PROJECT) CHART 22: COMBINED VIEW OF SENTIMENT PERCENTAGES FROM CHILD AND SIBLING NODES OF ESTABLISHED THEMES
30.00%
25.00%
20.00%
15.00%
10.00%
5.00%
0.00% 80 | community markets organizations P a g e poor culture income relig ion rural development productivity unproductivity responsibility data facilities systems electronic computers dig ital phone online internet effective knowledge manage technicians Sentiment\\Negative Sentiment\\Pos i tive
FACTORS INFLUENCING INFORMATION SYSTEMS FAILURES IN NASARAWA STATE, NIGERIA (A MASTER’S RESEARCH PROJECT) Qualitative Q19 + Quantitative Q7 (Advice to government in terms of IS development in-line with professional support), theme = development, outcome = (P) positive 45.00%, positive 12.21% Qualitative Q1 + Quantitative Q11 (Nature and Alignment of IS ideas with 21st Century), theme = effectiveness, outcome = (P) positive 84.00%, positive 6.73% Qualitative Q5 + Quantitative Q19 (The comfort derived from this ISs and the will to use them), theme = effectiveness, outcome = (P) positive 70.00%, positive 6.73% Qualitative Q20 + Quantitative Q15 (Establishing the need for foreign or local technicians), theme = knowledge, outcome = (P) positive 60.00%, positive 12.95% Qualitative Q2 + Quantitative Q13 (Availability of quality software digital systems),
Qualitative Q20 + Quantitative Q16 (who manages the technology and what’s their
Qualitative Q20 + Quantitative Q18 (Reliance is on foreign or local technician), theme =
Qualitative Q20 + Quantitative Q17 (Preference for local or foreign technician), theme = technicians, outcome = (P) positive 80.00%, positive 18.98% Qualitative Q17 + Quantitative Q14 (Frequency of technology change, its effect and
outcome = (N) negative 32.00%, negative 17.78%

