March Quarter 2024 Quarterly Market Insights
TABLE OF CONTENTS 1.0 Foreword 04 1.1 National Highlights 08 VICTORIA 2.1 Market Drivers 12 2.2 Land Market 14 2.3 Development Sites 20 QUEENSLAND 3.1 Market Drivers 24 3.2 Land Market 26 SOUTH AUSTRALIA 4.1 Market Drivers 38 4.2 Land Market 40
1.0
Foreword
Residential land markets across the nation continue to adjust to the dynamic economic and property market environment.
Affordability constraints remain key challenges for many buyers with affordability emerging as one of the most important drivers of market activity.
We continue to observe growing buyer interest in relatively more affordable markets (for example, Adelaide and South East Queensland).
In addition to growing buyer demand from existing residents, demand in more affordable markets is underpinned by high overseas migration levels. In the case of Queensland, interstate migration also continues to be another critical driver of demand.
Sale volumes in the March quarter increased in South East Queensland and Victoria. Adelaide volumes moderated over the quarter but remained solid.
Gross prices generally remained resilient over the quarter despite higher interest rates, cost of living pressures and a slowing economy. Incentives and rebates have become increasingly widespread in Melbourne and some Victorian regional markets and are expected to remain in place for some time.
Although construction cost growth has moderated over the last year, consistent with the broader moderation in inflation, the introduction of the National Construction Code (NCC) is expected to see an increase in costs.
Various factors will influence the outlook for the new residential land market. These factors include the continued rebound in the established property market (driven to a significant extent by a growing housing shortage), the future direction of interest rates which will depend on inflation (inflation continues to moderate but remains high) and buyer confidence.
Notably, the nation’s housing affordability and supply crisis is expected to last for some time.
Innovation, ensuring greater affordability and a diverse product offering, to suit a range of market segments and demographic groups, remains key to maximising opportunities.
Our Quarterly Market Insights (QMI) report examines key indicators to anticipate market trends and assess the outlook. We analyse past and present market performance to identify future directions. We are committed to providing leading market insights, forecasts and in-depth Australian residential property market analysis.
4 QUARTERLY MARKET INSIGHTS MARCH QUARTER 2024

5 QUARTERLY MARKET INSIGHTS MARCH QUARTER 2024 Julian Coppini Chief Executive Officer - Project Marketing j.coppini@oliverhume.com.au
TERRITORY
WESTERN AUSTRALIA NORTHERN
SOUTH AUSTRALIA
NEW SOUTH WALES
QUEENSLAND
VICTORIA
TASMANIA
1.0 National Highlights

8 QUARTERLY MARKET INSIGHTS MARCH QUARTER 2024 National Highlights 1.1 George Bougias National Head of Research g.bougias@oliverhume.com.au Cash Rate Target 4.35% Economic Growth 1.5% Inflation 3.6% Unemployment Rate 3.8% Employment Growth 2.4% Wage Growth 4.2% Average Weekly Earning $1,432 Household Saving Ratio 3.2% Net foreign liabilities 32.3% % of GDP Conversion Rate A$1 2.4% $0.65 Population Annual Growth 26.6M Employment to Population Ratio 64.1% Average Price of Residential Dwellings $934K Household Wealth as a share of income as a share of income 890% Household debt 186% =US Sources: Reserve Bank of Australia (RBA) snapshot (as at 9 May 2024), Australian Bureau of Statistics (ABS).
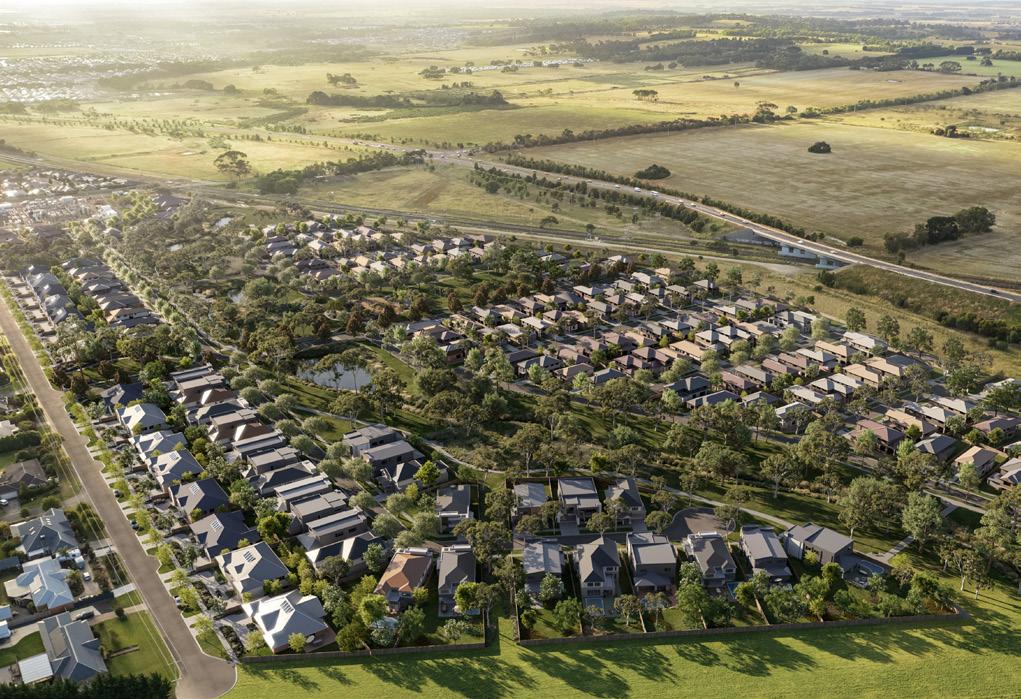
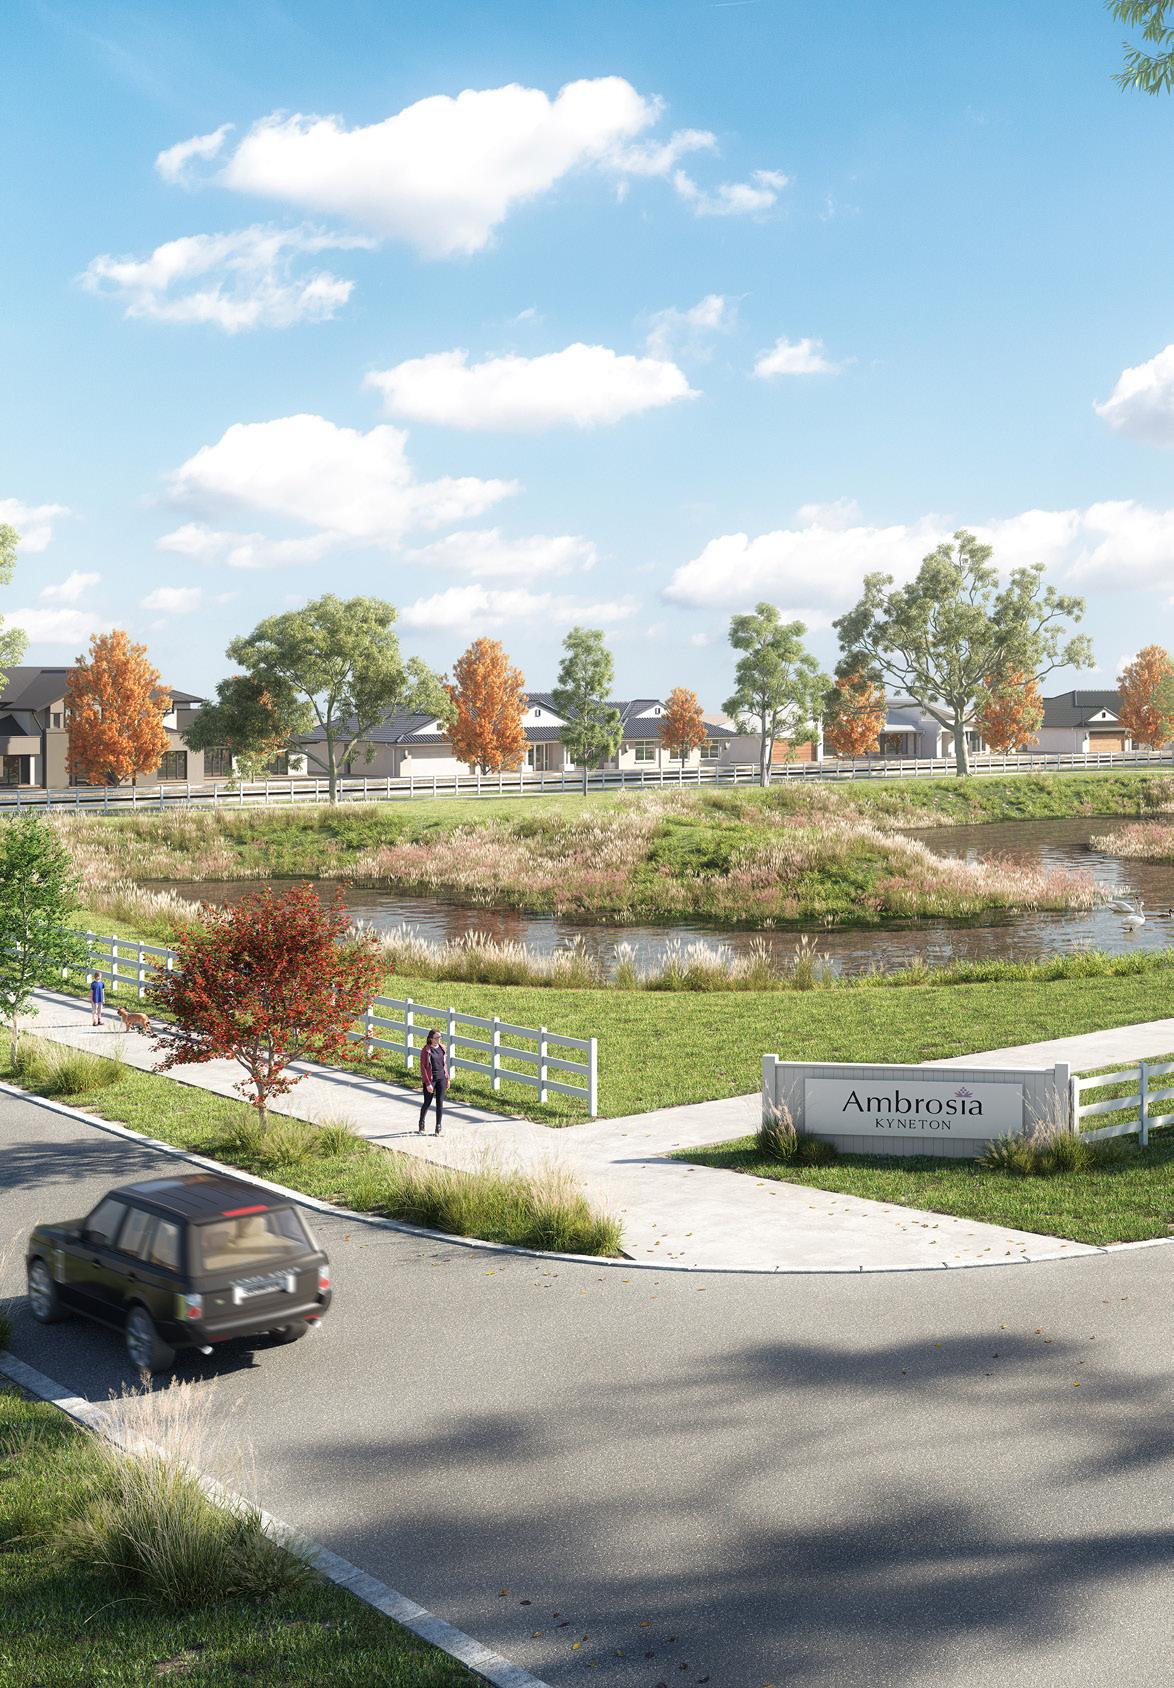 Ambrosia - New Oliver Hume project in Kyneton, Victoria. Artist Impression.
2.0 Victoria
Market Drivers
High interest rates, cost of living pressures and relatively higher taxes (compared to many other jurisdictions) remain key challenges for Victoria’s economy.
The State’s unemployment rate has remained relatively low (4.1% in March 2024 on a seasonally adjusted basis) but is expected to edge higher.
Population growth remains a key driver of economic growth and the property market.
Victoria’s population increased by around 192,700 people in the year ending September 30 2023. This was the largest increase of all states and territories and higher than NSW (around 186,100).
Population growth was driven by (net) overseas migration (over 161,750) over the period.
12 QUARTERLY MARKET INSIGHTS MARCH QUARTER 2024
2.1 Economy Source: RBA, ABS. % 8 7 6 5 4 3 2 VIC NSW QLD SA TAS WA 2024 2017 2017 2024 2010 2010 State Unemployment Rates (%) - Seasonally adjusted % 18 12 6 0 Labour Underutilisation Rates - Australia 1996 1982 1968 2024 2010 * Employed people who want, and are available, to work more hours. ** Sum of the unemployment and underemployment rates. Source: RBA, ABS. Underemployment Rate* Unemployment Rate Underutilisation Rate**

Population growth remains a key driver of economic growth and the property market.
Land Market
Prices
The median (gross) price of metropolitan Melbourne (conventional) lots increased by 2.3% to reach $408,000 in the March quarter 2024.
Net prices remain much lower, however, with generous incentives and rebates becoming increasingly common over the last year.
$450,000
$400,000
$350,000
$300,000
$250,000
$200,000
$150,000
14 QUARTERLY MARKET INSIGHTS MARCH QUARTER 2024
2.2 QI. ‘11 QIII. ‘11 QI. ‘12 QIII. ‘12 QI. ‘13 QIII. ‘13 QI. ‘14 QIII. ‘14 QI. ‘15 QIII. ‘15 QI. ‘16 QIII. ‘16 QI. ‘17 QIII. ‘17 QI. ‘18 QIII. ‘18 QI. ‘19 QIII. ‘19 QI. ‘20 QIII. ‘20 QI. ‘21 QIII. ‘21 QI. ‘22 QIII. ‘22 QI. ‘23 QIII. ‘23 QI. ‘24
Source: Oliver Hume. Sold conventional lots.
Metropolitan Melbourne Growth Area Municipalities Median Gross Land Price
$500,000
$450,000
$400,000
$350,000
$300,000
$250,000
$200,000
$150,000
$100,000
$50,000
$0
15 QUARTERLY MARKET INSIGHTS MARCH QUARTER 2024
QI. ‘10 QIII. ‘10 QI. ‘11 QIII. ‘11 QI. ‘12 QIII. ‘12 QI. ‘13 QIII. ‘13 QI. ‘14 QIII. ‘14 QI. ‘15 QIII. ‘15 QI. ‘16 QIII. ‘16 QI. ‘17 QIII. ‘17 QI. ‘18 QIII. ‘18 QI. ‘19 QIII. ‘19 QI. ‘20 QIII. ‘20 QI. ‘21 QIII. ‘21 QI. ‘22 QIII. ‘22 QI. ‘23 QIII. ‘23 QI. ‘24
Victorian Growth Area Median Gross Land Prices
Cardinia Casey Whittlesea Hume Melton Wyndham Mitchell Geelong Median (all of VIC)
Source: Oliver Hume. Sold lots. Annual moving average.
The Grange Waurn Ponds - Oliver Hume project in Victoria.
Land Market
Sales Volume
The volume of Melbourne lot sales rose in the March quarter 2024.
The result was driven partly by more transactions occurring in key markets including Melbourne’s western and northern greenfield growth corridors.
Volumes, however, remain well below long-run average levels and underlying demand due to affordability and serviceability constraints and lower levels of buyer confidence.
16 QUARTERLY MARKET INSIGHTS MARCH QUARTER 2024
500 0 Mar-04 Mar-05 Mar-06 Mar-07 Mar-08 Mar-09 Mar-10 Mar-11 Mar-12 Mar-13 Mar-14 Mar-15 Mar-16 Mar-17 Mar-18 Mar-19 Mar-20 Mar-21 Mar-22 Mar-23 Mar-24
2,500 2,000 1,500 1,000
Metropolitan Melbourne Residential Greenfield Sales - Monthly
Source: Oliver Hume.
2.2
Source: Oliver Hume.
The average time on market (the time taken to sell lots from release) in the Melbourne market reached a recent all-time high in the March quarter of 2024.
New Residential Land - Average Time on Market (Days) - Metropolitan Melbourne Growth Area Municipalities
Source: Oliver Hume. Time on Market
17 QUARTERLY MARKET INSIGHTS MARCH QUARTER 2024 QII. ‘12 QIII. ‘12 QIV. ‘12 QI. ‘13 QII. ‘13 QIII. ‘13 QIV. ‘13 QI. ‘14 QII. ‘14 QIII. ‘14 QIV. ‘14 QI. ‘15 QII. ‘15 QIII. ‘15 QIV. ‘15 QI. ‘16 QII. ‘16 QIII. ‘16 QIV. ‘16 QI. ‘17 QII. ‘17 QIII. ‘17 QIV. ‘17 QI. ‘18 QII. ‘18 QIII. ‘18 QIV. ‘18 QI. ‘19 QII. ‘19 QIII. ‘19 QIV. ‘19 QI. ‘20 QII. ‘20 QIII. ‘20 QIV. ‘20 QI. ‘21 QII. ‘21 QIII. ‘21 QIV. ‘21 QI. ‘22 QII. ‘22 QIII. ‘22 QIV. ‘22 QI. ‘23 QII. ‘23 QIII. ‘23 QIV. ‘23 QI. ‘24
500 450 400 350 300 250 200 150 100 50 0
City of Greater Geelong Residential Greenfield Sales - Monthly
Mar-10 Mar-11 Mar-12 Mar-13 Mar-14 Mar-15 Mar-16 Mar-17 Mar-18 Mar-19 Mar-20 Mar-21 Mar-22 Mar-23 Mar-24
250 225 200 175 150 125 100 75 50 25 0
GEELONG TARNEIT $412,500 $456,900 MELTON SOUTH n/a $377,500 WYNDHAM VALE n/a $416,000 FRASER RISE $432,900 $454,000 LARA $379,900 $395,950 MAMBOURIN $387,500 $420,000 ARMSTRONG CREEK $407,000 $445,000 Metropolitan Melbourne March Quarter 2024 VICTORIA Source: Oliver Hume. All lots. Gross. Commonly Sold Lots 12.5 x 32m 12.5 x 28m 14 x 32m Median Price Median Size Median Value Rate $404,000* 363 sqm $1,114 per sqm
Median Lot Prices by Suburb (Gross)
$435,000
$517,500
$455,000
MELBOURNE MICKLEHAM n/a
CRAIGIEBURN
$497,000 WOLLERT $450,000 n/a GREENVALE
n/a CLYDE $464,000 $472,000 BERWICK $572,500 $657,000 400 sqm Median Price 448 sqm Median Price Source: Oliver Hume. Sold.
400 sqm and 488 sqm Lots VICTORIA
Development Sites

Development site purchaser demand continues to increase steadily, buoyed by a gradual improvement in sentiment. This is despite continued challenges such as higher taxes and higher borrowing costs.
Sentiment has been increasingly driven by a range of factors including:
• Growing housing shortages
• The confirmation that policy settings will not change (including especially the State Government’s overall strategic planning framework which aims to constrain greenfield residential development going forward)
• The expectation that the residential retail land market will improve gradually over the medium term because of lower net prices driven by the growth in incentives and rebates.
Views on monetary policy and interest rates have also driven sentiment to a certain degree.
Although interest rates are now generally expected to stay higher for longer, given recent data which suggests inflation remains too high, many developers are increasingly of the view that we continue to approach the point when monetary policy might be eased.
This is especially the case given the continued slowing of the Australian economy. Nevertheless, inflation remains the key focus, and data over the coming months will provide much needed certainty on potential future interest rate movements.
Development site inventory remains constrained, with many land holders opting to hold, given the view that demand is likely to far exceed supply over the medium to long term.
Finance costs have remained relatively stable in recent months. However, some developers are also factoring in potential interest rate reductions should the RBA move to ease monetary policy.
Infrastructure and related engineering costs remain high, but cost growth has moderated and in some instances stabilised.
The State Government’s decision, as noted in the most recent State Budget, to decrease infrastructure spending going forward may also help to constrain cost growth even further.
Higher State Government taxes, planning/regulatory constraints in Victoria and increasingly robust markets elsewhere in Australia, has seen an increasing number of local developers consider opportunities in other markets (including especially South Australia and Queensland).
In terms of the local market, many developers are focussing on long-term opportunities and ways to increase yield given growing land supply constraints.
By the early to mid-2040s, it’s anticipated that metropolitan Melbourne and Geelong will have minimal new residential land available.
By this time, most planned large-scale land releases are expected to have been absorbed and not replaced under current policies.
Although development site values have remained relatively stable in recent years, with the trend expected to continue in the near-term, values are expected to rise over the medium to long term due to growing land supply constraints.
The rise in land values, combined with limited land supplies and changing demographics (including especially an ageing population), will require higher densities and increased efficiencies throughout greenfield markets.
Peter Vassallo Managing Director | Development Sites p.vassallo@oliverhume.com.au
2.3
Development site purchaser demand continues to increase steadily buoyed by a gradual improvement in sentiment.
3.0 Queensland
Economy
Queensland’s economy remains resilient despite various challenges including higher interest rates and inflation.
Although Queensland’s unemployment rate has edged higher over the last year, it remains at historically low levels (4.1% as at March 2024 on a seasonally adjusted basis).
Population growth has been a key driver of economic growth. Queensland’s population increased by around 143,600 people over the year ended September 30 2023 (up 2.7% to almost 5.5 million).

High levels of overseas migration (almost 88,000 people on a net basis) and strong interstate migration (over 32,600 people on a net basis) drove the strong population growth results over the period.
Many factors, including strong population growth and solid commodity exports, are expected to support Queensland’s economic development.
Drivers 3.1 Robert Sachs Queensland Research Analyst r.sachs@oliverhume.com.au
Market

Queensland’s economy remains resilient despite various challenges including higher interest rates and inflation.
Land Market
Land Market
New residential land (gross) prices moderated in the March quarter of 2024 from the record high in the previous quarter ($345,450 from $349,200).
Despite higher interest rates and inflation, land prices across the broader South East Queensland market remain higher than levels observed throughout 2023.
South East Queensland’s relative affordability and diversity of stock being offered are critical competitive advantages of the market.
South East Queensland Median Gross Land Price
$370,000
$350,000
$330,000
$310,000
$290,000 $270,000
$250,000
26 QUARTERLY MARKET INSIGHTS MARCH QUARTER 2024
3.2
QIII.
QIV. ‘22 QI. ‘23 QIV. ‘23 QI. ‘24 QII. ‘23 QIII. ‘23
Source: Oliver Hume. Sold.
‘22
Sales Volumes
The volume of land sales rose in the March quarter 2024 from the previous quarter. The increase was driven by continued robust population growth and a steady supply of new stock to the market.
South East Queensland Residential Land Sales – Quarterly
Median Lot Size
The median size of lots transacted across the broader South East Queensland market rose in the March quarter 2024.
The size of lots transacted over the last year has remained relatively stable given the continued supply and robust demand for lots sized between 400 sqm and 500 sqm.
South East Queensland Residential Land Median Lot Size (sqm) - Quarterly
27 QUARTERLY MARKET INSIGHTS MARCH QUARTER 2024
460 450 440 430 420 410 400 390 380 370
Source: Oliver Hume.
Source: Oliver Hume.
1,600 1,400 1,200 1,000 800 600 400 200 0 QIV. ‘22 QI. ‘23 QII. ‘23 QIII. ‘23 QIV. ‘23 QI. ‘24 QIV. ‘22 QI. ‘23 QII. ‘23 QIII. ‘23 QIV. ‘23 QI. ‘24
CABOOLTURE $329,900 n/a MORAYFIELD n/a $330,000 WALLOON $268,000 $275,000 RIPLEY $325,000 $328,400 South East Queensland March
QUEENSLAND DEEBING HEIGHTS $311,000 n/a Commonly Sold Lots 12.5 x 30m 14 x 30m 12.5 x 32m Median Price Median Size Median Value Rate $345,450* 431 sqm $825 per sqm Source: Oliver Hume. Gross.
Quarter 2024
BRISBANE PARK RIDGE $330,000 $336,00 375 sqm Median Price 400 sqm Median Price Source: Oliver Hume. Sold. Median Lot Prices by Suburb (Gross) 375 sqm and 400 sqm Lots QUEENSLAND GOLD COAST CHAMBERS FLAT n/a $380,000
4.0 South Australia
Economy
The South Australian economy has remained relatively resilient despite higher interest rates and cost of living pressures.
CommSec recently again ranked South Australia as the best-performing economy.
Areas of relatively strong performance include economic growth, unemployment, construction work and dwelling starts.
South Australia’s unemployment rate remains around record lows (3.9% in March 2024 on a seasonally adjusted basis).

Population growth remains a key driver of the State’s growth.
South Australia’s population increased by around 30,700 people over the year ended September 2023 (up 1.7% to reach over 1.86 million).
Net overseas migration (up over 28,580 people over the year ended September 2023) drove the strong population result.
George Bougias National Head of Research g.bougias@oliverhume.com.au Market Drivers 4.1
The South Australian economy has remained relatively resilient despite higher interest rates and cost of living pressures.
Land Market
Prices
Greater Adelaide median residential land (gross) prices rose in the March quarter of 2024 (up 6.5%) to reach $279,500 (up 16.1% over the year).
Residential land price growth has been driven by Adelaide’s relative affordability and growing housing shortage (Adelaide has one of Australia’s lowest capital city vacancy rates).
Greater Adelaide Median Gross Land Price
$290,000
$270,000
$250,000
$230,000
$210,000 $190,000 $170,000
34 QUARTERLY MARKET INSIGHTS MARCH QUARTER 2024
4.2
QIII. ‘22 QIV. ‘22 QI. ‘23 QIV. ‘23 QI. ‘24 QII. ‘23 QIII. ‘23
Source: Oliver Hume.
Over 630 new residential lots were sold in the Greater Adelaide market in the March quarter 2024.
The volume of sales moderated from the previous quarter (663) but remained higher than the same time last year (569).
The median size of lots transacted across the Greater Adelaide market remained stable (450 sqm) in the March quarter 2024.
35 QUARTERLY MARKET INSIGHTS MARCH QUARTER 2024
Median Lot Size
Sales Volume
Greater
Residential
Median Lot Size (sqm)
Quarterly 460 450 440 430 420 410 400 390 380 370
Adelaide
Land
-
Source: Oliver Hume.
Greater Adelaide Residential Land Sales - Quarterly 1,000 800 600 400 200 0 QIV. ‘22 QI. ‘23 QII. ‘23 QIII. ‘23 QIV. ‘23 QI. ‘24 QIV. ‘22 QI. ‘23 QII. ‘23 QIII. ‘23 QIV. ‘23 QI. ‘24
Source: Oliver Hume.
Greater Adelaide* March Quarter 2024 SOUTH AUSTRALIA Commonly Sold Lots 10 x 30m 12.5 x 30m 15 x 30m Median Price Median Size Median Value Rate $279,500* 450 sqm $560 per sqm
Source: Oliver Hume. *Gross.
300 sqm Median Price 375 sqm Median Price Source: Oliver Hume. Sold. Median Lot Prices by Suburb (Gross) 300 sqm and 375 sqm Lots SOUTH AUSTRALIA MT BARKER $237,000 $255,000 SEAFORD HEIGHTS n/a $375,000 PORT NOARLUNGA SOUTH $319,500 $363,000 ANGLE VALE n/a $232,500 GAWLER BELT $195,000 $217,500 ADELAIDE GAWLER EAST n/a $219,250 MUNNO PARA n/a $210,000 MUNNO PARA DOWNS n/a $244,950 OAKDEN $420,000 $619,000 ANDREWS FARM $211,000 $237,000

HEAD OFFICE Level 2 4 Riverside Quay Southbank, VIC 3006 P. 03 9669 5999
BRISBANE Shop 9, Gasworks Precinct 26 Reddacliff Street Newstead, QLD 4006 P. 07 3216 1666

08 7201 3999 SYDNEY Level 24, Tower 3 300 Barangaroo Avenue Sydney, NSW 2000 P. 1300 881 780 GOLD COAST Suite 5B, Emerald Lakes Town Centre Commercial 3027 The Blvd, Emerald Lakes Carrara QLD 4211
P. 1300 645 433 DARWIN 129 Asche Street Muirhead, NT 0810
1300 7373 598
Important: The information in this document has been prepared a general guide only and does not constitute advice. We have relied upon information from sources generally regarded as authoritative. Whilst the information has been prepared in good faith and with due care, no representation is made in relation to the accuracy of the whole or any part of the publication. No liability for negligence or otherwise is assumed for any loss or damage suffered by any party resulting from their use of this publication. The whole or any part of this publication must not be mirrored, reproduced or copied, without written consent. The document may contain future forecasts of a range of variables, which can be affected by a significant number of unpredictable factors, including social and economic conditions. It only represents the best judgements and estimates, made by Oliver Hume Research. No assurances can be given that the forecasts will be achieved. This document should be read in conjunction with any other documentation prepared by the marketing agent and associated consultants. www.oliverhume.com.au
SOUTH AUSTRALIA 217 Flinders Street Adelaide, SA 5000 P.
P.
