December Quarter
2023
Quarterly Market Insights
TABLE OF CONTENTS 1.0 Foreword 04 1.1 National Highlights 08 VICTORIA 2.1 Market Drivers 12 2.2 Land Market 14 2.3 Development Sites 20 QUEENSLAND 3.1 Market Drivers 24 3.2 Land Market 26 SOUTH AUSTRALIA 4.1 Market Drivers 38 4.2 Land Market 40
Foreword
Conditions across the Australian new residential land market remained relatively unchanged in the final quarter of the year with some positive signs continuing to emerge. Various challenges, however, remain.
Demand edged higher in the quarter but generally remains below long-term average levels with consumer confidence being impacted by higher interest rates, affordability and serviceability pressures and other factors. We expect sales volume will remain below long-term average levels, for most of 2024, although a potential cut in interest rates later this year could encourage more potential buyers to transact.
Gross prices have generally firmed across most major markets in recent months and remain at record highs. Some markets, however, are showing signs of price stabilisation or moderation.
Conditions in the December quarter have given us no reason to alter our view that (net) prices will continue to moderate in 2024 as developers increasingly use incentives and rebates to attract buyers and increase sales volume.
Interest rates – and interest rate expectations –remain a critical factor driving sentiment in 2024. With inflation continuing to moderate, there is a growing consensus that we have reached (or are approaching) the end of the Reserve Bank of Australia’s (RBA) tightening cycle. Nevertheless it is important to note that, given the potential for still higher inflation, further interest rate increases cannot be ruled out.
The outlook for the new residential land market over the medium to long-term remains positive. Although land supply challenges in various markets will remain, continued population growth is expected to ensure robust underlying demand for metropolitan and regional greenfield locations well into the future.
Our Quarterly Market Insights (QMI) report examines key indicators to anticipate market trends and assess the outlook. We analyse past and present market performance to identify future directions. We are committed to providing leading market insights, forecasts and in-depth analysis of the Australian residential property market.
4 QUARTERLY MARKET INSIGHTS DECEMBER QUARTER 2023
1.0
WESTERN AUSTRALIA
NORTHERN TERRITORY
 Julian Coppini
Chief Executive Officer - Project Marketing j.coppini@oliverhume.com.au
Julian Coppini
Chief Executive Officer - Project Marketing j.coppini@oliverhume.com.au
SOUTH AUSTRALIA
QUEENSLAND
VICTORIA
NEW SOUTH WALES
TASMANIA
5 QUARTERLY MARKET INSIGHTS DECEMBER QUARTER 2023
1.0 National Highlights

8 QUARTERLY MARKET INSIGHTS DECEMBER QUARTER 2023 National Highlights 1.1 George Bougias National Head of Research g.bougias@oliverhume.com.au Cash Rate Target 4.35% Economic Growth 2.1% Inflation 4.1% Unemployment Rate 4.1% Employment Growth 2.6% Wage Growth 4.0% Average Weekly Earning $1,399 Household Saving Ratio 1.1% Net foreign liabilities 31.5% % of GDP Conversion Rate A$1 2.4% $0.67 Population Annual Growth 26.6M Employment to Population Ratio 64.1% Average Price of Residential Dwellings $925K Household Wealth as a share of income as a share of income 886% Household debt 185% =US Sources: Reserve Bank of Australia (RBA) snapshot (as at 8 February 2024), Australian Bureau of Statistics (ABS).
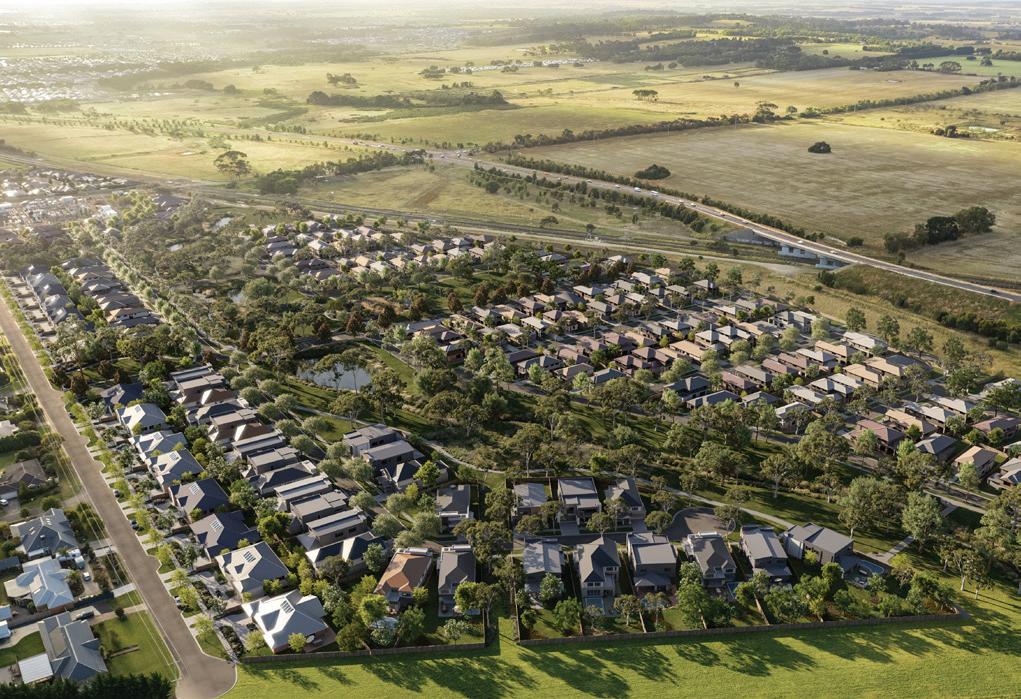
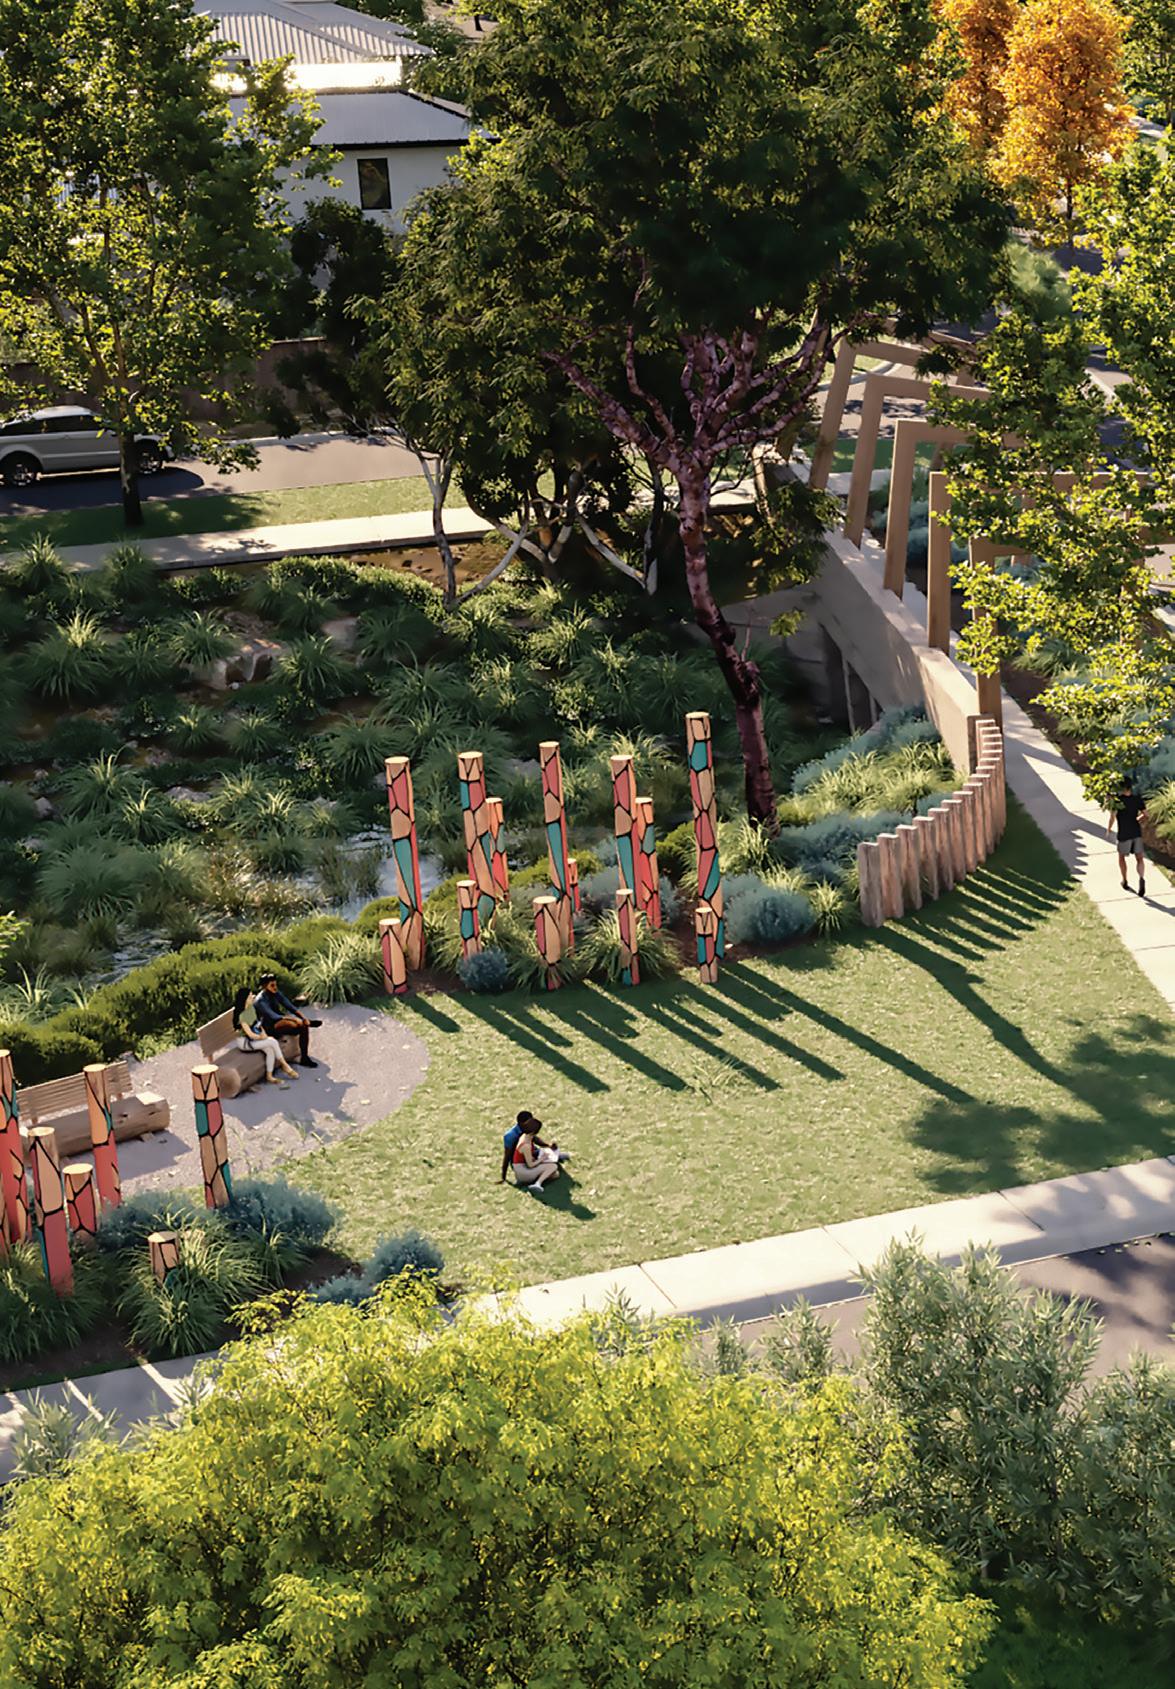 Woodsong - New Oliver Hume project in Mickleham, Victoria.
2.0
Victoria
Woodsong - New Oliver Hume project in Mickleham, Victoria.
2.0
Victoria
Market Drivers
Victoria’s economy remains supported by robust population growth despite various challenges including higher interest rates and cost of living pressures. Victoria’s unemployment rate remains low, at just 3.9%, according to the latest figures published by the Australian Bureau of Statistics (January 2024). In the year ending 30 June 2023, Victoria’s population increased by around 181,800 people (the largest of all states and territories).
Population growth was driven by (net) overseas migration (around 154,200) over the period. Deloitte Access Economics forecasts that Victoria will lead all states in economic growth over the next five years. The Deloitte Access Economics Business Outlook report forecasts that Victoria’s economic growth in 2023-24 will be 2.5% (the highest of all states and territories).
The report forecasts that Victoria’s economic growth over the five years to 2027-28 will average 2.3% per annum outpacing all states.
12 QUARTERLY MARKET INSIGHTS DECEMBER QUARTER 2023
2.1 Economy Source: RBA, ABS. % 8 7 6 5 4 3 2 VIC NSW QLD SA TAS WA 2023 2017 2017 2023 2011 2011 State Unemployment Rates (%) - Seasonally adjusted % 18 12 6 0 Labour Underutilisation Rates - Australia 1995 1981 1967 2023 2009 * Employed people who want, and are available, to work more hours. ** Sum of the unemployment and underemployment rates. Source: RBA, ABS. Underemployment Rate* Unemployment Rate Underutilisation Rate**

Victoria’s unemployment rate remains low...
2.2
Land Market
Prices
The median (gross) price of metropolitan Melbourne conventional lots increased by 1.5% to $399,000, a record high, in the December quarter 2023.
Price growth was, however, lower than previous quarters and suggests that, consistent with our forecasts, (net) prices are likely moderate in 2024 as incentives and rebates which are already widespread and significant, are increasingly used to boost sales volume.
14 QUARTERLY MARKET INSIGHTS DECEMBER QUARTER 2023
QIV. ‘10 QII. ‘11 QIV. ‘11 QII. ‘12 QIV. ‘12 QII. ‘13 QIV. ‘13 QII. ‘14 QIV. ‘14 QII. ‘15 QIV. ‘15 QII. ‘16 QIV. ‘16 QII. ‘17 QIV. ‘17 QII. ‘18 QIV. ‘18 QII. ‘19 QIV. ‘19 QII. ‘20 QIV. ‘20 QII. ‘21 QIV. ‘21 QII. ‘22 QIV. ‘22 QII. ‘23 QIV. ‘23 Source: Oliver Hume. Sold conventional lots. $450,000 $400,000 $350,000 $300,000 $250,000 $200,000 $150,000 Metropolitan
Melbourne Growth Area Municipalities Median Gross Land Price
15 QUARTERLY MARKET INSIGHTS DECEMBER QUARTER 2023 $500,000 $450,000 $400,000 $350,000 $300,000 $250,000 $200,000 $150,000 $100,000 $50,000 $0 QIV. ‘10 QII. ‘11 QIV. ‘11 QII. ‘12 QIV. ‘12 QII. ‘13 QIV. ‘13 QII. ‘14 QIV. ‘14 QII. ‘15 QIV. ‘15 QII. ‘16 QIV. ‘16 QII. ‘17 QIV. ‘17 QII. ‘18 QIV. ‘18 QII. ‘19 QIV. ‘19 QII. ‘20 QIV. ‘20 QII. ‘21 QIV. ‘21 QII. ‘22 QIV. ‘22 QII. ‘23 QIV. ‘23
Cardinia Casey Whittlesea Hume Melton Wyndham Mitchell Geelong Median (all of VIC) Source: Oliver Hume Research. Sold lots. Annual moving average.
Victorian Growth Area Median Gross Land Prices
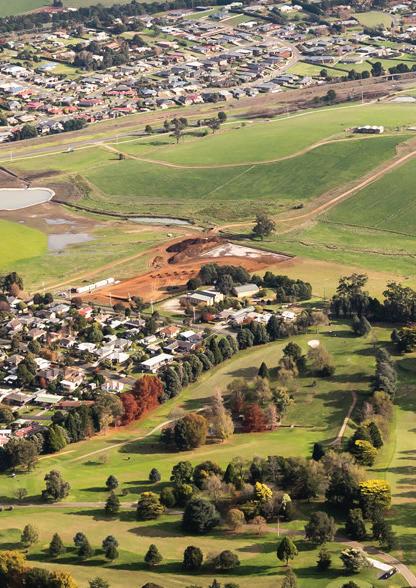
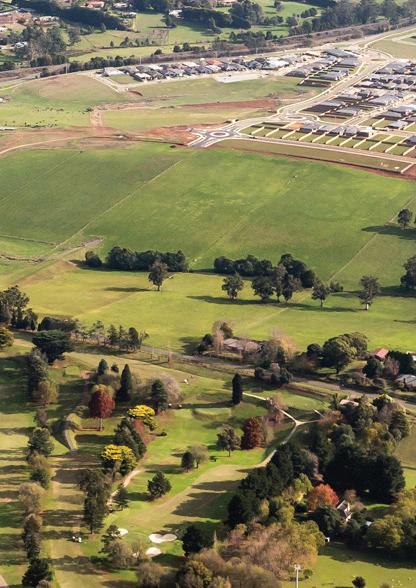
The Grange Waurn Ponds - New Oliver Hume project in Victoria.
Land Market
Sales Volume
The volume of Melbourne lot sales in the December quarter 2023 moderated slightly from the previous quarter. The number of lots sold in the Victorian (both metropolitan and regional) market remains below long-run average levels.
Interest rate increases and much publicised residential building industry issues have driven the lower sales result (although buyer sentiment towards residential building has steadily improved in 2023).
16 QUARTERLY MARKET INSIGHTS DECEMBER QUARTER 2023
2,500 2,000 1,500 1,000 500 0 Dec-04 Dec-05 Dec-06 Dec-07 Dec-08 Dec-09 Dec-10 Dec-11 Dec-12 Dec-13 Dec-14 Dec-15 Dec-16 Dec-17 Dec-18 Dec-19 Dec-20 Dec-21 Dec-22 Dec-23
Oliver Hume Research.
Metropolitan Melbourne Residential Greenfield Sales - Monthly
Source:
2.2
The average time on market for land lots in the metropolitan Melbourne market reached a (recent) all-time high in the December quarter 2023.
17 QUARTERLY MARKET INSIGHTS DECEMBER QUARTER 2023 QII. ‘12 QIV. ‘12 QII. ‘13 QIV. ‘13 QII. ‘14 QIV. ‘14 QII. ‘15 QIV. ‘15 QII. ‘16 QIV. ‘16 QII. ‘17 QIV. ‘17 QII. ‘18 QIV. ‘18 QII. ‘19 QIV. ‘19 QII. ‘20 QIV. ‘20 QII. ‘21 QIV. ‘21 QII. ‘22 QIV. ‘22 QII. ‘23 QIV. ‘23 Source: Oliver Hume Research. Time on Market
500 450 400 350 300 250 200 150 100 50 0
of
Sales
New Residential Land - Average Time on Market (Days) - Metropolitan
Growth Area
Dec-10 Dec-11 Dec-12 Dec-13 Dec-14 Dec-15 Dec-16 Dec-17 Dec-18 Dec-19 Dec-20 Dec-21 Dec-22 Dec-23 Source: Oliver Hume Research. 250 225 200 175 150 125 100 75 50 25 0
City
Greater Geelong Residential Greenfield
- Monthly
Melbourne
Municipalities
GEELONG WERRIBEE $395,000 $407,000 TARNEIT $422,900 $477,000 MELTON SOUTH $399,000 $427,000 FRASER RISE $390,250 $445,500 LARA $389,900 $409,900 MAMBOURIN $393,000 $420,000 ARMSTRONG CREEK $407,000 $441,000 TRUGANINA $448,000 $484,000 Metropolitan Melbourne December Quarter 2023 VICTORIA Source: Oliver Hume Research. All lots. Gross. Commonly Sold Lots 12.5 x 32m 12.5 x 28m 14 x 32m Median Price Median Size Median Value Rate $398,000* 363sqm $1,095 per sqm
MELBOURNE KALKALLO $399,000 $435,000 CLYDE $439,000 $497,000 BERWICK $559,000 $657,000 WALLAN $340,000 $375,000 400 sqm Median Price 448 sqm Median Price Source: Oliver Hume Research. Sold. Median Lot Prices by Suburb (Gross) 400 sqm and 488 sqm Lots VICTORIA
Development Sites
 Peter Vassallo Managing Director | Development Sites p.vassallo@oliverhume.com.au
Conditions in the Victorian development site market have remained broadly steady in recent months.
Higher interest rates remain a key issue although finance costs have stabilised.
Similarly, higher construction costs remain a challenge but have also stabilised more recently.
Moderating (net) residential land prices (due mostly to incentives and rebates) and low sales volumes remain a factor in developers’ considerations for the short-term.
However, developers are increasingly looking at the longer-term outlook given a range of factors including land supply / Precinct Structure Plans (PSPs) constraints and significant delays in the planning and development process.
Accordingly, development site purchaser demand has held steady in recent months.
However, we have noticed an uptick in enquiry, in part driven by a growing consensus that the RBA’s tightening cycle is complete (or nearing completion).
Although considerable uncertainty remains around the direction of interest rates and the timing of any interest rate cuts, developers are increasingly recognising that we could be rapidly approaching a point when monetary policy is eased.
Sentiment continues to improve, albeit gradually, as the extent of Victoria’s housing shortage and new dwelling requirement, given continued record population growth, becomes better understood.
This is especially the case given that it appears increasingly likely that government housing targets will not be met, almost definitely, over the short to medium term and, increasingly, over the long-term.
As a result, some potential development site purchasers have restarted their search for suitable sites, while others are considering different options to making sites work (for example, through greater densities).
Headline development site values are likely to remain stable in the foreseeable future, continuing recent trends, but could increase over the next few years as interest rates begin to decline and the housing shortage becomes increasingly acute.
Following the release of the Victorian Government’s Housing Statement late last year, which confirmed the Government’s strategy to ensure that the supply of new dwellings follows the 70/30 split (between established suburbs and growth areas respectively), it remains to be seen how well the Victorian Planning Authority (VPA) can assist the industry in ensuring that greenfield housing supply is delivered.
To achieve the 70/30 split, let alone a higher share of development in the greenfields as has been the case for some time, there continues to be an urgent need for significant reform and improvement in several areas including planning and engineering processes.
We also note the problematic increase in uncertainty around various aspects of the planning process, more particularly Cultural Heritage Management Plans, and their impact on development.
2.3
Sentiment continues to improve... as the extent of Victoria’s housing shortage... becomes better understood.
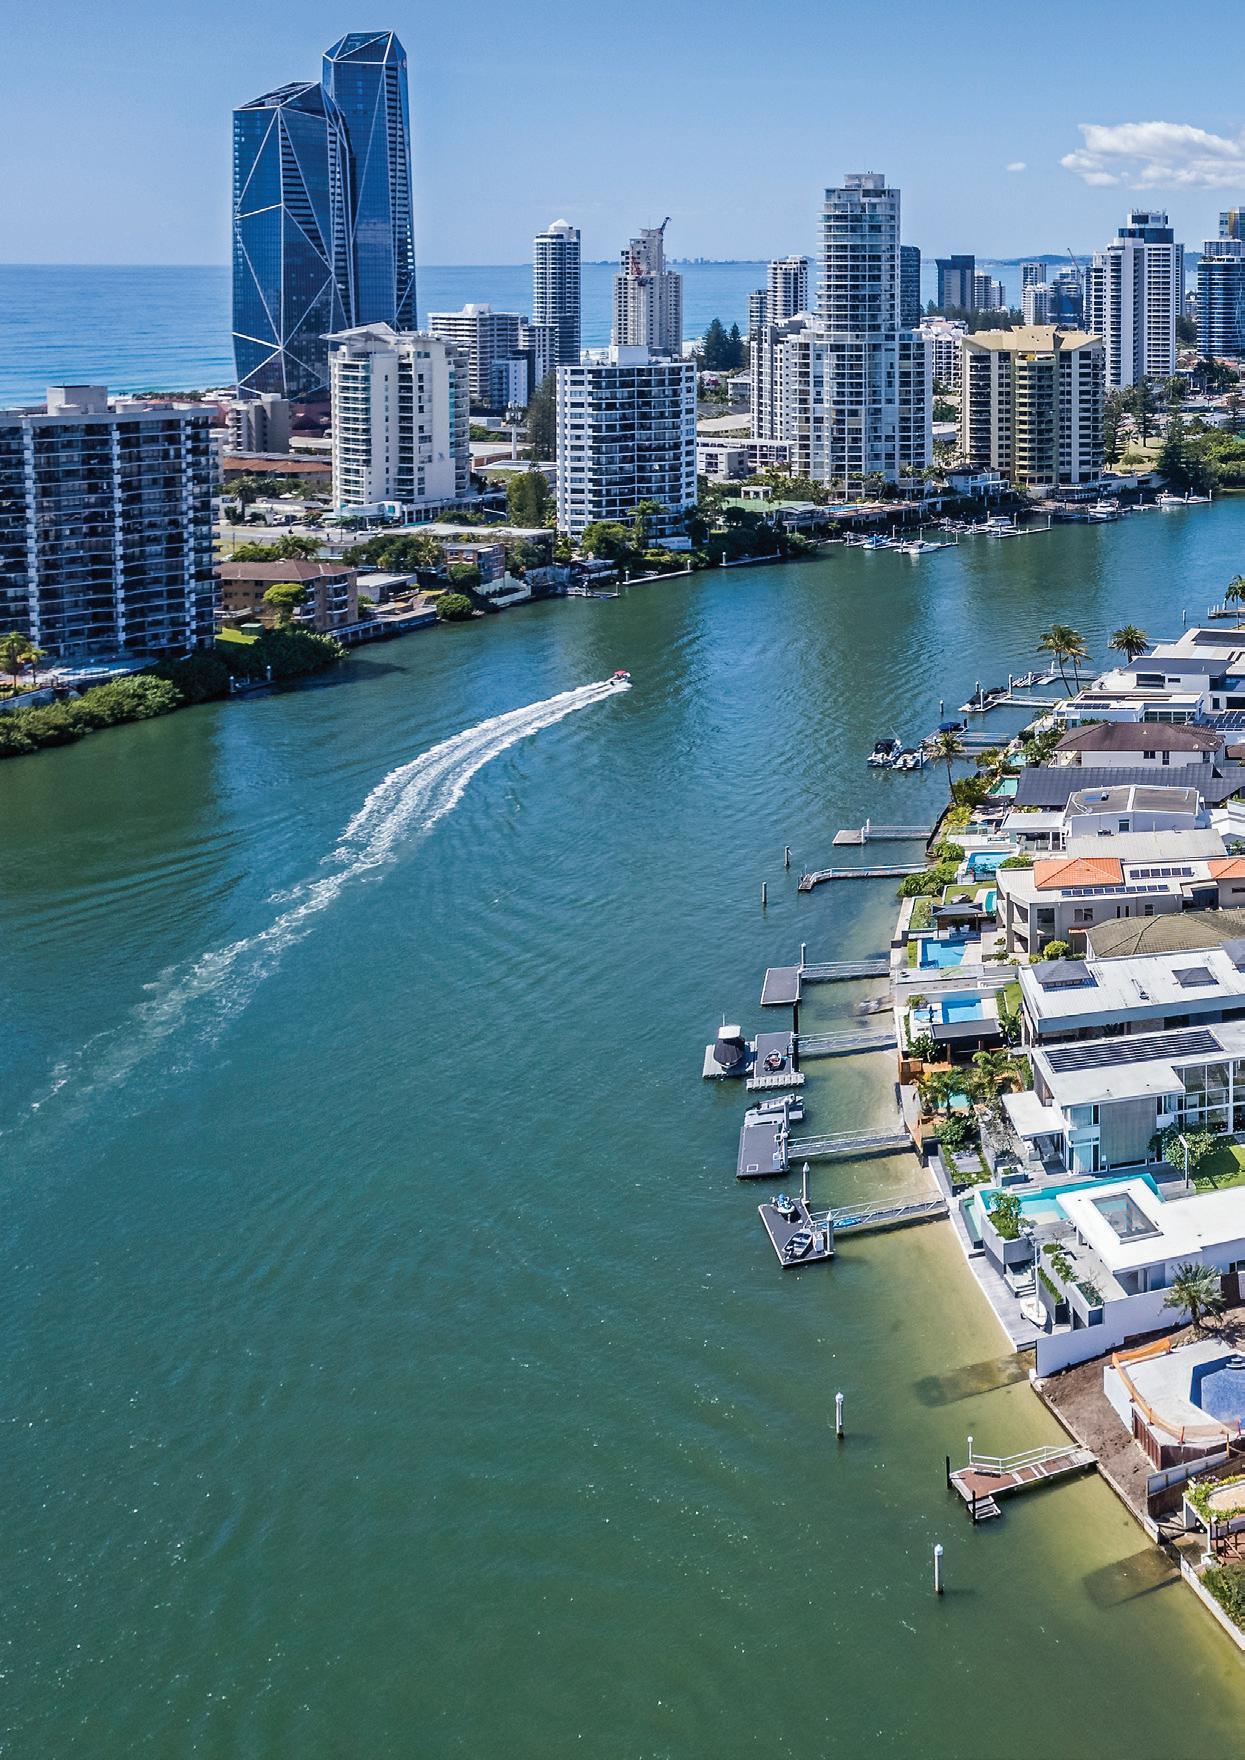
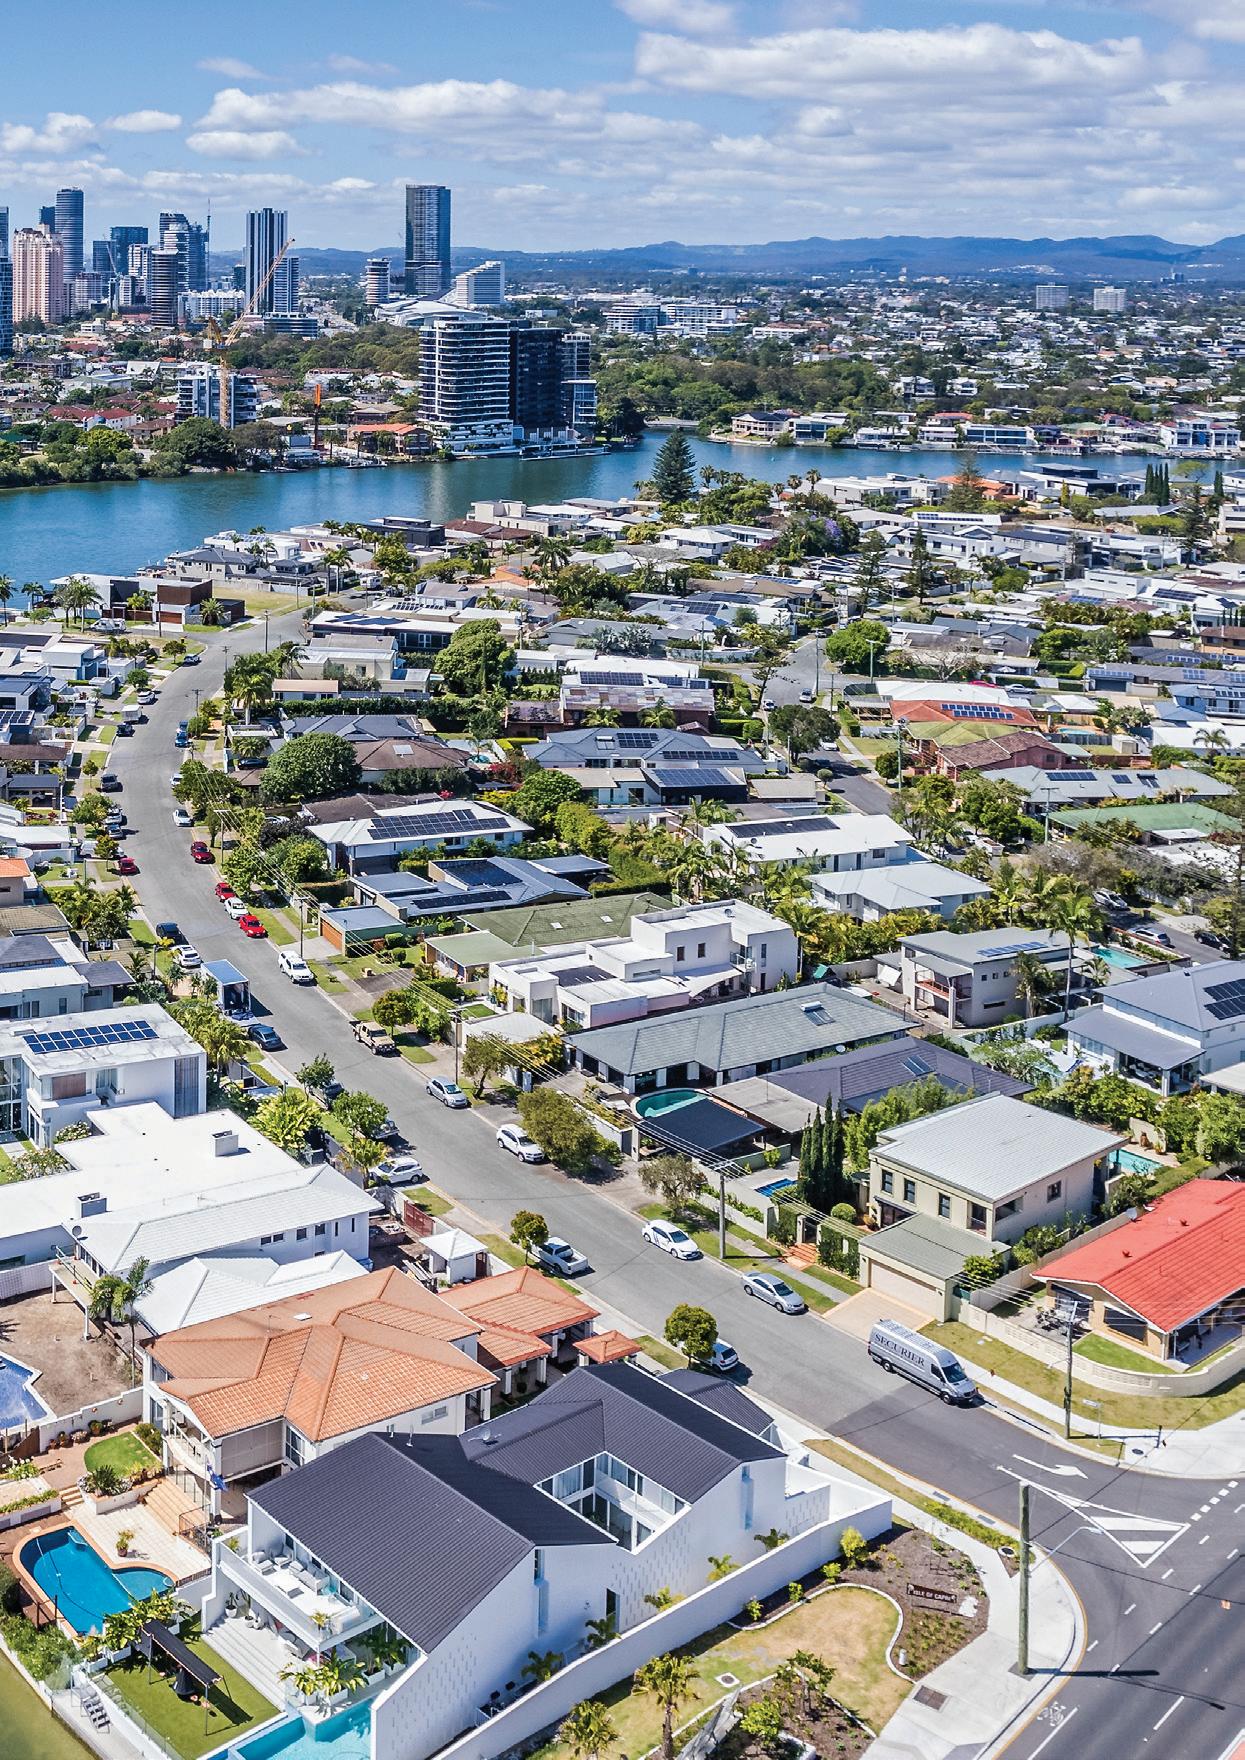
 3.0
Queensland
3.0
Queensland
Market Drivers
Economy
The Queensland Government, as outlined in the 202324 Budget Update released in late 2023, expects the state’s economic growth to accelerate from 2.3%, in 2022-23, to 3% in both 2023-24 and 2024-25.
Economic growth is expected to be driven by a range of sectors and areas of activity including:
• Overseas exports (including coal, LNG, agriculture and various service sectors such as tourism and education)
• Population growth (underpinned by overseas and interstate migration)
• Infrastructure and dwelling investment.

Although Queensland’s unemployment rate has edged higher in 2023 it remains at historically low levels (4.2% as at January 2024 on a seasonally adjusted basis).
Queensland’s population increased by around 138,500 people over the year ended in June 2023 (up 2.6% to reach almost 5.46 million).
High levels of overseas migration (almost 84,000 people on a net basis), coupled with strong interstate migration (over 32,200 people on a net basis) drove the strong population growth result over the period.
s.ozturk@oliverhume.com.au
3.1 Sebastian Ozturk Queensland Research Analyst
The Queensland Government... expects the state’s economic growth to accelerate...
3.2
Land Market
Land Market
New residential median land (gross) prices across the South-East Queensland market edged higher in the December quarter 2023, to reach a new high of $349,200.
The increase in the quarter was underpinned by a range of factors including continued strong population growth, the market’s relative affordability (especially compared to southern markets on the eastern seaboard) and the profile of new land stock coming to market.
26 QUARTERLY MARKET INSIGHTS DECEMBER QUARTER 2023
South East Queensland Median Gross Land Sales Price $370,000 $350,000 $330,000 $310,000 $290,000 $270,000 $250,000 Source: Oliver Hume Research. Sold. QII. ‘22 QIII. ‘22 QIV. ‘22 QI. ‘23 QIV. ‘23 QII. ‘23 QIII. ‘23
Sales Volumes
The volume of land sales in the South East Queensland market continued to rebound in the December quarter. The rebound was driven by increases in both demand and supply with the second half of 2023, in particular, seeing a greater amount of stock being offered to the market.
Source: Oliver Hume Research.
27 QUARTERLY MARKET INSIGHTS DECEMBER QUARTER 2023
Median Lot Size
South East Queensland Residential Land Median Lot Size (sqm) - Quarterly 460 450 440 430 420 410 400 390 380 370
Median lot sizes across the South East Queensland market have remained broadly stable since mid-2022 driven, in part, by the continued focus on popular lot sizes between 400 sqm and 500 sqm (around a third of all stock). Source: Oliver Hume Research. South East Queensland Residential Land Sales – Quarterly 1,600 1,400 1,200 1,000 800 600 400 200 0 QIII. ‘22 QIV. ‘22 QI. ‘23 QII. ‘23 QIII. ‘23 QIV. ‘23 QIII. ‘22 QIV. ‘22 QI. ‘23 QII. ‘23 QIII. ‘23 QIV. ‘23
CABOOLTURE $322,900 n/a MORAYFIELD $347,500 $391,500 WALLOON n/a $250,000 REDBANK PLAINS $305,900 n/a SPRING MOUNTAIN n/a $431,500 RIPLEY $310,000 $336,000 South East Queensland December Quarter 2023 QUEENSLAND COLLINGWOOD PARK $250,000 $271,000 DEEBING HEIGHTS $292,000 $296,000 Commonly Sold Lots 12.5 x 30m 14 x 30m 12.5 x 32m Median Price Median Size Median Value Rate $349,200* 420sqm $845 per sqm Source: Oliver Hume Research. Gross.
BRISBANE NERANG $972,500 n/a PARK RIDGE $325,000 $336,00 375 sqm Median Price 400 sqm Median Price Source: Oliver Hume Research. Sold. Median Lot Prices by Suburb (Gross) 375 sqm and 400 sqm Lots QUEENSLAND GOLD COAST CHAMBERS FLAT n/a $332,500
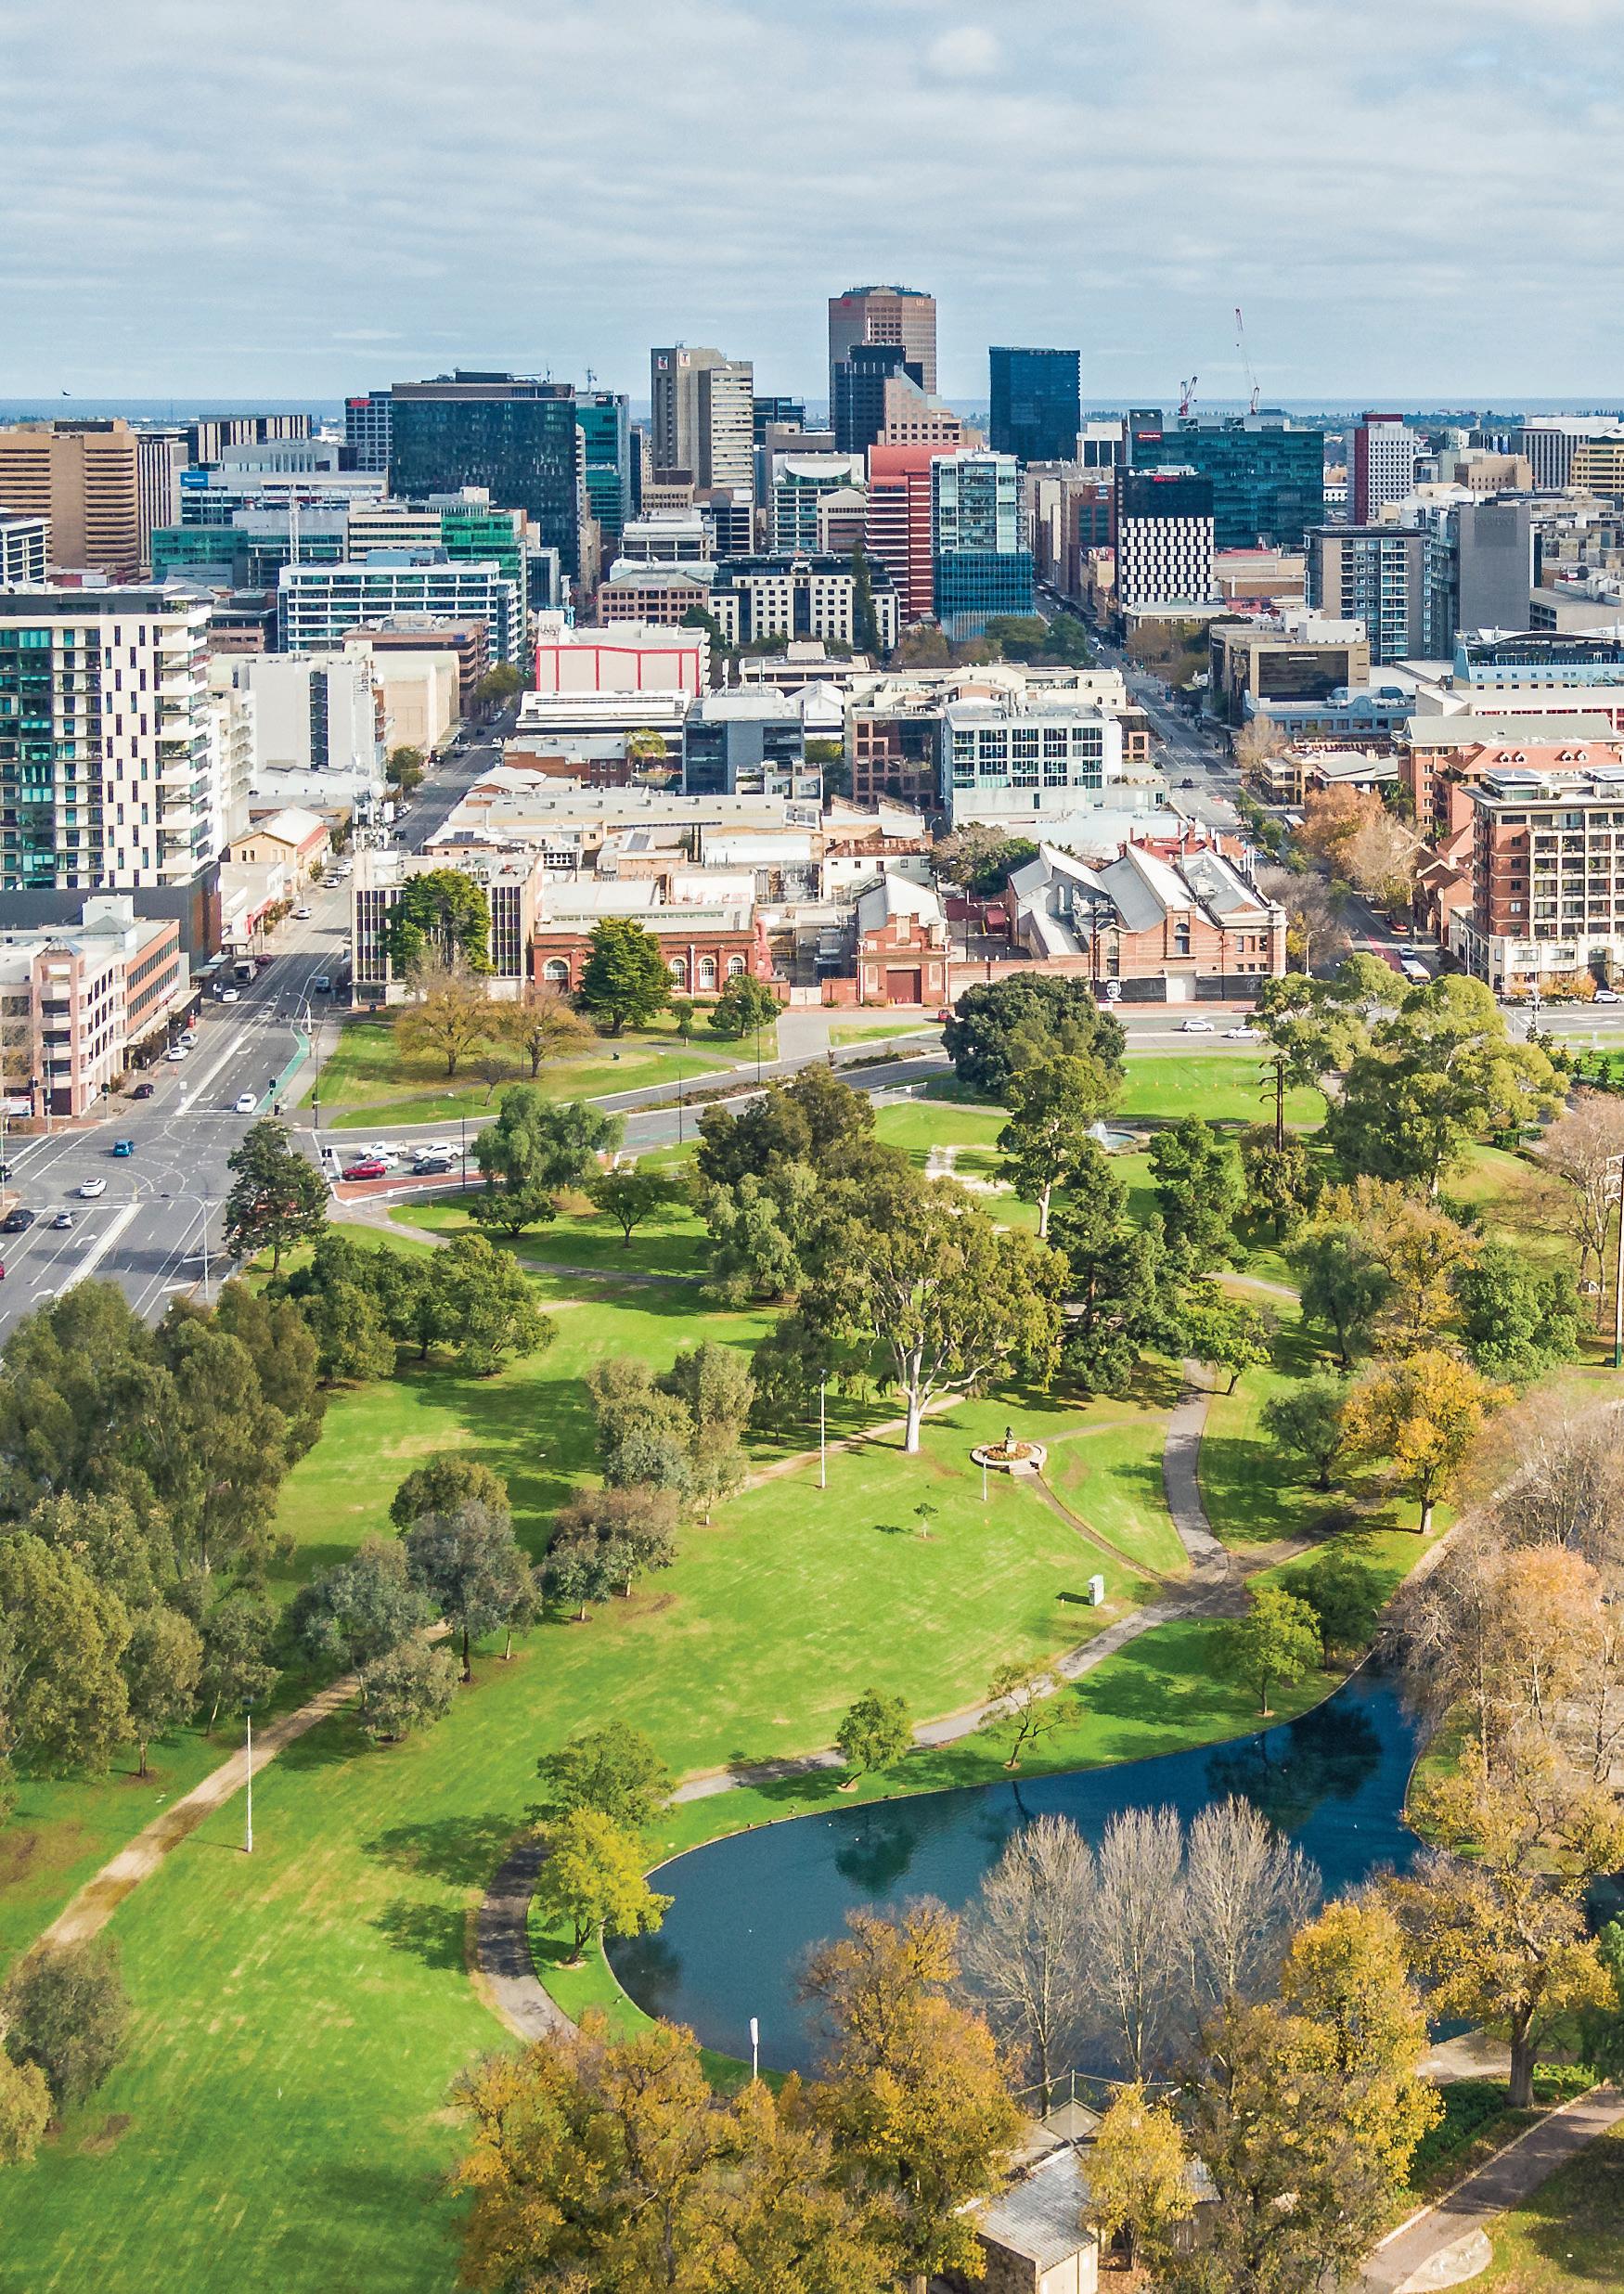
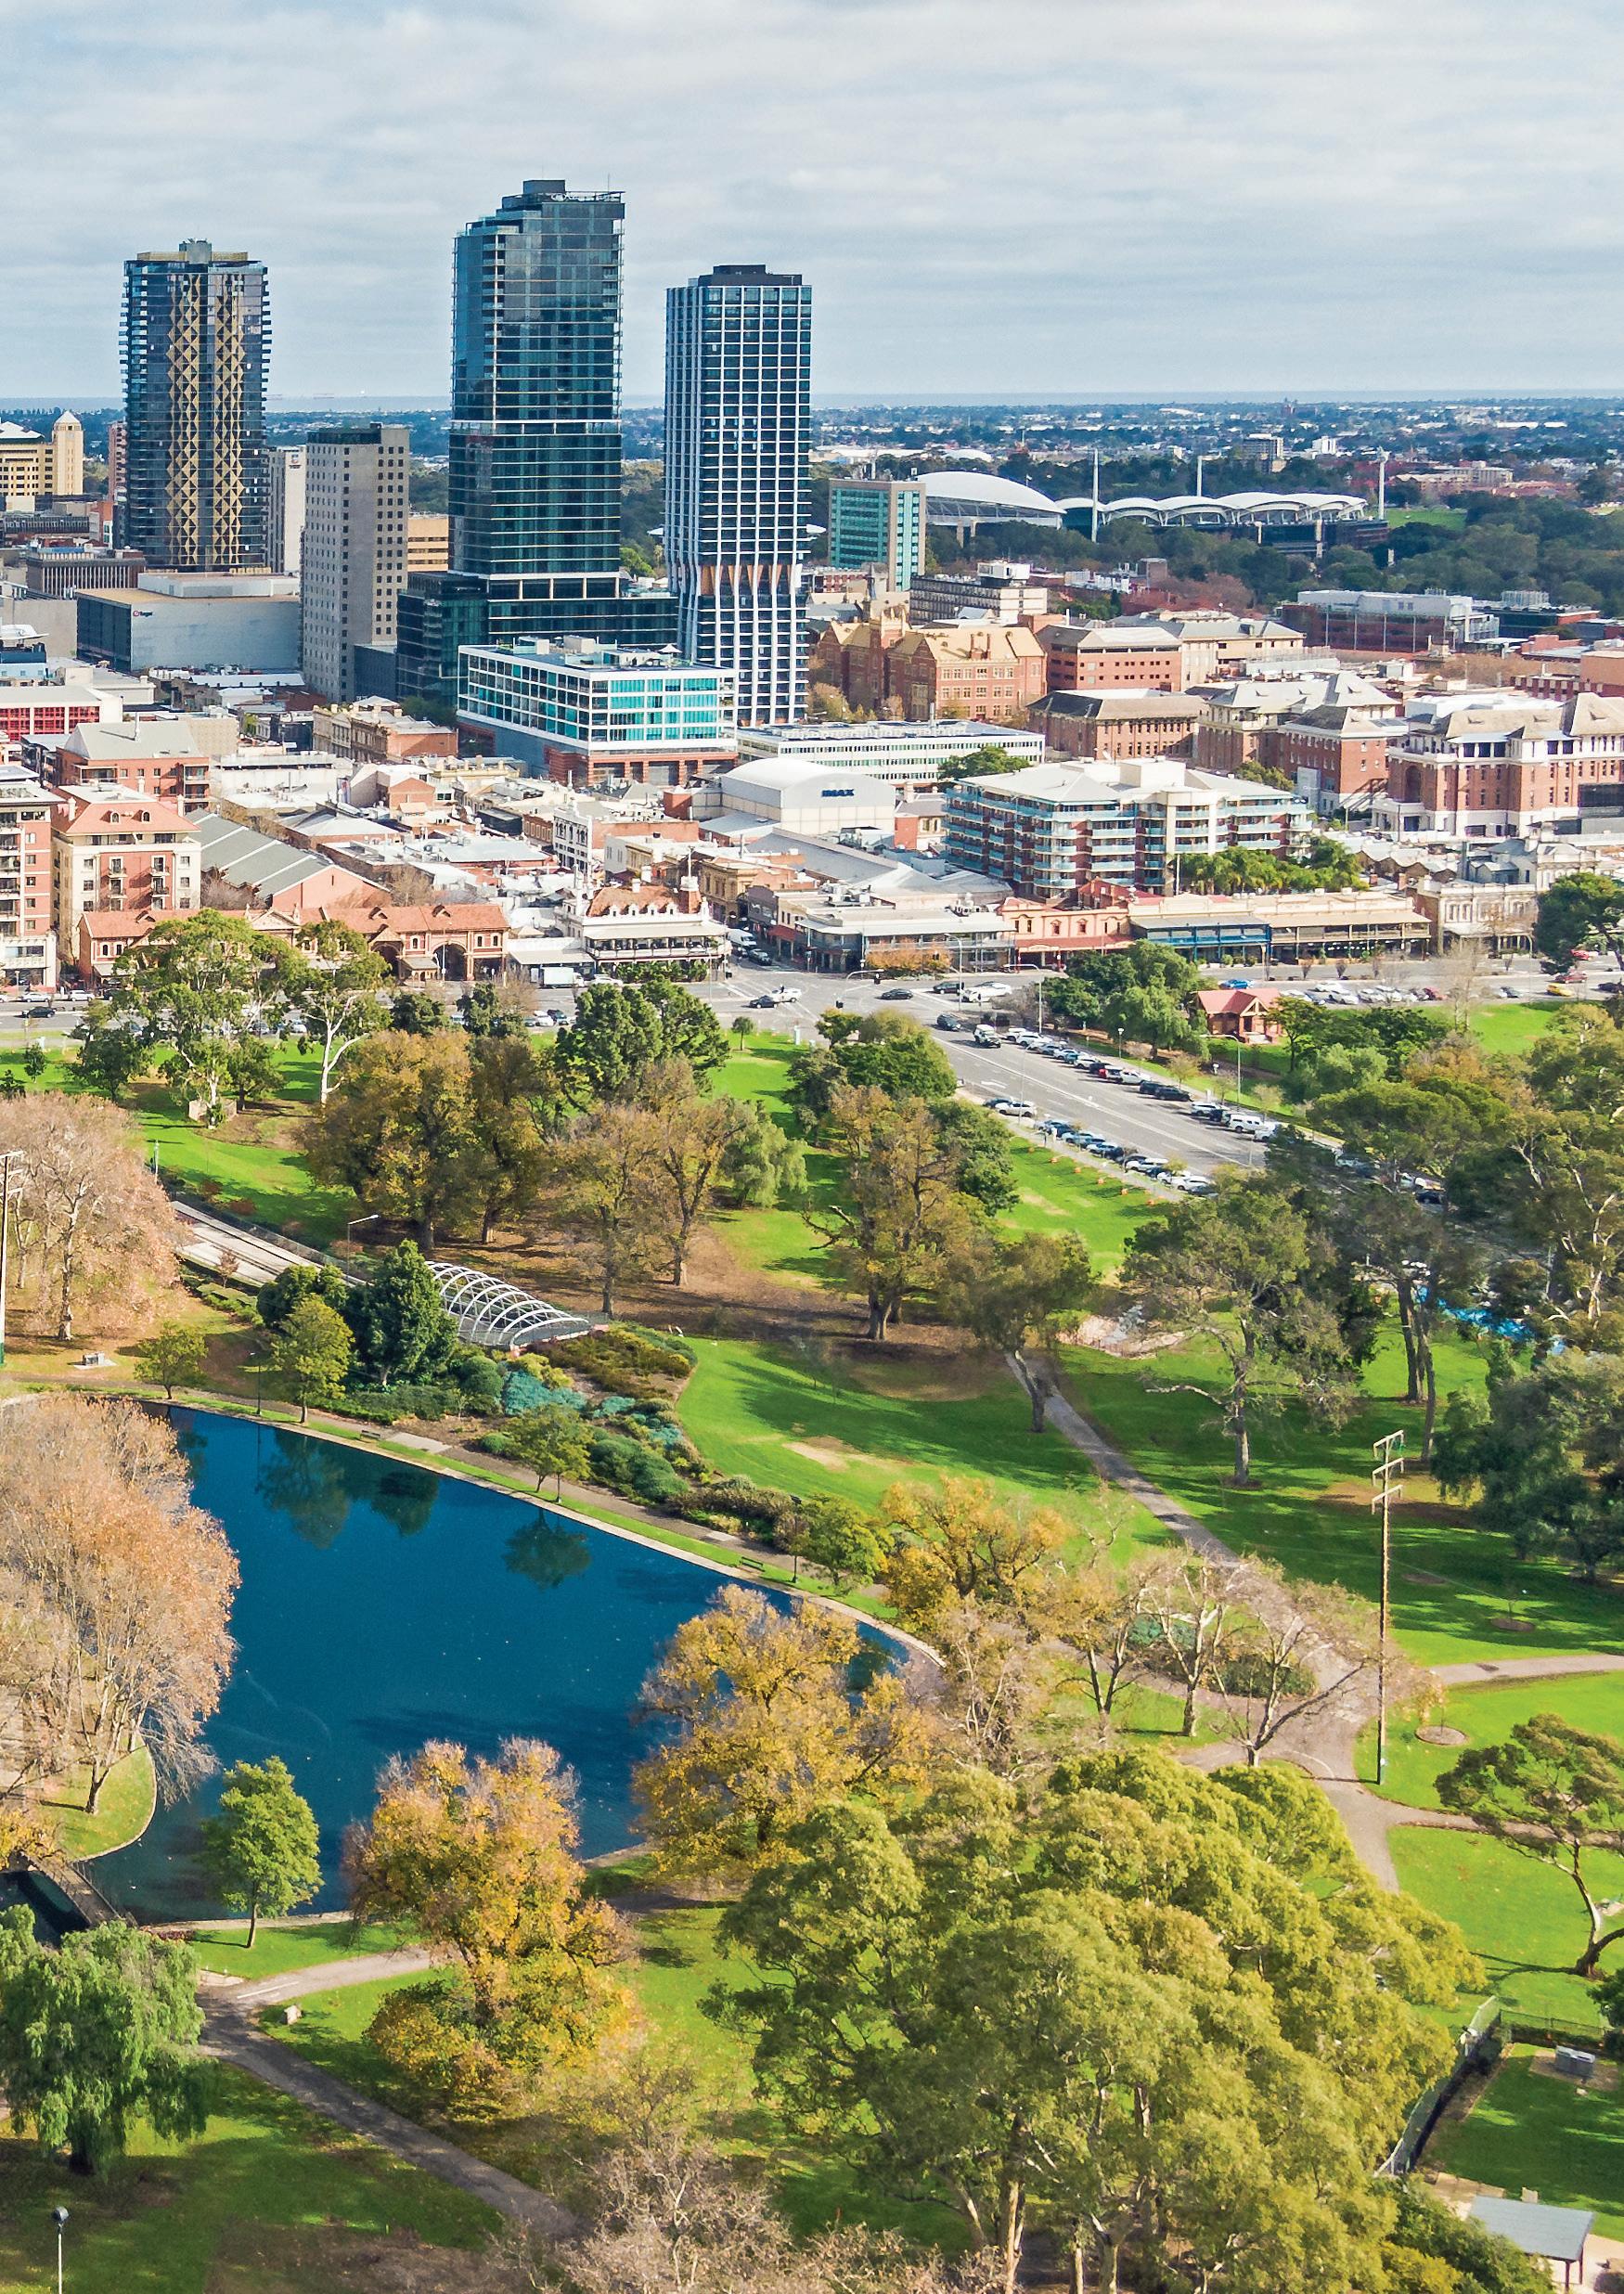
South Australia
4.0
Market Drivers
Economy
The South Australian economy is increasingly a standout performer.
CommSec recently ranked South Australia as the best performing economy.
The ranking was the first time South Australia had been ranked number 1 in CommSec’s Quarterly State of the States report.
South Australia’s strong economic performance is underpinned by various sectors, drivers and areas of activity including construction and the labour market.
George Bougias National Head of Research g.bougias@oliverhume.com.au
South Australia’s unemployment rate remains around record lows (4.0% in January 2024 on a seasonally adjusted basis).
Population growth remains extremely strong having tripled over the past two years.
Population growth remains robust. South Australia’s population increased by around 30,500 people over the year ended June 2023 (up 1.7% to reach over 1.85 million).
Net overseas migration (up 27,855 people) drove the strong population result.
4.1
The South Australian economy is increasingly a standout performer.
Land Market
Prices
Greater Adelaide median residential gross land prices rose in the December quarter 2023 (up 2.9%) to reach $262,500 (up 15.4% over the year).
Residential land prices in Greater Adelaide are now at record highs and remain underpinned by the resilience of the Adelaide residential market, growing housing shortages and continued robust population growth.
34 QUARTERLY MARKET INSIGHTS DECEMBER QUARTER 2023
$300,000 $250,000 $200,000 $150,000 $100,000 Source: Oliver Hume Research. 300 sqm 375 sqm 450 sqm
Greater Adelaide Median Lot Price (3-month moving average, selected lot types)
4.2 QIII. ‘22 QIV. ‘22 QI. ‘23 QII. ‘23 QIV. ‘23 QIII. ‘23
$260,000 $250,000 $240,000 $230,000 $220,000 $210,000 $200,000 $190,000 $180,000 $170,000 Source: Oliver Hume Research. QII. ‘22 QIII. ‘22 QIV. ‘22 QI. ‘23 QIV. ‘23 QII. ‘23 QIII. ‘23
Greater Adelaide Median Land Sales Price (Gross)
Over 660 new residential lots were sold in the Greater Adelaide market in the December quarter 2023.
Land sales have remained resilient, despite higher interest rates, reflecting a range of factors including especially a growing housing shortage in Adelaide.
The median size of lots transacted across the Greater Adelaide market remained stable (450 sqm) in the December quarter 2023.
Affordability and serviceability pressures continue to increase demand for smaller lots. However, Adelaide continues to attract buyers, from both South Australia and interstate, seeking value for money. Source:
35 QUARTERLY MARKET INSIGHTS DECEMBER QUARTER 2023 Sales Volume Median Lot Size
Greater Adelaide Residential Land Median Lot Size (sqm) - Quarterly 460 450 440 430 420 410 400 390 380 370
Oliver Hume
Source: Oliver Hume Research. Greater Adelaide Residential Land Sales 1,200 1,000 800 600 400 200 0 QIII. ‘22 QIV. ‘22 QI. ‘23 QII. ‘23 QIII. ‘23 QIV. ‘23 QIII. ‘22 QIV. ‘22 QI. ‘23 QII. ‘23 QIII. ‘23 QIV. ‘23
Research.
Greater Adelaide* December Quarter 2023 SOUTH AUSTRALIA Commonly Sold Lots 10 x 30m 12.5 x 30m 15 x 30m Median Price Median Size Median Value Rate $262,500* 450sqm $559 per sqm Source: Oliver Hume Research. *Gross.
300 sqm Median Price 375 sqm Median Price Source: Oliver Hume Research. Sold. Median Lot Prices by Suburb (Gross) 300 sqm and 375 sqm Lots SOUTH AUSTRALIA VIRGINIA n/a $249,950 MT BARKER $233,475 $249,952 SEAFORD HEIGHTS $310,000 $368,000
n/a $260,000 ANGLE VALE $205,000 $242,000 GAWLER BELT $180,000 $201,000 ADELAIDE GAWLER EAST n/a $216,500 MUNNO PARA $163,000 $210,000 OAKDEN n/a $508,000 ANDREWS FARM $208,000 n/a
VICTOR HARBOUR


Important: The information in this document has been prepared a general guide only and does not constitute advice. We have relied upon information from sources generally regarded as authoritative. Whilst the information has been prepared in good faith and with due care, no representation is made in relation to the accuracy of the whole or any part of the publication. No liability for negligence or otherwise is assumed for any loss or damage suffered by any party resulting from their use of this publication. The whole or any part of this publication must not be mirrored, reproduced or copied, without written consent. The document may contain future forecasts of a range of variables, which can be affected by a significant number of unpredictable factors, including social and economic conditions. It only represents the best judgements and estimates, made by Oliver Hume Research. No assurances can be given that the forecasts will be achieved. This document should be read in conjunction with any other documentation prepared by the marketing agent and associated consultants. www.oliverhume.com.au HEAD OFFICE Level 2 4 Riverside Quay Southbank, VIC 3006 P. 03 9669 5999 BRISBANE Shop 9, Gasworks Precinct 26 Reddacliff Street Newstead, QLD 4006 P. 07 3216 1666 SOUTH AUSTRALIA Level 1, 89 Pirie Street Adelaide, SA 5000 P. 08 7201 3999 SYDNEY Level 24, Tower 3 300 Barangaroo Avenue Sydney, NSW 2000 P. 1300 881 780 GOLD COAST Suite 5B, Emerald Lakes Town Centre Commercial 3027 The Blvd, Emerald Lakes Carrara QLD 4211 P. 1300 645 433 DARWIN 129 Asche Street Muirhead, NT 0810 P. 1300 7373 598
