We are delighted to bring you our Milk Cost of Production Report 2023-2024. Milk prices of 50ppl may seem a distant memory, but as much as the numbers change, the trends taken from benchmarking your business can allow your business to weather the more difficult periods as well as take advantage in the good times.
The details that stand out
After the exceptional year that we saw in 2022-2023, the financials for dairy farmers in 2023-2024 were much more challenging. Although the period was always expected to have the feel of ‘after the Lord Mayor’s Show’, the final figures produced were worse than many predicted. The headline figures from our report was that milk income per cow was down 19% on the previous year, as a result of considerably lower average milk prices.
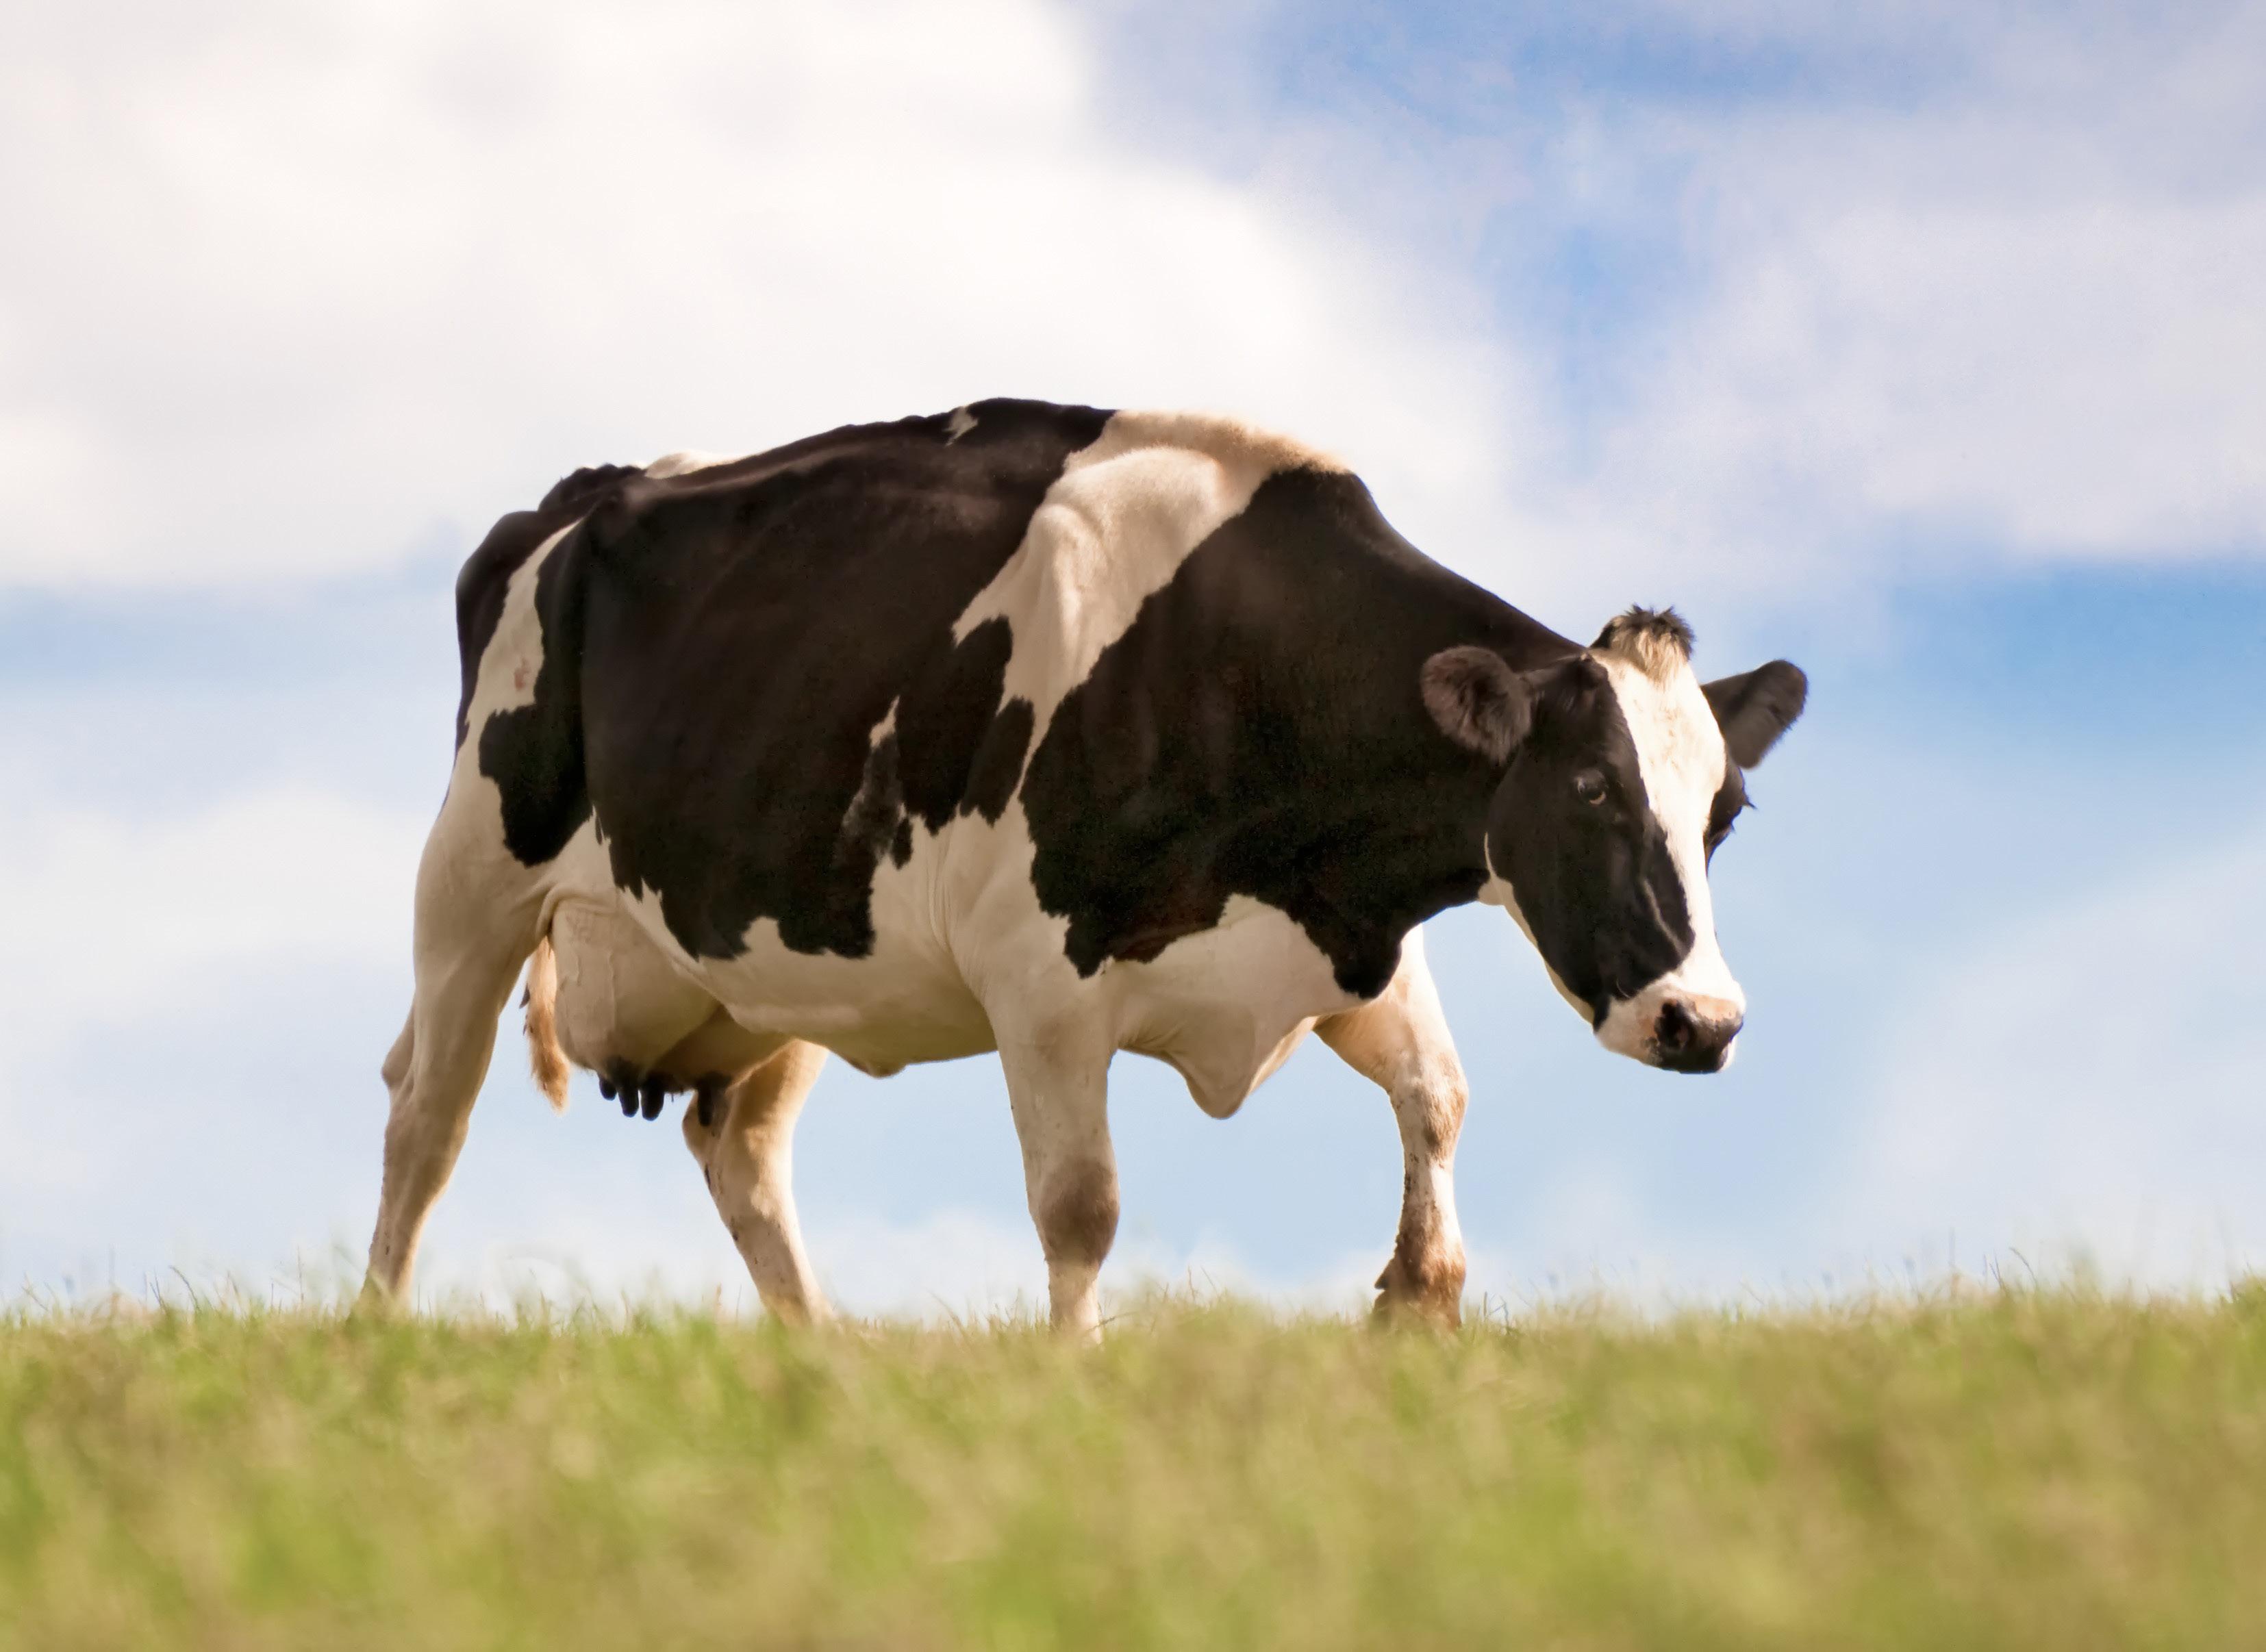
Many producers have cited poor silage from the summer of 2023 as an issue and a fall in average yields from 7,464 to 7,256 litres is a further contributor to a fall in overall output.
It was this income that drove the lower year-on-year profitability, with comparable farm profit falling from £913 per cow to £152/cow. This 83% drop aligns with the strain many businesses were experiencing toward the end of 2023.
Cost of production in 2023-2024 was comparable to the twelve months prior, due to the mixture of some categories rising and some falling. Variable costs fell as it no longer paid to completely maximise output, with feed costs dropping from their 2022 high. However, these gains were offset by rising labour costs and machinery costs. This was especially the case for machinery repairs, given that many businesses paid for new kit in early 2023 to offset looming large tax bills.
The changes we have seen in 2023-2024 could be emblematic of a changing dairy industry. The ‘cost of doing work’, namely power, labour, contracting and machinery costs, are becoming increasingly key to financial performance, whereas in the past, feed and other variable
costs took the headlines. This cost of doing work is also the key differential between our top 10% of performers and our bottom 10%. Given that these costs are often fixed, it shows that life for the smaller herds shows no sign of becoming easier. Tellingly, there is a difference of 237 cows between the average herd size of our top performers (404 cows) and the smaller herds of our bottom 10% (167 cows).
Silver linings on the horizon
Summer 2024 has taken a different path, and not just in regards to weather. Milk prices have continued to slowly tick upwards, which is a welcome change to the rapid crash we saw twelve months ago. The supply and demand imbalance we saw, where too much milk flooded the market, has now rectified itself and we are seeing conditions that are less volatile. Those businesses that retained enough cash during the better times of 2022 were the ones best able to weather the storm of the last twelve months, and it is those businesses that should be best placed to reap the rewards of a more positive outlook for dairying in the short to medium term.
Importance of cost control has been emphasised
Comparing your own financials with those of the region can be of vital importance to farmers. It is crucial to benchmark your business and ensure that you are making savings where you can in the current climate. As shown in our report, those farms with highest yields or biggest herds are not necessarily the most profitable. Importantly, our comparable farm profit model excludes rent, tax and finance costs to accurately compare farms. However, these costs cannot be completely ignored and can easily catch you out, especially with interest rates remaining high.
A sustainable business is one built on an efficient cost structure. How do your costs compare to the regional averages?
Andrew Vickery Bradley Causey 01935 709321 01392 351327 andrew.vickery@om.uk bradley.causey@om.uk
The sample farms analysed include organic, all milk bonuses, a higher proportion of manufacturing than liquid contracts, plus more aligned contracts than would be the norm across the whole of the UK.
Andrew Vickery
Bradley Causey
Welcome
In last year’s report I was warning dairy farmers of significantly falling incomes due to milk price decreases, which in the end were a lot more severe than we budgeted due to the delay in milk prices beginning to increase. The high cash demands of paying tax and repaying the larger capital investments in 2022-2023 coupled with a rapidly falling milk price (-£210k for our average producer analysed) has caused a major cashflow crisis in the dairy sector in the last six to nine months for those who haven’t managed the large profits of the previous year.
This year it is moving in the opposite direction! Now that milk prices have been increasing for the past ten months, cashflows have still been deteriorating. Though we are forecasting a significant turnaround in profit for the year ending March 2025, it doesn’t feel like that looking at current cashflows at farm level.
This highlights the importance of knowing the difference between cash and profit in a business and managing both. Cash is the more important of the two shorter term, profit the more important long term. All of our clients where we or they have updated cashflow forecasts to at least the end of March 2025 are seeing a much more positive financial position in terms of profit and cash in six months time. Here we have projected average profits to be £590/cow on a milk price paid of 45ppl. Unfortunately without the benefit of cashflow budgeting I have seen some businesses make short term decisions (e.g. selling bulling heifers to buy fresh calved cows) in a long term business.
Over the years in compiling this report it is still much the same trends and conclusions:
1. The system of milk production will not determine profits, it is the management and allocation of resources to produce the milk efficiently and sustainably.
2. Costs of doing work (Power & Machinery and Labour costs) which have risen 10.7% (+£37,500) on average in a year when overall costs of production were static. This group of costs includes depreciation which partly covers the writing down of the capital investment being made on farms to ensure future compliance and improving water quality e.g. adequate slurry and dirty water storage.
3. The gap between the top and bottom 10% by Profit Per Cow increases further with larger scale and farms with lower costs of doing work more likely to be in the top 10% e.g. bottom 10% of farms spent 2.5 times as much as the top 10% on farm repairs highlighting the need to invest and catch up to become eg water quality compliant.
4. Benchmarking & highlighting a business’s financial strengths and weaknesses is only the start of the process of getting into the average to top 10% bracket. This is where you will need to position your business in the future to have a sustainable and profitable dairy farm. Acting on the weaknesses and consolidating the strengths along with budgeting forward and managing cash and investing it wisely within and outside your business in the future will be key to helping you achieving your aims.
5. Making market volatility your friend not your foe. What I mean is as a commodity industry market prices are very volatile and open to significant changes and shocks. When milk prices have increased significantly recently, should you be forward buying feed, fertiliser and fuel at fixed prices NOW, which make up a third of your costs of production and will have a significant effect on profit? Some of these commodities are at their lowest prices in three to four years. Focus on what you can control. Too much time is often spent on issues like milk price and weather which are important but over which we have no control.
How is your business performing? Where will it be in twelve months and five years time? Do and you and your team have a plan in place with actions to execute that plan? It begins with defining your aims and goals, followed by benchmarking.
Gerard Finnan
07976 426420
Annabel Hole
07980 294816 gerardfinnan@fcgagric.com
annabelhole@fcgagric.com
Gerard Finnan Annabel Hole
Key points
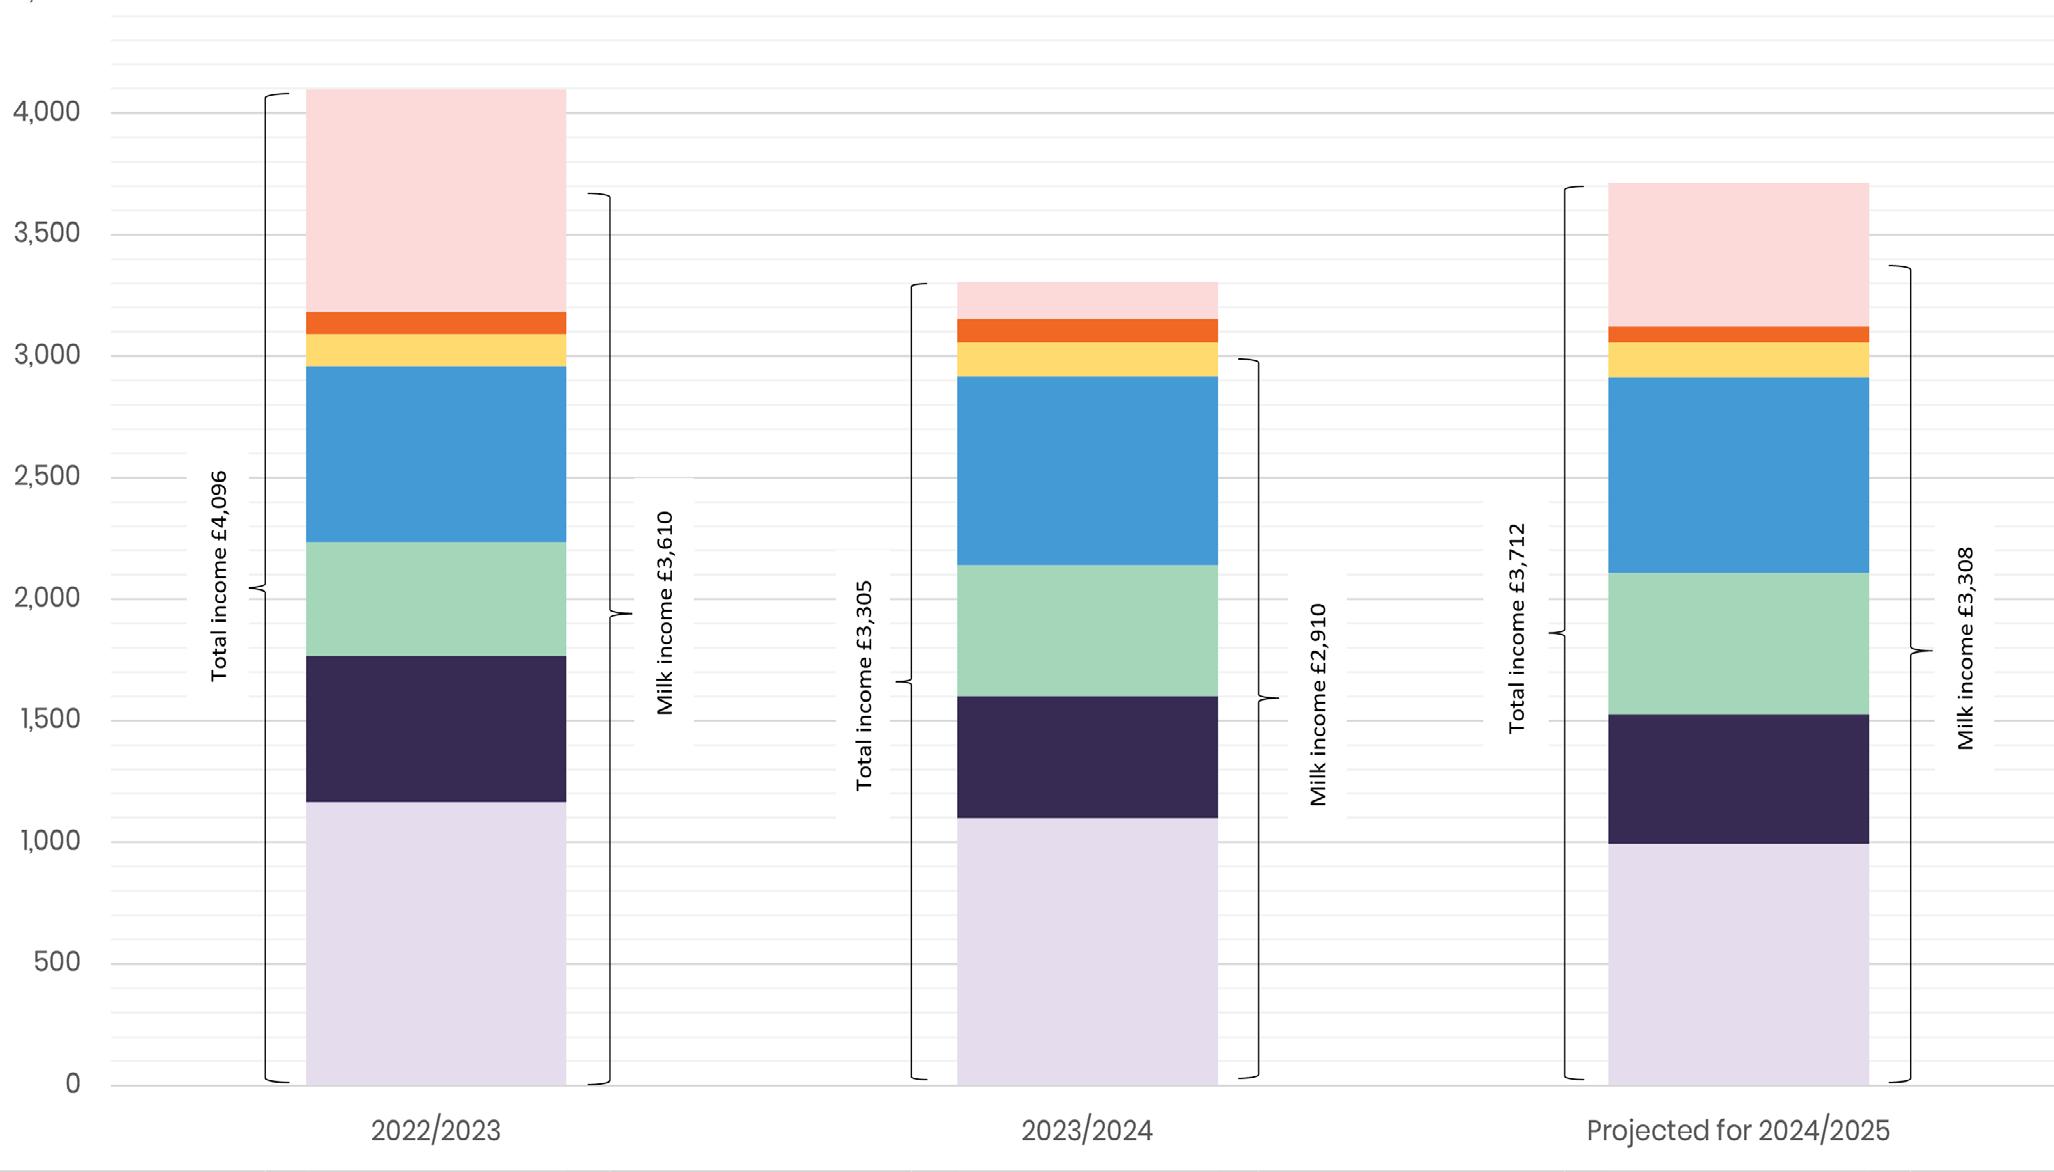
1. The average total comparable cost of milk production in the year to 31 March 2024 was £3,153/cow compared to average milk income received of £2,910/cow.
2. The total comparable cost of milk production for the year to 31 March 2025 is projected to be £3,122/cow against projected milk income of £3,308/cow.
3. Average milk prices were much lower through 2023/2024 in comparison to 2022/2023, leading to a fall in milk income of £700/cow (a 19% fall).
4. Milk income fell behind total cost of production by £245/ cow. This happened in spite of variable costs falling back from their peaks in 2022/2023, and was driven by falling milk prices. It was through selling stock that most businesses managed to remain profitable. Markets are more balanced in 2023/24 and we return to milk income being approximately equal to total cost of production, a position seen in five of the last six years.
5. Milk income is expected to increase by £398/cow to £3,308 as prices tick up again. This is projected to be married with a cost of production that will stay broadly similar to 2023-2024.
6. Feed costs are expected to continue to decrease (by £108/cow) as prices reduce and feed rates are cut due to sufficient forage stocks and the continued recovery from the highs of 2022.
7. Variable costs are expected to increase by £40/cow, which is a modest increase compared to the jumps we have seen previously. Labour costs continue to rise (by £42/cow) as the problems attracting staff endure.
The basis
8. Power and machinery costs are expected to rise as fuel prices stabilise and contracting costs tick upwards.
9. Profitability is predicted to rise from the low £152/cow this year to a more reasonable £590/cow in 2024-2025. The five year profitability average is £478/cow, showing that milk prices have been notably low this year.
10. The total comparable cost of milk production for the top 10% of producers was £2,786/cow compared with £4538/cow for the bottom 10%, a difference of £1,752/ cow. The top 10% generated an extra £443 of income for this additional spend, showing that cost control was key.
11. The top 10% of producers produced higher yields at 8,089 litres per cow, although they spent £193/cow less on feed than the bottom 10%. In times of lower milk prices cost control drives profit. Those businessess that successfully reduced their feed costs whilst not simultanesouly seeing a collapse in yields fared best.
12. Whilst finance costs and tax are excluded from the data to make farms comparable, these will have a huge impact on businesses as we see interest rates at a much higher level than most of the last 15 years. Those business that are highly geared are vulnerable to the current market conditions.
In order to understand and interpret the results of the survey, it is important to set out the basis upon which these figures have been produced, specifically:
1. The sample consists of Old Mill and Farm Consultancy Group clients who derive their income mainly or solely from milk sales, across a variety of farming systems.
2. All farms have a 31 March year end.
3. In order to make the businesses comparable, rents, interest payments, drawings, tax and capital expenditure have been excluded from the figures and
a labour charge of £30,000 has been included per full time Partner/Director. Basic Payment Scheme (BPS) has also been excluded from the income. It should be noted that depreciation has been included in these figures.
4. The projection for 2025 has been calculated by looking at actual costs incurred for this financial year to date along with national trends.
Whole sample - actual 2023/2024 results
“In times of lower milk prices, cost control is key. If profits have been successfully retained from the stronger period during last year, businesses should be able to weather the storm.”
Whole sample Comparable Farm Profit
Key points
1. Milk income expected to rise by £398/cow as the effects of a healthier milk price begin to take effect. The large number of stock sales we saw last year is expected to continue as cull prices remain strong.
2. Feed costs expected to reduce by £109/cow. Milk price to feed price ratio has again made it cost effective to feed concentrates to replace some forage leading to increased quantities fed and higher milk output in the upcoming times of better prices.
3. Variable costs expected to tick upwards, but not in the rapid way we saw in 2022. The full effect of lower fertiliser prices is now being seen given forward-buying that has occured.
4. Profits expected to rise to £590/cow, which is £221/cow above the five year average of £369/cow. However, times feel much more difficult on farm in comparison to 2022/2023.
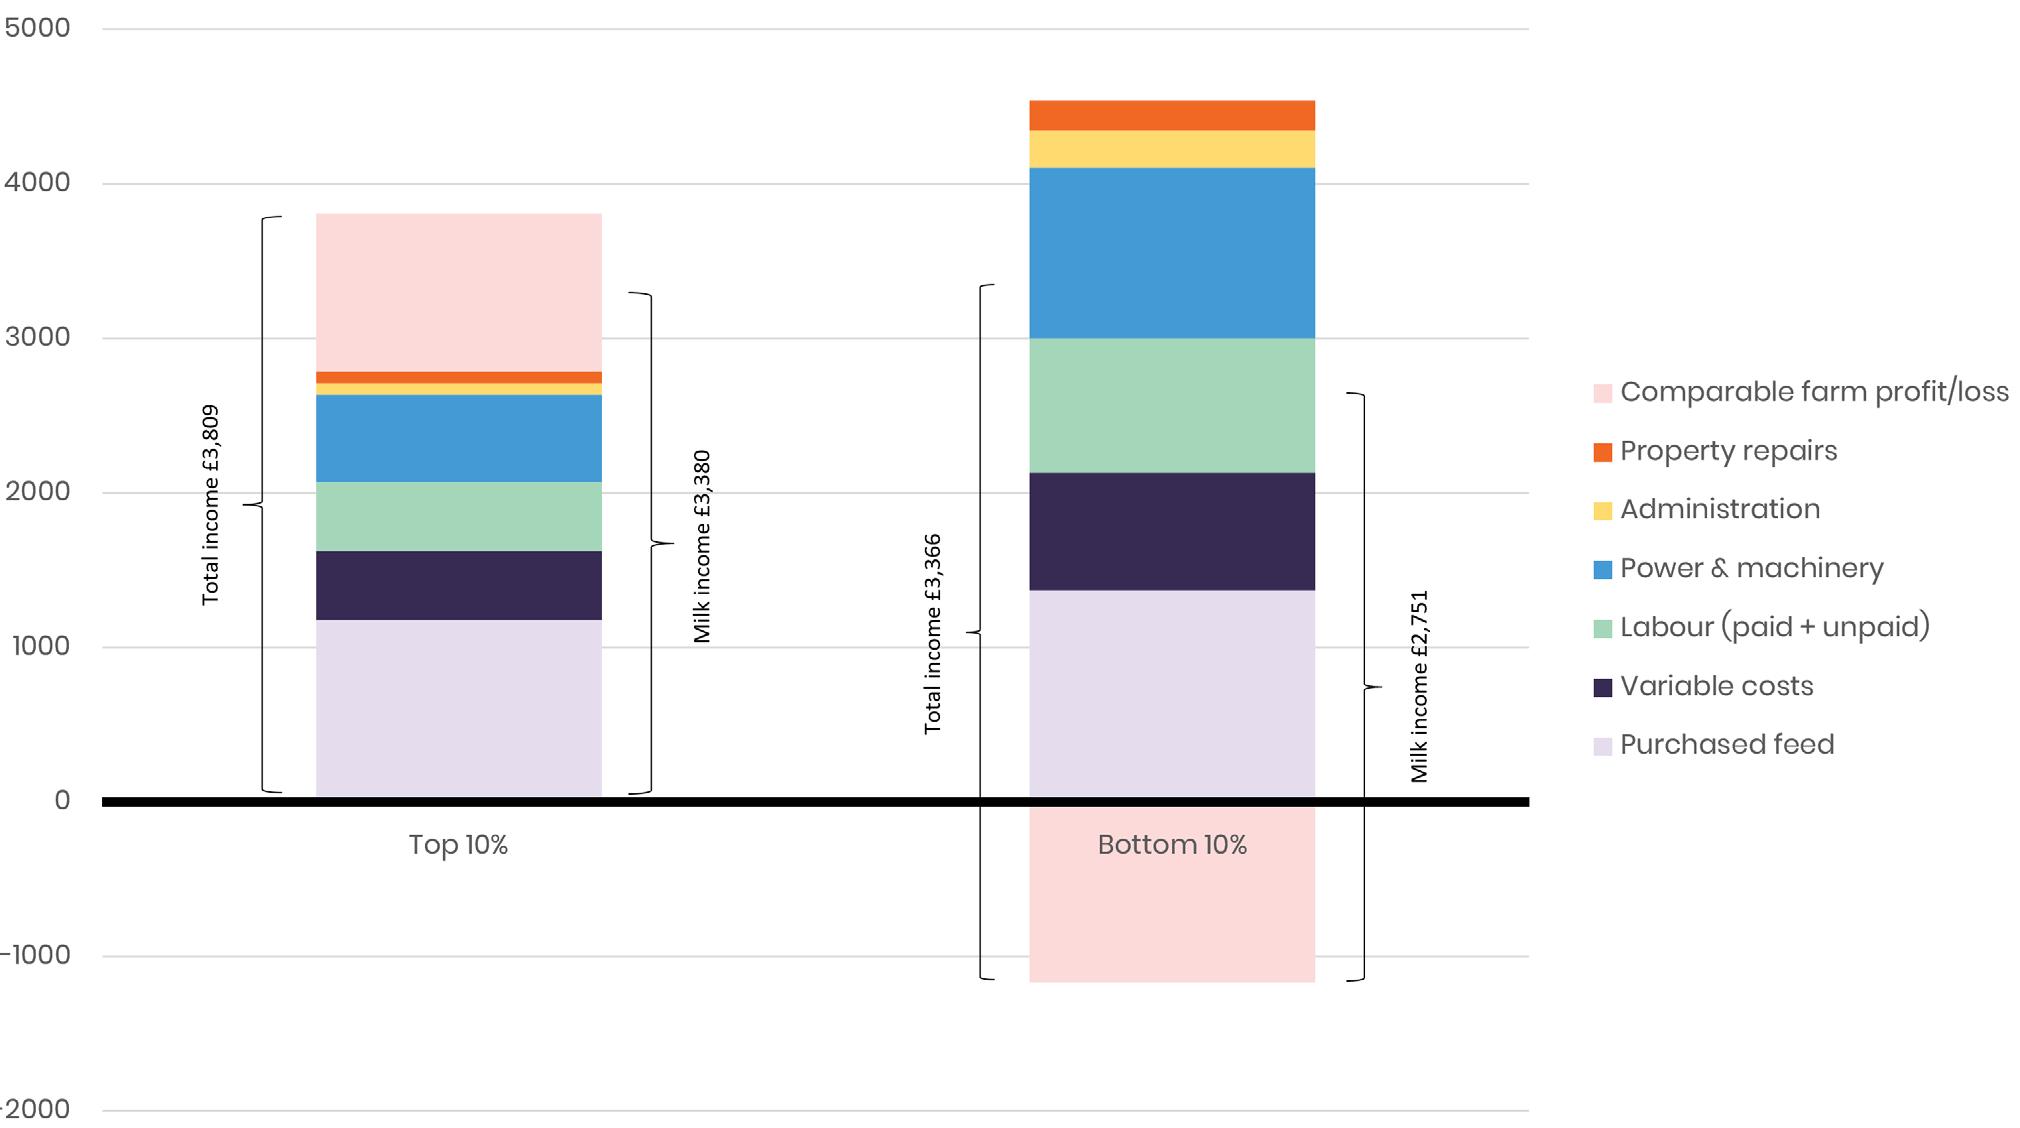
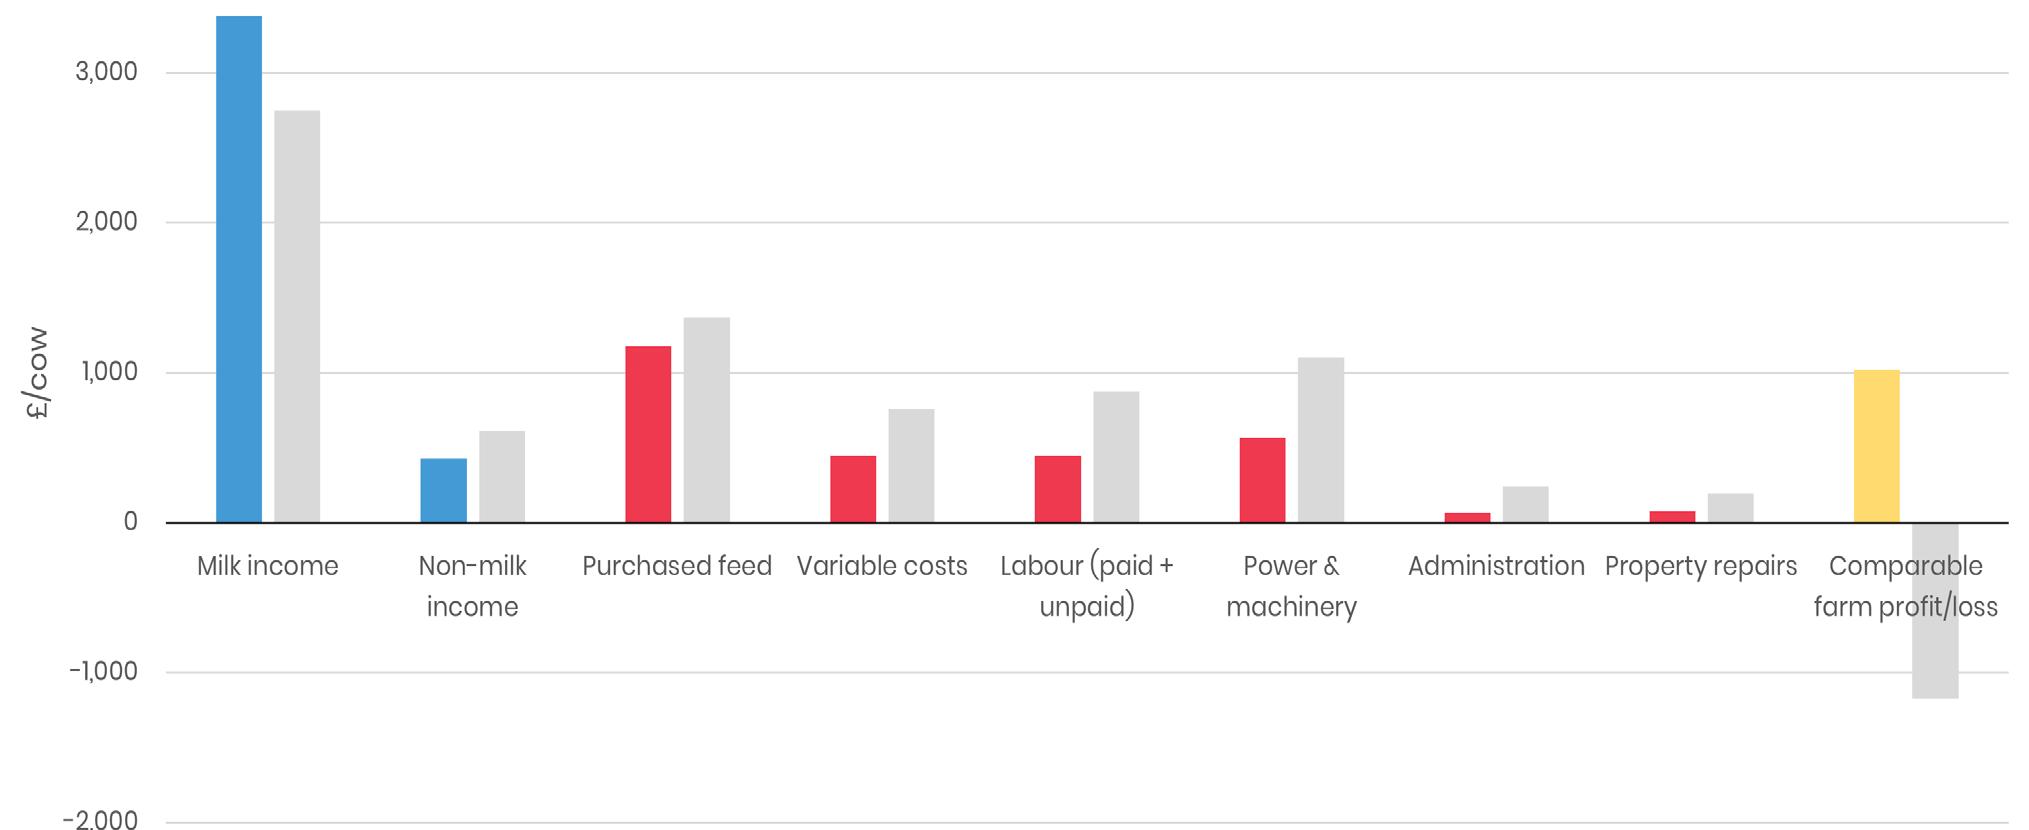
Top and bottom 10% by retained profit per cow vs bottom 10% - 2023/2024
“Smaller herds that did not control costs found the market conditions of 2023/2024 difficult. Labour costs and contracting costs per cow were a key differential between the top 10% of performers and the bottom 10%.”
Top 10% vs Bottom 10% Comparable Farm Profit
“The key difference between the top 10% and the bottom 10% are labour and machinery costs. Those who let these increase without increasing yields faced a tough year.”
Cost structure, Top 10% vs Bottom 10%
Key points
1. The top 10% received £629/cow more for their milk, producing significantly more litres per cow.
2. There was a difference of £1,752/cow in the costs of production between the top 10% and the bottom 10%, with the gap widening significantly from the further from the £693/cow seen in 2021/2022 and £163/cow seen in 2022/2023.
3. Costs are no longer consistent for the top 10% and the bottom 10%, although this was the case last year. Those farms with higher variable and labour costs were especially vulnerable to falling prices.
4. The average comparable farm profit for the top 10% was 12.65p/litre compared with a loss of 15.73p/litre for the bottom 10%.
5. The average yield per cow is significantly higher for the top 10% at 8,089 litres compared to the bottom 10% at 7,449 litres, but there is a huge range within these with the top 10% producing anywhere from 6,960 litres per cow to 12,424 litres/cow. The bottom 10% produced between 5,130 litres per cow and 11,328 litres/cow. This indicates that yields are not integral to profitability.
6. The top 10% actually spent more on feed than the average, and interestingly this area was not key to farm performance. The top 10% spent £193 less on feed per cow than the bottom 10%. In the year, supply in the market met demand, and so increasing output was not the key driver of profitability that it had been last year.
7. Combined labour and power and machinery, or ‘Cost of Doing Work’ is £1,977/cow for the bottom 10%, compared to £1,015/cow for the top 10%. This cost is an important differential. The bottom 10% were those who were unable to cut their spend in this time of reduced prices, which has led to them making a comparable farm loss.
8. The top 10% has a herd on average of 237 head larger than the bottom 10%, in comparison to a gap of 219 last year.
9. There are a variety of farming systems in the bottom 10% of herds, showing that farming efficiently relies on the farmer and is not based on the system which is run. Strong performance is not a given of any particular system.
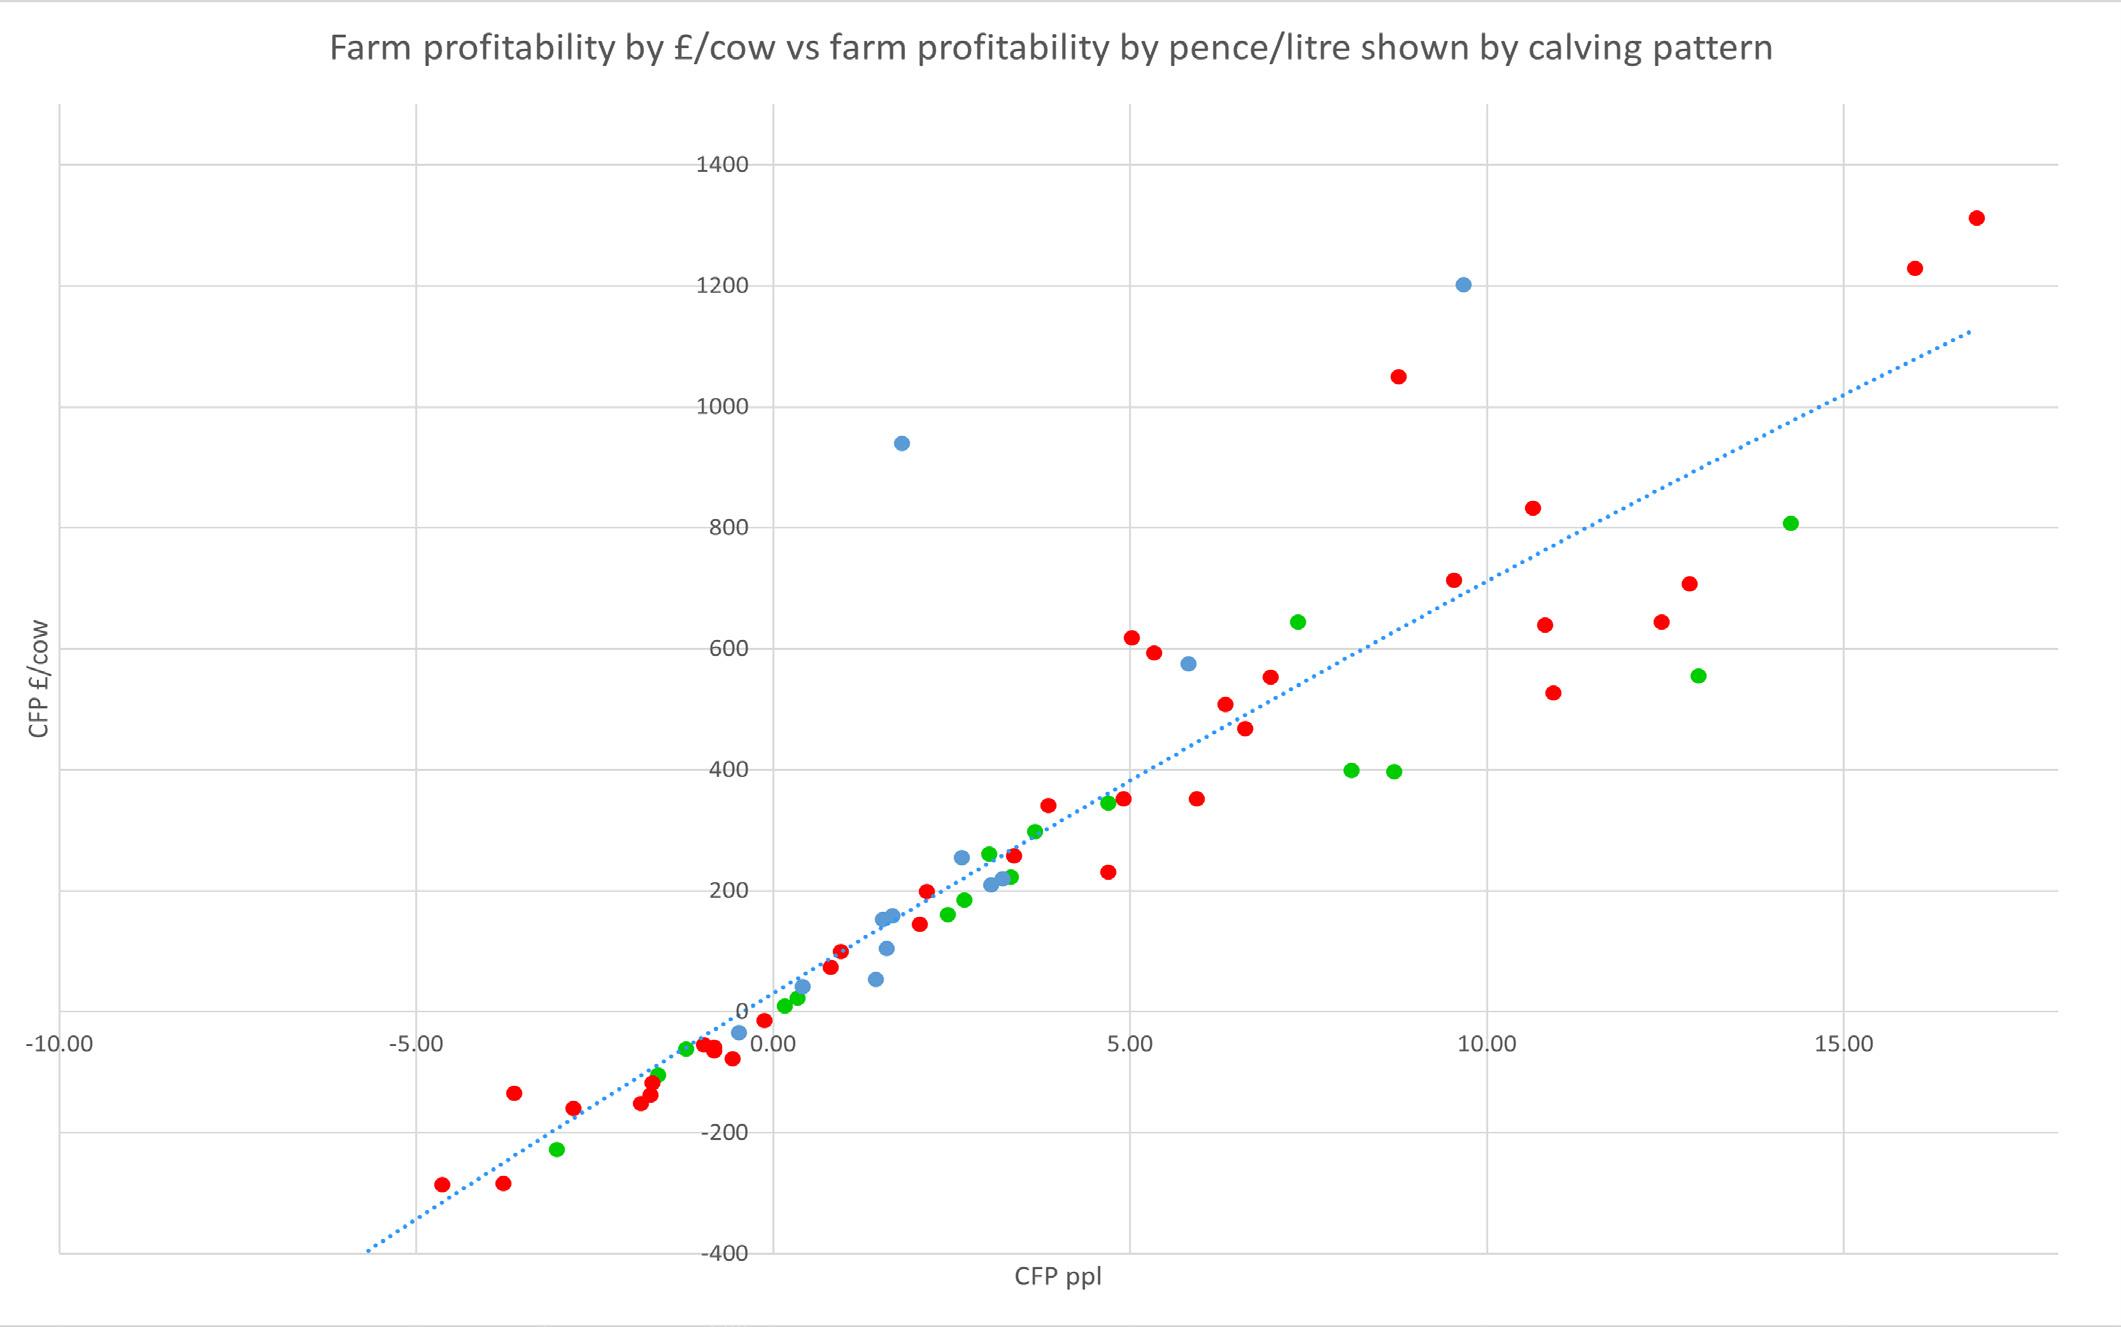
Farm profitability by £/cow vs farm profitability by pence/litre (ppl) shown by calving pattern
All year round calving
Spring calving
Autumn calving
Key points
1. Market conditions have not suited higher yielding systems, when they did last year.
2. The trendline shows that as CFP/litre increases, so does CFP/cow. Last year this was not a linear relationship as yields fell when focusing on maximising margin/litre, but this year the relationship is more linear.
3. Spring calving herds often make the most profit on a pence/litre basis, showing their ability to produce cheap milk. This does insulate them against lower milk prices although it means they miss out on higher profits per cow in times of higher milk prices.
4. As yields climb, profitability per cow increases, marginal litres have been worth producing during 2023-2024 but this needs continual review.
5. Profitability has fallen significantly for all farms, and the large gap between the top 10% and bottom 10% has grown even wider.
6. This year, many farms have shown a loss on a cashflow basis as a result of lower average milk prices and costs which have not reduced by a proportionate amount. Last year, no farm in our survey suffered a comparable farm loss, showing that this year has proved more difficult.