We are delighted to bring you our Milk Cost of Production Report 2024-25. After a challenging previous year, our figures indicate that we have seen a financial rebound for many South West dairy farmers which has been fuelled by higher milk prices. There exist wider challenges for the industry, including Bluetongue, labour (difficulty finding it) and the government (Inheritance Tax changes), but overall, the figures shown in this report suggest a positive outlook for the industry.
A strong year for some
The year to 31 March 2025 saw comparable farm profits rise by around 7.3p per litre in comparison to the year before, which was driven primarily by increased milk income. The previous year had seen many producers citing poor silage as a reason for falling yields, but the better crop in 2024 made matters easier for some. Overall, the rise in milk income of around 4.9p per litre was not completely offset by costs which have slowed in the rate of increase. Milk prices began to tick up part-way through the 2024/25 period and feed prices continued to soften, following a trend since April 2023. These two key trends (milk and feed prices) have therefore both moved in a positive general direction for dairy farmers in 2024/25, which we can see trickling down to create increased comparable farm profits. Fortunately, the rises in other costs did not eat away at this profit.
A changing industry
The statistics we have produced by looking at dairy farms supports a continued trend that we have seen in multiple reports. This is that the ‘cost of doing work’ such as labour, contracting and machinery costs are becoming increasingly key, whereas in the past it may have been feed and variable costs which were the focus.
Herd size can be key
A key differential between the top 10% of producers and the bottom 10% is simply the number of cows. As the cost of doing work increases, these larger producers are able to better leverage economies of scale and support multiple partners. However, smaller herds are more vulnerable to rising labour, contracting and machinery costs.
Looking ahead
The wider economic trends that have contributed to a stronger 2024-25 show little sign of quickly reversing. How long will more favourable conditions continue? The growth of milk prices may have halted but there is little to indicate the sudden collapse which was seen in 2023 and feed prices continue to tick downwards. Therefore, it remains a possibility that 2025/26 could be an equally successful year, depending on your milk contract and cost control. The projections in this report suggest that increased variable, labour and machinery costs may eat into margins a bit more next year.
Although many people are reporting a good quality silage cut in 2025, the dry conditions of July and August meant that some had to feed winter rations early. Having enough feed for the second half of the 2025/26 winter may be an issue.
Fixing the roof whilst the sun shines
Some milk suppliers have languished behind the pack, and so the 2024/25 figures were not hugely positive for all dairy farms. However, the improving general trend suggests that now may be a good time to future-proof your business through building up cash reserves or paying down debt. The Inheritance Tax changes introduced in the last twelve months may have led to you thinking more about succession planning, and better economic conditions can be the best time to protect the future of your business.
Although there may be cautious optimism for the future, nobody can predict what will occur with certainty. Who would have foreseen the Ukraine War in 2022 and the associated volatility in our industry?
Comparing your own financials with those of the region may be an important tool in your armoury, and so using this report to spot how your business differs from South West averages could be a worthwhile exercise.
Bradley Causey 01392 351327 bradley.causey@om.uk
It is easy to forget that a year ago we used this article to say, ‘make volatility your friend’. Milk prices have continued to rise this year as the market responds to increased demand and pressures on global production. As we advance into the winter and spring, it may be important to note that milk prices may stay static or soften on the back of high current prices. Either way, milk production systems must be able to adapt to static or falling milk prices in the future.
In contrast, the global production of proteins and cereals is at an all-time high, forcing feed prices down. The price of grain is not in line with the costs of production in many countries and will only be held up by arable businesses borrowing more money, increased subsidies or a reduction in output. With the political pressure leaning to the right, I would suggest there is little appetite for intervention, and the market will have to adjust accordingly.
In the sample group, some farms have not taken up the Sustainable Farming Incentive in the last two years. With the rumours of a much smaller payment in the future, this is unlikely to persuade those who have had to purchase forage to take part if they see production affected and not adequately reimbursed. There is a lot of work to be done on pasture management after a very wet year, followed by an arid year. The tighter options may mean farmers avoid the scheme to allow repairs.
Looking at milk prices in the future, the recent global milk trade has seen a drop in commodity prices and more pressure on prices looks likely as we enter the winter. This has been reflected in the budget price running to 31 March 2026.
The increase in concentrate feeding seen through the summer looks set to continue into the winter with tight forage stocks. This has resulted in increased UK milk production and improved milk solids. The higher milk solids have and should continue to help offset any price drop seen through the rest of the year.
The pressures on cattle numbers and demand look set to continue. Although the price point at which the consumer buys looks fragile.
There has been a jump in stock sales as the red meat market hoovers up calves and cull cows coming out of the dairy sector. With calf registrations down, this is likely to be maintained. The trend for more output per cow will continue
as sexed semen and genomics is starting to deliver milk income. Our projections are based on high calf and high cull prices continuing into the new year.
Valuation is maintained at a similar level in the future, having jumped up this year. TB continues to take a toll on stock numbers, forcing producers to factor in more youngstock or replace stock at higher prices.
The cost per tonne of concentrate has continued to fall, favouring high-production livestock systems. More concentrates have been fed, and more livestock have been kept on the farm, trying to capitalise on the high prices. In the data we analysed, there is a considerable variation between farms and the margin over purchased feed. There is no sign in the short to medium term to suggest an increase in feed prices, only that the costs of transport and making feed may go up. This is reflected in our budget by increasing feed rates but holding the price per tonne.
Small increases in variable costs, notably fertiliser and bedding, adding one penny per litre to the costs between them, despite weakening oil prices.
Power and machinery costs will continue to increase. The cost of doing work shows one of the most significant increases between last year and this year, going up £72 a cow, and is predicted in the budget to rise further by £129 a cow. These increases relate to extra machinery on the farm, higher repair costs due to the complexity of machinery and a decline in available skilled labour, leading to a rise in wages.
The most significant factor that stands out among the figures is the human element. There are optimistic, strong agriculturally minded performers who can technically achieve and run stable, profitable businesses. There has been considerable uncertainty, and as a result, farmers will incur short-term to medium-term costs associated with investment planning and future-proofing their assets. There will be opportunities for producers who can control their costs and maintain the required output, considering the increased fixed costs.
Allaster Dallas 07496 760242
allasterdallas@fcgagric.com
Allaster Dallas Annabel Hole
Key points
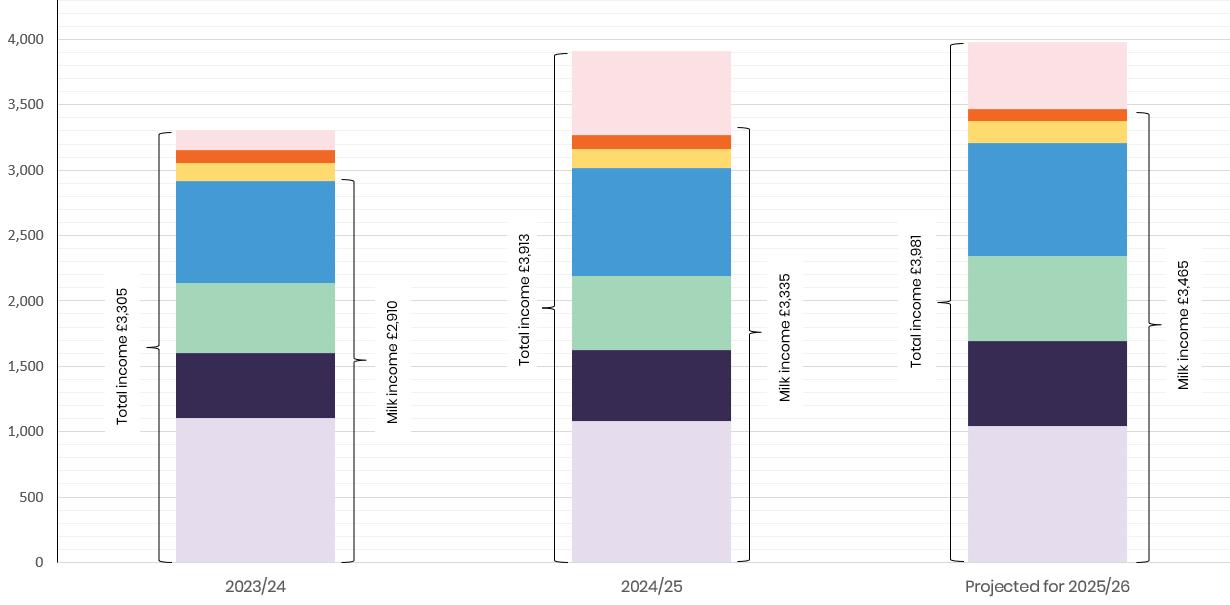
1. The average total comparable cost of milk production in the year to 31 March 2025 was £3,269/cow compared to average milk income received of £3,335/cow.
2. The total comparable cost of milk production for the year to 31 March 2026 is projected to be £3,467/cow against projected milk income of £3,465/cow.
3. Average milk prices were stronger through 2024/2025 in comparison to 2023/2024, leading to a rise in milk income of £425/cow (a 15% rise).
4. Milk income is expected to increase by £130/cow to £3,465 as prices tick up again. This is projected to be married with falling feed costs but rising machinery and labour costs.
5. Feed costs are expected to continue to decrease (by £42/cow) as prices reduce, although feed rates may rise given the increase in concentrate feeding seen through the summer.
6. Variable costs are expected to increase by £107/ cow, due to small increases in fertiliser and bedding expenses. Labour costs are also expected to rise, due to the shortage of skilled labour and minimum wage rises. Power and machinery costs are expected to rise as fuel prices stabilise and contracting costs tick upwards.
7. Power and machinery costs are expected to rise by £41/cow due to the complexity of machinery on farms.
8. Profitability is predicted to fall, but it still remains very healthy (£514/cow). The 2023/24 average comparable farm profit of £153/cow may put this into perspective.
The basis
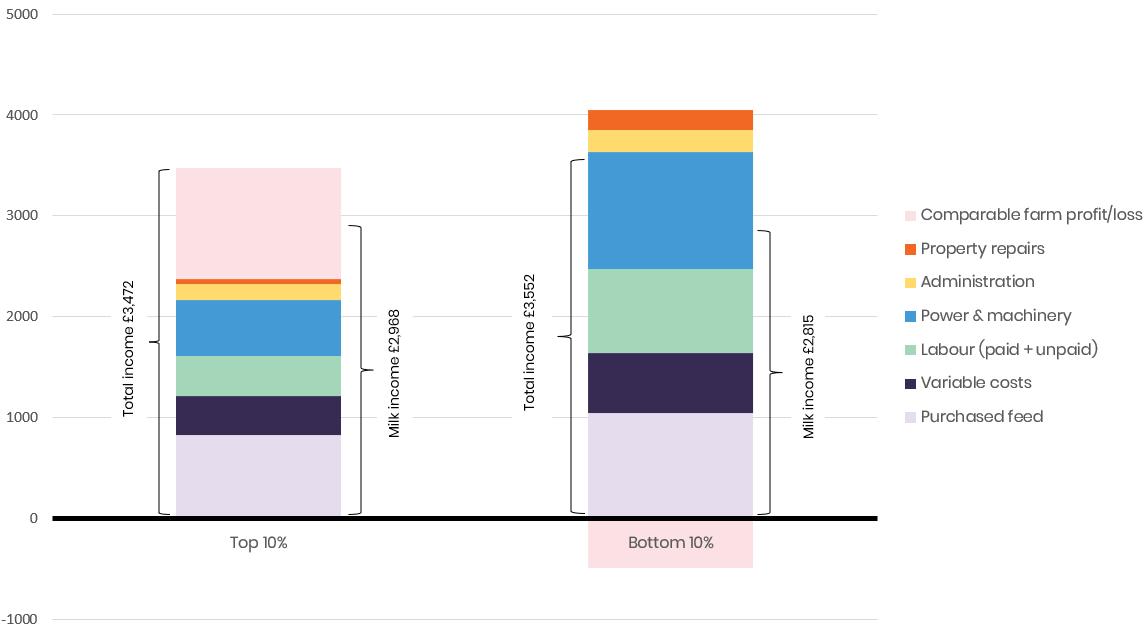
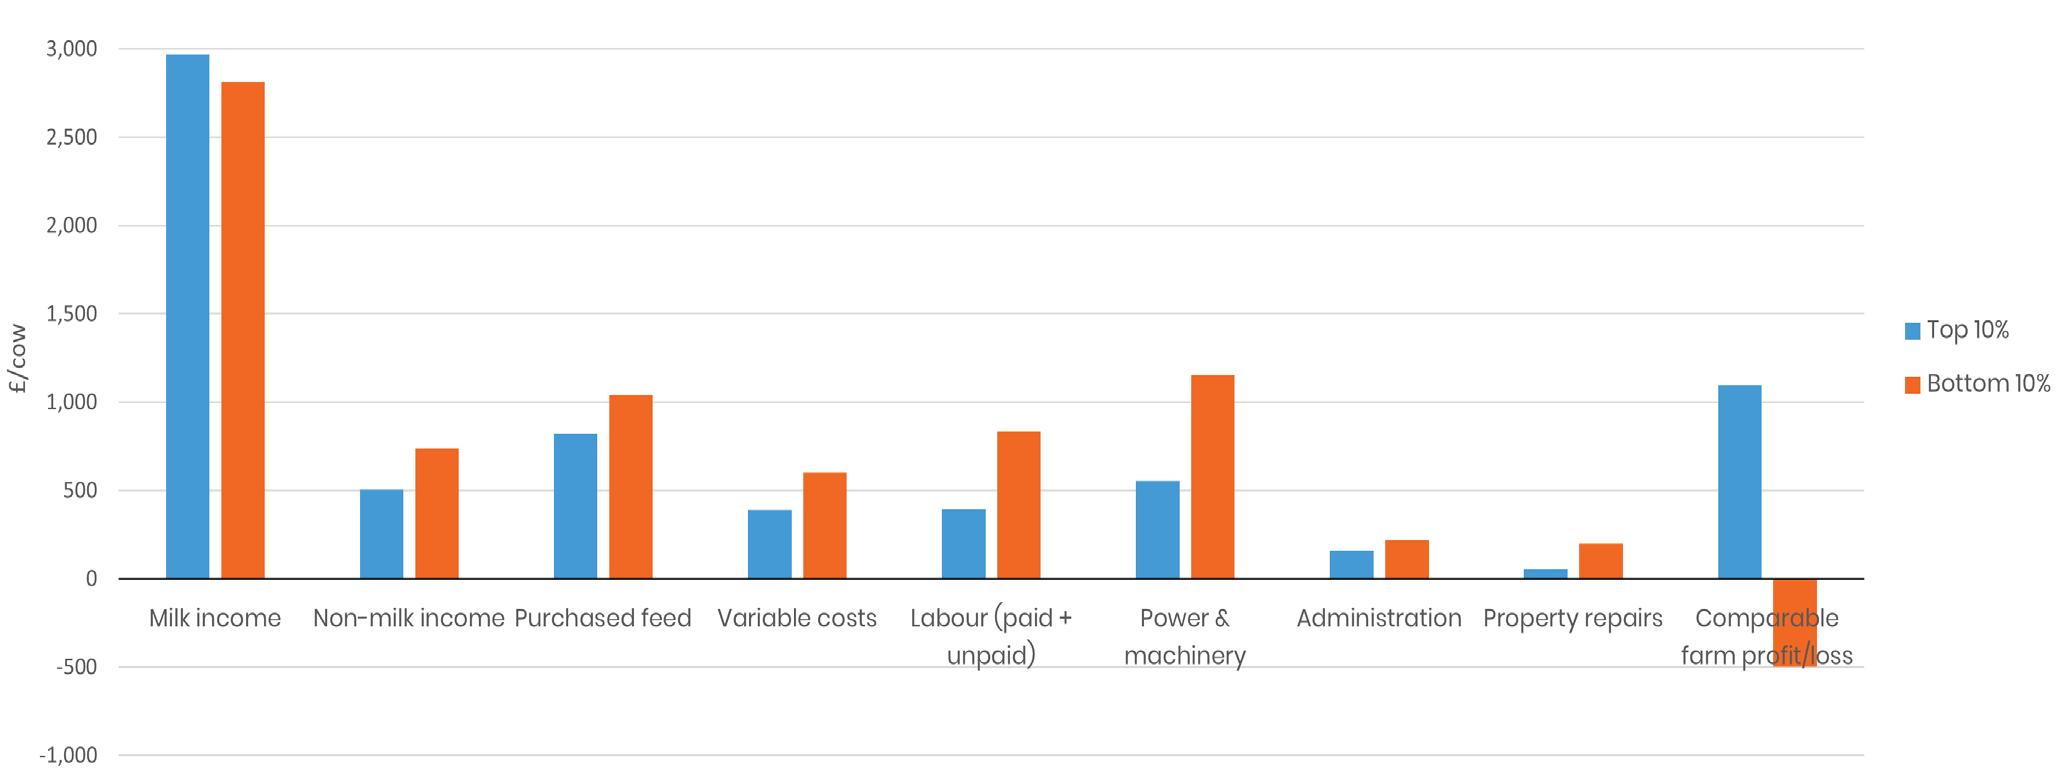
9. The total comparable cost of milk production for the top 10% of producers was £2,375/cow compared with £4,049/cow for the bottom 10%, a difference of £1,674/ cow. The top 10% generated an extra £153 of milk income despite spending less, showing that cost control may be key.
10. Interestingly, the top 10% of producers produced lower average yields at 6,135 litres per cow, which corresponds to £218/cow less than the bottom 10% that they spent on feed. This suggests that it does not matter what the milk price is, it is cost control that differentiates between the more profitable producers and less profitable ones. Those businesses that successfully reduced their feed costs whilst not simultaneously seeing a total collapse in yields fared best. However, the top 10% had a much larger average herd size (540 cows versus 198 cows).
11. Whilst finance costs and tax are excluded from the data to make farms comparable, these will have a huge impact on businesses. Interest rates fell over the period 2024/25, and so those businesses that are more highly geared may be able to take advantage of current market conditions.
In order to understand and interpret the results of the survey, it is important to set out the basis upon which these figures have been produced, specifically:
1. The sample consists of Old Mill and Farm Consultancy Group clients who derive their income mainly or solely from milk sales, across a variety of farming systems.
2. All farms have a 31 March year-end.
3. In order to make the businesses comparable, rents, interest payments, drawings, tax and capital expenditure have been excluded from the figures and
a labour charge of £30,000 has been included per full time Partner/Director. Basic Payment Scheme (BPS) and other subsidy income has also been excluded. It should be noted that depreciation has been included in these figures.
4. The projection for 2026 has been calculated by looking at actual costs incurred for this financial year to date along with national trends.
Whole sample - 2024/2025 results and future projections
“Those businesses that successfully controlled power, machinery and labour costs made the most of increasing milk prices in 2024/25.”
Whole sample Comparable Farm Profit
Key points
1. Milk income is expected to rise by £130/cow as the effects of a healthier milk price begin to take effect, although there may be more pressure on prices as we enter the winter. The large number of stock sales we saw last year is expected to continue as calf registrations are down. Yields are projected to rise further due to genomics.
2. Feed costs are broadly in line with 2024/25. This is due to the amount of feed used being predicted to rise as litreage goes up, but feed costs per tonne are expected to either stay constant or fall.
3. Variable costs expected to tick upwards again. Fertiliser prices are rising along with a possible rise in veterinary costs.
4. Profits expected to fall to £514/cow, which is very similar to the 4 year average of £520/cow. However, this average is misleading due to the large fluctuations we have seen over this 4 year period.
Top and bottom 10% by retained profit per cow vs bottom 10% - 2024/25
“Smaller herds who did not control costs may have found 2024/25 difficult. However, this same type of business could also have struggled in the very different conditions of 2023/24.”
Top 10% vs bottom 10% Comparable Farm Profit
“The key difference between the top 10% and the bottom 10% are labour and machinery costs per cow. Those unable to leverage economies of scale via larger herds may have found the year more difficult.”
Cost structure - top 10% vs bottom 10%
Key points
1. The top 10% received £153/cow more for their milk, although their average yield was lower.
2. There was a difference of £1,674/cow in the costs of production between the top 10% and the bottom 10%, with the gap closing slightly from the £1,752/cow seen in 2023/24. It was still much larger than the £163/cow difference seen in the fantastic (and possibly abnormal) year of 2022/2023.
3. Costs per cow are not consistent for the top 10% and the bottom 10%, like the last two years. Smaller herds may suffer higher labour and machinery costs per cow given their smaller numbers.
4. The average comparable farm profit for the top 10% was 17.98p/litre compared with a loss of 2.03p/litre for the bottom 10%.
5. The average yield per cow is actually lower for the top 10% of producers (6,135 litres per cow per year) in comparison to the bottom 10% (6,342 litres per cow per year). However, there is a range within these with the top 10% producing anywhere from 4,019 litres per cow to 8,113 litres per cow. The bottom 10% produced between 2,503 litres per cow and 8,979 litres per cow. This indicates that yields are not integral to profitability, as has been suggested by previous reports.
6. The top 10% actually spent less on feed per cow than the average, and this area was still a noticeable differential between the top 10% and bottom 10%. The top 10% spent £218 less on feed per cow than the bottom 10%, however the spend of this per cow by the bottom 10% was actually less than the average.
7. Combined labour and power and machinery, or ‘cost of doing work’ is £1,987/cow for the bottom 10%, compared to £947/cow for the top 10%. This cost is an important differential and is broadly similar to last year. Therefore, those top producers may have managed to keep the cost of doing work similar to last year and so enjoyed increased profits on the back of rising milk prices.
8. The top 10% has a herd on average of 342 heads larger than the bottom 10%, in comparison to a gap of 237 last year.
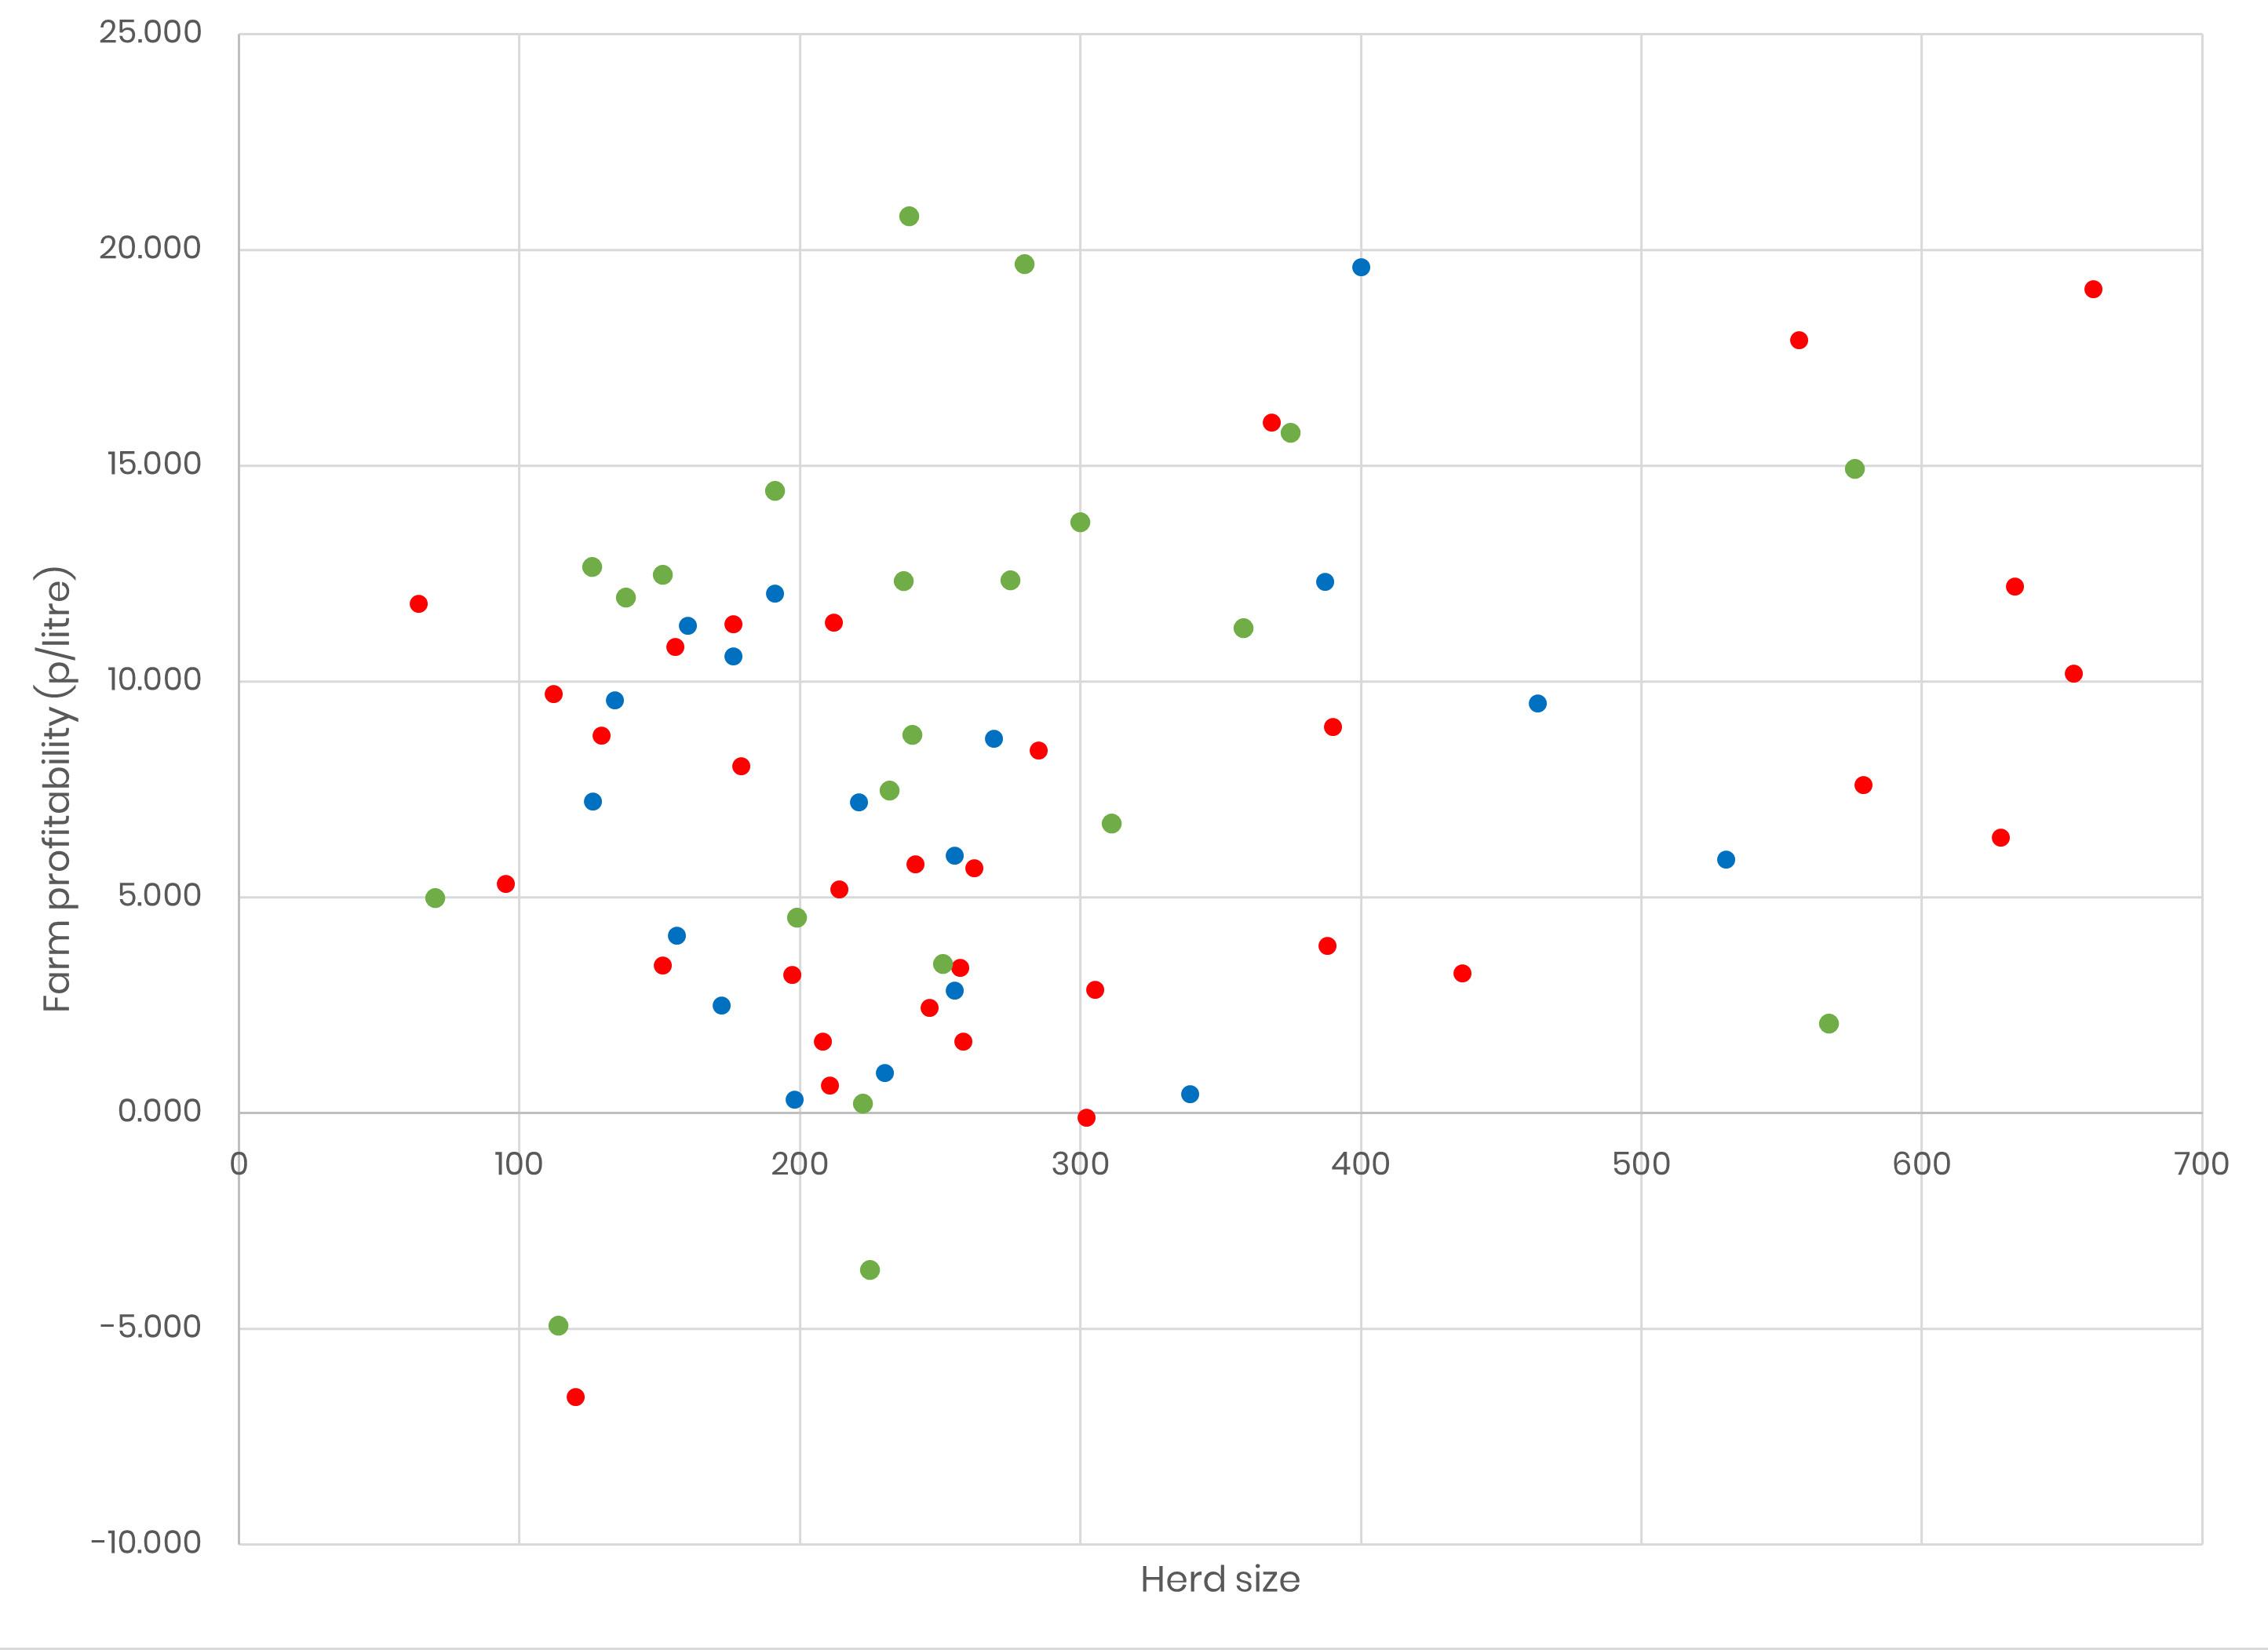
Farm
profitability by pence/litre vs herd size (shown by calving pattern)
Key points
1. Whether a system is high-yielding or low-yielding is not so important as a predictor of profitability this year.
2. The lack of trend amongst the data shows that as farm profitability per litre is not affected by herd size. Herds of all sizes can generate healthy profits on a per litre basis.
3. Furthermore, the graph shows no obvious correlation between calving system and higher profits. The suggestion here is that system utilised is not a good predictor of profitability.
4. Searching for higher yields does not necessarily lead to higher profitability per cow. This may be symptomatic of a continued trend noticed in last year’s report, namely that the costs suffered by dairy farmers are shifting away from feed and more towards the ‘cost of doing work’ such as machinery and labour costs.
5. Profitability has grown significantly for all farms, including those in the bottom 10% of producers. The gap between the top 10% and bottom 10% has not grown significantly wider.
6. This year, very few farms have shown a loss on a Cash Flow Projection (CFP) basis as a result of much higher average milk prices and costs which have not grown by a proportionate amount. Last year, many farms showed a loss on the CFP basis. Overall, this suggests that 2024/25 was a much more positive one for the industry.