ECONOMIC IMPACTS OF LIVING SHORELINES AND HYBRID
Scenario-based GIS/Grasshopper algorithm. Thesis project, Oksana Veselkova, CLEMSON MCRP, 2023 Dr C.S. Dyckman, Dr E. Morris, Dr L. Abdouni


4-STEP MODEL to assess how Nature-based and Hybrid adaptation strategies support local economy of tourism and recreation?
04. RECREATION CO-BENEFITS ASSESSMENT
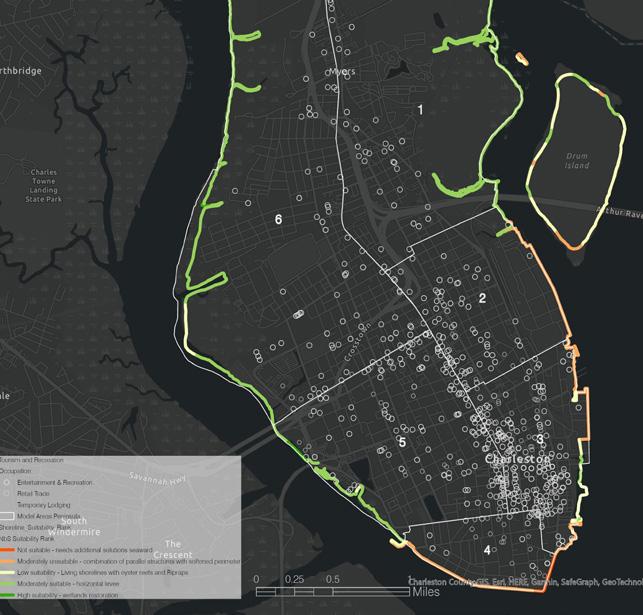
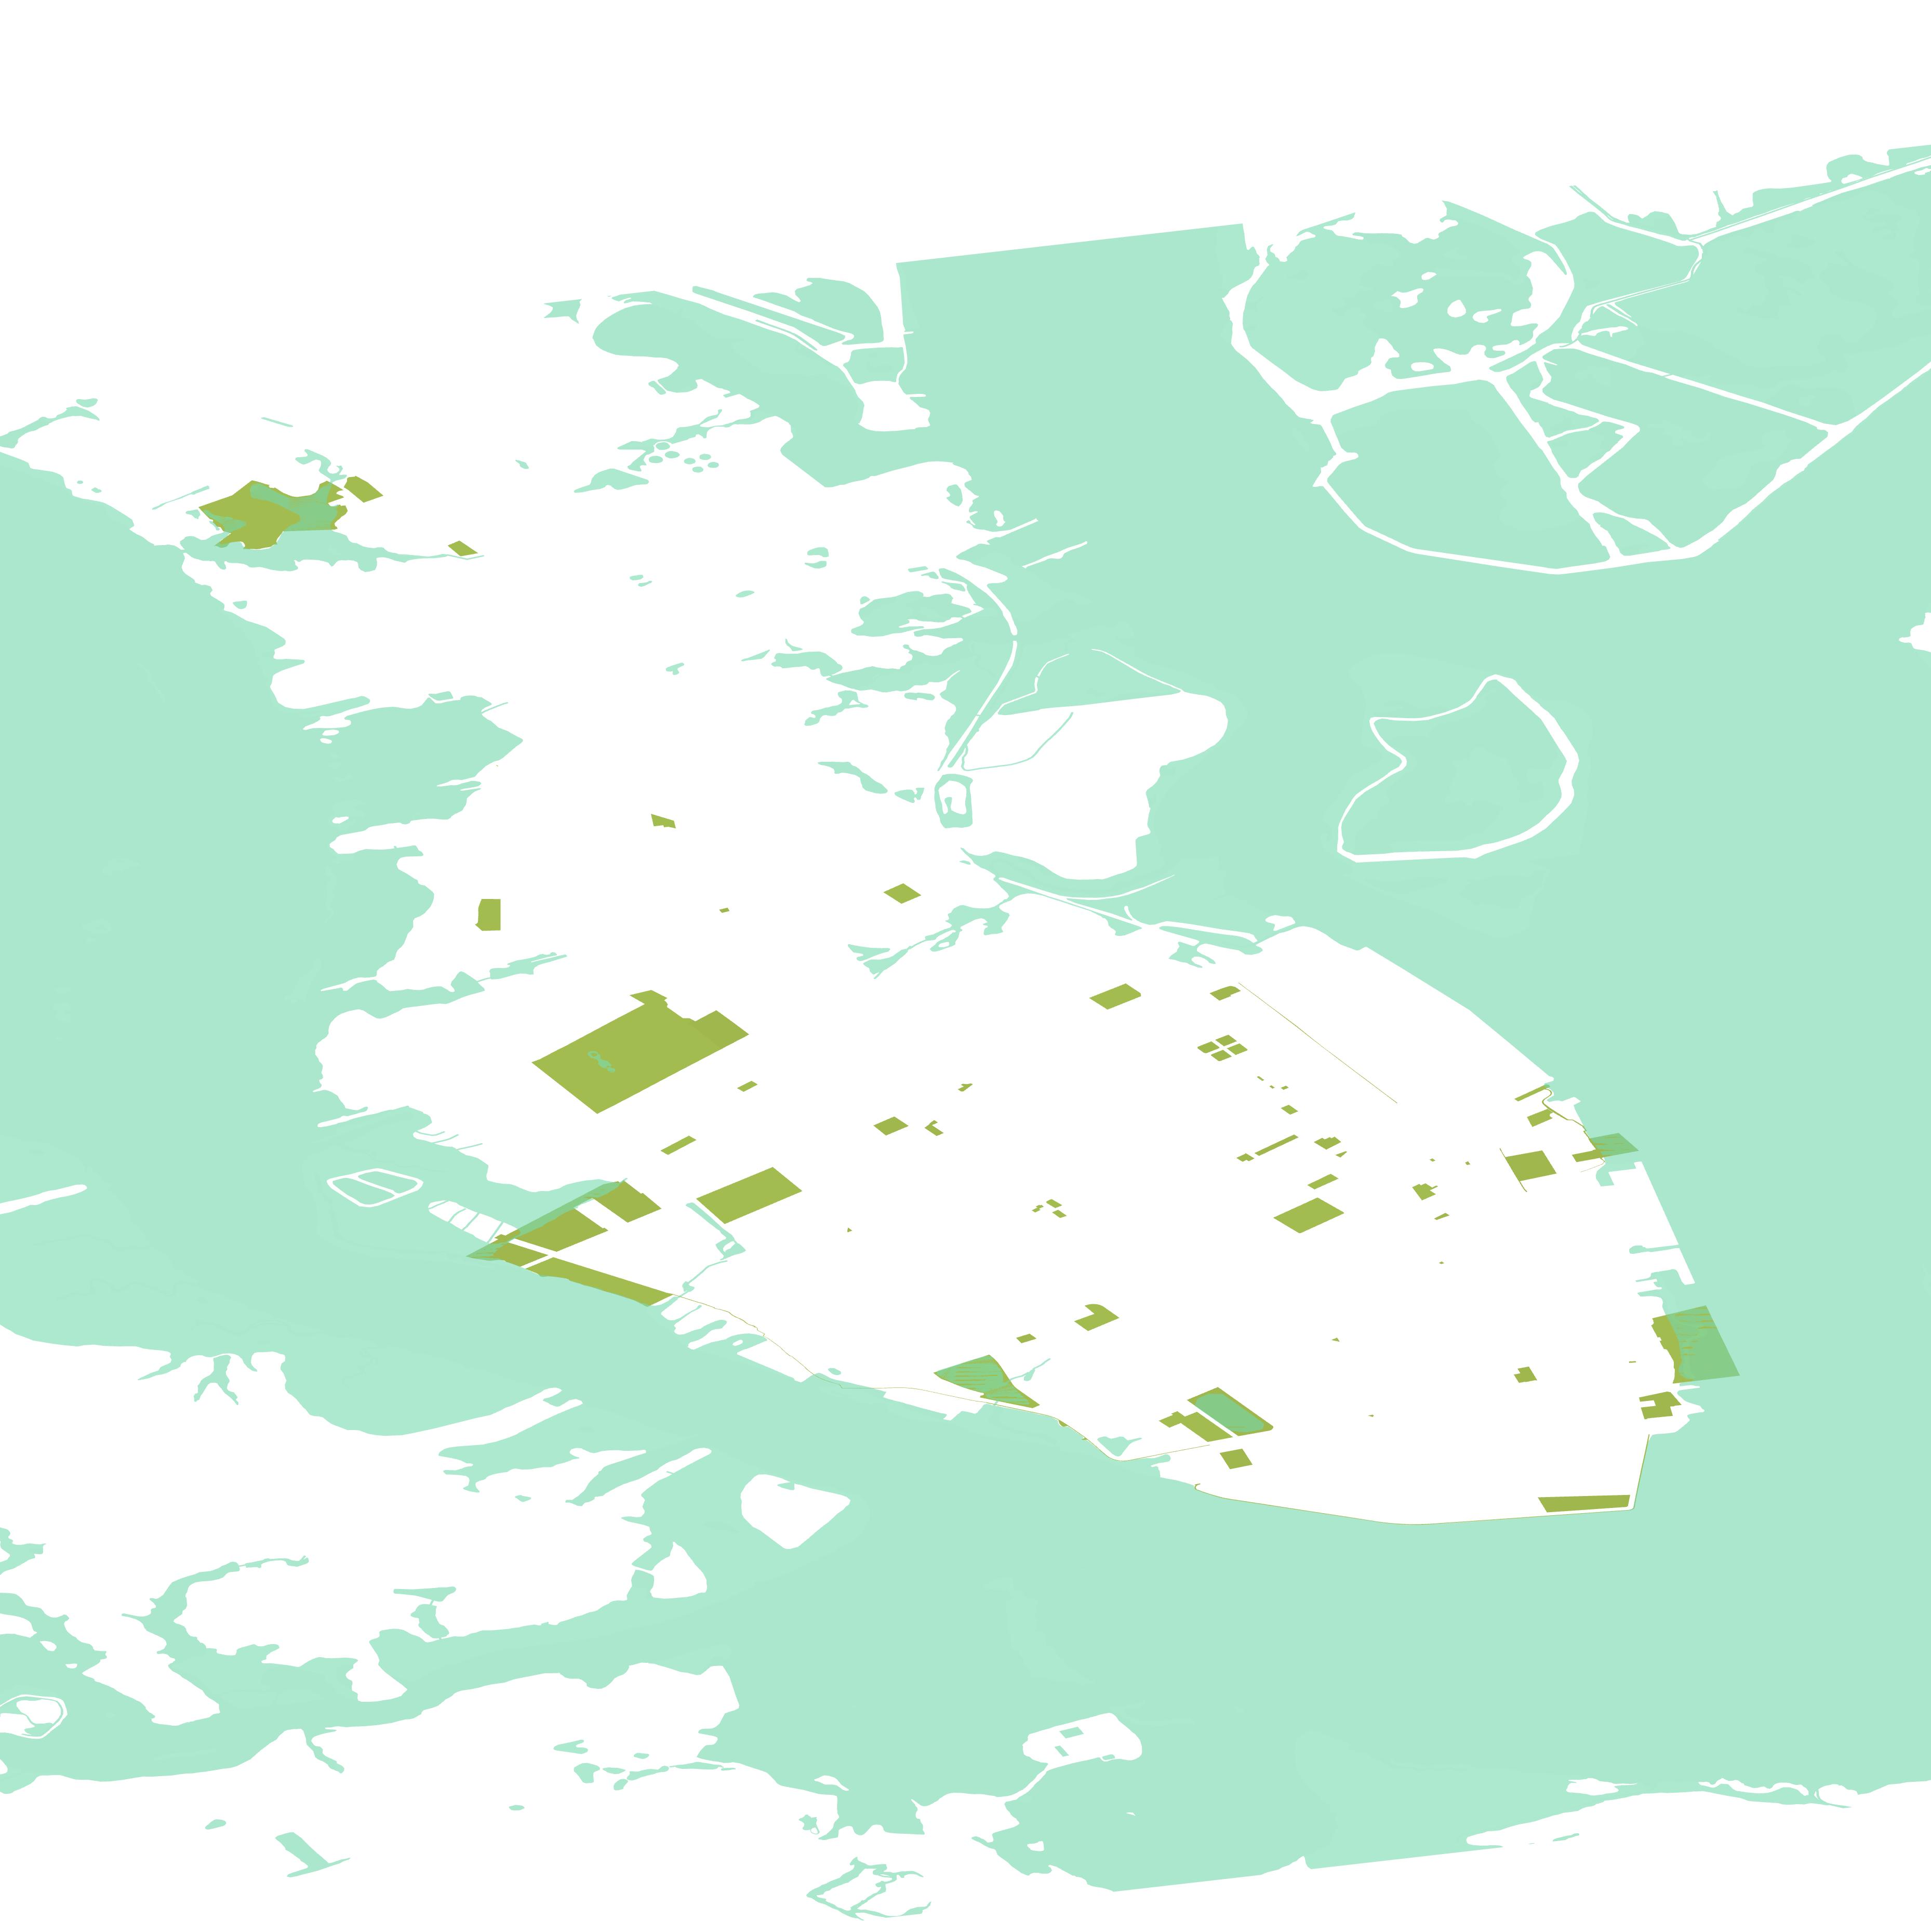
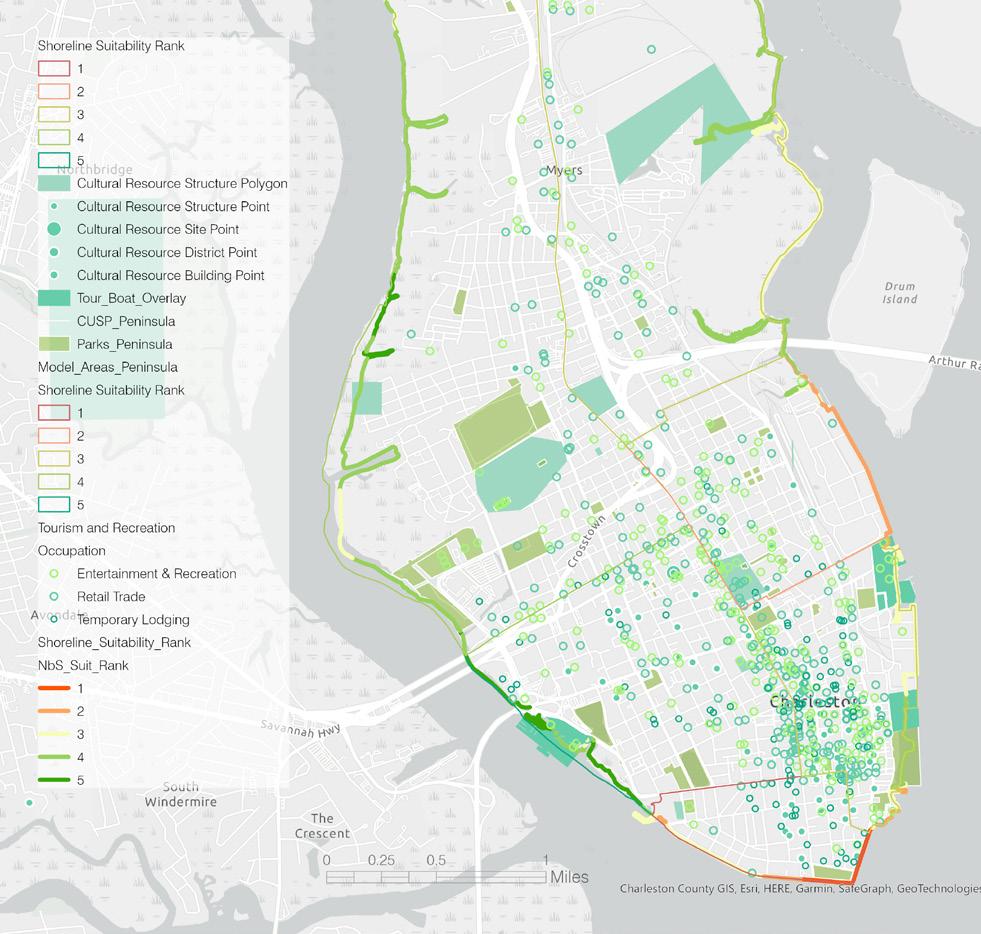
The resulting effects of the living shorelines are multiplied by co-benefits of recreation attractiveness. Cultural and recreational attractiveness of a place can accumulate visitor flows and increase the revenues even with the same number of establishments (that reduces potential physical damage). The recreational attractiveness multipliers are based on the presence of parks controlled by their acreage and activities, and tourist destinations in the model areas. Multipliers vary for scenarios based on the risk of facilities` closures and potential for additional recreational areas provided by NbS. These indices add or reduce the values by creating or preventing new green recreational areas. Recreation activities have potential to evolve towards the areas of the new green open spaces based on the updated comp plan and additional green areas of living shores. It increases the “soft” benefits -no additional tourism establishments will arise in the risk areas with the considerate land use policies. Implementation of the “best case scenario” project will result in additional visitor flows and load, especially in the areas of East Bay and Battery. Although, the areas of Marina and Wagener terrace have the potential to redistribute partly this load in case of the recreational uses of horizontal levee and the wetlands.
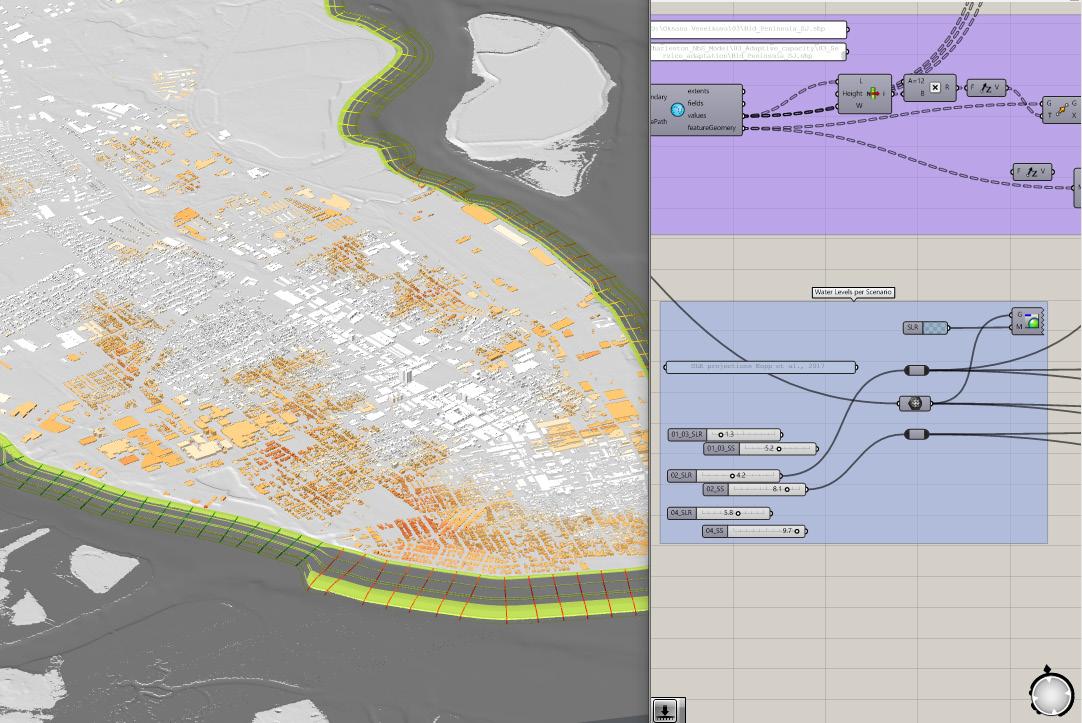
As applied in Charleston city center - the five major types of hybrid perimeter solutions are suggested depending on geomorphologic, environmental, and land use conditions in spatially explicit parametric algorithm. The model allows to run the operations recurrently simply updating the inputs. An important part of this approach is Scenario-based adaptive assessment –essential in dealing with scientific uncertainties and constantly updating knowledge.

While not sufficient to protect the coastal communities against extreme storm events of 1% APO, the Nature-Based coastal adaptation contribute considerably to tidal wave attenuation and mitigation of SLR. Thus, the most effective solutions suggested with the suitability and assessment model involve both structural and natural elements. This model comprise the assessment of direct benefits of NbS in terms of prevented damage, and co-benefits of added recreation value to an area.
I focus on business operation as a driver of sustained presence of an economy in a specific location. The units are individual buildings and results are aggregated on model areas level. Assessment of the Economic benefits of operation loss prevented is based on the HAZUS methodology for the business disruption module. Each as provided by the national structures inventory has their averaged attributes of recovery time, daily economic output per sqft, and business interruption function based on occupancy classes. Using a simple Loss equation I estimated output losses as a result of storm events per individual businesses and the resulting benefits of its prevention based on the exposure reduction . Weighing and extrapolating the values in Future scenarios will further require discounting and growth rates based on the local economic records – that are not included in this study.
Vegetated Dykes and Wetlands restoration in the short-term and moderate scenarios, and Wetlands and Barrier islands – in the extreme - show the highest levels of efficiency for the study area. Thus, we see that the balanced hybrid strategy provides better protection. Adaptation transects perform differently under moderate and extreme scenarios and identify the main beneficiaries of protection concentrated in the areas of East Bay, Battery, and Marina.
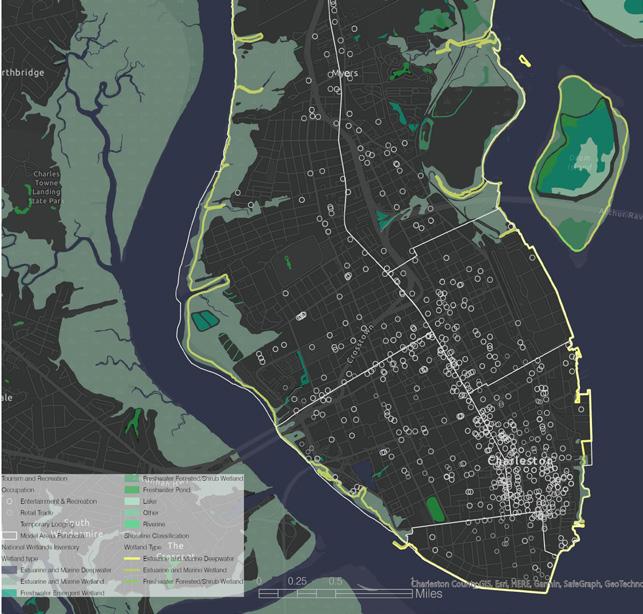
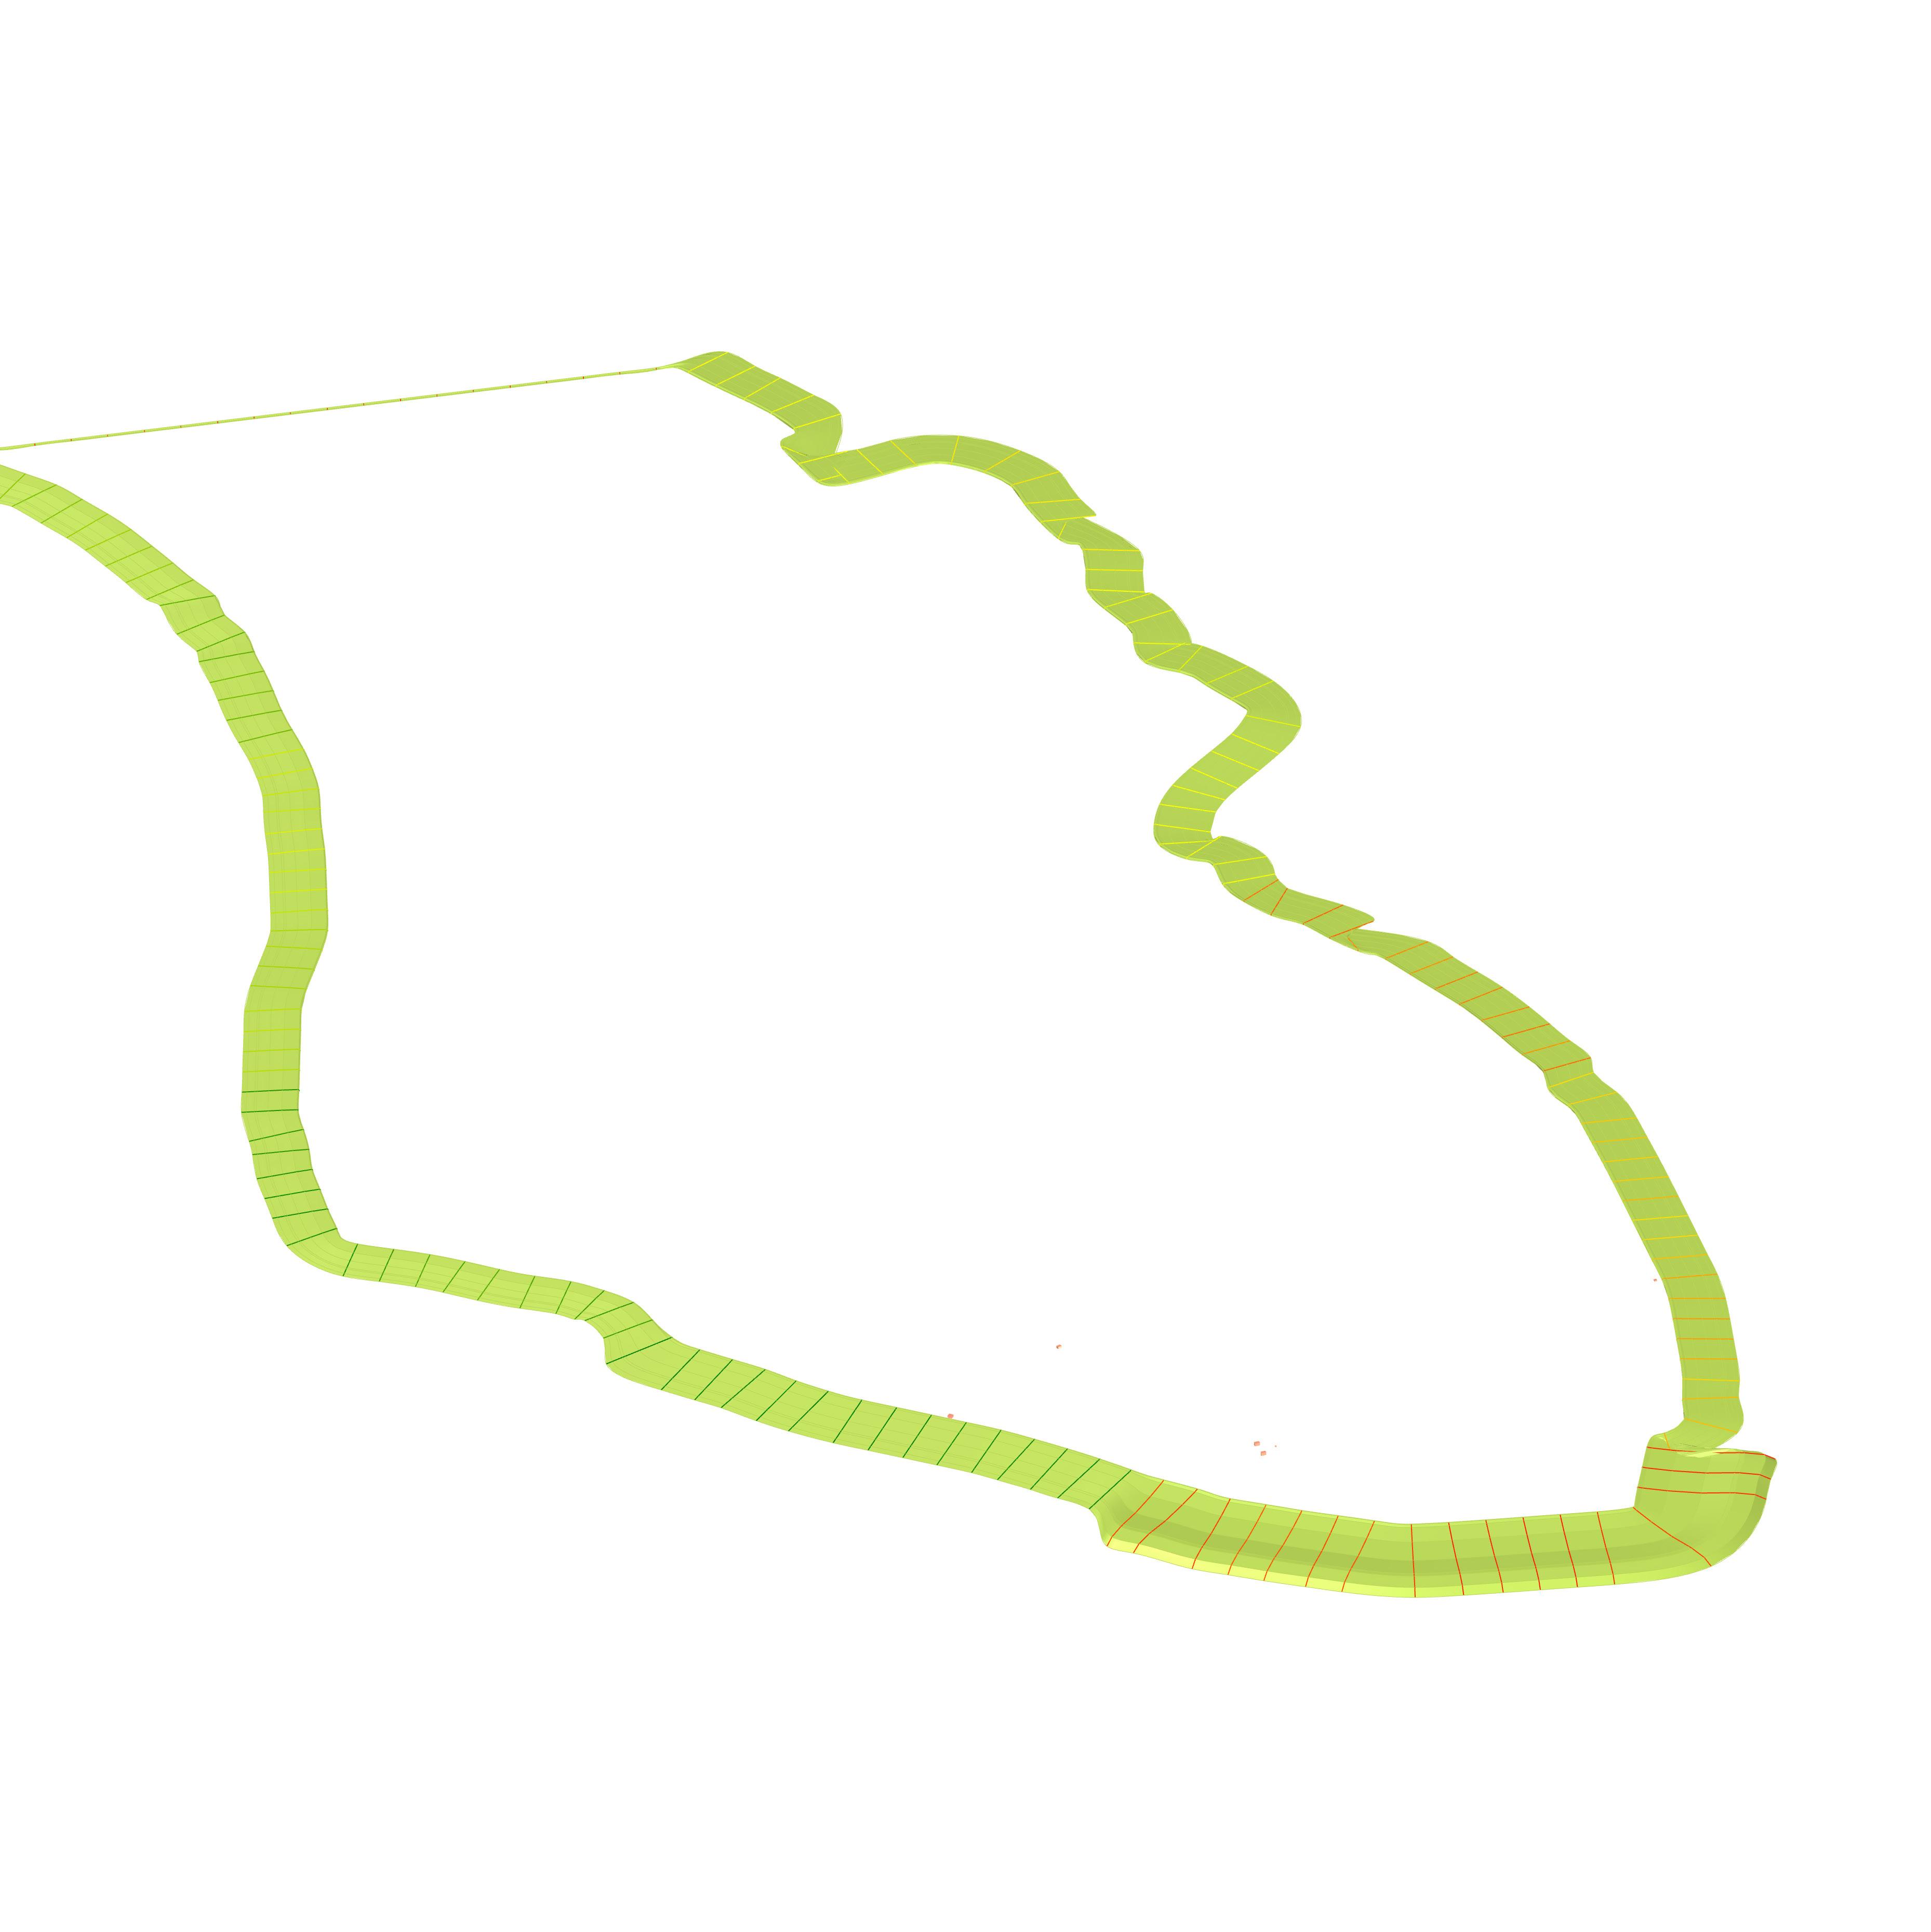
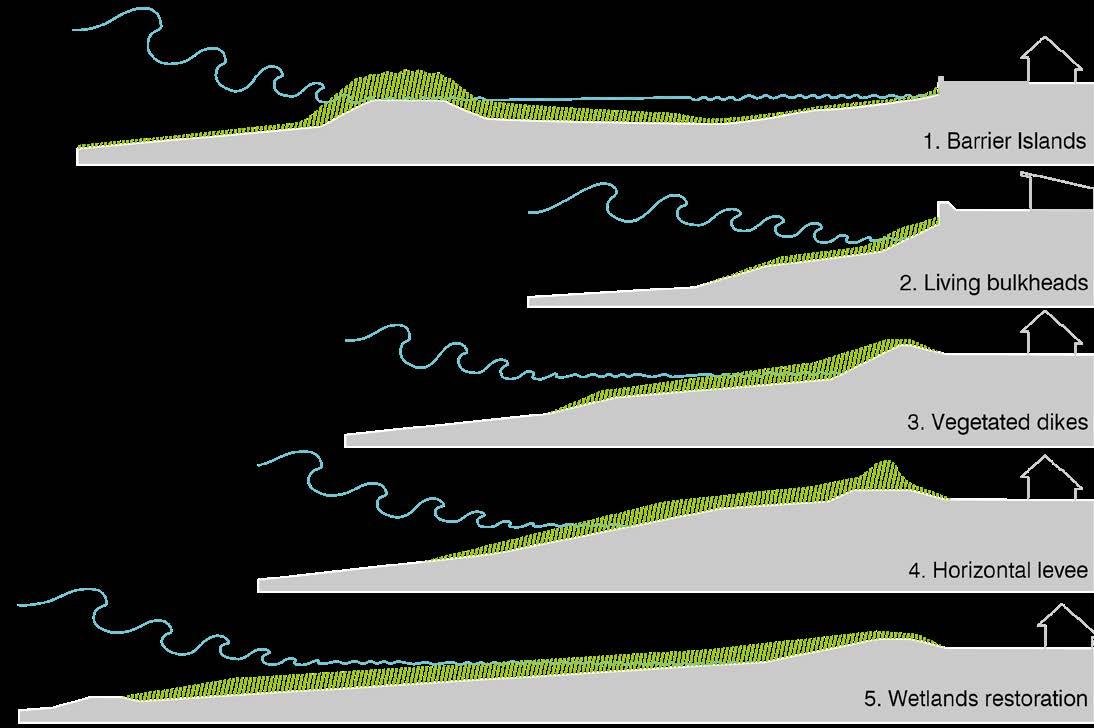
The shoreline is ranked by its level of suitability of nature-based solutions. These 5 Strategies relate to the ranking of the shoreline from most “natural” to the most “structural”. The attenuation performance parameters are attributed to the perimeter transects. I schematically define their capacities to reduce the risks by sponge-core subdivision of the cross sections with the core being the structural part preventing the constant floods, and sponge – reducing the wave heights. The crest heights of the structural parts of the transects are 4-5 ft allowing vegetation to grow over the scenarios.
The capacities of Shoreline types in risk reduction – prevented loss per acre - as provided by the model are the highest for East Bay and Marina in the short run, and NOMO and Marina in the long run. Although the vegetation attenuation capacity develops over time, the narrow “bottle neck” areas cannot provide enough space for the transect slopes to develop resulting in the lower protection.


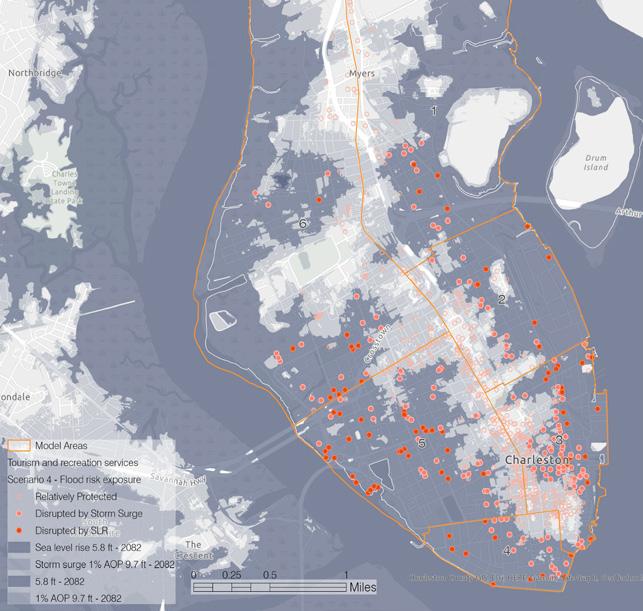
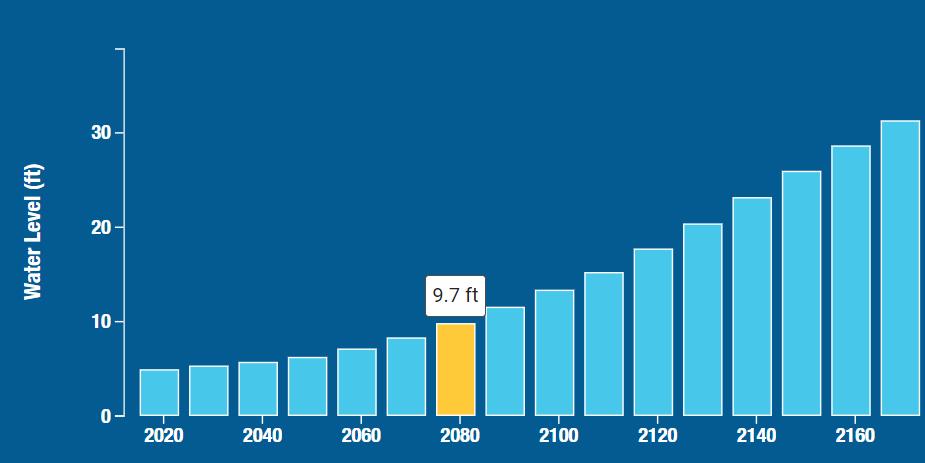
Flood Risk exposure is based upon the latest SLR projections (Kopp et al. (2017) and Climate Central data including arctic ice sheet melt). Flood scenarios use these projections to identify local levels of SLR and storm events wave heights in Grasshopper. Exposure is based on HAZUS definition of business disruption. Entertainment and retail are expected to be damaged the most - 60 to 80 % of affected facilities.