
ANNUAL REPORT 2023

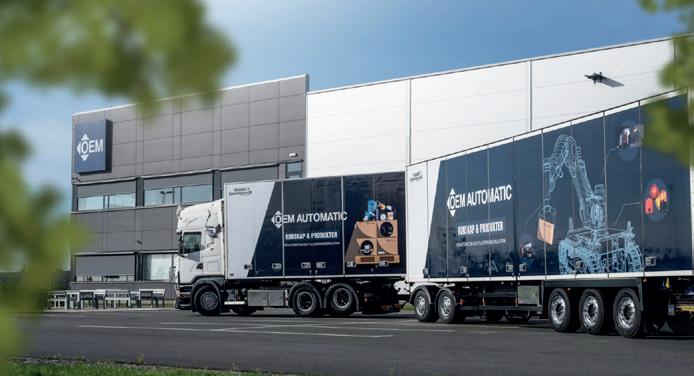
OEM’s business model is based on creating value for customers and suppliers. A steadfast commitment to improving and developing its offerings to customers results in a unique range of products and systems which, along with the technical expertise of its employees, create value for its customers’ products and processes. With a local presence, OEM markets its products effectively and reaches out to customers that suppliers would otherwise find it difficult to reach.

OEM had another record year with 9 percent growth in turnover. Good demand at the start of the year tapered off as a result of the weaker economic prognosis. Growth varies between industries and geographies and two thirds of the group’s operations had positive growth. The continued weakness of the Swedish Krona (SEK) during the year has had a positive effect on the turnover of 5 percentage units and acquisitions have been affected by 1 percentage unit, which gave organic growth of 3 percent.
Orders were 7 percent lower than turnover and the order backlog fell from SEK 1,088 million to SEK 859 million. This is due to more normalised delivery times, which in turn means that the order backlog that occurred in the year following the pandemic is being successively normalised.
Stock fell by approx. SEK 100 million during the year which contributed to a strong cash flow that amounted to SEK 791 million from ongoing operations.
Profit before tax increased by 6 percent and reached a new record level of SEK 770 million. Operating margins that have
strengthened in recent years remain at higher levels and amounted to 15.2 percent (15.5).
Three acquisitions were completedduring the year with a combined turnover of approx. SEK 200 million. Ingemar Liljenberg AB which sells cast, stamped and processed components for the engineering and electronics industries with an annual turnover of SEK 62 million. Lagermetall AB, which markets sliding bearings and bronze material and has an annual turnover of SEK 104 million. Danska Unit-Pump has an annual turnover of SEK 32 million. The companies complement OEM’s other operations.
The Board of Directors of OEM is proposing that the dividend payment is increased from 1.50 SEK to 1.75 SEK per share, which is the equivalent of SEK 243 million. Since OEM was listed on the stock market in 1983, the company has always, with the exception of 2009 and 2020, paid an unchanged or improved dividend.
OEM serves as an extended arm of suppliers in each market and, through the efforts of a strong marketing and sales organisation, aims to make each respective supplier a leading player in their niche. This makes OEM the best distribution channel for the suppliers on those markets where the group’s companies are active and OEM is today one of Europe’s leading technology business groups.
Value is created for the customers by offering a deep and broad range from leading manufacturers with local organisations and with strong technical product and application knowledge. Local warehouses and efficient logistics flows create a high level of service.
OEM has a portfolio of more than 60,000 products from over 400 suppliers who, with strong brands, are among the leading players in their respective niches. OEM’s long experience and great expertise gives customers a strong partner in product development, purchasing and production. OEM also supplies customer adapted components and combined units to further simplify and
OEM has operations in 15 countries in northern Europe, eastern Central Europe, the United Kingdom and China. Sweden and Finland are OEM’s largest markets and there OEM has a very wide product range and a market leading position within the majority of
its product areas. In other regions, the company's position varies from market to market, but OEM’s goal is to be one of the largest players in all its chosen markets.
The majority of OEM's customers operate in various segments of the manufacturing industry. Many are so-called Original Equipment Manufacturers (OEM), which means that they manufacture different types of machines and equipment using the components from sub-suppliers. Growing customer categories also include electrical wholesalers, installation companies and resellers to both the trade and to the consumer where OEM’s LED lighting is very successful.
2010
2012
Acquisition
2019
2015
2017
2011
Acquisition
2016
2014
Acquisition
2018
2020
2021
Acquisition
Acquisition
REGIONS:
Denmark, Norway, the United Kingdom and Eastern Central Europe Sweden
Finland, the Baltic states and China
2023
Acquisition of Lagermetall, Unit Pump and Ingemar Liljenberg
of Svenska Batteripoolen, Svenska Helag and Flexitron. Set up in Hungary. New logistics centre in Sweden. Sale of Cyncrona. of Akkupojat. New logistics centre in Finland. of Nexa and Scanding. Acquisition of Rydahls, ATC Tape Converting and Scannotec.OEM had another record year with 9 percent growth in turnover and 6 percent growth in operating profit.
The good demand of 2022 continued into the start of 2023. During the year the demand tapered within a range of segments as a result of the poor economic prognosis. Growth varies between industries and geographies and two thirds of the group’s operations had positive growth.
The largest company in the group, OEM Automatic AB, which increased turnover by 15 percent, is a good example of one of the operations that has reinforced its market position during the year. The continued weakness of the Swedish Krona during the year has had a positive effect on the turnover of 5 percentage units and acquisitions by 1 percentage unit, which gave organic growth of 3 percent.
Creativity and loyalty have been key to our success.
Orders were 7 percent lower than turnover was that the order stock fell from SEK 1088 million to SEK 859 million. The order backlog, which increased greatly during the pandemic, is nearing a more normal level as the flow of goods has successively normalised.
As the suppliers’ supply capacity has improved the stock could be reduced. In total, the stock has fallen by SEK 100 million during the year which has contributed to a strong cash flow, which from ongoing operations amounted to SEK 791 million.
The number of employees increased by 8 percent during the year as a result of completed acquisitions and a number of investments. Marketing activities and travel have now increased and are at pre-pandemic levels. The overall increase in costs is 7 percent during the year. The gross margin has reduced slightly mainly due to the customer and product mix.
Profit before tax increased by 6 percent and reached a new record level of 770 MSEK. This was the tenth year in succession that the company increased the profits. Operating margins that have strengthened in recent years remain at higher levels and amounted to 15.2 percent (15.5).
In terms of turnover, it was a record year for all regions and there was also a record result for region Sweden and for region Denmark, Norway, the United Kingdom and eastern Central Europe. The companies generally experi-
enced good demand in the first half of the year and lower demand in the second half. Approximately one third of the operations have had growth rates exceeding 10 percent. Most of the operations have maintained or improved their profitability and four-fifths of the operations have an operating margin exceeding 10 percent.
Sweden, which is the largest region, increased turnover by 8 percent while order intake fell by 2 percent. The operation that developed most strongly was Telfa, which increased its turnover by 19 percent. OEM Automatic, Svenska Batteripoolen and Agolux increased turnover by 15 percent. A weaker gross margin meant that operating profit for the region (EBITA) fell by 11 percent.
The region Finland, the Baltic States and China increased turnover by 5 percent, while order intake fell by 2 percent. OEM Electronics had the strongest development with 15 percent growth, followed by Elektro Elco and Akkupojat, which increased their turnovers by 8 percent and 6 percent respectively. Due to increased costs, operating profit (EBITA) for the region decreased by 4 percent.
For region Denmark, Norway, United Kingdom and eastern Central Europe, turnover increased by 15 percent and order intake by 6 percent. The operations in Slovakia and Hungary increased their turnover by 33 and 23 percent respectively and in Norway and Ireland they increased by 17 and 16 percent respectively. The growth, together with a general increased focus on profitability, means that operating profit for the region (EBITA) increased by 30 percent.
A number of companies were discussed during the year and a total of three acquisitions were made with a combined annual turnover of approximately SEK 200 million.
Ingemar Liljenberg AB, which sells customised cast, stamped and machined components for the engineering and electronics industry, was acquired in December. The company has an annual turnover of SEK 62 million and a business model that fits well with OEM. Lagermetall AB, which markets plain bearings and bronze and has annual sales of SEK 104 million, was acquired in October. The company will continue to operate as a separate company, but the many similarities with Internordic create synergies that are expected to create favourable development. Danska was bought in November
Unit-Pump has an annual turnover of SEK 32 million. The company complements OEM’s Danish operations and
was integrated into this company in conjunction with the accession
For the 2023 financial year a dividend of 1.75 SEK/share is proposed which is an increase of 17 percent compared to the normal dividend of the previous year. This is equivalent to about 40 percent of earnings per share after tax and a direct return of 1.8 percent based on OEM’s year-end share price.
Since OEM was listed on the stock market in 1983, the company has always paid an improved dividend, with the exception of five years when the dividend was unchanged or 2009 when the dividend was reduced by 33 percent and the pandemic year 2020 when no dividend was paid.
Continued concerns in the world around us are creating an uncertain market situation
The challenges of the last few years based on shortages of raw materials, interruptions to the logistics chain, variations in demand and cost increases were normalised in 2023, as a result of lower demand in the second half of the year. The more normalised business situation has meant that sales activities have intensified and significantly more new projects have been started which creates anticipation for the future. The political unrest in the world does mean that the market conditions are more uncertain. Last year’s many changes have taught us how to handle many unexpected situations.
The organisation has however shown proof of fantastic adaptability and a passion for serving the customers. Creativity and loyalty have been key to our success. Close collaboration with customers and suppliers means that strategies can be adapted to serve the customers and still make the most of new business opportunities. I am proud to be part of OEM’s organisation and look forward to the new challenges and opportunities that the coming year will bring.
Tranås, March 2024
Jörgen Zahlin Managing Director and CEO OEM International AB
In 1974, Hans and Siv Franzén and Agne and Inger Svenberg decided to leave Stockholm to found the limited company OEM Automatic in Tranås. Hans and Agne's background in industrial automation guided the company's focus. After establishing a number of supplier relationships, work on the Swedish market began. The ambition was modest but at the same time powerful, not necessarily to be the best in the world, just to be slightly better than its competitors. Today, OEM is a leading technology trading group in Europe, achieved through hard work, dedication and the pursuit of continuous development.
The 50th anniversary celebrations are not only a tribute to the past but also a step forward. OEM has always had a longterm perspective and has continuously made investments to strengthen the group's market positions. OEM is more than just a supplier of components and systems. The company's constant striving to develop the customer offering has resulted in a product range from more than 400 suppliers and an organisation of more than 1000 employees, with excellence in their respective fields. The company's ability to understand and anticipate market needs has made the company stable, which is appreciated by customers, suppliers and employees.
Hans and Agne set the tone for how the company would be managed and developed. Empowering employees at an early stage and working closely with customers to understand their needs and potential were key elements of the company's philosophy.
From a modest start in 1974, with a turnover of just over half a million SEK, the turnover in 1980 was 15 million SEK, and with an expanded organisation, subsidiaries were established in Finland the following year.
With good supplier relations and good sales growth, operations were started in Norway and Denmark over the following two years. Pride and natural responsibility were created by allowing each organisation to develop on its own terms and take decisions close to the business.
Good growth and future expansion plans led to an initial public offering on the OTC list of the Stockholm Stock Exchange in 1983. Turnover that year was SEK 30 million. Those who invested in 100 shares for 12,500 SEK at the IPO had a holding of 42 200 shares, worth about 3,000,000


SEK at the end of 2023. The success of OEM shares was confirmed at the end of 2023.
No other stock on the Stockholm Stock Exchange has a longer running streak of overperformance. It has beaten the index for 14 consecutive years. It could be an all-time Swedish endurance record.
DI 24/11 2023
The close co-operation with suppliers and the strong entrepreneurial spirit led to the establishment of a subsidiary in the United Kingdom in 1989, where the French supplier Syrelec became a 30 percent owner. The Franzén family moved to the United Kingdom and were responsible for building the business, which today has a turnover of SEK 250 million. In the late 1990s, OEM bought the remaining shares and became a 100 percent owner.
In 1990, when the group had a turnover of about 150 million Euros, the parent company OEM International was formed. OEM Automatic, previously the parent company, became one of the seven operating companies. The ambition for the parent company was to delegate the day-to-day business to each operating unit and to devote more time to making acquisitions and thus expanding the group.
In 1997, OEM merged with Cyncrona, which was then also listed on the stock exchange's OTC list. Cyncrona became a subgroup of OEM and Orvar Pantzar, together with the Franzén and Svenberg families, became a main owner of OEM.
It was a successful period in which the group grew to SEK 2 BSEK at the turn of the millennium, with some 20 acquisitions and a few start-ups during the period. The strong growth of the 1990s had shifted the company's business from operating solely in industrial automation to 40 percent of its business being in the telecoms, electronics and IT sectors.
Succession and the IT and
In the late 1990s, the founders began planning for a future change of leadership and in March 2000 Jörgen Zahlin took over as CEO of OEM International. Agne retired that year and Hans retired at the end of 2001. Both continued to serve on the Board.
Autumn 2000 saw the first signals of major changes in the IT and telecommunications sector. OEM’s two largest customers then were Nokia and Ericsson and OEM also had an indirect dependence on this sector through many of the other OEM's customers. At that time, the group consisted of 28 operations in 7 countries. The downturn in Nordic industry in 2001 led to a 30 percent drop in turnover in 2004, compared to the peak year of 2000.
During this period, OEM was forced to make major changes, with 250 of the group's nearly 800 employees leaving and nine businesses were closed down. However, the crisis was managed with a positive cash flow in each quarter and the only negative result was in the last quarter of 2001.
From 2004, growth was again the focus and the organic growth resumed, while a number of acquisitions were made. However, the process of change to the operations in the electronics and telecoms sectors continued until 2010. By then, a further 11 companies had disappeared through closure or mergers with other OEM operations.
With the acquisition of EIG in the Czech Republic in 2006, the expansion into eastern Central Europe continued, eventually establishing operations in Slovakia and Hungary. 33 acquisitions were made between 2008 and 2023. The most common reason for an acquisition has been to complement the offering in an existing market or to gain access to a completely new market. Two examples of this are Elektro Elco, a leader in LED lighting, which was acquired in 2008 and gave access to a whole new market segment, and the acquisition of Demesne in 2022 which established OEM in Ireland.
To ensure continued growth, it has been crucial that local
companies are entrepreneurial and focus on developing their own market positions. This has meant that each company has formed its own sales strategies, based on the needs of the market. It has also been easier for employees to feel a sense of belonging to the local company than to the whole group, which has contributed to strong commitment and a positive working environment. At the same time, it is important that the local companies feel supported by the group.
In 2007, the planning of a new logistics centre started and the procurement was carried out during the financial crisis in 2009. The 20 percent drop in turnover that year did not affect the company's plans and the logistics centre was opened in 2010. A strong fundamental belief in the business concept, together with financial strength, means that longterm plans are realised, even if market conditions temporarily deteriorate.
The investment at Höganloft has been important for the group's development. The building was initially 7,000 square metres and expanded to 12,000 square metres in 2019.
The role of the culture is to protect the legacy
The founders' idea of being a value-creating link between manufacturer and customer has, over 50 years, built an international group that continues the family business’s values of simple structures, decision-making close to the business, personal responsibility, entrepreneurship and cost-effectiveness. In 2015, the group once again passed the 2 billion mark in turnover, and will pass 3 billion in 2018 and 5 billion in 2023. There is a legacy to protect going forward, where the characteristics of the large company must be combined with small scale. The founders often talked about what is good for the long term, which has strongly influenced the way decisions are made. This philosophy is likely to lead to continued positive development; where customers have strong partnerships with OEM, where relationships with suppliers continue to be refined and where staff thrive and develop.
OEM shall be a leading technology trading group within components and systems for sustainable development.
OEM offers a broad and deep range of components and systems from leading suppliers in selected markets in Europe. With a well-developed local market organisation and efficient logistics, OEM is a better alternative
OEM's overall business goal is to be one of the leading technology trading companies in its chosen geographical markets. Profitability will be on par with, or better than, that of the largest players in each market.
OEM shall maintain sustainable profitable growth together with a good return on equity and with limited financial risk.
In February 2023, new objectives were adopted by the Board of Directors, and the four financial objectives going forward are:
to suppliers setting up their own sales companies. OEM provides a high level of expertise and service and markets the products according to the specific conditions of each respective market.
• Minimum sales growth of 10 percent per annum through a business cycle.
• A minimum EBITA margin of 12 percent per annum through a business cycle.
• A minimum return on equity of 25 percent per annum through a business cycle.
• OEM will prioritise a strong financial position to ensure operational stability and enable acquisitions, regardless of the economic climate.
• The debt/equity ratio shall be below 100 percent.
OEM has defined five strategic areas that are important for the company to continue to develop successfully and achieve its financial targets.
OEM creates growth by growing organically, through acquisitions and through geographic expansion. These three together will generate growth that meets the growth target.
1) Organic growth
OEM prioritises organic growth. OEM achieves organic growth by increasing its market shares and expanding the product range that the company offers to its customers. Where OEM is well established, the operations are expected to show growth above the underlying market growth. In markets where OEM has not yet reached a position among the top five players, the aim is to achieve significantly higher growth.
2) Acquisitions
Business combinations are a priority in OEM’s growth strategy. OEM acquires companies and product ranges that strengthen its market position within existing product areas on existing markets, including companies that add a completely new product range or give OEM access to a new geographic market.
3) Geographic expansion
Geographic expansion into new markets will take place when it is possible for OEM to become a prominent player by representing several of the company’s suppliers.
OEM shall offer a product range consisting of components and systems from leading suppliers. The range is adapted to the local markets in which OEM operates. Continuous development of the product range is of central importance for OEM – work that is carried out together with both existing and new suppliers. Each local marketing organisation is also tasked with finding new products that will further enhance the competitive edge of the portfolio of offerings.
OEM shall have a strong marketing approach, which is mainly based on personal sales combined with the website as a hub in the sales process. Face-to-face meetings are essential to understand the customer's needs, while providing the opportunity to share OEM's experience and technical expertise. Face-to-face selling is supported by digital and printed marketing communication materials.
OEM shall develop logistics solutions that deliver high levels of customer service and quality, as well as significant cost efficiencies. In total, there are 15 logistics units within the group, with the majority of the real estate owned by OEM. Each unit adapts its range to current operations and works towards greater coordination of the stockholding with other warehouses. Many of OEM’s logistics units also have processing units that provide efficient customised adjustment and assembly of products.
All activities should be permeated by an informal culture with the focus on entrepreneurship. OEM gives its staff opportunities to develop within the company, taking into account the targets and strategies of the business and the ambitions of the staff. Recruitment and employee strategies will lead to a significant number of leadership positions being filled internally.
Acquisitions create growth and contribute to the development of OEM. Acquired businesses add new products and new knowledge and broaden the customer base, which are important additions to the development work. The ambition is to add about SEK 250 million in sales annually through acquisitions.
OEM primarily pursues three types of acquisitions, with the first two being the most common:
• Operations with products that complement the offer in one of OEM’s existing markets.
• Operations that provide access to a new geographical market for one of OEM's existing product areas.
• Operations of product-owning companies in any of the markets where OEM is established.
The CEOs and business area managers of OEM's operations have the primary responsibility for seeking and identifying potential acquisition candidates. OEM also works with brokers, accounting firms and banks who provide leads for interesting companies. OEM strives to engage in dialogue at an early stage with the owners of potential targets. This creates trusting relationships and provides the opportunity to demonstrate OEM's ambitions to be a long-term owner that can contribute to further developing and expanding operations after completed acquisitions. The ideal acquisition candidates have a number of common characteristics:
39
2023
2015
2014
2014
2014
2014
2014
2012
2012
2012
2012
2011
2011
• A trading company or product-owning company with annual sales of SEK 30 - 250 million.
• Represents manufacturers or has its own brands.
• May have processing or simpler production facilities.
• The seller sees the advantage of a new owner who has a strong commitment to further developing the business.
A strong commitment to the organisation and the business is an important part of OEM's culture. When analysing acquisition targets, there is therefore a strong focus on the business and areas such as the organisation, company culture, portfolio of offerings and future potential. In addition, a review of how OEM's other operations are affected by the acquisition, and what synergies can be realised, is carried out. Acquisitions can be carried out by OEM buying a company, with or without the previous owners remaining in the company, or by OEM buying a company’s operations, known as asset acquisitions.
Based on the philosophy of being an active and long-term owner, OEM develops a plan to further develop the acquired business during the acquisition process. In many cases, OEM can capitalise on existing operations to open up new markets and customer groups and develop the range through its wide network of contacts with manufacturers. The acquired company can continue to operate as a separate company or can be integrated into one of the existing operations. The starting point for these considerations is what is best for the organisation and where the opportunities for development are the greatest.
2011
2011 Svenska Helag AB
2011
2010
2009
2008
2008
2007
2007
2006
Three completed acquisitions with combined annual turnover of approximately SEK 200 million.
Lagermetall AB, which has its headquarters in Örebro, was acquired in October. The company specialises in sales and marketing of industrial bearings and bronze materials for mechanical applications in all industries and has an annual turnover of SEK 104 MSEK. Lagermetall's products and solutions complement OEM's existing range very well. The company will continue to operate in its current form, but co-operation will primarily be with Internordic, which has a customer offering that is close to Lagermetall's.
The company is well managed and markets products and solutions that comple ment OEM's existing range.
The operation continues to operate as a separate company.

Unit-Pump A/S, in Kvistgård, Denmark, which was acquired in November, has been a significant player in the pump industry in Denmark for many years. The company has an annual turnover of SEK 31 MSEK and will be integrated with OEM Automatic Klitsø A/S. It will be a good addition to the established pump range and strengthens OEM's market position in this segment. UnitPump is well known on the market.
The acquisition strengthens OEM Automatic Klitsø and makes them a leading player in pumps.
The company has been integrated with OEM's Danish operations.

Ingemar Liljenberg AB, based in Vellinge south of Malmö, was acquired in December. The company has more than 50 years of experience in sourcing cast, stamped and machined components for the engineering and electronics industry. The annual turnover amounts to SEK 60 MSEK and the majority of it comes from customised solutions. The acquisition strengthens OEM's presence in sourcing and customised solutions, with synergies for the group in range development and marketing.
The company's products complement OEM's existing range well.
The operation continues to operate as a separate company.

Creating value for customers and suppliers is achieved through continuous work on developing the customer offering. By continuously broadening the product programme, increasing the level of service and strengthening technical expertise, OEM’s companies are strong players in their respective markets.
A wide range of quality products from leading suppliers is an important foundation of the business model. In many cases, products are customised according to customers' wishes.
The customisation is done either in one of the operations’ processing departments or, if the volumes are higher, directly at OEM's manufacturer. Examples of customisation can be a range of components that are delivered assembled or a product that has a customised cable length with a mounted connector. Close co-operation with both customers and suppliers is a prerequisite for effective dialogue and a high level of creativity, which ultimately provides customers with unique product solutions. It is now common for OEM to progressively become a supplier through whom customers coordinate an increasing proportion of their purchases.
Knowledge, service, efficiency and quality are some of OEM's values that characterise the co-operation with customers. The employees' high level of knowledge of both the operations’ product ranges and applications
supports customers in choosing components, which creates both technical and financial value for customers.
Strong sales organisations, modern marketing and local warehouses with efficient logistics flows are the foundation of OEM's business and the reason for the confidence to represent strong suppliers. The ambition is to be the suppliers' best sales channel in each market and to make them leading players in their respective niches. Close relationships with suppliers mean that they are characterised by loyalty and long-term commitment and OEM avoids marketing competing products. OEM's position in the market allows it to reach customers that the suppliers themselves would find difficult to reach.
The organisation has built up a great deal of expertise regarding suppliers' products and how they are used. OEM has regular discussions with suppliers about product development, which helps suppliers to develop products that meet market requirements and wishes, which in turn increases competitiveness.
The operations’ websites are the basis for all customer information, where the product range is presented with all possible information. Customers should be able to easily navigate between well-adapted product information, inspiration and knowledge, which
makes the companies' websites natural tools in their customers' everyday lives. The e-commerce function streamlines flows and becomes a natural tool in their customers' purchasing work.
The coordination between OEM's smaller warehouses and the larger logistics centres streamlines and automates the flow of goods, resulting in both high cost efficiency and quality as well as improving service levels. Logistics for larger customers are tailored to their requirements, including mode of delivery, packaging and frequency of delivery, creating clear benefits for the customers. There is ongoing work to streamline and create well-functioning goods flows that gradually increase availability, quality and service levels.
OEM offers a unique and extensive range of products from leading manufacturers.
In developing our activities, we work on the basis of four key processes
OEM has an efficient logistics process with high service standards.
Assistance with marketing in local markets.
• Can have their products marketed with complementary products.
• Reach markets and customers that are difficult to reach when acting alone.
• Help with product customisation.
• Logistics solutions that meet customer demands.
• Feedback for their own product development.
OEM runs an efficient sales process based on personal selling and extensive product knowledge.
Marketing communication
OEM creates modern marketing communication that supports its sales.
Access to components from more than 400 manufacturers.
• In-depth component knowledge.
• End-to-end solutions with complementary components.
• Possibility to reduce the number of manufacturers.
• Deliveries to the right place at the right time.
• Assurance of high product quality.
OEM's extensive offering of products and systems combined with its in-depth product and application expertise give customers access to high-quality products and the best possible support when choosing products for each particular application.
Product ranges are sourced from leading suppliers, mainly in Europe, the US and Asia. Continuously developing the customer offering and working with leading suppliers ensures that

The product area consists of products supplied by OEM Automatic, OEM Automatic Klitsø, Svenska Batteripoolen, Akkupojat and Demesne Electrical.
Examples of products:
Relays, terminal blocks, sensors, machine safety products and batteries.
Areas of application:
The products are used in or around automatic cabinets. Sensors and safety components are used in machinery, automated production lines, etc. Batteries are available as starter batteries or industrial batteries for e.g. voltage backup.
Examples of customers:
Komatsu Forrest, Epiroc, ABB and electrical wholesalers.
the range consists of competitive and quality products. The offer consists of standard products and systems, as well as customised solutions, which are developed in co-operation between the customer, the supplier and OEM.
The products are grouped at Group level into six overall product areas, but other groupings are used within each company.
Product range development
Extending and developing the range requires constant work and is primarily done in the following ways:

The product area consists of products supplied by OEM Automatic and OEM Automatic Klitsø.
Examples of products: Energy chains, machine cable, automotive products, warning products and cameras for both 2D and 3D applications.
Areas of application:
Most of the products are aimed at original equipment manufacturers (OEMs) for use in the machines they produce, such as forklifts and construction equipment. Parts of the range are also aimed at medical devices and consumer applications where there is a need for camera technology.
Examples of customers:
Toyota Material Handling Manufacturing, Epiroc, Sandvik, Cellavision and Flir.
• Co-operation with existing suppliers with the aim of extending the co-operation to a larger part of the supplier's range and to co-operate on new product development.
• Initiate co-operation with new suppliers of products that complement the existing range.
• Acquire businesses that provide access to new ranges or products that complement existing ranges.

The product area consists of products supplied by OEM Automatic, Telfa, Sitek-Palvelu, OEM Automatic Klitsø.
Examples of products:
Valves, meters, sensors and pumps.
Areas of application:
The products are mainly aimed at OEMs for use in the machines they manufacture and the process industry in Sweden, Finland and Denmark. The applications are many, ranging from mobile hydraulics to food and medicine.
Examples of customers:
Tetra Pak, Epiroc, Delaval, Volvo and Getinge.
OEM's offering differs in different geographical markets, which is a natural consequence of the different
Product areas
Electrical components
Machinery components & cables
Pressure & flow components
Motors, ball bearings & brakes
Appliance components
Installation components

The product area consists of products supplied by OEM Motor, Internordic, Ernst Hj Rydahl Bromsbandfabrik, OEM Automatic and OEM Automatic Klitsø.
Examples of products:
Drive electronics, motors, gears, ball bearings, seals, transmission products, brake and friction solutions.
Areas of application:
The products are aimed at OEMs for use in the machines and appliances they manufacture and are used, for example, in food industry equipment, medical devices and park and garden machinery. Brake and friction products also target the automotive industry.
Examples of customers:
Tetra Pak, Cytiva, Öhlins, Husqvarna, Toyota Material Handling Manufacturing, Nobina, Getinge Disinfection.
conditions in each market. OEM has been established for different lengths of time in the different markets, which has also affected the development. It is up to each individual operation to
adapt its offer to the demand of the local market and to the suppliers that are available for co-operation.

The product area consists of products supplied by OEM Electronics, Svenska Helag, ATC Tape Converting, Agolux and OEM Automatic.
Examples of products:
Displays, keyboards, cooling fans, tape, LED lighting, cabling and power components.
Areas of application:
The products are aimed at OEMs, serial and contract manufacturers to be used in the electronic equipment and appliances that they produce. The products are used in devices in a variety of fields, such as medical technology, consumer products, heating technology and industrial computers.
Examples of customers:
Husqvarna, Nibe, Franke and Axis.

The product area comprises products supplied by Elektro Elco, Agolux and Nexa Trading.
Examples of products:
Lighting and products for wireless control in the home.
Areas of application:
Indoor and outdoor home lighting with LED technology. Wireless control of lights, sunshades and doors in the home.
Examples of customers:
Electrical wholesalers targeting professional installers, such as Rexel and Elektroskandia. Building and DIY stores such as Bauhaus and Clas Ohlson.
Turnover growth was 8 percent for the Sweden region, a new record, but demand varied considerably more between businesses and industries this year. The cost and delivery situation has stabilised, but changes in the customer mix mean that the gross margin has deteriorated somewhat, which means that earnings increased by 2 percent and the operating margin decreased from 18.4 to 17.5 percent.
Sweden is the group's largest region, accounting for 57 percent of total turnover. The region consists of 13 units, each specialised in their area of expertise with a deep knowledge of their products and applications.
OEM offers more than 60,000 industrial component and systems products to the Swedish market. The product programme is marketed both as components and as assembled customised solutions for various applications in machine and equipment manufacturing.
OEM has a tradition of close co-operation with customers and often participates in customer development work. The product and application knowledge of sales staff and product specialists is an important element and helps to optimise customers' products and manufacturing processes. Good delivery capacity, a high level of service and flexible logistics solutions are additional areas where OEM creates value for its customers.
Number
In 2023, the market was characterised by initial strong demand, which then gradually slowed down during the year. Businesses that have a higher degree of exposure to the consumer and the construction sector experienced a clear decline in demand during the year. Delivery times and logistics flows were normalised and a historically large order backlog meant that the order intake was lower than sales during the year.
OEM's position in the Swedish market is generally strong and holds a market-leading position in several segments. It is a mature market with normal underlying growth of a couple of per cent per year, and where the performance of Swedish
export companies plays a huge role. Its customers are primarily equipment and appliance manufacturers, along with manufacturing companies in the automotive, forestry, telecommunications, IT and medical technology industries. Wholesale companies, builders merchants and DIY stores are customers in some segments.
Swedish industrial companies often concentrate their development and design in Sweden, while manufacturing takes place both in Sweden and around the world. Working closely with customers means that OEM normally follows the customer wherever the products are finally produced. Globalisation and digitalisation creates more transparency, leading to price competition, especially for standard products. OEM ensures competitive pricing through close co-operation with manufacturers and efficient internal processes. An important part of creating value for the customer is working to find the optimal solution for each application. Close co-operation with customers often leads to unique solutions for components, deliveries and business arrangements. This creates long-term customer relationships, allowing OEM to continue supplying customers even if they move their production abroad.
Sales growth was good for the first half of the year and then gradually declined to sales levels in line with the previous year. Sales growth for the full year was 8 percent, with currency changes affecting 4 percentage points and acquisitions 1 percentage point. This resulted in organic growth of 3 percentage points. The more stable delivery situation together with a high order backlog meant that the order intake decreased by 2 percent compared

Close co-operation with customers often leads to unique solutions for components, deliveries and business arrangements.
to the previous year and was 6 percent lower than turnover.
The operating profit (EBITA) increased by 2 percent and was affected by growth and by a lower gross margin and cost increases. The decline in gross margin is due to changes in the customer mix. The EBITA margin amounted to 17.5 percent, which is down from the previous year's record level of 18.4 percent.
Telfa, which markets pumps and pump units, is the operation that experienced the strongest growth during the year. The 19 percent increase in turnover is evidence of a clearly improved market position. While sales to existing customers increased, the company also acquired several new interesting customers. Agolux, which develops products of which lighting is a significant part, mainly for manufacturing companies, increased its turnover by 15 percent. The Group's largest company, OEM Automatic, had another record year with a 15 percent increase in turnover. The company is divided into six business areas, all of which experienced growth in both turnover and profit.
Two acquisitions were made during the year, adding SEK 170 MSEK in annual sales.
Examples of customers
Epiroc, Toyota Material Handling Manufacturing, Tetra Pak, ABB, Husqvarna, Delaval International AB, Rexel, Elektroskandia and Ahlsell.
Examples of competitors
Subsidiaries of trading companies like Addtech and Indutrade, subsidiaries of manufacturers like Schneider and Omron and lighting companies like Fagerhult.
The operations are carried out through the companies
OEM Automatic AB, Elektro Elco AB, OEM Electronics AB, OEM Motor AB, Internordic Bearings AB, AB Ernst Hj Rydahl Bromsbandsfabrik, Nexa Trading AB, Svenska Batteripoolen AB, Telfa AB, Agolux AB and ATC Tape Converting AB. Lagermetall AB and Ingemer Liljenberg AB were also acquired during the year.
The Finland, Baltic states and China region had a record turnover and grew by 5 percent. Demand varies considerably between the different operations, mainly depending on the sector and region. The gross margin strengthened during the year, while costs increased due to investments in both personnel and premises. Profit decreased by 4 percent and the operating margin decreased from 14.1 to 12.9 percent.
OEM's second region consists of operations in Finland, the Baltic countries of Estonia, Latvia and Lithuania, and China. The region accounts for 20 per cent of OEM's total turnover.
Finland is OEM's second largest market and was the first country outside Sweden in which OEM established itself. It operates within eight units, each with deep knowledge of its products and applications. The customer offering consists of a wide range of industrial components and systems where all the Group's six product areas are represented. The offering comprises both standard products and bespoke products and systems. The product range has evolved over the years based on local demand and the available ranges, making it slightly different from Sweden.
OEM's operations in the Baltic states and China were initially established to follow Swedish and Finnish customers who moved their production to these markets. The product offering in these markets is largely based on what is available from the Swedish and Finnish logistics units, but the majority of sales are in the areas of Electrical Components, Appliance Components and Motors.
Demand in 2023 was initially strong but then gradually slowed down during the year. The operations in China and the Baltic states, as well as operations exposed to the construction sector, have experienced a slowdown in demand during the year. A historically large order backlog, together with normalised delivery times and logistics flows, meant that order intake was lower than sales during the year.
OEM has a strong position in several segments in Finland. A broad product offering and a well-developed sales organisation have created strong partnerships with customers. Close co-operation with both customers and suppliers has provided the conditions for successfully developing the product offering. OEM's customers in Finland include major machinery and equipment manufacturers as well as industrial manufacturing companies in sectors such as forestry and construction equipment, mining machinery, lifts and energy solutions. Electrical and Heating, Ventilation and Sanitation wholesalers and the building trade are also important customer segments.
The operations in the Baltic States and China mainly serve Nordic customers who have established themselves there, as well as contract manufacturers. However, marketing and sales are also directed at local customers. Demand is largely influenced by the strategic decisions of contract manufacturers and Nordic customers rather than by general market developments.
The beginning of the year saw strong growth rates, which then gradually slowed down. Sales growth was 5 percent for the full year. Currency changes had an impact of 7 percentage points, resulting in negative organic growth of 2 percentage points. A more stable delivery situation and a large order backlog meant that order intake decreased by 2 percent compared with the previous year and was 8 percent lower than sales.
Earnings decreased by 4 percent due to increased costs, which are in turn due to a 10 percent increase in the

number of employees, increased rent due to larger property and increased travel costs. The increase in gross margin compensated for some of these cost increases. The operating margin decreased from 14.1 to 12.9 percent.
OEM Electronics increased its turnover by 15 percent, the highest growth in the region. Hide-a-lite, which sells LED lighting, increased its turnover by 8 percent and Akkupojat/Battery Finland, which markets starter and industrial batteries, increased turnover by 6 percent.
The region's largest business, OEM Automatic, had a strong start to the year but a weaker finish, which meant that sales ended in line with the previous year. RauHeat, which markets HVAC products, experienced a decline in demand due to the downturn in the construction sector, resulting in a fall in turnover of more than 20 percent. The turnover of operations in China and the Baltic states decreased by about 15 percent.
Examples of customers
Examples of competitors
Subsidiaries of trading companies such as Addtech and Indutrade, as well as Lapp Automaatio, SKS and Wexon.
The operations are carried out through the companies
OEM Automatic, OEM Electronics, Akkupojat/Battery Finland, Motor & Bearings Finland and Hide-a-lite Finland, RauHeat and OEM Automatic in China, Estonia and Lithuania.
Generally good demand together with a positive currency effect and a minor acquisition resulted in a 15 percent increase in turnover. The two smaller operations in Slovakia and Hungary accounted for the strongest growth, followed by the operations in Norway and Ireland. Strong growth is the main reason for the improved profitability, which increased by 30 percent. The operating margin increased from 11.6 to 13.1 percent, which is a new record level for the region.
OEM's third region consists of operations in eight countries. Operations in the region are conducted through seven OEM Automatic companies and the Irish company Demesne, which was acquired in 2022. OEM Electronics is also established in Poland, the Czech Republic, Slovakia and Denmark. In Denmark and Norway lighting products are marketed under the Hide-a-lite brand.
Operations differ according to differences in demand and the availability of product ranges. There are country-specific customers that are unique to the group, and in some cases the local offering is specialised for these customers. The region accounts for 23 per cent of OEM's total turnover.
The offer in the region largely consists of standard products, but also customised products and systems. Each company has gradually developed its offerings over the years, and the larger companies in Denmark, UK, Norway, Poland and the Czech Republic now have broad product offerings. The Slovakian company works closely with the Czech one, sharing both resources and stock. The company acquired in Ireland is mainly active in electrical components, which creates good expansion potential in other segments.
OEM's markets in the region are differentiated and differ according to each country's history and economic development. The operations in Ireland are the largest in the region and are mainly aimed at wholesalers and contract builders of data centres. In the UK, the customer base is relatively broad and consists of both OEM’s customers and end users. Local distributors who supply manufactur-
ing companies with components are also an important customer group.
In Denmark, the food and chemical industries and wind turbines are important customer groups. In Norway, the customer base mainly consists of small industrial companies and developments in the electrification of vehicles have created new partnerships.
The railway industry is an important customer group for eastern Central Europe. In Poland, there are important customers in the domestic mining and mineral industries, while the Czech Republic, Slovakia and Hungary a significant customer segment is made up of subcontractors to the automotive industry. Operations in Slovakia and Hungary are relatively small, which also limits the product offering.
Net sales increased by 15 percent for the region. The currency had a positive impact of 7 percent, resulting in an overall organic growth of 8 percent. A small acquisition in pumps was made at the end of the year, which had a marginal impact on sales this year.
The product offering has continued to evolve, generating growth with both new and existing customers.
The order intake increased by 6 percent compared with the previous year but was 6 percent lower than sales, due to a large order backlog which, together with a more stable delivery situation, means that customers have shorter lead times.
Operating profit (EBITA) increased by 30 percent and was affected by growth and a slightly improved gross margin and a number of efficiency measures that were implemented. The deterioration in the gross margin is due to changes
in the customer mix. The EBITA margin increased from 11.6 to 13.1 percent.
Demesne in Ireland is experiencing continued good demand and has continued to successfully develop its business, resulting in growth of 15 percent and a continued good level of profitability. OEM Automatic in Norway has made a number of new investments while enjoying several years of good demand, with growth of 17 percent this year.
The operations in Slovakia and Hungary are now subordinate to OEM Automatic in the Czech Republic, which has led to improved efficiency. Growth for these two businesses amounted to 33 and 23 percent respectively and both businesses have satisfactory profitability.
In November, Unit-Pump, a Danish company with annual sales of SEK 32 million, was acquired. The company has been integrated into OEM Automatic Klitsö and complements their range well.

OEM's third region consists of operations in eight countries where the operations differ according to differences in demand and the availability of product ranges. OEM Automatic in Norway has made a number of new investments and grew by 17 percent in 2023.
Examples of competitors
The suppliers’ own subsidiaries such as Sick, Omron and Festo. Technology trading companies such as Dacpol and Asta.
The operations are carried out through the companies
Employee development and continuous replenishment of young talent is an important part of building a long-term competitive company. In today's highly competitive environment, the knowledge and commitment of our employees is crucial to our success. Creating gender-equal organisations with healthy corporate cultures and good working environments is a priority. It also makes OEM an attractive employer, both for existing and future employees.
Sales staff and product specialists play a central role in developing the organisations' customer offerings, which in turn creates the conditions for growth and profitability. Strong teams that continuously develop enable the Group to meet the market's ever-increasing demands for product and application expertise. This focus on development and growth also creates favourable conditions for employees to pursue a career within OEM.
A strong corporate culture helps to build competitive organisations
Corporate culture has played an important role in OEM's development since the company was founded 50 years ago. Over the years, a number of key words have crystallised and today the activities are characterised by a positive attitude, commitment, unpretentiousness, goal focus, openness and a long-term approach. A strong corporate culture helps create strong organisations and makes group companies attractive employers.
Strong employee trust and long-term
relationships with customers and suppliers are an important part of the business model and the ambition is to constantly exceed expectations.
Sales staff work closely with customers and aim to provide the best service on the market. The sales process is well organised and good business acumen makes it easier to identify and take advantage of new business opportunities. Sales staff have individual development plans that run over several years and are an important tool for developing the sales process.
The product organisations work closely with the product suppliers and have face-to-face meetings, both at the suppliers' factories and at OEM's operations. For large projects, it is common for suppliers to visit customers together with OEM staff to create the best conditions for developing competitive offers.
One of OEM's overall sustainability goals is to increase the overall number of women employed in order increase the number of women in management positions in the long term. Organisations where every individual has equal opportunities are more dynamic and have a stronger competitive advantage. The aim is to recruit two-thirds of managers internally, and senior positions are currently often held by people with a background in the sales and product organisations. This means that increasing the share of women in these areas is particularly important for achieving the gender equality objective. The technology sector is generally male-dominated and there is an over-representation of male applicants for recruitment. The focus is therefore on increasing the number of female applicants, especially within services that work closely with custom-
ers and suppliers. A series of activities are in place to maximise the chances of succeeding with this, including posing requirements on those conducting the recruitment process and giving female candidates the opportunity to meet female employees during the recruitment processes.
Group companies have the primary responsibility for developing the skills of their employees. In addition, key initiatives such as group-wide development programmes are undertaken both to strengthen skills and to build networks between employees.
Strong teams with clear goals, both for group and individuals, are success factors and key to OEM's leadership culture. To meet our employees' expectations for development, it is important that each manager works to identify and develop people with leadership qualities who can become the leaders of the future. Since the majority of management recruitment is from within OEM, this is given high priority.
Curiosity, creativity and goal-orientation are encouraged. These are important characteristics for employees' career opportunities, while contributing to the group's development. Experience from the sales and product organisations is highly valued and mobility between different operations and countries is encouraged.
An important part of building competitive organisations is to continuously reinforce them with new young employees. Interest in technology and sales are meritorious for recruitment and are also qualities that add drive

and dynamism to the organisation. Induction programmes and personal development plans are used in order to ensure that new recruits settle into their tasks quickly. In the long term, this also reinforces the employee's own career development with the possibility of gradually growing into more responsible positions. OEM has a trainee programme for newly-graduated employees with degrees in engineering or economics and the potential to assume leadership responsibilities in the future. To facilitate future recruitment and raise awareness of OEM's activities, OEM also co-operates with several educational organisations, including offering internships and supervision of degree projects.
Many OEM employees stay for a long time, which is in line with the groups'
ambition. Continuous efforts are made to strengthen our position as an attractive employer, both to retain existing employees and to recruit new ones. Personal development is important to employee satisfaction and happiness. Annual performance reviews and individual development plans play an important role in the continuous competence development. Development plans are customised based on a follow-up of the previous years' activities and the employee's ambitions combined with the objectives and needs of the organisation. Effective employee development processes are also an important tool for identifying new leadership candidates.
Healthy lifestyle and good working environment
Happiness and health are essential for enabling employees to perform and
develop throughout their career, both individually and as part of a team. OEM encourages its employees to adopt a healthy lifestyle by, for example, supporting exercise activities. Workplaces must provide an attractive, safe and healthy environment and regular investments are made to ensure this is so for those who work there. Activities designed to create good cohesion, strong teams and group dynamics are often conducted in conjunction with conferences, workplace meetings and other gatherings.
Employee numbers increased
The number of employees increased from 998 to 1054 in 2023. Of these, 32 were added through acquisitions and 24 were reinforcements to existing operations.
OEM shall ensure sustainable economic growth and promote decent labour conditions for both OEM and its suppliers. The sustainability strategy is not just part of the business model, it is at its core and is a driver of development and growth. OEM will be at the forefront of sustainable development in line with Agenda 2030, covering economic, ecological and social aspects of sustainability. OEM's ambition is to achieve sustainable profitable growth, reduce negative environmental impact, maintain high business ethics and to be an attractive workplace. The commitment of every
employee makes a difference; they are the ones who drive us towards a brighter and more sustainable future. Securing OEM's position in the future is not just about keeping up with developments but about being at the forefront of them. In 2023, adaptations were made to ensure that OEM complies with the new CSRD Directive and the new ESRS reporting standard. OEM believes that change starts from within and has therefore categorised identified focus areas from the product, which is the core of the business, to people and the environment.
With the Hide-a-lite brand, Elektro Elco AB has carefully reflected on its role as a supplier and its contribution to a more sustainable future. An increasingly environmentally conscious world requires energy-efficient solutions, smart features and sustainable materials. The Hide-a-lite brand has continuously developed new technologies to adapt to the growth and changes in society. Elektro Elco introduced its first LED light source back in 2004, an important step towards a more sustainable society by reducing energy consumption. The company recognises that the most sustainable energy is that which never needs to be produced. Elektro Elco has introduced the sustainability symbol A Hide-a-lite choice to help customers make informed choices. The range includes luminaires that are not only high-performing with the right light, but also built for a sustainable future. The products are designed to allow replacement of parts, easy disassembly and to be reused as raw material for new products at the end of their life. In addition, they are made from innovative and renewable materials,

including recycled ocean plastic certified by the Control Union under the Global Recycled Standard (GRS). This certification guarantees the compliance of products with safety requirements and covers the entire manufacturing process with requirements for recycled materials, traceability, social and environmental standards and chemical restrictions. Through joint efforts, Elektro Elco and its customers can save the earth's resources for a sustainable future together.

OEM's product range includes Igus® i.CEE and i.SENSE systems, which are at the forefront of industrial sustainability through their role in streamlining maintenance planning and enhancing operational reliability. Systems help reduce wear and tear and increase the lifespan of cable chains and cables, resulting in less material consumption and waste production. Their advanced monitoring and proactive maintenance capabilities ensure that the equipment operates in optimal conditions, reducing energy consumption and operating costs. The integration with Industry 4.0 technology means that resources are used more efficiently, which not only saves costs but also reduces environmental impact. These solutions are therefore excellent examples of sustainable products within OEM's offering.
Gender-equal organisations are a priority and the recruitment process is an important tool to achieve this goal. For example, by making demands on recruiters and ensuring that marketing communications reflect gender equality values, the number of female applicants for advertised positions increases. This is not only a step towards a more inclusive workplace but also a way to highlight and challenge the traditional norms of the industry.
Over the past year, OEM has taken significant steps towards a more sustainable business through several implemented activities. By introducing sustainable fuel for sea freight in co-operation with Geodis, several companies have contributed to a cleaner environment and a more sustainable shipping process.
In line with its commitment to increase the share of self-generated electricity, OEM has continued to expand the installation of solar panels on its own properties. This results in reduced emissions and increased use of renewable energy. This is also prioritised when signing new electricity contracts, which increasingly include 100 percent renewable energy.
The focus has also been on the development and provision of sustainable products, an area where OEM endeavours to offer solutions that are energy efficient, have a longer
OEM works systematically to develop quality and efficiency. The Group's own management system of activities, "OQD" - OEM Quality Development is based on Toyota's principles. The management system includes close monitoring of non-conformances, visualisation of results compared with objectives and improvement initiatives from employees. OEM Automatic in Sweden developed the system, which is also used to varying degrees by the rest of the Group. Several companies are also certified to ISO 14001 and ISO 9001, international standards for environmental and quality management. These certifications ensure responsible management of environmental impacts and the maintenance of high product and service quality, improving competitiveness and strengthening customer confidence.
Another example is the importance of women meeting women in the recruitment process and at events such as school fairs. This increases awareness of OEM as an equal opportunity employer among potential future employees. That leads to a higher proportion of female applicants for advertised posts, which in turn ensures that OEM achieves its gender equality objectives.
lifespan or contribute to reduced waste. By working with its suppliers to integrate sustainability into product design and development, the company is taking an important step towards a more sustainable future.
The company's vehicle fleet is another area where sustainability has been prioritised through the introduction of a new company car policy, which to a greater extent enables the choice of fossil-free company cars. This action is in line with the goal of reducing carbon emissions and emphasises OEM's commitment to reducing its environmental impact.
In summary, OEM's actions over the year have clearly demonstrated a comprehensive commitment to sustainability. The company has reduced its environmental impact and promoted a more sustainable future through a series of strategic initiatives.
In Sweden, the following companies are environmentally certified to ISO 14001 and quality certified to ISO 9001:
• OEM Automatic
• Elektro Elco
• OEM Electronics
• OEM Motor
• Ernst Hj Rydahl Bromsbandfabrik
• Svenska Batteripoolen
• Internordic Bearings
• Telfa
• ATC Tape Converting
• Agolux
• Lagermetall
• Svenska Helag
OEM Automatic in Poland and Ingemar Liljenberg in Sweden are quality certified according to ISO 9001.
OEM's full Sustainability Report is available at www.oem.se
PRODUCTS – Global goal 9
OEM shall apply its extensive knowledge of products and applications to help customers make sustainably-sound choices of components and solutions
• Inventory the number of suppliers that have a sustainability report.
OUTCOME: The organisations now have a more extensive dialogue regarding sustainability with their suppliers.
• Communicate environmentally sound products in marketing communications and sales processes.
OUTCOME: This is already a natural part of the sales process and marketing communication.
• The number of supplier assessments should increase compared to 2022
OUTCOME: 547 (476)
Guiding customers in choosing the right components is a central part of the sustainability work. OEM focuses on providing sustainable alternatives, which may include, for exam-
ple, products with lower energy consumption or increased efficiency. It can also include products that reduce the need to travel and contribute to more efficient production and operational processes. Other examples include products that have a long lifespan and are easy to repair and recycle, supporting the principles of the circular economy.
With its solid product knowledge, OEM offers a holistic perspective and works closely with customers on both small and large projects. OEM not only strives to sell products, but also to help create better overall solutions. This is done either in collaboration with partners who are experts in specific areas, or by bringing together products that can work together to help customers save energy or work more efficiently, for example.
OEM's ambition to offer sustainable solutions not only supports the transition to a sustainable society, but also provides a competitive advantage and creates new business opportunities. OEM's goals include increasing knowledge and awareness of, and commitment to, sustainability within the Group, continuing to integrate sustainability into sales processes and training, and working with suppliers to offer even more sustainable products and solutions.
OEM shall have an inclusive working environment where everyone has equal opportunities based on their qualifications for the job regardless of gender, ensure sustainable economic growth and promote decent working conditions at both OEM and its suppliers.
• At least 30% women in recruitment, with the aim of increasing the number of women employed OUTCOME: 23%
• At least 20% women in recruitment for sales and product services, with the aim of increasing the number of women in management positions over time.
OUTCOME: 17%
• Inventory the number of suppliers who have a code of conduct.
OUTCOME: 231
• 100% of all employees shall have a performance appraisal during the year
OUTCOME: > 95%
A good working environment, both internally and with suppliers, while maintaining sustainable economic growth is seen as a prerequisite for the success of the company. There is a clear link between a good working environment and sustainable economic growth.
Employee well-being is prioritised and regular surveys are carried out to ensure this. Physical safety is very important and significant efforts are made to ensure that all premises are safe places to work. Information about suppliers' sustainability efforts and codes of conduct is actively sought. OEM also aims to increase the proportion of women in new recruitment in order to eventually increase the number of women in management positions.
OEM works actively with gender equality in its marketing communications to make it clear that it is an attractive and inclusive workplace for everyone, which also contributes to the industry's overall gender equality development. During the recruitment process, it is important to target everyone regardless of gender and origin.
OEM will contribute to climate change mitigation by reducing CO2 emissions, which is critical to slowing down climate change.
• Halve CO2 emissions every 10 years, base year 2020.
OUTCOME: Scope 1: 1,045 tonnes CO2 (1,027)
Scope 2: 606 tonnes CO2 (153)
Scope 3: 4,945 tonnes CO2 (3,013)
Some of the increase in emissions can be explained by much more extensive reporting.
• 100% renewable purchased energy by 2030.
OUTCOME: The companies already purchase a high proportion of renewable energy . This is also prioritised when new contracts are signed.
• Fossil fuel-free vehicle fleet by 2030.
OUTCOME: New company car policy and contracts are formulated toenable this.
• Implement activities to reduce fossil fuel dependency in freight transport.
OUTCOME: Focus area 2023 with several activities completed. For example, several group companies have signed an agreement with the Geodi Marine Fuel Insetting programme for bio-based sustainable fuels for shipping.
• Increase knowledge, awareness and commitment in the organisation.
OUTCOME: In 2023, a large number of activities were carried out at company level to increase awareness and engagement.
The main environmental impact for OEM comes from freight transport, business travel and the use of premises. The focus is on optimising these areas, while influencing customers and suppliers to make informed choices. The goal is to halve CO2 emissions by 2030 compared to 2020. Increased knowledge with significantly more comprehensive and precise measurements, for example, within the GHG Protocol's Scope 3 means that the comparative figures between years are misleading. Sustainability reporting is being prioritised and significant resources are being put into ensuring that it complies with the CSRD and ESRS that will apply from 2024.
OEM places a strong focus on measures and activities in the areas of greatest impact. Transport is a challenge for a distribution-intensive company like OEM. In shipping, sustainable marine fuel will be introduced via Geodis from 2023, further reducing CO2 emissions. OEM also aims to replace
its car fleet with electric cars, complemented by the installation of charging stations at most of its own properties. The use of renewable diesel, HVO100, in pool cars contributes to cleaner combustion and more efficient operation, especially in cold conditions. For fast and urgent transport to major customers, electrically powered freight vehicles are used, which significantly reduce CO2 emissions.
The Höganloft logistics centre in Tranås handles transport and storage for several companies in the group. There is co-operation in areas such as economy, quality and sustainability. Each company within the group has common overall sustainability goals, with the freedom to adapt and develop specific focus areas. There is also co-operation in GHG reporting and supplier assessments. Several of the group's companies use renewable electricity in their premises. An energy saving project in owned properties was initiated in 2012, which includes the installation of solar panels. This has resulted in a 14 percent reduction in electricity consumption, despite extensive expansion of the logistics centre in Tranås. The photovoltaic portfolio was expanded during 2023, and it now covers over 80 percent of the annual electricity demand for the properties in Tranås. The deployment of solar panels will continue on the properties in Finland and Denmark during 2024.
The Greenhouse Gas Protocol (GHG) is a global standard to help organisations report their emissions. OEM has previously reported in Scope 1 and Scope 2 and reported transport, business travel and rented premises in Scope 3. In 2023, more detailed reporting was implemented and several activities were carried out to enable this. More complete reporting of Scope 3 emissions is also necessary to report under CSRD and also enables a future connection to the Science Based Targets initiative (SBTi).
Scope 1 Direct greenhouse gas emissions, i.e. emissions that the organisation itself is responsible for and can influence.
Scope 2 Indirect emissions in the form of purchased energy from external suppliers. The operations can influence Scope 2 emissions by choosing climatefriendly energy suppliers.
Scope 3 Indirect emissions beyond purchased energy, such as materials, transport and other external suppliers.
The Board of Directors and the Managing Director of OEM International AB (publ.), CRN 556184-6691, with its headquarters in Tranås, Sweden, hereby present the Annual Report and the consolidated financial statements for the 2023 financial year. The Annual Report and the consolidated financial statements, including the Auditors' Report, are given on pages 33-86. Figures for 2022 are given in brackets.
Business review
OEM is a leading technology trading group operating in 15 selected markets in northern Europe, East Central Europe, the British Isles and China. Operations are conducted in subsidiaries in the Nordic countries, the UK, Ireland, Poland, the Czech Republic, Slovakia, the Netherlands, Hungary, Estonia, Latvia, Lithuania and China.
OEM is a value-adding link between its customers and leading manufacturers of products and systems for industrial applications. As one of Europe's leading technology trading groups, OEM brings value to its customers by offering an extensive range of products coupled with considerable technical product and applications expertise. With a strong marketing and sales organisation, OEM serves as the extended arm of the suppliers in each market and aims to make them a leading player in their niche. This makes OEM the best distribution channel for its suppliers in OEM's markets.
Its extensive range of industrial components comprises products in the areas of electrical components, flow technology, installation components, ball bearings and seals, motors, transmissions, brakes and appliance components. The range is constantly evolving with the addition of new products and the replacement or discontinuation of unprofitable products.
The clearly-defined product range that is marketed in each region and the added values created by the organisation form a distinct brand concept. The brand concepts are launched on new geographic markets as they grow in strength. The Group is structured and primarily managed as three market regions;
• Sweden,
• Finland, the Baltic states and China,
• Denmark, Norway, the British Isles and East Central Europe. The objective of this organisation is to consolidate OEM's long-term competitive edge and increase growth outside of Sweden.
OEM's Class B share is listed on NASDAQ Nordic Mid Cap in Stockholm.
Incoming orders, net sales and profit
Incoming orders during the year decreased by 1% to SEK 4,805 million
(4,832). At SEK 859 million, the order book was 21% down on the corresponding date of the prior year.
Net sales reached SEK 5,145 million (4,731), which is a 9% rise on the prior year. This reflects favourable impacts from foreign exchange and business acquisitions of 5% and 1% respectively, an increase of 3% on an organic basis. Sales in 2023 once again reached new record highs. The strongest performance among the Swedish operations was delivered by Telfa and OEM Automatic, the region's largest company. Out of the Finnish operations, OEM Electronics and Hide-a-lite achieved the highest percentage growth. The operations in Slovakia, Hungary and Norway also posted strong growth figures for the year.
Operating profit before amortisation of acquisition-related intangible fixed assets (EBITA) increased 6% during the year to SEK 811 million (763). The increase is predominantly due to the growth in sales which improved the contribution margin. The operating margin before amortisation of acquisition-related intangible fixed assets (EBITA margin) was 15.8% (16.1%).
Profit before tax was SEK 770 million (724) and profit after tax rose 5% to SEK 607 million (576).
The year's profit after tax corresponds to SEK 4.38 (4.15) per share outstanding.
Region Sweden
Sales are conducted under the names of OEM Automatic, OEM Electronics, OEM Motor, Internordic Bearings, Telfa, Elektro Elco, Nexa Trading, Svenska Batteripoolen, Agolux, Ernst Hj Rydahl Bromsbandfabrik and ATC Tape Converting, Lagermetall and Ingemar Liljenberg.
In 2023, net sales rose 8% to SEK 2,958 million (2,745). The acquisition of Lagermetall AB and Ingemar Liljenberg AB boosted net sales by 1%. Foreign exchange movements also boosted net sales by 4%, representing 3% growth on an organic basis. The operations reporting strongest growth are Telfa and OEM Automatic, the region's largest company, whose sales increased by 19% and 15% respectively.
Incoming orders were down 2% to SEK 2,771 million (2,835). Incoming orders were 6% lower than net sales in 2023.
EBITA rose 2% to SEK 518 million (506). The increase in revenue is attributed to increased net sales, in spite of higher costs and a lower gross margin.
Region Finland, the Baltic states and China
Sales are conducted under the names of OEM Automatic, Akkupojat, Hide-a-lite, OEM Electronics, Motor/Bearings and Rauheat.
In 2023, net sales rose 5% to SEK 1,020 million (969). Foreign exchange movements boosted net sales by 7%, representing a 2% decrease on an organic basis. The operations reporting strongest growth are OEM Electronics and Hide-a-Lite, whose sales increased by 15% and 8% respectively. OEM Automatic, the region's largest entity, ended the year at a level comparable with the prior year.
Incoming orders for the region fell 2% to SEK 941 million (963) in 2023. Incoming orders were 8% lower than net sales.
EBITA fell 4% to SEK 131 million (137) in 2023, due to increased costs.
Region Denmark, Norway, the British Isles and East Central Europe Sales are conducted under the names of OEM Automatic, OEM Automatic Klitsø, OEM Electronics and Demesne Electrical.
In 2023, net sales rose 15% to SEK 1,167 million (1,017). At the acquisition date, Unit-Pump A/S in Denmark was merged into OEM Automatic Klitsø A/S. Nets sales were up by a marginal 0.2% as a result of the acquisition and by 7% due to foreign currency movements, leading to an increase of 8% on an organic basis. The best performing operations compared with the prior year are OEM Automatic Slovakia, OEM Automatic Hungary and OEM Automatic Norway, with growth of 33%, 23% and 17% respectively.
Incoming orders rose 6% to SEK 1,092 million (1,034) in 2023. Incoming orders were 6% lower than net sales.
In 2023, EBITA rose 30% to SEK 153 million (118), due to increased net sales.
Profitability and financial position
Return on capital employed was 40.2% (45.1%). Return on equity was 33.9% (38.9%) which exceeds the Group's financial target of 25% through a business cycle. The Group's equity/assets ratio at year-end was 67.9% (56.7%). Shareholders' equity per share calculated on the aggregate number of shares was SEK 14.32 (11.43). Cash and cash equivalents, comprising cash and bank balances, amounted to SEK 233 million (109). The Group's cash and cash equivalents, together with committed undrawn credit facilities, amounted to SEK 783 million (474) at year-end.
in Örebro, Sweden. The company became part of Region Sweden on the acquisition date.
On 1 November 2023, the entire shareholding of the Danish company Unit-Pump A/S was acquired. Unit-Pump is an importer and distributor of pumps and mechanical seals. The company has 3 employees and an annual turnover of approximately DKK 20 million (SEK 31 million). The head office is in Kvistgård, Denmark. The company has been fully integrated into OEM's Danish operations, OEM Automatic Klitsø.
On 1 December 2023, the entire shareholding of Ingemar Liljenberg AB was acquired. Ingemar Liljenberg sells and markets bespoke products for customers, such as cast, punched and processed components for the engineering and electronics industry. The company also has a fixed product range of locks, rails and fittings for wood and steel interiors. The company has 8 employees and an annual turnover of SEK 62 million. The head office is in Vellinge, Sweden. The company became part of Region Sweden on the acquisition date.
A Group-wide programme is in progress aimed at achieving a simpler, more distinct legal Group structure through mergers and voluntary liquidations.
At year end, the headcount was 1,054 (998), an increase of 56 employees. The average number of employees during the year was 1,045, compared with 968 in the previous financial year. Women represent 23% (21%) of the workforce. Absence due to illness stands, on average, at 7 days per person, which is 1 day less than last year. OEM encourages a healthy lifestyle through various forms of exercise and preventive healthcare. The average cost of training per employee is SEK 4,000 (4,000). Further information is provided in Note 5.
Cash flow
Operating cash flow was SEK 791 million (263). The year's cash flow was SEK 126 million (-43) after net investments of SEK -149 million (-153) and amortisation, new loans and paid dividends totalling SEK -515 million (-153).
The Group's gross investment for the year, excluding acquisitions, was SEK 22.0 million (17.9) in machinery and equipment, SEK 23.8 million (0.7) in buildings and land, and SEK 8.5 million (2.8) in other intangible fixed assets comprising software.
Group changes
On 13 October 2023, the entire shareholding of Lagermetall AB was acquired. Lagermetall sells and markets industrial slide bearings and cast bronze for mechanical applications in all industries. The company has 17 employees and an annual turnover of SEK 104 million. The head office is
OEM's results, financial position and strategic position are affected by a number of internal factors over which OEM has control and a number of external factors where the opportunity to influence the chain of events is limited.
The most important risk factors include the economic situation in combination with structural changes, the competitive situation and the dependence on suppliers and customers. The main financial risks are currency risk in purchase transactions and translation risk in net investments in foreign operations. A description of the financial instruments and explanation of how OEM manages the financial risks are given in Note 24.
OEM is affected by the general development of the economy, which is usually measured in terms of GDP growth. The Group operates in a wide range of sectors and geographic areas which lessens the impact of economic fluctuations in specific industries and geographic markets on its business.
OEM is affected by structural changes in the market, for example, customers want fewer suppliers, rapid developments in technology or competition from lower-cost countries.
OEM works actively to increase the value of its product offering, regardless of customer group. This has clearly contributed to the Group's performance and to the fact that it continues to be a priority supplier for many customers. By working alongside the customers, it is possible to capture trends and know when it is commercially justifiable to enter a new product area in order to keep abreast of advances in technology. OEM offers a high level of service and expert technical advice to offset the effects of competition from lower-cost countries. OEM also strives to establish close links with customers by becoming involved during planning and development stages when OEM's employees are able to help customers by providing expert input for different processes
Its dependence on individual suppliers is one of the key operational risks to which a single subsidiary can be exposed. In order to minimise this risk, the subsidiaries work close to their suppliers in order to create strong relationships on several levels. Furthermore, the majority of the suppliers are represented on several markets, which strengthens the relationships. The relationships are based on long-term, close collaborative partnerships. The
Group has more than 400 suppliers in total. No supplier accounts for more than 3% of total Group sales. The expiration and addition of a number of supplier agreements each year is a normal part of the business.
OEM has a broad customer structure, with approximately 30,000 customers spread across several industrial segments and geographic markets. No customer accounts for more than 4% of total Group sales, which remains unchanged from last year.
Restructuring and consolidations in the industrial trading sector are continuously changing the competitive situation. Economies of scale can lead to a price squeeze, but OEM's strategy includes reaching market-leading positions with a portfolio of products and services where the price is not the sole determining factor.
The impact of the war in Ukraine on the OEM Group
Earlier risks associated with the war in Ukraine are no longer considered a risk factor.
Events after the close of the reporting period
There are no significant events to report after the close of the reporting period.
The most important tasks for the Group are to focus on growth and to continue improving the profitability of existing operations. Added to this are the sales and earnings resulting from successful acquisitions.
The Group continues with the aim to increase its sales share outside of Sweden.
OEM's objective is to achieve a good return on shareholders' equity with limited financial risk during stable growth.
The targets for one business cycle are:
• at least 10 % annual sales growth,
• a minimum EBITA margin of 12% ,
• at least 25% return on equity,
• the debt-to-equity ratio must not exceed 100%.
OEM is well placed for further expansion with its strong market position, financial performance and organisation. However, amid the current global state of affairs, there is general uncertainty about economic developments. The Group has not issued a forecast for 2024.
OEM conducts research and development activities of its own on a limited scale. Development is mainly conducted by the suppliers themselves using market demand data provided by the companies.
In 2023, OEM had a Swedish subsidiary whose operations require licensing or registration under the Swedish Environmental Code.
The operations requiring registration represent an insignificant portion of the company's total operations. None of the Group's companies are involved in any environment-related disputes. OEM's focus on trade means that the greatest environmental impact comes from transportation, environmentally harmful substances, printed materials, packaging materials and heating. OEM takes a structured approach in all of these areas to find the best environmental solutions and support development initiatives in these areas.
The OEM Group's environmental policy dictates continuous efforts to minimise its external environmental impact in the short term and long term.
In compliance with Chapter 6, Section 11 of the Swedish Annual Accounts Act (ÅRL), the company has decided to publish its sustainability report, which is required by law, separately from its Annual Report. The sustainability report is available for viewing at www.oem.se.
The Parent Company is to be an active owner and develop the subsidiaries. In addition to clear management-by-objectives, this means contributing expertise and resources in the fields of IT, financial control, HR administration, market communication, and quality and environmental control.
The Parent Company's net sales were SEK 95 million (91). Net sales relate entirely to services to subsidiary companies. Profit before year-end appropriations and tax amounted to SEK 194 million (153).
With regard to non-financial information, the Group's information also includes the Parent Company, where applicable. The financial position of the Parent Company is dependent on the financial position and growth of the subsidiaries. The Parent Company is therefore indirectly affected by the risks that are described in the section Risks and Risk Management
The policies for remuneration of senior executives adopted at the 2023 Annual General Meeting are presented in Note 5.
The remuneration of the Chairman and members of the Board of Directors is paid in accordance with the resolution of the Annual General Meeting. The chairperson of the Audit Committee will receive remuneration of SEK 60,000. No other special fees are paid for work on committees.
The Board proposes that the 2024 Annual General Meeting adopts the following guidelines for remuneration of senior executives within the OEM Group. The guidelines relate to remuneration of the Managing Director, Group management and other managers who report directly to the Managing Director.
OEM's vision is that the company shall be a leading technology trading group in industrial components and systems in selected markets in Northern, Central and East Central Europe. To realise this vision, the company has defined five strategic areas; growth, product range, marketing activities, logistics, and employees and leaders. These are important to the company's future development and success and to the achievement of its financial targets. It is important that OEM has senior executives with a focus on business acumen, a strong commitment to the company, and a sustainable leadership that promotes the long-term interests of the company. The level of remuneration of senior executives shall enable the company to retain qualified leaders within the organisation in the long term and also ensure it is able to recruit qualified leaders both externally and internally.
Market-competitive salaries and other remuneration terms shall apply for senior executives. Share-related remuneration, so-called incentive schemes, are to be decided by the Annual General Meeting.
Variable remuneration may be provided, capped at the equivalent of eight monthly salaries. The variable remuneration shall be linked to the company's financial targets and based on performance during a calendar year.
Senior executives shall have premium-based pension schemes, capped at 30% of fixed pay.
The notice period is set at a maximum of 24 months' notice from the company and involves the obligation to work during the period of notice. Employment agreements shall not contain provisions for severance pay.
The Board of Directors may waive these guidelines in individual instances should there be special reasons for doing so. Any deviation from these guidelines by the Board of Directors shall be disclosed in the remuneration report presented at the next Annual General Meeting.
The share capital of the company consists of 139,015,854 shares, which are 28,462,176 Class A shares and 110,553,678 Class B shares. One Class A share entitles its holder to ten voting rights and one Class B share to one voting right. The par value per share is SEK 0.28.
With the objective to improve the Group's return on shareholder's equity and earnings per share, the Board of Directors obtains shareholder approval at the Annual General Meeting to grant OEM International AB the authority to repurchase its own shares. The repurchase mandate granted by the General Meeting is restricted to a maximum of 10% of the shares, which is 13,901,585 shares.
In 2011, the company repurchased 185,541 shares at an average price of SEK 17.75. No shares were repurchased in the 2012-2023 period. As at 31 December 2023, the company had a total shareholding of 371,082 shares. The holding corresponds to 0.3% of the total number of shares.
The 2024 Annual General Meeting will propose that shareholders resolve to renew the mandate for the repurchase of up to 10% of the number of shares.
At the General Meeting on 18 April 2023, shareholders voted in favour of issuing 200,000 call options that entitle the holder to acquire one repurchased Class B share during the period 2 March 2026 to 15 June 2026, both dates inclusive. A total of 153,500 call options were subscribed for, of which 31,000 are held by senior executives of the Group. The call price of the subscribed option is SEK 122.00. Further information is provided in Note 26.
The Board of Directors is appointed by the Annual General Meeting. The Articles of Association contain a preemption clause which states that if Class A shares are transferred from one shareholder to another shareholder in the company, or to someone not previously a shareholder in the company, the shares shall be offered immediately to the other holders of Class A shares for redemption through a written application to the company's Board of Directors. The Articles of Association also include a conversion provision enabling holders of Class A shares to convert all or part of their holding of Class A shares into Class B shares. If the company decides to issue new Class A and Class B shares through cash issue or set-off, holders of Class A and B shares shall have preferential rights to subscribe for new shares of the same type.
After the balance sheet date, the Board has proposed a dividend of SEK 1.75 (1.50) per share. The Board aims to propose a reasonable dividend of profits to the shareholders, by taking into account the financial position, the tax situation and any need for acquisitions or investments in the operation. Retained earnings in the Parent Company total SEK 829.6 million. The Board recommends a SEK 243.3 million dividend and that SEK 586.3 million be carried forward.
OEM International AB (the company) applies the Swedish Code of Corporate Governance (the Code) in accordance with the NASDAQ Stockholm's rules for issuers. The Code is aimed at creating good prerequisites for an active and conscientious owner role and constitutes an element in the self-regulation of Swedish enterprise. It is based on the "comply or explain" rule, which means that non-compliance with a term of the Code is not a breach provided there is an acceptable reason that can be explained. OEM International has noted a non-conformance with the rules of the Code concerning the Nomination Committee. The non-conformance is explained in detail under the heading Nomination Committee.
The purpose of corporate governance is to create a clear division of roles and responsibilities between the owners, the Board of Directors and the executive management. Corporate governance in OEM is based on the Swedish Companies Act and other legislation and regulations, the rules applicable to companies listed on the stock exchange, the Articles of Association of the company, the internal governing instruments of the Board of Directors, the Swedish Code of Corporate Governance and other internal guidelines and regulations.
OEM International AB is a public company and was listed on the Stockholm Stock Exchange in December 1983. OEM International AB had 8,245 shareholders at the end of 2023. The ten largest shareholders controlled 70% of the share capital and 89% of the voting rights at year-end. The following shareholders had, directly or indirectly, shareholdings representing at least one-tenth of the number of voting rights for all shares in the company: Orvaus AB 27.7%, Siv Franzén 21.3% and Agne Svenberg 18.3%.
The Articles of Association stipulate that OEM International AB is a public company whose business is to "engage in sales of automatic components and carry on any and all activities compatible therewith".
The share capital amounts to SEK 38,615,515 and the number of shares to 139,015,854 divided into 28,462,176 Class A shares which carry 10 voting rights, and
110,553,678 Class B shares which carry one voting right each.
The company's Board of Directors is to comprise not less than four and not more than seven members. The company is to have at least one auditor appointed by the Annual General Meeting and a deputy auditor if the elected auditor is not an auditing firm.
Notice of annual general meetings and extraordinary general meetings convened for the purpose of amending Articles of Association must be issued between six and four weeks before the meeting and resolutions must be supported by shareholders with at least two-thirds of both the voting rights and the shares represented at the meeting. Notice of an extraordinary general meeting convened for other purposes shall be issued no later than three weeks prior to the meeting. Notice of an annual general meeting shall be published in the "Post- och Inrikes Tidningar" newspaper and on the company's website.
It must be announced in Svenska Dagbladet that notice has been issued.
No limitation to the number of voting rights for represented shares applies to voting at the general meeting.
There is a pre-emptive clause regarding the A Class shares and a priority clause in connection with a cash or set-off issue. The current Articles of Association were adopted at the 2023 Annual General Meeting and can be viewed on the company's website, www.oem.se (see under For Investors/ Corporate Governance/Articles of Association).
The Annual General Meeting is the highest decision-making body in OEM International AB where the shareholders exercise their voting rights. The Annual General Meeting passes resolutions concerning the adoption of the Statement of Income for the Group, the Statement of Comprehensive Income for the Group, the Statement of Financial Position for the Group and the Income Statement and Balance Sheet for the Parent Company, distribution of dividends, election of the Board of Directors and, where applicable, election of auditors, remuneration of Board members and other
senior executives, remuneration of auditors and other business in accordance with the Swedish Companies Act and the Articles of Association. The Annual General Meeting is to be held in the municipality of Tranås within six months of the end of the financial year. All shareholders entered in the share register prior to the meeting who have registered their participation are entitled to participate and vote for their total shareholding.
In order to be able to exercise their voting rights at the Annual General Meeting, shareholders who have registered their shares in the name of an authorised agent must temporarily re-register their shares in their own name in accordance with what follows from the notice to the Annual General Meeting. Shareholders can be represented by agents. Minutes of the Annual General Meeting are available for viewing on the company's website, www.oem.se (see under For Investors/Corporate Governance/ Annual General Meeting).
Shareholders who represented 70.9% of the total number of shares and 89.8% of the voting rights attended the 2023 Annual General Meeting held on 18 April 2023. Petter Stillström was appointed to chair the Annual General Meeting. The Annual Report and the Auditor's Report were presented at the Meeting. In connection therewith, the Chairman of the Board Petter Stillström submitted information about the work of the Board. Petter Stillström, member of the Audit Committee, reported on the work of the Audit Committee and its cooperation with the auditors. The company's Managing Director and Chief Executive Officer, Jörgen Zahlin, presented comments on the Group's operations, the 2022 financial year and developments during the first quarter of 2023.
The 2023 Annual General Meeting decided:
• to approve a dividend of SEK 1.50 per share.
• to elect Petter Stillström, Ulf Barkman, Mattias Franzén, Richard Pantzar, Jörgen Rosengren, Per Svenberg and Åsa Söderström Winberg as members of the Board of Directors
• to elect Petter Stillström as Chairman of the Board
• to adopt the proposal of the Nomination Committee that the Nomination Committee should be made up of representatives of not less than three and no more than four of the largest shareholders and that the Chairman of the Board should act as Chairman of the Nomination Committee
• to adopt the proposal of the Board of Directors that remuneration received by senior executives from OEM International AB is mainly comprised of fixed and variable components. The remuneration shall be market-competitive and the variable amount shall be capped at eight monthly salaries. The company's management shall have market-competitive, premium-based pension schemes, capped at 30% of fixed pay.
• to be allowed to issue up to 7,000,000 new Class B shares in connection with business combinations, in line with the proposal of the Board of Directors.
• to adopt the proposal of the Board of Directors to repurchase a maximum of 10% of the company's shares.
• to adopt the proposal of the Board of Directors to issue call options on repurchased shares and the transfer of repurchased shares to executives.
The 2024 Annual General Meeting will be held on 23 April 2024 in Tranås.
At the Annual General Meeting held on 18 April 2023, it was decided that the Nomination Committee shall comprise one representative from each one of no less than three and no more than four of the company's largest shareholders and the Chairman of the Board, unless he/she is a member as a shareholder representative. If a shareholder does not exercise his/her right to appoint a member, the next largest shareholder in terms of voting rights is entitled to appoint a member in the Nomination Committee. The names of the members and the names of the shareholders they represent shall be published at least six months before the 2024 Annual General Meeting and shall be based on the known number of votes immediately before publication. The term of office of the Nomination Committee shall run until a new Nomination Committee is appointed. The Chairman of the Nomination Committee shall be the Chairman of the Board.
Should there be any significant changes in the company's ownership structure after the appointment of the Nomination Committee, the composition of the Nomination Committee shall also be changed in line with
the principles above. Shareholders who appointed a representative to be a member of the Nomination Committee shall be entitled to dismiss such a member and appoint a new one and also appoint a new representative if the member appointed by the shareholder chooses to withdraw from the Nomination Committee. Changes to the composition of the Nomination Committee shall be published as soon as such changes are made. The composition of the Nomination Committee was published on 16 October 2023. The composition of the Nomination Committee is available for viewing on OEM's website, www.oem.se, under For Investors/Corporate Governance/ Nomination Committee. The Nomination Committee shall prepare proposals for the following items of business to be presented for resolution at the 2024 Annual General Meeting:
• proposal for a Chairman for the Meeting
• proposal for members of the Board of Directors
• proposal for Chairman of the Board of Directors
• proposal for remuneration of the Board of Directors
• proposal for remuneration for any committee work
• proposal for auditors
• proposal for auditors' fees
• proposal for a resolution regarding the Nomination Committee
The Nomination Committee shall discharge its duties as required by the Swedish Code of Corporate Governance and may, if necessary, take independent professional advice at the company's expense in the furtherance of its work.
The Nomination Committee for the 2024 Annual General Meeting is composed of:
• Petter Stillström (AB Traction), Chair
• Richard Pantzar (Orvaus AB)
• Mattias Franzén (Siv Franzén)
• Agne Svenberg
Ongoing dialogue is conducted within the Nomination Committee which held a minuted meeting where it acquainted itself with the assessment of the work of the Board of Directors during the past year and it discussed the composition of the Board of Directors.
The Nomination Committee's proposals to the Annual General Meeting will be presented in the notice of the Annual General Meeting and on the company's website.
The composition of the Nomination Committee above deviates from the regulations of the Code, which stipulate that the majority are members of the Board, that not more than one of the Board Members on the Committee may be dependent on large shareholders and that a Board Member should not be a Chairman of the Nomination Committee. It is deemed reasonable for a company of this size to have a Nomination Committee that is represented by the largest shareholders and that these also serve as Board members.
The Articles of Association require that the Board of Directors shall comprise not less than four and not more than seven members elected by the Annual General Meeting for the period until the end of the next Annual General Meeting. Since the 2023 Annual General Meeting, the Board has consisted of the following members, all of them elected by the Annual General Meeting: Petter Stillström (Chair), Ulf Barkman, Mattias Franzén, Richard Pantzar, Jörgen Rosengren, Per Svenberg and Åsa Söderström Winberg. All Board members are independent from the company and the company's management. Board members Ulf Barkman, Jörgen Rosengren and Åsa Söderström Winberg are independent from the company and the company's management, and also from the company's major shareholders. Additional information about the members of the Board elected by the General Meeting is given in the section about the Board of Directors on page 40 in this Annual Report and on the company's website, under For Investors/Corporate Governance/Board of Directors.
The Nomination Committee takes age, gender, education, professional background and other aspects of diversity into consideration when nominating candidates to fill Board vacancies. The composition of the Board should be appropriate for the company’s business operations, stage of development and conditions in general, characterised by diversity and a breadth of skills, experience and backgrounds among its members. The above provides the Nomination Committee with a good basis on which to appraise whether the composition of the Board is satisfactory and whether the requirement for skills, breadth and experience has been met.
It is the duty of the Chairman of the Board, Petter Stillström, who was re-elected as Chair at the 2023 Annual General Meeting, to ensure that the work of the Board is conducted efficiently and that the Board discharges its duties as required by the Swedish Companies Act, other legislation and regulations, rules applicable to companies listed on the stock exchange (including the Code) and the Board’s internal governing instruments. It is the Chairman’s task to ensure that the Board continuously updates and deepens its knowledge about the company and receives satisfactory data and decision-making information for its work, to establish the agenda for the meetings of the Board in consultation with the Managing Director, to verify that the decisions of the Board are implemented and ensure that the work of the Board is assessed annually. The Chairman of the Board represents the company in ownership issues.
Each year, the Board establishes written rules of procedure that regulate the Board’s work and its mutual division of responsibilities, including its committees, the decision-making procedure in the Board, the Board’s meeting procedure and the Chairman’s duties. The Board has also issued an instruction for the Managing Director, which regulates his duties and reporting obligation to the Board of Directors. As necessary, the Board also reviews and approves policies concerning the Group, such as the treasury policy. The Board monitors the work of the Managing Director by regularly reviewing operations during the year. It is responsible for purposefully structuring the organisation, and the procedures and guidelines for the management of the company's business. It is also responsible for ensuring that there is a satisfactory system of internal control. The Board is also responsible for the development and follow-up of the company's strategies, decisions concerning acquisition and sale of operations, major investments, appointments and remuneration of the Managing Director and other senior executives as stated in the guidelines adopted by the Annual General Meeting. The Board of Directors and the Managing Director present the annual report to the Annual General Meeting.
In accordance with the adopted rules of procedure, the Board of Directors holds at least six ordinary meetings per year plus an inaugural meeting after the Annual General Meeting and whenever necessitated by the situation.
During 2023, the Board had a total of 9 meetings, including the inaugural meeting.
The Board Members attended all Board meetings with the exception of Richard Pantzar on one occasion. When unable to attend, the member has presented opinions and views on items of business to the Chairman of the Board prior to the meeting. All resolutions have been passed unanimously by the Board of Directors.
The secretary of the Board is the company's CFO. Other company employees take part in the meetings of the Board in connection with the presentation of specific issues or when otherwise deemed appropriate.
The work of the Board during the year has covered a range of matters, including issues concerning the strategic development of the Group, operating activities, trends in earnings and profits, business combinations, purchase of properties, organisation, the Group's financial position and funding of the Group's capital structure.
The work of the Board is subject to an annual assessment. This is done by each Board member rating a number of relevant issues with the opportunity to provide comments. The results are compiled and presented to the Nomination Committee.
The remuneration of the members of the Board elected by the Annual
General Meeting is decided by the Meeting in accordance with the proposal of the Nomination Committee. The 2023 Annual General Meeting approved the proposal that fees of SEK 500,000 be paid to the Chairman of the Board and SEK 250,000 to each of the Board members elected at the Meeting, for the period until the 2024 Annual General Meeting. The total remuneration of Board members, in accordance with the approval of the Annual General Meeting, is thus SEK 2,000,000. The chairperson of the Audit Committee will receive remuneration of SEK 60,000. No additional remuneration has been paid to any Board member.
The Board has appointed a Remuneration Committee, which consists of the Chair, Petter Stillström, and the Board member Ulf Barkman. The Remuneration Committee prepares "the Board's proposals for policies for senior executives' remuneration" and the application of these. The proposal is discussed by the Board and is subsequently presented to the Annual General Meeting for approval. Based on the resolution of the Annual General Meeting, the Board decides on the remuneration of the Managing Director. Based on the proposal of the Managing Director, the Remuneration Committee passes a resolution on the remuneration of other members of the Group's executive team. The Board is informed of the decisions of the Remuneration Committee. Salaries and other terms of appointment for the Group's executive team shall be set at competitive levels. In addition to base salary, members of the Group's executive team may also receive variable remuneration, which is capped at 8 monthly salaries (8 monthly salaries). Senior executives in the OEM Group shall have market-competitive, premium-based pension schemes, capped at 30% of fixed remuneration. The pension scheme level is the same as for 2022. All share-related incentive schemes are to be decided by the Annual General Meeting. The maximum term of notice is 24 months and shall also include the obligation to work during the term of notice.
The Remuneration Committee met once in the year to review and approve the above policy proposals.
Guidelines for the remuneration of senior executives will be proposed for adoption at the 2024 Annual General Meeting and are presented on page 35 of this report.
During the year, the Board has had a special Audit Committee consisting of Chairman Ulf Barkman and Petter Stillström.
The Audit Committee shall, without it otherwise affecting the Board's responsibilities and duties, oversee the company's financial reporting and the efficiency of the company's internal control activities and risk management relating to the financial reporting, keep itself informed about the audit of the Annual Report and consolidated financial statements, examine and monitor the objectivity and independence of the auditor and specifically pre-approve any services that the auditor provides the company with other than audit-related services. The Audit Committee evaluates the audit work that has been carried out and informs the company's Nomination Committee of the results of the evaluation and assists the Nomination Committee in preparing proposals for auditors and remuneration of the auditors' work.
The Audit Committee has convened on four occasions and has met with an external auditor on three of them. The Board and the Audit Committee have held a review meeting with and received a report from the company's external auditor in connection with the Board meeting in February 2024 at which the Board approved the annual financial statements.
The Managing Director, Jörgen Zahlin, manages the operations in accordance with the Swedish Companies Act, other acts and regulations, the rules applicable to companies listed on the stock exchange, the Articles of Association of the company, the internal governing instruments of the Board of Directors and the goals and strategies set by the Board. In consultation with the Chairman of the Board, the Managing Director prepares the necessary information and basis for decisions prior to the Board meetings, presents the items of business and justifies proposals for resolutions. The Managing Director leads the work of the Group's executive team and makes decisions in consultation with the members of the executive team. In 2023, the members were Jörgen Zahlin, Andreas Andersson, Johan Broman, Jens Kjellsson, Urban Malm, Carl Reuthammar and Marko Salovaara.
The Group's executive team holds regular business reviews under the leadership of the Managing Director. The Managing Director and members of the Group's executive team are presented on page 41 of this Annual Report and on the company's website (under About OEM/Senior Executives).
As required by the Articles of Association, the company must have at least one auditor appointed by the Annual General Meeting and, if the auditor is not an auditing firm, it must also have a deputy auditor. The company's auditors work according to an audit plan and report their observations to company management teams, the Group's executive team, the Audit Committee and the Board of Directors both during the course of the audit and in connection with the adoption of the annual financial statements. Internal procedures and control systems are reviewed as appropriate. A final review of the annual financial statements and the Annual Report is carried out in January and February. A review is conducted in the interim report for the third quarter. An account of the remuneration of the auditors, including the fees for consulting services, is presented in Note 6. The auditors are required to continually assess their independence before deciding whether to undertake an engagement to provide consulting services.
An account of the audit is reported to the shareholders in the form of an auditor's report and other opinions, which constitute a recommendation to the shareholders on various items of business for resolution at the annual general meeting. The Auditor's Report contains proposals for adoption of the Income Statement and Balance Sheet for the Parent Company and the Statement of Comprehensive Income and the Statement of Financial Position for the Group, the appropriation of the company's profit and the discharge of the members of the Board and the Managing Director from liability.
The audit work includes a review of compliance with the Articles of Association, the Swedish Companies Act and the Annual Accounts Act, the International Financial Reporting Standards (IFRS), issues related to measurement of items recognised in the Statement of Financial Position/ Balance Sheet for the Group/the Parent Company.
The company's auditors meet with the Audit Committee three times a year and once a year with the Board. The company's auditors also attend the Annual General Meeting to explain and give opinions on the audit work.
At the 2023 Annual General Meeting, Öhrlings PricewaterhouseCoopers AB was appointed as the company's auditor until the conclusion of the 2023 Annual General Meeting. Frida Wengbrand was appointed as the principal auditor. Öhrlings PricewaterhouseCoopers AB performs the audit of OEM International AB and most of the subsidiaries.
As required by the Swedish Annual Accounts Act, the Board of Directors must annually submit a presentation of the most important elements of the company's system for internal control and risk management with regard to its financial reporting. Pursuant to the Swedish Companies Act, the Board of Directors is responsible for internal control. This responsibility includes an annual assessment of the financial reporting submitted to the Board and placement of requirements to its contents and presentation in order to ensure the quality of the reporting. This requirement means that the financial reporting must be fit for its purpose and appropriate and apply the applicable accounting rules, acts and regulations and any other requirements placed on listed companies. The Board of Directors is responsible for ensuring that there is an adequate system for internal control, which covers all essential risks of errors in financial reporting. OEM's system for internal control comprises the control environment, risk assessment, control activities, information, communication and follow-up.
OEM builds and organises its operations on decentralised profit and budget responsibilities. The basis for internal control in a decentralised organisation is a firmly-established process, aimed at defining goals and strategies for each organisation. Defined decision-making channels, powers and responsibilities are communicated through internal instructions and through guidelines and policies adopted by the Board of Directors. These documents set out the division of responsibilities and duties between the Board of Directors and the Managing Director and within
the operational activities. They also include a financial policy, accounting manual for economic and financial reporting and instructions for each closing of the books. A Group-wide reporting system is used for the Group's year-end procedures.
OEM has established procedures for handling risks that are deemed by the Board and the company's management to be essential for the internal control regarding financial reporting. The Group's exposure to a number of different market and customer segments and the division of its operations into some 30 companies ensures a significant spread of risk. The risk assessment is carried out based on the Group's Statement of Financial Position and Statement of Comprehensive Income in order to identify the risk for significant errors. The greatest risks for the OEM Group as a whole are related to inventories and trade receivables.
OEM has established a number of control activities based on risk assessments that have been carried out. The activities are both preventive and ascertaining and include transaction-related checks, such as rules regarding authorisations and investments, and clear payment procedures, as well as analytical checks performed by the Group's controller organisation and central financial function. There are also various control activities related to the management of the purchase, logistics and sales processes. Controllers and financial managers on all levels in the Group have a key role with regard to integrity, competence and ability to create the environment that is required to achieve transparent and fair financial reporting. An important overall control activity is the monthly performance follow-up, which is carried out via the internal reporting system and which the Board of Directors analyses and comments on as part of its internal work. This involves comparing performance against set targets and previous results and reviewing a number of key ratios. Each company in the Group has an active Board where the majority of the companies have someone from the Group's management team as chairperson. The Group's executive team makes regular visits to the subsidiaries that are subject to financial follow-up.
The internal information and external communications are regulated at an overall level.
Relevant steering documents and instructions are available on the Group's intranet.
The Group has a whistleblowing procedure. Employees can anonymously contact an independent third party and report any actual or suspected breaches of the law, company policies, etc. All reports are logged and a summary of the concerns and the actions taken are regularly reported to the Board of Directors.
The Board of Directors receives comments from the Managing Director concerning the state of the business and the development of the operations on a monthly basis. The Board of Directors also deals with all quarterly financial statements, as well as the annual report prior to their publication.
The financial situation is discussed at each Board meeting. The members of the Board then have an opportunity to pose questions to the company's management.
The company's auditors attend Audit Committee meetings three times a year and Board meetings once a year and present their observations. The members of the Board then have an opportunity to pose questions. Every year, the Board takes a position on significant risk areas and assesses the internal control.
Furthermore, OEM's management continuously assesses the internal control regarding financial reporting, above all, through own analysis, by asking questions and taking part in the work of the control function.
The company and the Group have a relatively simple legal and operating structure and efficient management and internal control systems. Regular contact with the company's auditors is one of the ways in which the Board follows up the various Group companies' assessments of the internal control process. The Board has therefore decided not to have a separate internal audit.

Born in 1972.
Board Chairman since 2017 and Board member since 2010.
Master of Economics.
Not employed by OEM.
CEO and major shareholder in AB Traction.
Other appointments: Chairman of the Board in Nilörngruppen AB and Softronic AB.
Board member of BE Group AB, Hifab Group AB and AB Traction incl. group companies.
Independence: Independent of the company and the company's management, but not independent of the company's major shareholders.
Number of shares: 3,816,000 OEM Class A (via AB Traction.)

Born in 1968.
Board member since 2019.
M.Sc. Engineering.
Not employed by OEM.
Other appointments: Managing Director of I&B Medical AB. Chairman of the Board of MAZE Holding i Tranås AB and Padel Tranås AB.
Board member of Elektro Elco AB, OEM Finland OY and IB Medical AB.
Independence: Independent of the company and the company's management, but not independent of the company's major shareholders.
Number of shares: 546,996 OEM Class B (incl. related parties)

Born in: 1967.
Board member since 2017.
M.Sc. Engineering.
Not employed by OEM.
Other appointments: Managing Director of Gränges.
Independence: Independent of the company and the company's management, and also independent of the company's major shareholders.
Number of shares: 9,000 OEM Class B

Born in 1957.
Board member since 2015.
MBA.
Not employed by OEM.
Board member of Skanska AB, Currentum Group and FIBO AS.
Independence: Independent of the company and the company's management, and also independent of the company's major shareholders.
Number of shares: 11,000 OEM Class B (incl. related parties)


Born in: 1957.
Board member since 1997.
MBA.
Not employed by OEM.
Independence: Independent of the company and the company's management, and also independent of the company's major shareholders.
Number of shares: 252,000 OEM Class B
Born in 1983.
Board member since 2019.
Masters degree in Business Administration (MBA).
Not employed by OEM.
Managing Director of Orvaus AB, board member of Orvaus AB, Vinterfors Invest AB. Managing Director and board member of Orvaus Nötvalen AB.
Independence: Independent of the company and the company's management, but not independent of the company's major shareholders.
Number of shares: 9,763,920 OEM
Class A and 11,693,286 OEM Class B (via Orvaus AB)
Born in 1969.
Board member since 2021.
Masters degree in Business Administration (MBA).
Not employed by OEM.
Other appointments: Owner and board member of Personality Gym AB. Board member of ISP Innovative Sports Products AB.
Owner and board member of Dozer IT & kommunikation AB.
Independence: Independent of the company and the company's management, but not independent of the company's major shareholders.
Number of shares: 580,000 OEM Class B (incl. related parties).
Shareholdings in OEM International AB are stated as they stand on 31 December 2023 and include any related party holdings of natural persons or legal entities. Petter Stillström Ulf Barkman Mattias Franzén Richard Pantzar Jörgen Rosengren Per Svenberg
Born in 1964.
Engineer.
Managing Director of OEM International AB since 1 March 2000.
Managing Director and CEO since 1 January 2002.
Group employee since 1985.
Other appointments: Chairman of the Board in BE Group AB.
Number of shares: 238,992 OEM Class B
Number of call options: 18,000

Born in 1977.
Business Director.
Group employee since 1997.
Number of shares: 10,836 OEM Class B (incl. related parties)
Number of call options: 9,000

Born in 1962.
Managing Director of OEM Electronics AB.
Group employee since 1983.
Number of shares: 14,400 OEM Class B (incl. related parties)
Number of call options: 7,000

Born in 1976.
Managing Director of OEM Finland Oy.
Group employee since 2002.
Number of shares: 100 OEM Class B
Number of call options: 9,000

Born in 1976.
Finance Director.
Group employee since 2006.
Number of shares: 18,240 OEM Class B (incl. related parties)
Number of call options: 12,000

Born in 1968.
Managing Director of OEM Automatic AB.
Group employee since 1990.
Number of shares: 71,751 OEM Class B (incl. related parties)
Number of call options: 6,000

Born in 1977.
Managing Director of Elektro Elco AB.
Group employee since 2018.
Number of shares: 0
Number of call options: 12,000
* No effects of dilution present.
* Equity attributable to Parent Company shareholders.
* Comprehensive income for the year is equal to profit for the year.
Proposed dividend, SEK 1.75 per share
* Comprehensive income for the year is equal to profit for the year.
The consolidated financial statements have been prepared in accordance with the International Financial Reporting Standards (IFRS) issued by the International Accounting Standards Board (IASB) and statements concerning interpretation published by the International Financial Reporting Interpretations Committee (IFRIC), as approved by the European Union. Furthermore, the Group has applied the Swedish Financial Accounting Standards Council's recommendation RFR 1 (Supplementary Accounting Regulations for Groups).
The accounting policies adopted for the Parent Company are the same as those used for the Group, except in the cases specified below in the section "Accounting Policies of the Parent Company".
The Parent Company's functional currency is the Swedish krona (SEK), which is also the official reporting currency for the Parent Company and the Group. This means that the financial statements are presented in Swedish krona. All amounts are rounded off to the nearest million with one decimal, unless otherwise stated.
Assets and liabilities are stated at historical cost, except derivative instruments and contingent considerations which are measured at fair value.
Fixed assets and non-current liabilities consist of amounts that can be expected to be recovered or paid more than twelve months after the balance sheet date. Current assets and current liabilities consist of amounts expected to be recovered or paid within twelve months from the balance sheet date.
The preparation of financial statements requires management to make judgements, estimates and assumptions that affect the application of policies and reported amounts of assets and liabilities, income and expenses. Estimates and assumptions are based on historical experience and other factors that are believed to be reasonable and relevant under the circumstances. Estimates and assumptions are reviewed on a regular basis and are compared to actual results. Critical estimates and assumptions are presented in Note 29.
The consolidated accounting policies outlined below have been applied consistently throughout the periods reported in the Group's financial statements, unless otherwise stipulated below.
None of the amendments to standards that are effective from 1 January 2023 have had any material impact on the Group's financial statements.
A number of new standards and interpretations become effective for the financial year commencing 1 January 2024 and have not been applied in the preparation of these financial statements. None of these are expected to have any material impact on the Group's financial statements.
An operating segment is a component of the Group that engages in business activities from which it may earn revenues and incur expenses and whose operating results are reviewed regularly by the Group's executive team. Further details about the grouping and presentation of operating segments are provided in Note 2.
A subsidiary is an entity over which OEM International AB holds a direct or indirect controlling interest. Control exists when the Parent Company has power over the investee, either directly or indirectly, when it is exposed, or
has rights, to variable returns from its involvement with the investee and has the ability to affect those returns through its power over the investee.
Business combinations are recognised in accordance with the acquisition method. The method means that the acquisition of a subsidiary is regarded as a transaction through which the Group indirectly acquires the subsidiary's assets and assumes its liabilities.
Goodwill in business combinations is calculated as the sum total of the consideration transferred minus the fair value of the subsidiary's identifiable assets and assumed liabilities. A negative difference is recognised directly in the profit or loss for the year. Transaction costs in connection with business combinations are expensed at the time of acquisition.
Contingent consideration in acquisitions is measured at fair value both at the acquisition date and continuously afterwards; any and all changes in value are recognised in profit or loss.
The financial statements of the subsidiaries are included in the consolidated financial statements from the effective date of acquisition until the day that control ceases.
All inter-company receivables and liabilities, income or expenses, and unrealised gains or losses arising from inter-company transactions between Group companies are eliminated in their entirety when preparing the consolidated financial statements.
Transactions in foreign currencies are translated to the functional currency at the exchange rate prevailing on the date of the transaction. Functional currency is the currency that applies in the primary economic environments in which the Group companies operate. Monetary assets and liabilities denominated in foreign currencies are retranslated to the functional currency at the exchange rate prevailing on balance sheet date. Exchange rate differences resulting from translations are reported in the profit or loss for the year. Non-monetary assets and liabilities reported at their historical acquisition costs are translated at the exchange rate prevailing on the date of the transaction.
Assets and liabilities in foreign operations, including goodwill and other residual values in the corporate fair value adjustments, are translated from the foreign entities functional currency to the consolidated reporting currency, Swedish kronor (SEK), at the exchange rate prevailing on the balance sheet date. Income and expense in foreign entities are translated to Swedish kronor (SEK) at an average rate that represents an approximation of the rates that applied when each transaction took place. Exchange differences arising when translating currency of foreign operations are recognised in other comprehensive income and are accumulated in a separate component of shareholders' equity that is referred to as a translation reserve. When a foreign entity is divested, the accumulated translation differences attributable to the entity are realised and reclassified from the translation reserve of the shareholders' equity to the profit or loss for the year.
The Group's revenues come from the sale of goods for resale, which is recognised when control of the goods is passed to the buyer. The revenue is recognised based on the amount specified in the contract with the customer and the sold quantity. The outcome of agreed volume discounts/ rebates and market contributions is estimated and reduces the revenue
at the time of sale and is included in accrued expenses. The performance obligations of the Group are considered to be satisfied when control of the good is transferred to the customer.
When contracts allow customers to return goods, revenue is recognised only when it is highly probable that there will not be a significant reversal in the cumulative amount of revenue. Assessment of expected returns are based on past data for specific customers and goods. Expected returns are recognised as a reduction in revenue and as a refund liability, and the cost of goods associated with the returns is reduced and an asset equivalent to the right to recover the goods returned is recognised.
The characteristics of and the point in time for satisfaction of the performance obligations including significant payment terms
Control of the goods is usually transferred to the customer when the goods are sent from the Group's warehouses or when the goods have been delivered, depending on the terms of the contract. Invoices are generated at this point in time. The due date is normally 30 to 60 days from the invoice date.
Revenue recognition
Revenue is recognised when the goods have been delivered and the control of the goods has been transferred
Operating costs and finance income and expense
Leases
The minimum lease fees are allocated as interest expense and amortisation for the outstanding liability. The interest expense is spread over the term of the lease, so that each accounting period is charged with an amount corresponding to a fixed rate of interest for the liability recognised in the respective period. Variable payments are expensed on the income statement for the year in the periods in which they occur.
Finance income and expense
Finance income and expense include interest income from bank assets, receivables and interest-bearing securities, dividend income, interest expenses related to loans, exchange rate differences attributable to financial investments and financing activities and derivative instruments used in the financial operating activities.
Interest income from receivables and interest expense related to liabilities are calculated using the effective interest method. The effective interest rate is the rate that exactly discounts estimated future cash payments or receipts through the expected life of the financial asset or financial liability to the gross carrying amount of a financial asset or to the amortised cost of a financial liability.
Interest income and interest expense respectively include periodic amounts of transaction costs and discounts where applicable, premiums and other differences between the originally recognised value of the receivable and of the liability respectively and the amount that is settled at maturity and the estimated future receipts and payments through the term of the agreement.
Dividend income is recognised when the right to retain payment has been established.
Exchange gains/losses are recognised net.
Taxes
Income tax consists of current tax and deferred tax. Income tax is reported in the income statement for the year unless the underlying transaction is charged to other comprehensive income or directly to equity, in which case any related tax effect is charged to other comprehensive income or to equity. Current tax is the tax that is to be paid or received for the current year. This includes adjustments of current tax attributable to prior periods.
Current and deferred tax are calculated with application of the tax rates and regulations in effect or in practice at the balance sheet date.
Deferred tax is calculated using the balance sheet method on the basis of temporary differences between the carrying amounts and tax values of assets and liabilities. Temporary differences are not considered in consolidated goodwill.
Measurement of deferred tax is based on how the carrying amount of assets or liabilities is expected to be recovered or settled.
Deferred tax assets, relating to deductible temporary differences and loss carry-forwards, are only recognised to the extent that it is probable that these can be utilised. The value of deferred tax assets is reduced when it is no longer deemed likely that they can be utilised.
Financial instruments
Financial instruments reported in the statement of financial position as assets consist primarily of cash and cash equivalents, loan receivables and trade receivables. Trade payables, loan liabilities, contingent considerations and overdrafts are recognised as liabilities.
Recognition in and derecognition from the statement of financial position
Recognition of a financial asset or financial liability in the statement of financial position is at the point when the entity becomes a party to the contractual provisions of the instrument. A receivable is recognised when the entity has performed and there is a contractual liability for the counterparty to pay, even if an invoice has not been sent. Trade receivables are recognised in the statement of financial position upon issuance of invoice. Liabilities are included when the counterparty has performed and there is a contractual liability to pay, even if the invoice has not been received. Trade payables are recognised on receipt of invoice.
Initial recognition
Financial instruments are recognised initially at fair value plus/less transaction costs, with the exception of instruments that are continuously recognised at fair value through profit or loss. These transaction costs are instead recognised as an expense as they occur. Trade receivables (without a significant financing component) are measured initially at their transaction price as stated in accordance with IFRS 15.
Classification and subsequent measurement of financial assets
Financial assets are classified initially either as measured at amortised cost, fair value through other comprehensive income (liability instrument investment), fair value through other comprehensive income (equity investment), or fair value through profit or loss. The Group's various holdings of financial assets have been classified as described below:
– Other financial assets
All other financial assets are measured at amortised cost. This is because the objective of the business model is to hold these assets to collect their contractual cash flows, and that the cash flows from the assets are solely payments of principal and interest.
– Cash and cash equivalents
Cash and cash equivalents comprise cash in hand, deposits available on demand held with banks and similar institutions, and short-term deposits with a maturity on acquisition of three months or less, which are exposed to only an insignificant risk for fluctuations in value.
Classification and subsequent measurement of financial liabilities
Financial liabilities are classified either as measured at amortised cost or measured at fair value through profit or loss.
– Contingent considerations
Contingent considerations assumed in a business combination are recognised at fair value through profit or loss. Changes in fair value are recognised in "Other Operating Costs" or "Other Operating Income".
– Other financial liabilities
All other financial liabilities are measured at amortised cost using the effective interest rate method.
Call options
The holder is entitled to acquire one repurchased Class B share in the company for each call option within a predetermined period in each respective option scheme. If the option holder is still an employee of the Group and still owns options, the premium paid will be repaid as salary after 24 months. The option premium is recognised as a liability and an expense during the earnings period. The premium is recognised as income if an issued option expires without being exercised. When an issued option is exercised, the premium increases the exercise price upon the sale of shares or reduces the exercise price upon the purchase of shares. The fair value of issued options is determined on the balance sheet date and the difference between the fair value and the premiums received as liability is recognised in the income statement under net financial items.
Property, plant and equipment
Owned assets
Property, plant and equipment is stated at cost less accumulated depreciation and any impairment in value in the consolidated financial statements.
The carrying amount of an item of property, plant or equipment is derecognised on disposal or when the asset is withdrawn from use and no future economic benefits are expected from its use or disposal/retirement. The gain or loss arising from the disposal or retirement of an asset is determined as the difference between the sales proceeds and the carrying amount of the asset, less direct selling costs. The gain or loss is recognised in other operating income/cost.
The Group mainly has leases for property, machinery, equipment and vehicles.
As a lessee, the Group recognises the leases as a right-of-use asset and associated liability at the date on which the leased asset is available for use by the Group. Each lease payment is allocated between the liability and finance cost (interest). The finance cost is to be spread over the lease term so as to produce a constant rate of interest on the remaining balance for the liability for each period.
Right-of-use assets are depreciated using the straight-line method to the earlier of the end of their estimated useful life or the end of the lease term, which is usually between 3 and 15 years. The leases are normally for a fixed period with an option to renew.
Assets and liabilities arising from leases are initially measured on a present value basis. The lease liabilities include the present value of the following lease payments:
• fixed payments
• variable lease payments that are based on an index
• the exercise price of a purchase option if the Group is reasonably certain to exercise that option.
The lease payments are discounted using the interest rate implicit in the lease. Otherwise, if this rate cannot be determined, using the incremental borrowing rate.
The right-of-use assets are measured at cost and include:
• the initial measurement of the lease liability, and
• payments made at or before the date on which the leased asset becomes available to the lessee.
Leases of low-value underlying assets or leases with a term of 12 months or less are recognised as an expense on a straight-line basis over the lease term. Leases of low-value underlying assets generally comprise office equipment.
Some leases contain extension or early termination options. The terms are used to create maximum flexibility in the management of leases. Options to extend or terminate a lease are included in the asset and the liability as it is reasonably certain that they will be exercised.
Methods of depreciation for owned property, plant and equipment
Assets are depreciated on a straight-line basis over their estimated useful life. Land is not depreciated.
The Group applies component depreciation, which means that depreciation is based on the estimated useful life of the components.
•
•
•
•
Business property comprises a number of components with different useful lives. The main group is buildings and land. Land is not depreciated as its useful life is considered to be indefinite. The buildings consist of a number of components with different useful lives. The following main groups of components have been identified and form the basis for depreciation of buildings:
Frame
100 years
Frame extensions, interior walls, etc. 30 years
Installations and inner surfaces; heating, electricity, plumbing, ventilation, etc.
External surfaces; walls, roof, etc.
20-32 years
20-50 years
The depreciation methods applied and the residual values of the assets and their useful lives are reviewed at the close of every year.
Goodwill
Goodwill is carried at cost less any accumulated impairment.
Goodwill is allocated to cash-generating units (Group operating segments) and is tested for impairment annually.
Acquired supplier relationships with an indeterminable useful life are carried at cost less any accumulated impairment.
Supplier relationships with an indeterminable useful life are deemed to exist in terms of certain acquisitions of agents or comparable relationships with individual suppliers who have historically exhibited a very long-term agent relationship. Circumstances are reviewed annually to determine if they still indicate that the useful life is indeterminable. Impairment tests are performed annually and when there is any indication of impairment. Other acquired supplier relationships are carried at cost less accumulated amortisation and impairment.
Other intangible assets include software, trademarks and customer relationships. These have a determinable useful life and are recognised at cost less accumulated amortisation and impairment.
Expenditures for internally generated goodwill and internally generated brand names are not capitalised as assets but are expensed in the income statement as incurred.
Amortisation is recognised in the income statement on a straight-line basis over the estimated life of the intangible asset, provided it has a definite useful life. Goodwill has an indefinite useful life and is tested for impairment each year or whenever there is an indication that the tangible asset may be impaired. The useful life of the assets are reviewed annually at least, refer also to Note 12.
Estimates of useful life:
• IT software
• brand names/trademarks
5 years
5-10 years
• customer relationships 5 years
• supplier relationships 5 years (unless indefinite)
Borrowing costs that are directly attributable to the construction of qualifying assets are capitalised as part of the cost of that asset. A qualifying asset is an asset that necessarily takes a substantial period of time to get ready for its intended use or sale. Firstly, borrowing costs arising on loans, which are specific to the qualifying asset are capitalised. Secondly, borrowing costs arising on general loans, which are not specific to any other qualifying asset are capitalised. For the Group, the capitalisation of borrowing costs is mainly relevant in the construction of storage and production facilities using its own direct labour.
Inventories are stated at the lower of cost and net realisable value. The cost of inventories is calculated by applying the first-in, first-out method (FIFO) and includes expenditure arising on acquisition of the inventory assets and transportation thereof to their current location and state. Net realisable value is based on the estimated selling price in the operating activities less further costs expected to be incurred to completion and for realising a sale. For further information, see Note 15.
The section below explains the impairment test for property, plant and equipment and intangible assets, investments in subsidiaries and for financial assets. Assets for sale and disposal groups, inventories and deferred tax assets are exempt. The recognised value of the exempt assets is assessed in accordance with the respective accounting standards.
Impairment tests for property, plant and equipment and intangible fixed assets and interests in subsidiary undertakings
If there is any indication of impairment, then the asset's recoverable amount is calculated, see below). The recoverable amount is also calculated annually for goodwill and other intangible assets with indefinite useful lives. If essentially independent cash flow cannot be isolated for individual assets, then the assets are grouped at the lowest levels where essentially independent cash flows can be identified – a so-called cash-generating unit.
An impairment loss is recognised where the carrying amount of an asset or cash-generating unit, or group of units, exceeds the recoverable amount. An impairment loss is recognised as an expense in the income statement for the year. Any impairment losses on a cash-generating unit, or group of units, are allocated first to goodwill. And are then allocated on a pro rata basis to other assets in the unit (group of units).
The recoverable amount is the highest of the fair value minus selling costs and value in use. Value in use is measured by discounting future cash flows using a discounting factor that takes into account the risk-free rate of interest and the risk associated with the specific asset.
Impairment losses on assets are reversed if there is an indication that impairment has ceased and there is a change in the assumptions that formed the basis of calculating the recoverable amount. Impairment losses on goodwill are never reversed. A reversal only occurs to the extent that the asset's carrying amount after reversal does not exceed the carrying amount that would have been recognised (less depreciation or amortisation, where applicable), had no impairment loss been recognised.
Impairment of financial assets
OEM recognises a loss allowance for expected credit losses on financial assets measured at amortised cost. The loss allowance for trade receivables is measured at an amount equal to the expected losses for the remaining time to maturity. The loss allowance for other receivables is measured at an amount equal to 12 months' expected credit losses, provided that the credit risk of the receivable has not increased significantly since initial recognition. If the credit risk of the receivable has increased significantly since initial recognition, the loss allowance is instead measured at an amount equal to the expected credit losses during the remaining time to maturity.
The loss allowance is calculated as the present value of all cash shortfalls (i.e. the difference between the cash flows as stated in the contract and the Group's expected cash flows). Receivables with a short term to maturity are not discounted. Assets are reported in the balance sheet net of any impairment losses. Impairment losses are recognised in the income statement.
The gross carrying amount of a financial asset is written off when the Group has no reasonable expectations of recovering the financial asset in its entirety or a portion thereof.
Capital payments to shareholders
Repurchase of own shares
Purchase of such instruments is recognised as a deductible item from equity. Payment from sales of equity instruments is recognised as an increase in equity. Any transaction costs are recognised directly in equity.
Dividends paid
Dividends are recognised as a liability after the Annual General Meeting has approved the dividend.
Earnings per share
Earnings per share are calculated by dividing the Group's profit for the year attributable to the Parent Company's shareholders by the weighted average number of shares outstanding during the year.
Employee benefits
Defined-contribution pension schemes
Defined-contribution pension schemes are classified as those schemes for which the company's obligation extends only to the contributions the company has committed to pay. In such cases, the size of the employee's pension is determined by the contributions the company pays to the plan or to an insurance company and the return on capital yielded by the contributions. Consequently, it is the employee that carries the actuarial risk (that compensation is lower than expected) and the investment risk (that
the invested assets will be insufficient to cover the expected compensation). The entity's obligations concerning contributions to defined-contribution schemes are recognised as an expense in profit or loss for the year at the rate they are earned through services performed by the employees for the entity.
Defined-benefit pension schemes
The Group's obligation regarding defined-benefit pension schemes is calculated separately for each scheme by estimating the future compensation that the employees have earned through their employment; this compensation is discounted to present value. The discount rate used is the interest rate on high-quality corporate bonds on the reporting date, extrapolated to match the terms of maturity for the Group's retirement benefit obligations. If there is no active market for such corporate bonds, the market interest rate on government bonds is used instead. The retirement benefit obligation is recognised net, less the fair value of the plan assets.
Pension rights earned are recognised in the operating profit, with the exception of impacts of revaluation and interest rate as per below. The interest expense/income net on the defined-benefit obligation/asset is recognised in the income statement under net financial items. The net interest income is based on the interest rate in effect at the time of discounting the net obligation, i.e. interest on the obligation, plan assets and interest on the effect of any asset ceiling. Other components are recognised in operating profit.
Effects of revaluation comprise actuarial gains and losses and the difference between actual return on plan assets and the interest rate included in the net interest income. The effects of revaluation are recognised in other comprehensive income.
An entity shall recognise an expense for termination benefits at the earlier of either when the entity can no longer withdraw the offer of those benefits to the employees, or when the entity recognises costs for a restructuring. Where an offer of benefits is made to encourage voluntary redundancy, an entity shall recognise an expense at the earlier of either when the employee accepts the offer, or when the entity can no longer withdraw the offer of those benefits.
The calculation of the expense is based on the probability of the offer being accepted, the number of employees expected to accept the offer and the length of time for which payment is expected to be made. Benefits that are settled after twelve months are discounted to their present values.
Short-term benefits to employees are calculated without discounting and recognised as costs when the related services are received. The Group recognises a provision for the expected cost of bonus payments when it has a legal or constructive obligation to make such payments as a result of services received from employees.
Provisions are different from other liabilities because the time of payment and the amount of the payment are uncertain. A provision is recognised in the statement of financial position when there is a present legal or constructive obligation as a result of a past event, the amount of the obligation can be reliably estimated and it is probable that an outflow of economic benefits will be required to settle the obligation.
Provisions are measured at the best estimate of the amount expected to be required to settle the obligation at the reporting date. If the effect is material, provisions are determined by discounting the expected future cash flows.
A contingent liability is recognised when there is a possible obligation arising from past events, the existence of which will be confirmed only by the occurrence or non-occurrence of one or more uncertain future events not wholly within the control of the Group, or when there is an obligation that is not recognised as a liability or provision because it is not probable that an outflow of resources will be required or the amount cannot be reliably estimated.
The Parent Company has prepared its Annual Report according to the Annual Accounts Act (1995:1554) and the Swedish Financial Accounting Council's recommendation RFR 2, Accounting for Legal Entities. In addition, the Swedish Financial Accounting Council's pronouncements for listed companies are applied. RR 2 means that the Parent Company in the annual accounts for the legal entity must apply all IFRS and interpretations adopted by the EU as far as this is possible within the framework of the Swedish Annual Accounts Act, the Swedish Pension Obligations
Vesting Act and taking into account the relationship between accounting and taxation. The recommendation specifies exemptions and additions relative to IFRS.
The Parent Company's accounting policies for 2023 are the same as for 2022.
The differences between the accounting policies of the Group and those of the Parent Company are presented above and below. The accounting policies for the Parent Company, presented below, have been consistently applied to all periods covered by the Parent Company's financial statements.
Classification and presentation
Where the Group uses the terms statement of financial position and statement of cash flows, the Parent uses balance sheet and cash flow statement. The income statement and balance sheet for the Parent Company are prepared in accordance with the schedule of the Swedish Annual Accounts Act, whereas the statement of comprehensive income, statement of changes in equity and cash flow statement are based on IAS 1
Presentation of Financial Statements and IAS 7 Statement of Cash Flows.
The Parent's income statement and balance sheet differ to the Group's mainly with regard to reporting of finance income and expense, non-current assets, equity, untaxed reserves and the occurrence of provisions as a separate heading in the balance sheet.
Sales of services and similar assignments
Services are sold only on an ongoing basis to subsidiaries. Revenue arising from the rendering of services is recognised in the income statement for the year in which the service is rendered.
Subsidiaries
Interests in subsidiary undertakings are recognised in the Parent Company using the cost method. This means that transaction costs are included in the carrying amount for interests in subsidiary undertakings. In the consolidated financial statements, transaction costs are recognised directly in profit for the year as they are incurred. Contingent consideration is measured using probabilities of payment. Any changes to the provision are added to or deducted from the cost.
The Parent Company has decided not to apply IFRS 9 for financial instruments.
Non-current financial assets in the Parent Company are valued at cost less any impairment losses and financial current assets are valued at the lower of cost and net realisable value. The rules for impairment according to IFRS 9 are applied for financial assets measured at amortised cost.
Financial liabilities are stated at amortised cost on the same basis as in the consolidated financial statements.
Overdrafts are recognised in the line Overdrafts if credit has been utilised or in the line Cash on hand and demand deposits along with other cash and cash equivalents if credit has not been utilised.
The Parent Company's financial guarantee contracts consist of guarantee commitments to support subsidiaries. The Parent Company recognises financial guarantee contracts as provision in the balance sheet when the company has an obligation for which payment will probably be required to settle the obligation.
Anticipated dividends from subsidiaries are reported when the Parent Company has sole right to determine the size of the dividend and the Parent Company has decided on the size of the dividend before the Parent Company has published its financial statements.
Property, plant and equipment
Property, plant and equipment in the Parent Company is stated at cost less accumulated depreciation and any impairment, on the same basis as for the Group, but with additions for any increases arising on revaluation.
The Parent Company recognises all leases in accordance with the regulations for operating leases.
Borrowing costs in the Parent Company are charged to the income statement in the period in which they arise. No borrowing costs are capitalised on assets.
The Parent Company reports untaxed reserves including deferred tax liability. In the consolidated financial statements, however, untaxed reserves are divided between deferred tax liability and shareholders' equity.
Shareholders' contributions are charged directly to equity for the receiver and are capitalised in shares and contributor participations, to the extent that impairment is not required.
The Parent Company recognises issued and received Group contributions as year-end appropriations.
The Group's operations are divided into operating segments based on the business areas for which the company's chief operating decision maker, the Group's executive team, monitors the profit, returns and cash flows from the Group's various segments. The operating segments, in the form of market regions, have three managers in Sweden, five managers in Finland, the Baltic states and China, and three managers in the Denmark, Norway, the British Isles and East Central Europe region. They are responsible for the day-to-day operations and provide the Group's executive team with regular reports on the performance of the segment and resource requirements. The Group's internal reporting system is designed to allow the Group's executive team to monitor the performance and results, such as operating profit and EBITA, of each of the market regions. The Group's segments have been identified using data from this internal reporting system, and the different areas have been assessed in order to merge segments that are similar. This means that segments have been aggregated if they share similar economic characteristics, such as long-term gross margins and have similar product areas, customer categories and methods of distribution.
In the segments' profit, assets and liabilities are included directly attributable items and items that can be distributed to the segment in a reasonable and reliable manner. Non-distributed items consist of interest and dividend income, gains from the sale of financial investments, interest expenses, losses from the sale of financial investments, tax expenses and general administration expenses. Assets and liabilities not distributed to the segments are deferred tax assets, deferred tax liabilities, interest-bear-
ing assets and liabilities. The segment's investments in property, plant and equipment and intangible fixed assets include all investments except for investments in expendable equipment and minor value assets. Internal prices between the Group's different segments are set using the "arm'slength principle", i.e. between parties who are independent of each other, well informed and with an interest in completing the transactions.
Basically all income comes from product sales, consisting of components mainly for industrial automation in the product areas of electrical components, flow technology, motors, transmissions and brakes, appliance components, installation components, and bearing solutions and seals. Customers include machinery and appliance manufacturing industries, wholesalers, electrical contractors, catalogue distributors, strategic end users and electronics manufacturers and strategic contract manufacturers in northern Europe.
Internal sales have elements of services, both at the Parent Company and subsidiaries. All Parent Company sales relate to services sold to the subsidiaries.
Other Group-wide operations include the Parent Company, owning the shares in underlying companies, and property companies owning business properties in the locations where the Group conducts its business activities. The Parent Company is to be an active owner and develop the subsidiaries. In addition to clear management-by-objectives, this means contributing expertise and resources in the fields of IT, financial control, HR administration, market communication, quality and environmental control, and warehouse management.
Operating
Operating segments cont. 2
* External sales are broken down by location of sales point.
** Relates to intangible fixed assets and property, plant and equipment
* Government support for businesses with the cost of energy bills in 2023. Government support has been received for 2022 for short-term work and sick pay in Sweden and for temporary staff redundancies in Denmark, Norway, Hungary and the UK, all related to Covid-19.
On 13 October 2023, the entire shareholding of Lagermetall AB was acquired. Lagermetall sells and markets industrial slide bearings and cast bronze for mechanical applications in all industries. The company has 17 employees and an annual turnover of SEK 104 million. The head office is in Örebro, Sweden. The acquisition had a marginal impact on OEM's profit in the current year. The business was acquired for a consideration of SEK 30.8 million, including a contingent consideration estimated at SEK 9 million, which is equivalent to 100% of the maximum additional consideration, and is based on how the business develops in 2023 and 2024. The acquisition increased intangible fixed assets by SEK 8.9 million, relating to customer relationships that are amortised over 5 years. Totalling SEK 2.2 million, goodwill is related to expected future profitability. Acquired receivables are recognised at their fair value.
On 1 November 2023, the entire shareholding of the Danish company Unit-Pump A/S was acquired. Unit-Pump is an importer and distributor of pumps and mechanical seals. The company has 3 employees and an annual turnover of approximately DKK 20 million (SEK 31 million). The head office is in Kvistgård, Denmark. The company has been fully integrated into OEM's Danish operations, OEM Automatic Klitsø. The acquisition had a marginal impact on OEM's profit in the current year. The business was acquired for a consideration of SEK 25.8 million, including a contingent consideration estimated at SEK 6.5 million, which is equivalent to 82% of the maximum additional consideration, and is based on how the business develops in 2024. The acquisition increased intangible fixed assets by SEK 19.8 million, relating to supplier relationships that are amortised over 5 years. Totalling SEK 7.1 million, goodwill is attributable to the expected future profitability of the business. Acquired receivables are recognised at their fair value.
On 1 December 2023, the entire shareholding of Ingemar Liljenberg AB was acquired. Ingemar Liljenberg sells and markets bespoke products for customers, such as cast, punched and processed components for the engineering and electronics industry. The company also has a fixed product range of locks, rails and fittings for wood and steel interiors. The company has 8 employees and an annual turnover of SEK 62 million. The head office is in Vellinge, Sweden. The acquisition had a marginal impact on OEM's profit in the current year. The business was acquired for SEK 45 million, including a SEK 3.6 million holdback and a contingent consideration estimated at SEK 9 million, which is equivalent to 100% of the maximum additional consideration, and is based on how the business develops in 2024 and 2025. The acquisition increased intangible fixed assets by SEK 20.2 million, relating to customer relationships that are amortised over 5 years. Totalling SEK 17.7 million, goodwill is attributable to the expected future profitability of the business. Acquired receivables are recognised at their fair value.
On 13 January 2022, all of the shares in Demesne Electrical Sales Ltd were acquired. The company was acquired through the transfer of all shares in the parent company Balfe Securities Limited. Demesne Electrical Sales is Ireland's leading independent importer and distributor of electrical control, switch-gear, energy-saving and installation products. It has 48 employees and an annual turnover of approximately SEK 250 million. The acquisition contributed SEK 247 million and SEK 43 million to Group sales and earnings respectively. The company's head office is in Dublin. The company is part of Region Denmark, Norway, the British Isles and East Central Europe.
OEM normally uses an acquisition structure with a base consideration combined with contingent consideration. The business was acquired for a consideration of SEK 229.1 million, including a contingent consideration estimated at SEK 77.8 million, based on how the business develops from 2022 to 2024. The acquisition increased intangible fixed assets by SEK 104.6 million. The amount relates to supplier relationships that will be amortised over a period of 5 years which is in line with the Group's overall acquisition strategy. Totalling SEK 70.0 million, goodwill is attributable to synergies with current operations within the Group. Acquired receivables are recognised at their fair value.
of the acquired companies
Goodwill
Goodwill is attributable to expected future profitability The value of goodwill is not deductible for tax purposes.
Acquisition-related expenses
Acquisition-related expenses amount to SEK 0.1 million (1.5) and relate to consultancy fees for due diligence. These expenses have been recognised as other operating expenses in the Statement of Income.
Contingent consideration
It is stated in the acquisition agreements for acquisitions made in 2023 that contingent consideration is payable to the vendors based on the development of the contribution margin ratio or earnings performance. Contingent consideration is capped at SEK 25.9 million for these and is estimated at SEK 24.5 million in the acquisition cost analysis. Contingent consideration was settled in respect of Lagermetall due to changed adjusted equity. The contingent considerations have been calculated using weighted probability techniques.
Remeasurement of contingent consideration
Developments in completed acquisitions have not resulted in remeasurement of contingent consideration recognised as a liability, with the exception of foreign currency. Remaining considerations (both fixed and contingent) recognised as liabilities related to acquisitions as at 31 December 2023 amounted to SEK 85 million (91).
Further details about intangible assets are provided in Note 12.
* Of the other senior executives, four (five) people receive remuneration from subsidiaries. This remuneration is included at an amount of SEK 7.5 million (9.3). Pension expenses were SEK 1.6 million (1.9).
Pension expenses are defined contribution. There are no other retirement benefit obligations. As in previous years, variable remuneration is based on the performance levels attained. SEK 2.8 million was paid in variable remuneration in 2023. Variable remuneration payment totalled SEK 2.8 million in 2022. The outcome of variable remuneration for 2023 and 2022 was at maximum. The notice period for the Managing Director is set at 24 months' notice from the company, with the obligation to work, and at 6 months' notice from the Managing Director. The retirement age for the Managing Director is 62 years. The CEO/ Managing Director's salary and remuneration is set by the Board.
Other senior executives
Pension expenses are defined contribution. There are no other retirement benefit obligations. Variable remuneration payments totalled SEK 1.9 million in 2023. Variable remuneration payments totalled SEK 3.4 million in 2022. Based on the attained profit level, variable remuneration can be paid at a maximum of 45% of base salary. The notice period for other members of the Group's executive team is set at maximum 12 months' notice from the company, with the obligation to work, and at maximum 6 months' notice from the employee. If the company serves notice after the age of
55 years, the period of notice is increased by an additional six monthly salaries. The retirement age for the other members of the Group's executive team is between 60 and 65 years.
Guidelines for remuneration and other terms of appointment of senior executives
Guidelines for senior executives, approved by the 2023 Annual General Meeting, state that the Managing Director, Group management and other managers who report directly to the Managing Director shall have market-competitive salaries and other remuneration terms. Share-related remuneration, so-called incentive schemes, are to be decided by the Annual General Meeting. In addition to a basic pay, the management can also receive variable remuneration, which can amount to a maximum of eight monthly salaries. Senior executives shall have premium-based pension schemes, capped at 30% of fixed pay. The notice period is set at a maximum of 24 months' notice from the company and involves the obligation to work during the period of notice. Employment agreements shall not contain provisions for severance pay.
Of the remuneration to auditors in 2023, the following has been paid to Öhrlings PricewaterhouseCoopers AB in Sweden: Audit services SEK 2.5 million (2.0), other statutory services SEK - million (-), tax advice SEK - million (-) and other services SEK - million (-). Audit assignments refer to the auditing of the Annual Report, the consolidated financial statements, the accounting records and the administration by the
Board of Directors and the Managing Director, other tasks that are the duty of the company's auditors, as well as advice and other assistance resulting from observations made during such audits or the performance of other such duties. Tax counselling refers to all consultations in the area of tax. "Other assignments" refers to advice on accounting matters and advice on processes and internal control.
At year end, the carrying amounts of trademarks, customer relationships, supplier relationships, patents and software came to a total of SEK 140.1 million (115.3).
2023
The acquisition of the operations of Lagermetall AB increases the value of customer relationships by SEK 8.9 million and goodwill by SEK 2.2 million. The acquisition of the operations of Unit-Pump AS increases the value of supplier relationships by SEK 19.8 million and goodwill by SEK 7.1 million. The acquisition of the operations of Ingemar Liljenberg AB increases the value of customer relationships by SEK 20.2 million and goodwill by SEK 17.7 million. The estimated useful lives of the customer and supplier relationships is five years.
The acquisition of the operations of Demesne Electrical Sales Ltd increases the value of supplier relationships by SEK 104.6 million and goodwill by SEK 70.0 million.
The estimated useful life of the supplier relationships is five years.
Impairment testing of customer relationships refers to part of customer relationships from the acquisition of the assets of the company Finisterra AS in 2019.
The above amounts relate to goodwill amounting to SEK 255.0 million (228.7) and acquired supplier relationships for Telfa AB amounting to SEK 8.8 million (8.8).
These are long-standing supplier relationships with an indefinite useful life that are appraised as stable over the foreseeable future. The values in use are based on estimated future cash flows with the starting point in existing business plans for the next year. The amounts are calculated using the value-in-use methodology. The key assumptions used to calculate the value of all cash-generating units are the discount rate, margin expansion and volume growth. The business plans are based on experience from previous years, but take the companies' forecasts for anticipated future growth into consideration. Current market shares are expected to increase marginally in the forecast period. The growth in sales and earnings in the operations is expected to be in line with the business plans. Net cash flow growth is expected to come in at 2% (2%) for other years after the forecast period of 1 year. The gross profit margins are expected to reach the same level as at the end of 2023. The forecast cash flows have been converted to a present value using a discount rate per segment and before tax of 10% (9%) for Sverige, 11% (8%) for Finland, Finland, the Baltic states and China, and 12% (9%) for Denmark, Norway, the British Isles and East Central Europe. The values in use of the units exceed their carrying amounts. The company's management has concluded that no reasonable changes in the key assumptions would cause the estimated values in use of the units to be less than the carrying values.
Impairment tests have been performed at segment level on cash-generating units containing goodwill and intangible assets with indefinite useful lives, which is considered to be the smallest cash-generating unit, based on the value in use of the units.
Corporate management has performed alternative impairment test calculations based on reasonably possible changes in the key assumptions on discount rates, margin expansion and volume growth. An increase in the discount rate to 15% across all operating segments would not give rise to an impairment loss. The Group's budgets and business plans during the forecast period are, in all material respects, level with 2023 with regard to sales, gross margin, profit and cash flows. Nor would an assumption on 2% negative growth give rise to an impairment loss.
15
Group impairment of inventories at the close of 2023 was SEK 66.1 million (50.6), which represents approximately 6% (4%) of the cost of the stock. To determine impairment of stock, the Group uses set obsolescence models and individual assessment of each item of inventory. Swedish companies that do not use an obsolescence schedule instead use the flat-rate 3% option. The lower of cost or market value method was used to determine the value of inventory, which was written down to SEK 1.2 million. This is included in the Group's total impairment loss. Costs to scrap items and change in impairment reserve are included in goods for resale in the consolidated Statement of Income.
The shares consist of Class A and Class B. The face value is SEK 0.28 (0.28).
The Group's translation reserve
The translation reserve includes all exchange differences arising on the translation of financial statements from foreign operations that have prepared their financial statements in a currency other than that used in the consolidated financial statements. The Parent Company and the Group present their financial statements in Swedish krona.
Parent Company's restricted funds
Restricted funds may not be reduced through the payment of dividends.
Reserve fund
The purpose of a reserve fund has been to save a proportion of the net earnings not required to cover retained losses. The amount which before 1 January 2006 went to the share premium account has been transferred to the reserve fund.
Development fund
When internally generated intangible assets are capitalised, a corresponding amount is transferred to a development fund classed as restricted equity. The fund is wound up at the same rate as the capitalised item is amortised.
Parent Company's distributable equity
The following funds and profit for the year together constitute a distributable reserve, i.e. the amount available for distribution to shareholders as a dividend.
Retained earnings
Retained earnings are the profits and income that remain from the prior year after paying dividends.
The Board's aim is to achieve a good return on total capital with a limited financial risk during stable growth.
The target for one business cycle is:
• Minimum sales growth of 10% per annum
• A minimum EBITA margin of 12% per annum
• A minimum return on equity of 25% per annum
• The debt-to-equity ratio must not exceed 100%
After the balance sheet date, the Board has proposed a dividend of SEK 1.75 (1.50) per share. The Board aims to propose a reasonable dividend of profits to the shareholders, by taking into account the financial position, the tax situation and any need for acquisitions or investments in the operation. Retained earnings in the Parent Company total SEK 829.6 million. The Board recommends a SEK 243.3 million dividend and that SEK 586.3 million be carried forward.
* Lease liabilities relate to premises, machinery, equipment and vehicles as required under IFRS 16.
** The overdraft has a covenant that requires the Group's equity/assets ratio not to fall below 35%.
As at 31 December 2023, the Group's equity/assets ratio stood at 68% (57%).
See Note 24 for additional information about bank loans and overdrafts. See Note 21 for information about pledged assets for own liabilities.
The principal assumptions used for the purpose of the actuarial valuations were as follows:
In Norway, all employees are covered by defined-benefit pension schemes. Payments totalling SEK 0.9 million are expected to be paid into the schemes in 2024. In other countries, except for Sweden, all employees are covered by defined-contribution schemes. The company pays defined contributions to a separate legal entity and has no obligation to pay additional amounts. Costs are expensed on the consolidated income statement as the benefits are earned. Pension obligations related to the defined-benefit ITP 2 scheme for retirement and family pensions for salaried employees in Sweden are underwritten with insurance provided by Alecta. According to statement UFR 10 Reporting for Pension Scheme ITP 2, issued by the Swedish Financial Reporting Board, the ITP 2 scheme, which is underwritten by the Alecta insurance company, is a defined-benefit multi-employer scheme. For the 2023 financial year, the company did not have access to information that would enable it to report its proportionate share of the scheme's obligations, plan assets and costs. Consequently, it has not been possible to report the scheme as a defined-benefit pension scheme. The ITP 2 pension scheme, which is provided for by means of insurance with Alecta, is therefore reported as a defined-contribution pension scheme. The premium for the defined-benefit retirement and family pension is calculated individually and is based on such factors as the salary, previously earned pension and expected remaining service life. Expected contributions in the next reporting period for ITP 2 insurance with Alecta amount to SEK 1.1 million (1.5). The Group's share of the total contributions to the pension scheme is 0.007% (0.007%), while its share of the total number of active members in the scheme is 0.011% (0.011%). The collective consolidation level comprises the market value of
Alecta's assets as a percentage of the insurance commitments calculated according to Alecta's actuarial methods and assumptions, which are not consistent with IAS 19. The collective consolidation level is normally allowed to vary between 125 and 175 per cent. If Alecta's consolidation level falls below 125 per cent or rises above 175 per cent, measures must be taken to enable the consolidation level to return to the normal range. If the consolidation level is low, an appropriate measure might be to introduce premium reductions.
At the end of 2023, Alecta's surplus, in the form of the collective consolidation level, was 158 per cent (172). The premiums to Alecta are determined by assumptions regarding interest rates, life expectancy, operating costs and tax on returns, and is calculated in order that the payment of a consistent amount of premium up to the date of retirement is sufficient to ensure that the entire, targeted benefit, based on the insured's current pensionable salary, is, in fact, earned. There is no agreed framework to guide the process of managing any deficit that may arise. In the first instance, losses will be covered by Alecta's collective consolidation capital and will thus not lead to increased costs through higher contractual premiums. Nor are there guidelines on how any surpluses or deficits should be allocated in the event of dissolution of the scheme or a company's withdrawal from the scheme. Most of the employees in Sweden are covered by defined-contribution pension schemes. The total cost of the Group's defined-contribution schemes is SEK 37.0 million (35.8). The Parent Company's cost for defined-contribution schemes is SEK 3.4 million (3.1).
Deferred tax constitutes SEK 111.6 million (94.7) of untaxed reserves.
The most significant financial risks for the OEM Group are currency and customer credit risks. However the currency risks have been more or less been eliminated through matching. An elimination of risks that helps the Group achieve a relatively stable coverage ratio over time. In addition to the named risks, the Group has a limited interest rate risk in the form of a cash flow risk. The financial operations of the OEM Group and management of financial risks are mainly handled by the Parent Company. This is carried out in accordance with the financial policy approved by the Board of Directors. There are frameworks for how risk management is to be conducted and for how risks are to be limited. These frameworks are characterised by a low risk level. The basis is the structured and efficient management of the financial risks that arise in the business.
OEM is of the opinion that the carrying amount of financial assets and liabilities is the same as their fair value. The Group's holdings of such financial assets that represent fixed assets are fairly limited. At the close of 2023, the amount of non-current receivables was SEK 1.8 million (0.4). At year end, the Group's holding of financial assets that represent current assets amounted to SEK 759 million (754) and accrued income to SEK 0.6 million (1.2) and other receivables to SEK 8 million (23). As shown above, more than 99% of the Group's financial assets are measured at amortised cost under IFRS 9. The financial liabilities are measured at amortised cost, except for derivatives and contingent considerations which are measured at their fair values. The Group does not have any liabilities with fixed interest. The risk of a shift in the interest rate causing a significant change
in fair value for the Group is thus non-existent. The fair values of interest-bearing liabilities are based on estimates of future cash flows of capital and interest, discounted at market interest rate on the balance sheet date. Derivatives are classified within Level 2. The fair values of derivatives are based on the exchange rates and interest rates on the balance sheet date.
At the close of 2023, the Group had derivative assets of SEK - million (-). Contingent considerations are classified within Level 3. The company's contingent considerations were valued at SEK 83.1 million (85.7) at the close of 2023. Further details about contingent considerations are provided in Note 4.
The item cash and bank balance SEK 233 million (109), the overdraft item SEK 61 million (317) and other interest-bearing liabilities SEK 86 million (61) have variable interest rates and are thus exposed to cash flow risk. Overdrafts apply for one (1) year and the requirement is that the equity/ assets ratio of the Group does not fall below 35%.
The majority of the Swedish companies are part of a cash pooling arrangement with a total limit of SEK 350 million (450), which is the Parent Company's limit. The drawn amount is SEK - million (228) while the Parent Company has a receivable equivalent to SEK 82 million at the bank. The subsidiaries' balance/liability in the central accounting system is reported in the Parent Company, either as a receivable from, or a liability to, the subsidiaries. The total limit in the Group is SEK 611 million (689). The drawn amount is SEK 61 million (317).
OEM is of the opinion that the carrying amount of financial assets and liabilities is the same as their fair value.
Liquidity risk relates to the risk that the Group will not be able to fulfil its obligations associated with financial liabilities. This is offset, as far as possible, by establishing a maturity profile that makes it possible to take necessary alternative actions to secure capital if necessary.
Cash and bank balance at the end of the year was SEK 233 million (109) and financial current assets were SEK 759 million (754). At the close of the year, the Group's financial liabilities were SEK 575 million (843). The maturity profile is presented in the table below. The table shows both capital payments and interest payments.
* Overdraft runs for one (1) year at a time.
The interest rate risk is low and essentially consists of the cash flow risk that arises when the items cash and bank balance, overdraft and other interest-bearing liabilities have variable interest rates. A one per cent change in interest on the balance sheet date would entail a change of SEK -0.7 million (-3.3) in the income statement.
The currency risks are primarily due to purchases being made in foreign currencies. The risks are managed by the customer contract often prescribing that the price must be adjusted in relation to any currency changes. Alternatively, the sale is carried out in the same currency as the purchase. A detailed report is given in connection with the below table.
The currency flow of the Group is attributable to imports from Europe, Asia and North America.
As long as it is possible, the Group eliminates the effects of exchange rate fluctuations by using currency clauses in the customer contract and by purchasing and selling in the same currency. On the whole, purchasing is carried out in the supplier's functional currency. The table shows that 58% (55%) of purchases in 2023 were in EUR, 22% (22%) USD, 3% (3%) GBP, 8% (9%) SEK and 9% (11%) in other currencies. The OEM Group manages the effects of changing exchange rates by currency clauses in the sales contract and by invoicing in the same currency as the corresponding purchase. OEM sells goods to Swedish and foreign customers and either invoices in the purchasing currency or in another currency with currency clauses with regard to the purchase currency. The currency clauses adjust 80% to 100% of the changes in the exchange rate from the sales order to the date of invoicing, depending on whether OEM receives currency compensation for the profit margin or not. There is often a threshold value, which means that exchange rate changes below 2.25% are not taken into account.
Currency adjustments are made symmetrically for rising and falling currency rates. Currency clauses and sales in the purchasing currency make up about 70% (69%) of all sales contracts. Where purchasing is based on sales orders, economic hedging of currency risks is achieved in sales and purchasing. However, in many cases there is a mismatch in timing between purchase orders and sales orders. Purchase orders normally run 7-60 days prior to delivery. The trade credit period is approximately 30 (32) days. The currency adjustment clauses means that only currency changes between the time of sale and the time of invoicing affect the amount reported in Swedish Kronor. Since invoicing, in accordance with currency adjustment clauses, is carried out in SEK, there is no exchange rate difference after the date of invoicing. OEM applies the same terms and conditions for adjusting currencies and prices for its Swedish and overseas customers. The changes in values related to the currency clauses are therefore treated consistently from the points of view of risk and accounting. A ten per cent change in exchange rates for the EUR and USD would, using a simplified model, mean about SEK 319 million in change in turnover.
With regard to currency risk, it can be determined that OEM also has balance exposures in the form of net investment in independent foreign operations. At present, these currency risks are not hedged.
Purchases are broken down into percentages as follows:
Exchange rate changes significant currencies:
The sensitivity of the translation exposure to changes in the exchange rate is explained below:
analysis,
5 % in exchange rate.
on the Group's shareholders' equity
Exchange rates used in the preparation of the accounts to translate the income statements and net assets of foreign subsidiaries:
Customer and credit risks
Defined customer limits are carefully decided and strictly applied. Customer limits are assessed at company level. Customer limits and credit risk are set for all new customers via third party credit reference agencies. The credit limits for existing customer are continually updated.
These are also assessed with the help of third party credit reference agencies and using internal knowledge about the customer. Short credit periods and absence of risk concentrations for individual customers, segments or geographic areas contribute to a good risk picture, one that is confirmed by the small historical customer losses. Recognised receivables
are measured based on the low level of risk. The Group has approximately 30,000 purchasing customers in total. The largest individual customer accounted for approximately 4% (4%) of sales. The five largest customers accounted for 15% (13%) of sales and the ten largest customers accounted for 20% (17%) of sales. The distribution of risk is thus very good. Bad debts had a favourable impact on bad debt provisions during the year and were SEK 0.9 million (-0.3), equivalent to 0.01% (0.01%) of sales. The bad debt risk is assessed as low. The average credit period stood at approximately 47 (46) days.
Incentive schemes 2023-2026
A long-term share-related incentive scheme, based on call options for the Managing Director, senior executives and certain other key individuals in the Group, was approved at the Annual General Meeting on 18 April 2023. A maximum of 200,000 call options are available under the incentive scheme, equivalent to approximately 0.1% of the total number of shares in the company. The Black-Scholes option pricing model was used to set the price for the call options at SEK 12.77, which is equal to the market value of the options on the acquisition date. Each call option entitles the holder to acquire one OEM International share during the period 2 March 2026 to 15 June 2026, both dates inclusive. The purchase price per share is SEK 122, equivalent to 120% of the average price of the company's share on the Nasdaq Stockholm during the period 8 May 2023 to 19 May 2023, both dates inclusive. The estimated volatility of the stock price is 28%
and the risk free rate of interest is 2.73%. A total of 153,500 options have been acquired in the scheme during this period. To encourage interest in the scheme, the Board of Directors has resolved that participants who are still Group employees on 1 June 2025 will be paid a stay-on bonus in the form of supplemental gross salary, capped at the amount equivalent to the price paid for the call options. No new shares have been issued or repurchased for the purpose.
Incentive schemes 2022-2025
A long-term share-related incentive scheme, based on call options for the Managing Director, senior executives and certain other key individuals in the Group, was approved at the Annual General Meeting on 26 April 2022. A maximum of 152,500 call options are available under the incentive scheme, equivalent to approximately 0.1% of the total number of shares in
the company. The Black-Scholes option pricing model was used to set the price for the call options at SEK 6.64, which is equal to the market value of the options on the acquisition date. Each call option entitles the holder to acquire one OEM International share during the period 1 March 2025 to 15 June 2025, both dates inclusive. The purchase price per share is SEK 86.60, equivalent to 120% of the average price of the company's share on the Nasdaq Stockholm during the period 9 May 2022 to 20 May 2022, both dates inclusive. The estimated volatility of the stock price is 28%
OEM International AB (publ) is a Swedish-registered public limited company with its headquarters in Tranås, Sweden. The Parent Company shares are listed on NASDAQ Nordic Mid Cap in Stockholm. The Head Office address is Förrådsvägen 2, Box 1009, SE-573 28 Tranås, Sweden. The consolidated financial statements for 2023 incorporate the financial statements of the Parent Company and its subsidiaries, jointly referred to as the Group.
The company's management and the Audit Committee have discussed the developments, choices and disclosures regarding the Group's significant accounting policies and estimates, as well as the application of these policies and estimates. The carrying amounts of certain assets and liabilities are based in part on assessments and estimates.
Assumptions about future conditions and estimates of parameters were made when calculating the values in use of cash-generating units for the company's goodwill impairment testing. These are described in Note 12. The company's management has concluded that no reasonable changes in the key assumptions would cause the estimated values in use of the units to be less than the carrying values.
Other intangible fixed assets are mainly the values arising on acquisition, comprising SEK 95.2 million for supplier relationships, of which SEK 18.1 million is attributable to acquisitions in 2023, and SEK 33.4 million for customer relationships, of which SEK 28.5 million is attributable to acquisition in 2023. Some supplier relationships have indeterminable useful lives. Those with determinable lives, amounting to SEK 86.4 million, are amortised over a period of five years. A maximum of 57 months remain of the amortisation period. Customer relationships consist of establishments on new markets and it is deemed is that these will be written down over
and the risk free rate of interest is 1.57%. All options in the scheme have been acquired during this period. To encourage interest in the scheme, the Board of Directors has resolved that participants who are still Group employees on 1 June 2024 will be paid a stay-on bonus in the form of supplemental gross salary, capped at the amount equivalent to the price paid for the call options. No new shares have been issued or repurchased for the purpose.
There are no significant events to report after the close of the reporting period.
a five-year period. A maximum of 58 months remain of the amortisation period.
Risk of inventory obsolescence is taken into account during valuation of stock. To determine impairment of stock, the Group uses set obsolescence models and individual assessment of each item of inventory. Swedish companies that do not use an obsolescence schedule instead use the flat-rate 3% option. These are described in Note 15. An assessment of obsolescence takes into account the turnover rate of the individual items and forecast future sales volumes. The size of the obsolescence reserve is thus sensitive to changes in forecast sales volumes.
In connection with a business acquisition, OEM agrees on an earnout, an additional amount of purchase price. As at 31 December 2023, earnouts of SEK 79.5 million were recognised on the balance sheet. These are conditional on the acquired companies achieving pre-specified growth in earnings over a period of time. The liability for earnouts recorded on the balance sheet reflects the management's best assessment of performance. Future instalments of the purchase price may need to be adjusted if the company performs better or worse than projected and the difference recognised in the income statement. See Note 4 and Note 24 for further information about the Group's earnouts.
to the Parent Company's shareholders.
The OEM Group's related parties consist primarily of senior executives (Note 5), other senior executives (Note 5) and major shareholders. Other than Board fees, salaries and other remuneration, no other remuneration has been paid to related parties. The Parent Company and its subsidiaries
The following profits are at the disposal of the Annual General Meeting
are related parties. See Note 14. The sale of services to the Parent Company's subsidiaries accounts for 100% of its net sales. Related party transactions are priced at market-rate terms and conditions.
The Board of Directors proposes that
be paid
and that the following be carried forward
The Board of Director's comments on the dividend proposal may be viewed on the company's website, www.oem.se or is available upon request. The Board of Directors recommends Thursday 25 April 2024 as the record date. The Board of Directors and the Managing Director declare that the Annual Report has been prepared in accordance with generally accepted accounting policies in Sweden and that the consolidated financial statements have been prepared in accordance with the International Financial Reporting Standards as stipulated in the European Commission's and the Swedish Financial Reporting Board's Regulation (EC) No. 1606/2002 of 19 July, 2002, regarding the application of international accounting standards. The Annual Report and the consolidated financial statements give a fair and true view of the Parent Company and the
Group's financial position and results. The Directors' Report for the Parent Company and the Group, respectively, gives a true and fair summary of the Group's and Parent Company's business operations, financial position and results and describes significant risks and uncertainties faced by the Parent Company and companies included in the Group.
The Annual Report and the consolidated financial statements were approved for publication by the Board of Directors on 21 March 2024. The Group's Statement of Income, Statement of Comprehensive Income and Statement of Financial Position and the Parent Company's Income Statement and Balance Sheet will be matters for approval at the Annual General Meeting on 23 April 2024.
Our
Frida
To the Annual General Meeting of OEM International AB (publ.) CRN 556184-6691
We have audited the Annual Report and the consolidated financial statements of OEM International AB for the year ended 31 December 2023, with the exception of the Corporate Governance Statement on pages 3641. The company's Annual Report and consolidated financial statements are presented on pages 30-86 of this document.
In our opinion, the Annual Report has been prepared as required by the Swedish Annual Accounts Act and presents fairly, in all material respects, the financial position of the Parent Company at 31 December 2023, and its financial performance and its cash flows for the year, in accordance with the Swedish Annual Accounts Act. The consolidated financial statements have been prepared as required by the Swedish Annual Accounts Act and present fairly, in all material respects, the financial position of the Group at 31 December 2023, and its financial performance and cash flows for the year, in accordance with the International Financial Reporting Standards (IFRS), as approved by the European Union, and the Swedish Annual Accounts Act. Our opinion does not cover the Corporate Governance Statement on pages 36-41.
The Directors' Report is consistent with the remainder of the Annual Report and the consolidated financial statements.
We therefore recommend that the General Meeting of Shareholders adopt the income statement and the balance sheet of the Parent Company and the Group's statement of income and statement of financial position.
Our opinions in this statement on the Annual Report and the consolidated financial statements are consistent with the content of the additional report that has been presented to the Parent Company's Audit Committee in compliance with Article 11 of the EU Audit Regulation No. 537/2014.
Basis for opinion
We conducted our audit in accordance with International Standards on Auditing (ISA) and generally accepted auditing standards in Sweden. Our responsibilities under these standards are described in more detail in the section “Responsibilities of the auditors”. We are independent of the Parent Company and the Group in accordance with generally accepted auditing standards in Sweden and we have fulfilled our other ethical responsibilities in accordance with these requirements. This means that, to the best of our knowledge and belief, no prohibited non-audit services as referred to in Article 5.1 of the European Regulation on specific requirements regarding statutory audit of public interest entities (No. 537/2014) have been provided to the audited entity or, where applicable, to its Parent Company or its regulated entities within the EU.
We believe that the audit evidence we have obtained is sufficient and appropriate to provide a basis for our opinion.
Our audit approach
The objective and scope of the audit
When designing our audit procedures, we set the materiality threshold and assessed the risks of material misstatement in the financial state-
Inventory
As at 31 December 2023, the value of inventory in the Group is SEK 1,084.9 million.
Inventory valuation always requires the application of a number of estimates and judgements. Because of this and the fact that the carrying amount is 37% of total consolidated assets, we have identified inventory valuation as a matter of particular significance in the financial statements.
Estimates and judgements are also required to calculate actual obsolescence caused by both slow-selling stock and
ments. In particular, we looked at areas where the Managing Director and the Board of Directors made subjective judgements, for example in respect of significant accounting estimates that involved making assumptions and considering forecasts about future events that are inherently uncertain. As in all audits, we also evaluated the risk of override of internal controls by the Managing Director and the Board of Directors, including consideration of whether there was evidence of systematic non-conformances that have given rise to the risk of material misstatement due to fraud.
We tailored the scope of our audit to ensure that we performed sufficient work to be able to give an opinion on the financial statements as a whole, taking into account the structure of the Group, the accounting processes and controls, and the industry in which the Group operates.
When planning our audit strategy and determining our audit scope for each entity, we utilised size, geographic spread and the specific risk criteria that each entity represents. The Group's operations are conducted in subsidiaries in over 10 countries, mainly in Europe. The subsidiaries in Sweden and Finland jointly account for a significant percentage of the Group's operations. It was natural and necessary to perform an audit for these entities. In addition to these entities, our Group audit has included entities in Norway, Poland, the UK and Ireland. The audit of the Group team was conducted in Sweden, Norway and Poland with the help of PwC's network. In Finland, the UK and Ireland, the audit was performed by local auditors.
The Group team has reviewed the work performed by all entity auditors to ensure that sufficient audit evidence has been gathered on which to base our opinions. Additionally, the Group team has reviewed the consolidated financial statements, information in the notes in the annual report and complex transactions, such as goodwill and acquisition analyses.
The scope and objective of our audit were influenced by our determination of materiality. An audit is designed to obtain reasonable assurance that the financial statements as a whole are free from material misstatement. Misstatements can arise from fraud or error. Misstatements are considered material if, individually or in the aggregate, they could reasonably be expected to influence the economic decisions of users taken on the basis of these financial statements.
Based on professional judgement, we set certain quantitative thresholds for materiality, including for the financial statements as a whole. These, together with qualitative considerations, helped us to determine the objectives and scope of our audit and the nature, timing and extent of our audit procedures, and to evaluate the effect of misstatements, both individually and in aggregate, on the financial statements as a whole.
Key audit matters are those matters that, in our professional judgement, were of most significance in our audit of the financial statements of the current period. These matters were addressed in the context of our audit of the financial statements as a whole, and in forming our opinion thereon, and we do not provide a separate opinion on these matters.
the lowest value principle. In certain cases, OEM may find it necessary to stock significant quantities in order to meet customer needs. This reduces inventory turnover rate and may increase the risk of obsolescence. OEM must thus make assumptions about future events when calculating the year's obsolescence on the value of the current inventory.
The Group's principles for measuring inventories are described in Note 1 on page 55 of the Annual Report. The Group explains what consideration has been given to obsolescence in Note 15.
Our audit procedures included a review of the Group's principles for cost calculation.
We also obtained an updated understanding of how processes and systems affect the warehousing process in each company.
As support for our audit, we analysed specific sets of data to enable us to collect and assess a large number of transactions to identify slow-moving and obsolete products, and measure against the obsolescence schedules applied by OEM as appropriate.
This document also contains other disclosures than the Annual Report and the consolidated financial statements and can be found on pages 1-29 and 90-95. This other information also comprises the remuneration report that we expect to receive after the date for this Auditor's Report. The Board of Directors and the Managing Director are responsible for the other disclosures.
Our opinion on the Annual Report and consolidated financial statements does not cover the other information and we do not express any form of assurance conclusion thereon.
In connection with our audit of the Annual Report and consolidated financial statements, our responsibility is to read the other information and, in doing so, consider whether the other information is materially inconsistent with the Annual Report and consolidated financial statements. In this procedure, we also take into account the knowledge we have otherwise obtained in the audit and assess whether the information otherwise appears to be materially misstated.
If, based on the work we have performed, we conclude that there is a material misstatement of this other information, we are required to report that fact. We have nothing to report in this regard.
The Board of Directors and the Managing Director are responsible for the preparation of the Annual Report and consolidated financial statements and for ensuring that they provide a true and fair view, as required by the Swedish Annual Accounts Act and, for the consolidated financial statements, in accordance with the International Financial Reporting Standards (IFRS) as approved by the European Union, and the Swedish Annual Accounts Act. The Board of Directors and the Managing Director are also responsible for such internal control as they determine necessary to enable preparation of an Annual Report and consolidated financial statements that are free from material misstatement, whether due to fraud or error.
In preparing the Annual Report and the consolidated financial statements, the Board of Directors and the Managing Director are responsible for the assessment of the company's and the Group's ability to continue as a going concern. They disclose, as applicable, matters that can impact the ability to continue as a going concern and to use the going concern basis of accounting. The Board of Directors and the Managing Director cannot use the going concern basis of accounting, however, if they intend to liquidate the company, cease trading or have no realistic alternative but to do so.
The Board's Audit Committee must oversee the company's financial reporting activities, without it affecting the responsibilities and duties of the Board.
Our objectives are to obtain reasonable assurance about whether the Annual Report and the consolidated financial statements as a whole are free from material misstatement, whether due to fraud or error, and to issue an auditor's report that includes our opinion. Reasonable assurance is a high level of assurance, but is not a guarantee that an audit conducted in accordance with ISAs and generally accepted auditing standards in Sweden will always detect a material misstatement when it exists. Misstatements can arise from fraud or error and are considered material if, individually or in the aggregate, they could reasonably be expected to influence the economic decisions of users taken on the basis of the Annual Report and the consolidated financial statements.
A more detailed description of our responsibilities for the audit of the
Using the data analysis we also assessed inventory for potential obsolescence caused by the principle of the lower of cost or market.
In addition, we asked corporate management a series of questions and reviewed Board meeting minutes in order to identify projected changes in the companies' sales that could result in inventory items becoming obsolete.
We assessed the adequacy and correctness of the disclosures provided in the Annual Report.
Annual Report and the consolidated financial statements can be found on the website of the Swedish Inspectorate of Auditors: www.revisorsinspektionen.se/revisornsansvar. This description is part of the Auditor's Report.
The auditor's management audit and proposal for allocation of the company's profit or loss
In addition to our audit of the Annual Report and the consolidated financial statements, we have also audited the administration of the Board of Directors and the Managing Director of OEM International AB for the year 2023 and the proposed appropriations of the company's profit or loss.
We recommend that the General Meeting of Shareholders appropriate the profit as proposed in the Directors' Report and grant the members of the Board and the Managing Director discharge from liability for the financial year.
We have conducted our audit in compliance with generally accepted auditing standards in Sweden. Our responsibility under this practice is described in more detail in the section “Responsibilities of the auditors”. We are independent of the Parent Company and the Group in accordance with generally accepted auditing standards in Sweden and we have fulfilled our other ethical responsibilities in accordance with these requirements.
We believe that the audit evidence we have obtained is sufficient and appropriate to provide a basis for our opinion.
The Board of Directors is responsible for the proposal for appropriations of the company's profit or loss. A proposal for a dividend payout includes an assessment of whether the dividend is justifiable considering the requirements placed by the company's and the Group's type of operations, size and risks on the size of the Parent Company's and the Group's equity, consolidation requirements, liquidity and position in general.
The Board is responsible for the company's organisation and management of the company's affairs. This involves regularly assessing the company's and the Group's financial situation and ensuring that the company's organisation is structured to allow satisfactory controls of its accounts, funds management and financial affairs in general. The Managing Director is in charge of day-to-day management in accordance with guidelines and instructions from the Board of Directors and is responsible for taking necessary measures to ensure that the company's accounts are prepared in accordance with legal requirements and that funds management is controlled in a satisfactory manner.
Our objective concerning the audit of the management of the company's affairs, and thereby our opinion about discharge from liability, is to obtain audit evidence to ascertain, with a reasonable degree of assurance, whether any Board member or the Managing Director, in any material respect: has undertaken any action or been guilty of any omission which can give rise to liability to the company, or has acted in any other way in violation of the Swedish Companies Act, the Swedish Annual Accounts Act or the Articles of Association.
Our objective concerning the audit of the proposed appropriations of the company's profit or loss, and thereby our opinion on this, is to ascer-
tain, with a reasonable degree of assurance, whether the proposal is in accordance with the Swedish Companies Act.
Reasonable assurance is a high level of assurance, but is not a guarantee that an audit conducted in accordance with generally accepted auditing standards in Sweden will always detect actions or omissions that can give rise to liability to the company, or that a proposal for profit or loss distribution is not in accordance with the Swedish Companies Act.
A more detailed description of our responsibilities for the audit of the management of the company's affairs can be found on the website of the Swedish Inspectorate of Auditors: www.revisorsinspektionen.se/revisornsansvar. This description is part of the Auditor's Report.
Opinion
In addition to our audit of the Annual Report and the consolidated financial statements, we have also examined that the Board of Directors and the Managing Director have prepared the Annual Report and the consolidated financial statements in a format that enables uniform electronic reporting (the ESEF report) pursuant to Chapter 16 Section 4 a of the Swedish Securities Market Act (2007:528) for OEM International AB for the 2023 financial year.
Our examination and our opinion relate only to the statutory requirement.
In our opinion, the ESEF report has been prepared in a format that, in all material respects, enables uniform electronic reporting.
We have performed the review in accordance with FAR's recommendation RevR 18 The Auditor's review of the ESEF report. Our responsibility according to this recommendation is described in more detail under Auditors' responsibility. We are independent of OEM International AB in accordance with generally accepted auditing standards in Sweden and we have fulfilled our other ethical responsibilities in accordance with these requirements.
We believe that the evidence we have obtained is sufficient and appropriate to provide a basis for our opinion.
The Board of Directors and the Managing Director are responsible for ensuring that the ESEF report has been prepared in accordance with Chapter 16 Section 4 a of the Swedish Securities Market Act (2007:528), and for such internal control as the Board of Directors and the Managing Director determine necessary to enable preparation of the ESEF report without material misstatement, whether due to fraud or error.
Our responsibility is to express an opinion, with a reasonable level of assurance, on whether the ESEF report has, in all material respects, been prepared in a format that meets the requirements of Chapter 16 Section 4 a of the Swedish Securities Market Act (2007:528), based on the procedures we have performed.
RevR 18 requires us to plan and execute our audit procedures in order to achieve a reasonable level of assurance that the ESEF report has been prepared in a format that meets these requirements.
Reasonable assurance is a high level of assurance, but is not a guarantee that a review conducted in accordance with RevR 18 and generally accept-
ed auditing standards in Sweden will always detect a material misstatement when it exists.
Misstatements can arise from fraud or error and are considered material if, individually or in the aggregate, they could reasonably be expected to influence the economic decisions of users taken on the basis of the ESEF report.
The audit firm applies the International Standard on Quality Management 1, which requires the company to design, implement and operate a quality control system that includes guidelines or procedures for compliance with professional ethical requirements, standards of professional practice and applicable laws, regulations and other requirements.
The audit involves performing a variety of procedures to obtain sufficient evidence that the ESEF report has been prepared in a format that enables uniform electronic reporting of the Annual Report and consolidated financial statements.
The auditor decides which procedures to use, by assessing the risks of material misstatement in the report, whether due to fraud or errors. In making those risk assessments, the auditor considers the components of the internal control that are relevant to how the Board of Directors and the Managing Director prepare the information, in order to design audit procedures that are appropriate in the circumstances, but not for the purpose of expressing an opinion on the effectiveness of the internal control.
The assurance engagement also includes an evaluation of the appropriateness and reasonableness of the assumptions made by the Board of Directors and the Managing Director.
The procedures mainly include a validation that the ESEF report has been prepared in a valid XHTML format and a reconciliation of the ESEF report with the audited annual report and consolidated financial statements.
Furthermore, the procedures include an assessment of whether the Group's income statement, balance sheet, equity statement, cash flow statements and notes in the ESEF report have been marked with iXBRL in compliance with the requirements of the ESEF Regulation.
The Board of Directors is responsible for the Corporate Governance Statement on pages 36-41 and for ensuring that it has been prepared in accordance with the Swedish Annual Accounts Act.
Our review has been carried out in accordance with FAR's auditing standard RevR 16 The Auditor's review of the Corporate Governance Statement. This means that our review of the Corporate Governance Statement has a different objective and is substantially less in scope than the objective and scope of an audit conducted in accordance with International Standards on Auditing and generally accepted auditing standards in Sweden. We believe that this review provides sufficient basis for our opinions.
A Corporate Governance Report has been prepared. Disclosures in accordance with Chapter 6, Section 6, paragraph 2, items 2–6 of the Swedish Annual Accounts Act and Chapter 7, Section 31, paragraph 2 of the same Act are consistent with the remainder of the Annual Report and the consolidated financial statements, and are in accordance with the Swedish Annual Accounts Act.
Öhrlings PricewaterhouseCoopers AB, Torsgatan 21, 113 97 Stockholm, was appointed OEM International AB's auditor by the General Meeting of Shareholders on 18 April 2023 and has been the company's auditor since 3 June 2019.
Jönköping, date shown in our electronic signature
Frida Wengbrand
Authorised Public Accountant
OEM's shares were launched on the Stockholm Stock Exchange's OTC List in December 1983 and the growth in the share price has been good since then. An investor who purchased 100 shares in OEM for SEK 12,500 at the initial public offering would have a holding of 43,200 shares worth SEK 4,532,200 on 31 December 2023. OEM's shares were transferred to the O List in 2000 and its shares have been trading on the NASDAQ Nordic Small Cap market since 2006. The shares were transferred to the NASDAQ Nordic Mid Cap market in 2014.
Price trends
The price of OEM International shares rose 42% during the year from SEK 74.20 to a closing price of SEK 105.40. During the year, the Stock Exchange's index for Nasdaq Stockholm_PI fell 14%. The highest price paid during the year was SEK 107.80 on 15 December. The lowest price paid during the year was SEK 66.20 on 25 October. OEM's market value at the close of 2023 was SEK 14,652 million.
Sales
In 2023, 15,821,173 Class B shares (11,343,948) corresponding to a turnover rate of 11% (8%). The average shareholder in OEM therefore retains shares for about 9 (13) years.
OEM's Class B shares were sold on 100% (100%) of the trading days. The average daily turnover in 2023 was 62,782 shares (44,838). As at 30 December 2023, OEM International had 8,245 shareholders (6,609). Institutional ownership is approximately 47% (50%) and foreign ownership is 15% (15%).
The repurchase programme for shares, which was adopted for the first time by the Annual General Meeting in 2000, is intended to improve the company's capital structure and contribute positively to return on shareholders' equity and earnings per share. After implemented reductions the previous year there are 139,015,854 shares in the company at year-end. In 2011, the company repurchased 371,082* shares at an average price of SEK 8.88*. The company had a holding of 371,082* shares at the end of the year. The Board has been authorised by the Annual General Meeting to repurchase up to 10% of the total number of shares, i.e. 13,015,585
* Corrected with regard to previously implemented share splits.
shares. The objective is to continue the repurchases up to 10% of the total number of shares wherever the Board considers the conditions to be attractive. The acquired shares will be retained, deregistered or used as payment in corporate acquisitions. The disadvantage that this can entail, that the number of shareholders decreases and the liquidity of the share declines, has been minimised by mainly making repurchases of large blocks of shares.
OEM International has signed an agreement with ABG Sundal Collier ASA regarding liquidity guarantees for company shares. The aim is to reduce the difference between purchase and sales prices. The goal is to achieve a lower investment cost and to lower the share trading risk for present and future shareholders. Commitments fall within the scope of the NASDAQ Nordic Stock Exchange system with liquidity guarantees and started on 1 December 2004.
The Board of OEM International aims to propose a reasonable dividend of profits to the shareholders, by considering the financial position and any need for acquisitions or investments in the operations.
The Board proposes a dividend of SEK 1.75 per share (1.50).
OEM aims to maintain high quality as regards information to the market and the media. The goal is for the information to facilitate an accurate valuation and liquid trading of the shares. The dates for the Annual General Meeting, interim reports and annual report for the 2024 financial year are shown on page 95 of this Annual Report.
Financial information is also published on the Group's website (www. oem.se).
The company offers shareholders the opportunity to receive interim reports and other press releases by e-mail, at the same time as they are made public to the market. These can be requested through application via the Group's website (www.oem.se).
The company's holding of 371,082 Class B shares is not included in the above break-down. The purpose is to provide a clear overview of the various shareholders' interests in the company
Shareholder statistics At 30 Dec 2023*
The total number of shareholders in OEM is 8,245.
* Source: Monitor by Modular Finance AB. Data compiled and processed from Euroclear, Morningstar, the Swedish Financial Supervisory Authority and others. Ownership data shown in the table may be a combination of several entries with the purpose of illustrating the total ownership in OEM of an institution or private individual.
* Calculated on total number of shares.
Direct return
Dividend per share divided by the quoted price at end of year.
EBIT multiple
Enterprise value divided by operating profit after depreciation/ amortisation.
EBITA*
Operating profit before amortisation of acquisition-related intangible fixed assets.
EBITA margin
EBITA as a percentage of net sales.
Shareholders' equity per share
Shareholders' equity divided by the average number of shares.
EV/Sales
Enterprise values (market value + net debt) divided by net sales.
Capital turnover rate
Net sales divided by total assets.
Cash flow per share
Operating cash flows divided by the average number of shares.
Quick ratio
Current assets less inventories divided by current liabilities.
Price/Shareholders' equity
Quoted price divided by shareholders' equity per share.
Net sales per share
Net sales divided by the number of shares on the market at end of year.
Net sales per employee
Net sales divided by average number of employees.
Net sales increase per share
Increase of the net sales per share.
Net debt
Interest-bearing liabilities less cash and cash equivalents.
Rate of turnover for shares
The number of shares traded over the year divided by the number of shares outstanding at year-end.
* In addition to the conventional financial performance measures established by IFRS, OEM uses the terms Organic growth and EBITA/ EBITA margin, the definitions of which are given above. The reason is that OEM wants to provide clearer comparability of sales performance between periods, without the effects of currency movements or acquisitions, and to be able to summarise the companies' operations with regard to profit and margins, excluding amortisation and depreciation that arose on acquisition.
Organic growth*
The change in total revenue in the period, adjusted for acquisitions, sales and currency movements, measured against the total revenue in the comparative period.
P/E ratio
Quoted price as per 31 December divided by earnings per share.
P/S ratio
Stock market value in relation to net sales.
Return on equity
Profit for the year divided by average shareholders' equity.
Return on capital employed
EBITA plus finance income as a percentage of average capital employed.
Total capital return
EBITA plus finance income as a percentage of average total capital.
Interest coverage ratio
Operating profit for the year plus finance income in relation to interest expense.
Operating margin
Operating profit as a percentage of net sales.
Debt/equity ratio
Interest-bearing liabilities divided by shareholders' equity.
Equity/assets ratio
Shareholders' equity as a percentage of total capital.
Capital employed
Total assets minus non-interest-bearing liabilities and provisions.
Dividend/Shareholders' equity
Dividends in relation to the Group's shareholders' equity.
Dividend/Profit payout ratio
Dividends in relation to profit/loss for the year.
Earnings per share
The profit or loss for the year divided by the average number of shares.
Profit margin
Profit/loss before tax as a percentage of sales.
OEM's strategy for property holdings is to own and manage real estate for the Group's own operations. This takes place primarily through self-owned real estate companies renting out premises to the Group's subsidiaries.
Any excess capacity in the properties is leased to external parties to secure a return on invested capital.
OEM currently owns real estate in Sweden, Finland, Denmark and the UK. Where rental property offers the best alternative for operations, premises are rented from an external party.
OEM strives to offer the Group's operations efficient premises that are suited to the purpose and offer good development potential. OEM is strongly committed to implementing sustainable solutions with the goal of reducing energy consumption and its carbon

footprints. As part of this commitment, it invests in solar panels on the properties it owns. More solar panels will be installed on the properties in Finland and Denmark in 2024. Several Group companies use renewable electricity in their business premises.
In addition to this, the climate impact of existing properties and buildings are
mapped with regard to heating, cooling and lighting to achieve energy savings. On-going energy efficiency projects include drilling more boreholes and installing more heat pumps, replacing old ventilation systems, replacing fluorescent light fixtures with LED in all properties, and installing high-speed sliding doors.


Requirements for participation
Shareholders wishing to attend the Meeting must:
• be entered in the share register held by Euroclear Sweden AB by 15 April 2024 at the latest; if the shares are held in a nominee account, contact the nominee to request that the shareholding be entered on the share register for entitlement to vote by 16 April 2024 at the latest, and
• notify the company by 16 April 2024 at the latest at this address:
OEM International AB, Box 1009, SE-573 28 TRANÅS, Sweden
Tel: +46 (0)75-242 41 19 or by e-mail: ir@oem.se
When notifying OEM of their attendance, shareholders should state their name, personal identity number (company registration number), address, phone number, their shareholding and the names of any proxies.
Shareholders who have registered their shares in the name of an authorised agent must temporarily register the shares in their own name with Euroclear Sweden AB by Friday 16 April 2024 to be entitled to attend and vote at the Annual General Meeting.
If participation is by proxy with power of attorney, the original power of attorney document
Future reports
and any authorisation documents must be sent to the company in good time before the Annual General Meeting. A representative of a legal entity must also submit a signed copy of a registration certificate or equivalent authorisation document to show that they may represent the legal entity. Shareholders who wish to be represented by proxy may obtain a power of attorney form from the company's head office or its website www.oem.se no later than 26 March 2024.
The Board of Directors is proposing a dividend of SEK 1.75 per share for the financial year 2023 and Thursday 25 April 2024 as the record date, for approval by shareholders at the Annual General Meeting. The dividend, if approved at the Annual General Meeting, will be paid on Tuesday 30 April 2024 to shareholders on the share register on the record date.
A notice stating the agenda and business of the Annual General Meeting will be published in the daily press and will be available on OEM's website, (www.oem.se).
The agenda can also be obtained from the company when registering to attend the Meeting.
Interim report – January - March 23 April 2024
Interim report – January - June 12 July 2024
Interim report – January - September 15 October 2024
Financial Statement 2024 19 February 2025
Region Sweden
OEM Automatic AB
Box 1011, Dalagatan 4
573 28 TRANÅS, Sweden
Tel +46-75-242 41 00
E-mail info@oemautomatic.se
Website www.oemautomatic.se
OEM Motor AB
Box 1011, Fredriksbergsgatan 2
573 28 TRANÅS, Sweden
Tel +46-75-242 44 00
E-mail info@oemmotor.se
Website www.oemmotor.se
Telfa AB
Box 1011, Fredriksbergsgatan 2
573 28 TRANÅS, Sweden
Tel +46-75-24 24 450
E-mail info@telfa.se
Website www.telfa.se
Svenska Batteripoolen AB
Box 1011, Fredriksbergsgatan 2
573 28 TRANÅS, Sweden
Tel +46-75-24 24 300
E-mail kundsupport@batteripoolen.se
Website www.batteripoolen.se
Elektro Elco AB
Tallvägen 5
564 35 BANKERYD, Sweden
Tel +46-36-290 60 00
E-mail elektro@elco.se
Website www.elco.se
Nexa Trading AB
Datavägen 37 B
436 32 ASKIM, Sweden
Tel: +46-31-14 13 80
E-mail: info@nexa.se
Website: www.nexa.se
Ingemar Liljenberg AB
Mobilgatan 6
235 39 Vellinge, Sweden
Tel +46 40 59 22 90
E-mail info@liljenberg.se
Website www.liljenberg.se
OEM Electronics AB
Box 1025, Förrådsvägen 2
573 29 TRANÅS, Sweden
Tel +46-75-242 45 00
E-mail info@oemelectronics.se
Website www.oemelectronics.se
Region Finland, the Baltic states and China
OEM Automatic (Shanghai) Co., Ltd
Room 117, Building 8
Shanghai Zhongtian Science & Technology Business Park, 787 KangQiao Rd
SHANGHAI 201315, P.R. of China
Tel +86-21-3331 1200
E-mail info@oemautomatic.cn
Website www.oemautomatic.cn
OEM Automatic FI
Box 9, 20101 TURKU
Fiskarsinkatu 3, 20750 TURKU, Finland
Tel +358-207 499 499
E-mail info@oem.fi
Website www.oem.fi
Akkupojat Oy
Satakunnankatu 38
28130 PORI, Finland
Tel +358 2 631 8600
E-mail akkupojat@akkupojat.fi
Website www.akkupojat.fi
OEM Electronics FI
Box 9, 20101 TURKU
Fiskarsinkatu 3, 20750 TURKU, Finland
Tel +358-207 499 499
E-mail info@oem.fi
Website www.oemelectronics.fi
Internordic Bearings AB
Box 105, Lerbacksgatan 3
571 22 NÄSSJÖ, Sweden
Tel +46-75-242 49 40
E-mail info@internordic.com
Website www.internordic.com
Svenska Helag AB
Box 6, Dalagatan 4
573 21 TRANÅS, Sweden
Tel +46-75-242 46 00
E-mail helag@helag.se
Website www.helag.se
Lagermetall AB
Boskärsgatan 23, 702 25 Örebro Sweden
Tel +46 19 20 96 60
E-mail brons@lagermetall.se
Website www.lagermetall.se
Agolux AB
Box 6, Dalagatan 4
573 21 TRANÅS, Sweden
Tel +46-75-242 45 50
E-mail kundsupport@agolux.se
Website www.agolux.se
ATC Tape Converting AB
Box 575, Veddestavägen 17
175 26 JÄRFÄLLA, Sweden
Tel +46-8-564 708 80
E-mail info@atc.se
Website www.atc.se
AB Ernst Hj. Rydahl Bromsbandfabrik
Box 12, Brisgatan 19, 651 02 KARLSTAD, Sweden
Tel +46-10-550 94 00
E-mail mail@rydahls.se
Website www.rydahls.se
IBEC
Aartsdijkweg 111 NL-2676 LE MAASDIJK, the Netherlands
Tel +31-174 52 51 00
E-mail info@ibec.cn
Website www.ibec.cn
Rauheat Oy
Kirvestie 1
26510 Rauma, Finland
Tel +358 2 54 90 400
E-mail rauheat@rauheat.fi
Website www.rauheat.fi
OEM Automatic Oü
Aia 8
80010 PÄRNU, Estonia
Tel +372-5059 849
E-mail info@oem.ee
Website www.oem.ee
Region Denmark, Norway, the British Isles and East Central Europe
OEM Automatic AS
Postboks 2144 STRØMSØ
Bjørnstjerne Bjørnsonsgate 110 3003 DRAMMEN, Norway
Tel +47-32 21 05 05
E-mail post@oem.no
Website www.oem.no
OEM Automatic Klitsø A/S
Engholm Parkvej 4 3450 ALLERØD, Denmark
Tel +45-70 10 64 00
E-mail info@oemklitso.dk
Website www.oemklitso.dk
OEM Automatic Ltd
Whiteacres Cambridge Road
Whetstone, LEICESTER LE8 6ZG
UK
Tel +44-116 284 99 00
E-mail information@uk.oem.se
Website: www.oem.co.uk
Zoedale Ltd
Priory Business Park, Stannard Way Bedford MK44 3 WG, UK
Tel +44-1234 83 28 32
E-mail enquiries@zoedale.co.uk
Website: www.zoedale.co.uk
Demesne Electrical Sales
The Square Industrial Complex
Tallaght, Dublin 24, D24 ED71, Ireland
Tel +353 1-4047777
E-mail sales@demesne.ie
Website: www.demesne.ie
OEM Automatic Sp. z o.o.
ul. Działkowa 121A 02-234 WARSAW, Poland
Tel +48-22-863 27 22
E-mail info@pl.oem.se
Website www.oemautomatic.pl
OEM Electronics PL
ul. Działkowa 121A, 02-234 WARSAW, Poland
Tel +48-22-863 27 22
E-mail info@pl.oem.se
Website www.oemelectronics.pl
OEM Automatic SIA
Vilandes 3-3 1010 RIGA, Latvia
Tel +372-5295 114
E-mail info@oemautomatic.lv
Website www.oemautomatic.lv
OEM Automatic UAB Raudondvario str. 101, 47184 KAUNAS, Lithuania
Tel +370-64015 878
E-mail info@oem.lt
Website www.oem.lt
OEM Automatic spol. s r.o.
Prazska 239, 250 66 ZDIBY, Czech Republic
Tel +42-0-241 484 940
E-mail: info@oem-automatic.cz
Website www.oemautomatic.cz
OEM Automatic, s.r.o.
Bratislavska 8356, 917 01 TRNAVA, Slovakia
Tel +421-33-2400-160
E-mail info@oem-automatic.sk
Website www.oemautomatic.sk
OEM Automatic Kft. P.O. Box: 111, Gyár u. 2
2058 BUDAÖRS, Hungary
Tel +36-23-880 895
E-mail info@oemautomatic.hu
Website www.oemautomatic.hu
OEM International
Box 1009, Förrådsvägen 2
573 28 TRANÅS, Sweden
Tel +46-75-242 40 00
E-mail info@oem.se
Website www.oem.se
www.oem.se