206
South Africa After a strong rebound in 2021, GDP is projected to grow by 1.8% and 1.3% in 2022 and 2023 respectively. Household consumption and investment will remain the main drivers of growth. Household income will benefit from the continuation of the COVID-relief grant. The commodity prices boom will support exports. Investment will continue to strengthen over the projection horizon. Inflation reached close to 6% in early 2022, and is projected to increase further due to higher energy prices before starting to fall. The budget situation has improved, underpinned by the government revenue recovery and commodity price windfalls. Nonetheless, the government should maintain a solid consolidation policy to put debt on a more sustainable path and target spending increases on lifting potential growth and preserving social stability. In particular, spending on electricity generation, infrastructure and social grants remains essential. Further interest rate rises may be required to prevent inflation drifting away from the target band. The recovery is under way but risks are on the downside Quarterly sub-indicators point to a relatively strong growth in the first quarter of 2022. Manufacturing production rose by 4.6% in the first quarter of 2022. Retail trade sales remained robust, growing by 1.9% quarter-on-quarter. Electricity generation increased by 2% in the first quarter of 2022 contributing slightly to improving production conditions. Mining is expected to subtract from GDP in the first quarter of 2022, following a contraction in production of 1.5% quarter-on-quarter. Headline inflation reached 5.9% in March and April, well above the Reserve Bank midpoint objective in the target band of 3-6%.
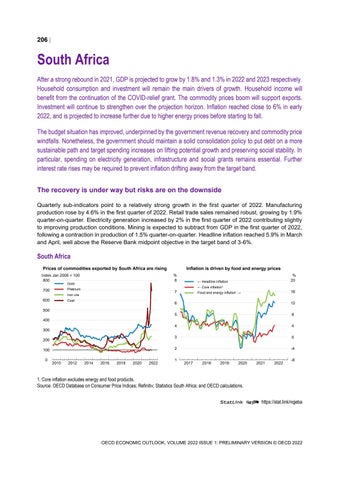
South Africa Prices of commodities exported by South Africa are rising Index Jan 2006 = 100 800 Gold
7
Iron ore
600
% 20
← Headline inflation ← Core inflation¹
Platinum
700
Inflation is driven by food and energy prices % 8
Coal
500
16
Food and energy inflation →
6
12
5
8
4
4
3
0
2
-4
400 300 200 100 0
2010
2012
2014
2016
2018
2020
2022
0
1
2017
2018
2019
2020
2021
2022
-8
1. Core inflation excludes energy and food products. Source: OECD Database on Consumer Price Indices; Refinitiv; Statistics South Africa; and OECD calculations. StatLink 2 https://stat.link/nqjeba
OECD ECONOMIC OUTLOOK, VOLUME 2022 ISSUE 1: PRELIMINARY VERSION © OECD 2022