197
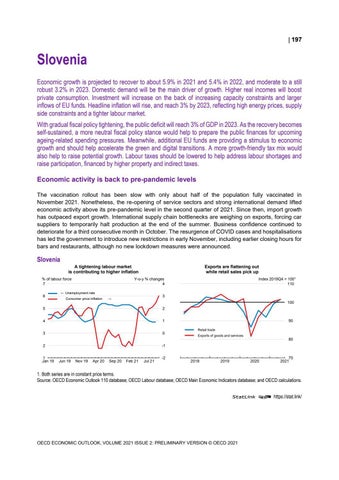
Slovenia Economic growth is projected to recover to about 5.9% in 2021 and 5.4% in 2022, and moderate to a still robust 3.2% in 2023. Domestic demand will be the main driver of growth. Higher real incomes will boost private consumption. Investment will increase on the back of increasing capacity constraints and larger inflows of EU funds. Headline inflation will rise, and reach 3% by 2023, reflecting high energy prices, supply side constraints and a tighter labour market. With gradual fiscal policy tightening, the public deficit will reach 3% of GDP in 2023. As the recovery becomes self-sustained, a more neutral fiscal policy stance would help to prepare the public finances for upcoming ageing-related spending pressures. Meanwhile, additional EU funds are providing a stimulus to economic growth and should help accelerate the green and digital transitions. A more growth-friendly tax mix would also help to raise potential growth. Labour taxes should be lowered to help address labour shortages and raise participation, financed by higher property and indirect taxes. Economic activity is back to pre-pandemic levels The vaccination rollout has been slow with only about half of the population fully vaccinated in November 2021. Nonetheless, the re-opening of service sectors and strong international demand lifted economic activity above its pre-pandemic level in the second quarter of 2021. Since then, import growth has outpaced export growth. International supply chain bottlenecks are weighing on exports, forcing car suppliers to temporarily halt production at the end of the summer. Business confidence continued to deteriorate for a third consecutive month in October. The resurgence of COVID cases and hospitalisations has led the government to introduce new restrictions in early November, including earlier closing hours for bars and restaurants, although no new lockdown measures were announced.
Slovenia A tightening labour market is contributing to higher inflation % of labour force 7 6
Exports are flattening out while retail sales pick up
Y-o-y % changes 4
← Unemployment rate Consumer price inflation
3
→
100
5
2
4
1
3
0
2
-1
1 Jan 19
Jun 19
Nov 19
Apr 20
Sep 20
Index 2019Q4 = 100¹ 110
Feb 21
Jul 21
-2
90 Retail trade Exports of goods and services
0
2018
2019
80
2020
70 2021
1. Both series are in constant price terms. Source: OECD Economic Outlook 110 database; OECD Labour database; OECD Main Economic Indicators database; and OECD calculations. StatLink 2 https://stat.link/
OECD ECONOMIC OUTLOOK, VOLUME 2021 ISSUE 2: PRELIMINARY VERSION © OECD 2021