194
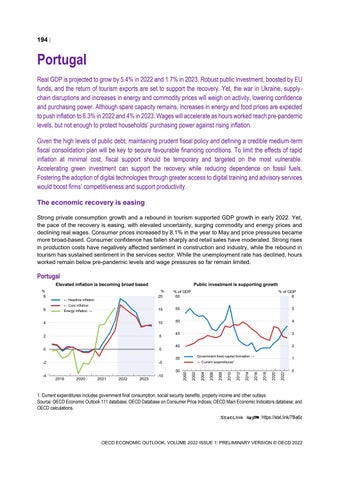
Portugal Real GDP is projected to grow by 5.4% in 2022 and 1.7% in 2023. Robust public investment, boosted by EU funds, and the return of tourism exports are set to support the recovery. Yet, the war in Ukraine, supplychain disruptions and increases in energy and commodity prices will weigh on activity, lowering confidence and purchasing power. Although spare capacity remains, increases in energy and food prices are expected to push inflation to 6.3% in 2022 and 4% in 2023. Wages will accelerate as hours worked reach pre-pandemic levels, but not enough to protect households’ purchasing power against rising inflation. Given the high levels of public debt, maintaining prudent fiscal policy and defining a credible medium-term fiscal consolidation plan will be key to secure favourable financing conditions. To limit the effects of rapid inflation at minimal cost, fiscal support should be temporary and targeted on the most vulnerable. Accelerating green investment can support the recovery while reducing dependence on fossil fuels. Fostering the adoption of digital technologies through greater access to digital training and advisory services would boost firms’ competitiveness and support productivity. The economic recovery is easing Strong private consumption growth and a rebound in tourism supported GDP growth in early 2022. Yet, the pace of the recovery is easing, with elevated uncertainty, surging commodity and energy prices and declining real wages. Consumer prices increased by 8.1% in the year to May and price pressures became more broad-based. Consumer confidence has fallen sharply and retail sales have moderated. Strong rises in production costs have negatively affected sentiment in construction and industry, while the rebound in tourism has sustained sentiment in the services sector. While the unemployment rate has declined, hours worked remain below pre-pandemic levels and wage pressures so far remain limited.
Portugal Elevated inflation is becoming broad based % 8
Public investment is supporting growth % 20
← Headline inflation ← Core inflation
% of GDP 60
% of GDP 6
15
55
5
4
10
50
4
2
5
45
3
0
0
40
2
-2
-5
2022
2020
2018
2016
-10
2014
2023
2012
2022
2010
2021
2008
2020
2006
2019
1
← Current expenditures¹
2004
30 -4
Government fixed capital formation →
35
2002
Energy inflation →
2000
6
0
1. Current expenditures includes government final consumption, social security benefits, property income and other outlays. Source: OECD Economic Outlook 111 database; OECD Database on Consumer Price Indices; OECD Main Economic Indicators database; and OECD calculations. StatLink 2 https://stat.link/78ia6z
OECD ECONOMIC OUTLOOK, VOLUME 2022 ISSUE 1: PRELIMINARY VERSION © OECD 2022