Sailing through rough waters


http://www.oecd.org/economy/lithuania-economic-snapshot/ Vilnius, 20 October 2022 2022 OECD ECONOMIC SURVEY OF LITHUANIA
MACROECONOMIC AND STRUCTURAL DEVELOPMENTS AND POLICIES
2
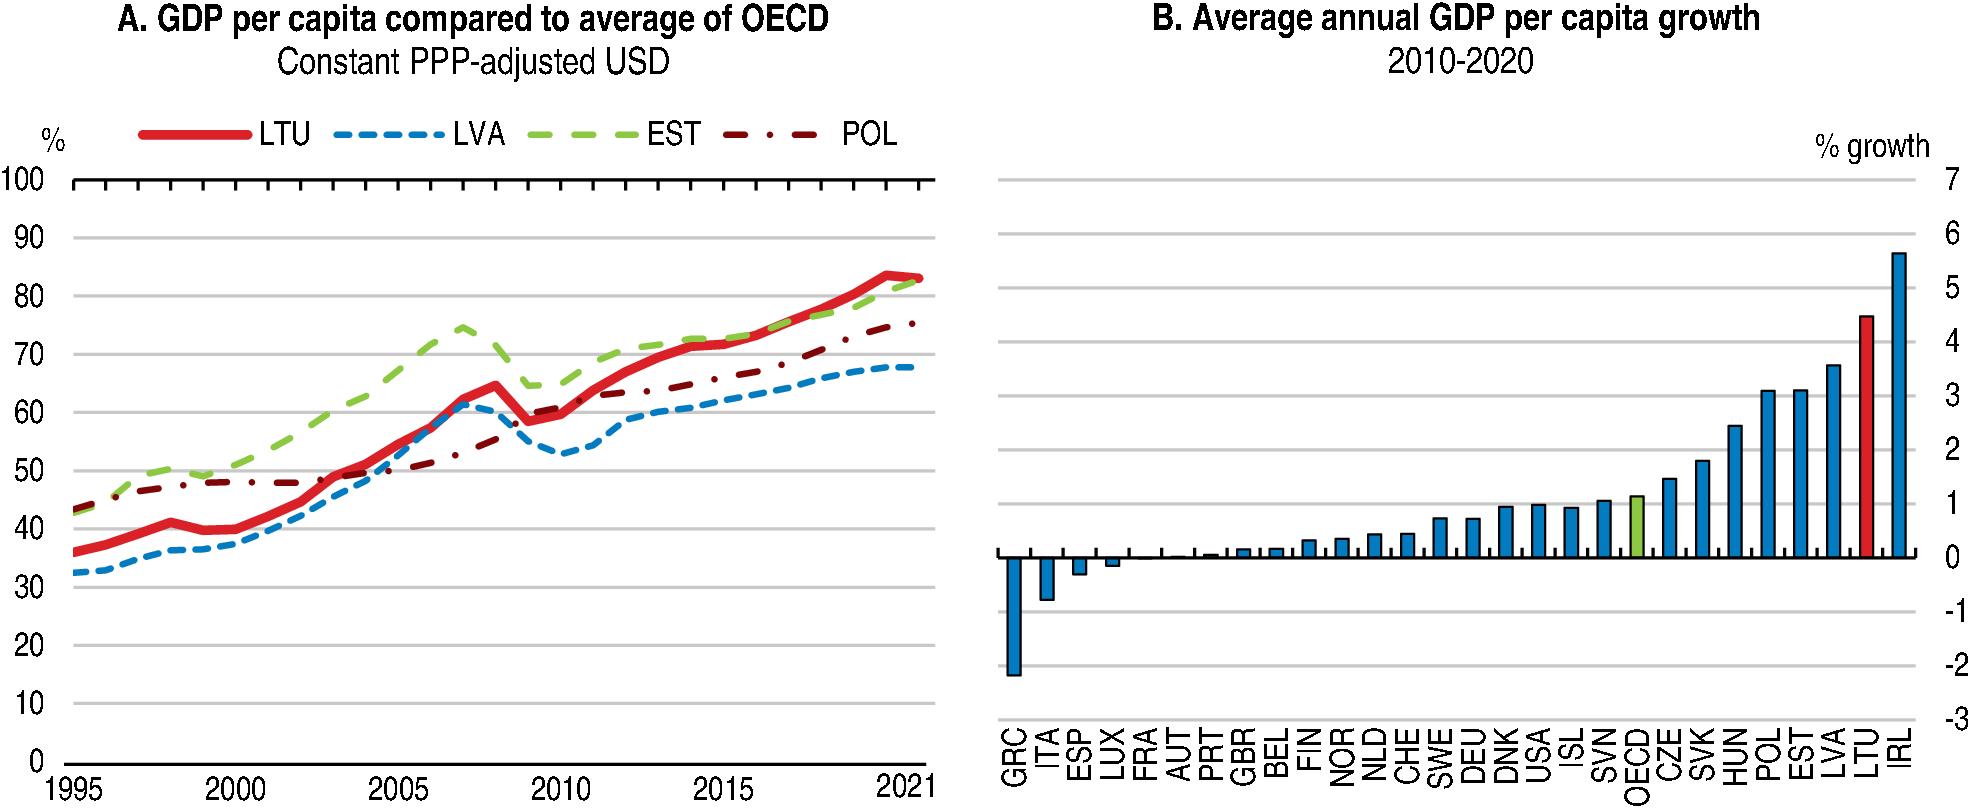
The Lithuanian economy has been growing fast

Note: In Panel B, growth rates are based on real GDP per capita.
3
Source: OECD Economic Outlook No. 111 database (Updated).
The war in Ukraine undermined the strong recovery from the pandemic
% changes
Y-o-y % changes
4
Source: OECD, National Accounts database. -15 -10 -5 0 5 10 15 -15 -10 -5 0 5 10 15 2014 2015 2016 2017 2018 2019 2020 2021 2022
Y-o-y
Real GDP Lithuania OECD 2022 Q2
Inflation has soared
% changes
Inflation
Consumer Price Indices
Consumer price index
% changes
5
Note:
data for September are provisional. Source: OECD,
database. -5 0 5 10 15 20 25 -5 0 5 10 15 20 25 2014 2015 2016 2017 2018 2019 2020 2021 2022 Y-o-y
Y-o-y
Lithuania Euro area
Real wages face pressures
Real wages Index, 2005Q1 = 100
Real wages correspond to nominal wage rate deflated by consumer price index (CPI).
OECD Economic Outlook No. 111 database (updated).
6
80 100 120 140 160 180 200 80 100 120 140 160 180 200 2006 2008 2010 2012 2014 2016 2018 2020 2022
Note:
Source:
Productivity accelerated significantly
Productivity growth
7
Source: OECD, National Accounts database. 100 110 120 130 140 100 110 120 130 140 2010 2011 2012 2013 2014 2015 2016 2017 2018 2019 2020 2021 2010 = 1002010 = 100
Unemployment is falling and labour force participation is rising
market
8
60 65 70 75 80 0 5 10 15 20 2010 2012 2014 2016 2018 2020 2022 % of working-age population s.a.% of labour force, s.a. Labour
4-quarter moving average ←Unemployment rate Labour force participation rate → Source: Eurostat, Labour Force Statistics.
More people are immigrating than emigrating
Emigrants
International migration
international migration
9
Source: Statistics Lithuania. -100 000 -80 000 -60 000 -40 000 -20 000 0 20 000 40 000 60 000 -100 000 -80 000 -60 000 -40 000 -20 000 0 20 000 40 000 60 000 2000 2003 2006 2009 2012 2015 2018 2021 PersonsPersons
Immigrants Net
Growth will slow
10
1.Excludes food, energy, alcohol and tobacco. Source: OECD Economic Outlook 111 database (updated). 2020 2021 2022 2023 GDP growth at market prices 0.0 6.0 1.6 1.3 Unemployment rate 8.5 7.1 5.8 6.5 Harmonised index of core inflation1 2.6 3.4 9.8 7.8 General government gross debt (% of GDP) 55.5 51.4 52.8 55.1
Export performance has been solid
Export performance Index, 2005Q1
100
Note: Export performance reflects the growth of a country’s export markets compared to that of all other countries.
Source: OECD, National Accounts database.
11
80 100 120 140 160 180 200 80 100 120 140 160 180 200 2006 2008 2010 2012 2014 2016 2018 2020 2022
=
High-value exports are rising but remain below the OECD average
12
Source: OECD, Structural Analysis (STAN) database. 0 10 20 30 40 50 60 70 80 90 100 0 10 20 30 40 50 60 70 80 90 100 CHE IRL KOR JPN SVK ISR HUN DEU CZE SVN MEX LUX GBR BEL AUT FRA ITA USA SWE POL FIN NLD DNK TUR ESP EST CRI PRT ISL LTU CAN LVA GRC CHL COL NOR AUS NZL %% Exports by high, medium-high and medium R&D intensity, 2021 or latest High and medium-high Medium High, medium-high and medium, 2010
The financial system looks resilient
Non-performing loans by loan segment
Loans to non-financial corporations Loans for house purchase
Consumer loans
13
Source: Bank of Lithuania. 0 1 2 3 4 5 6 7 8 9 0 1 2 3 4 5 6 7 8 9 2016 2017 2018 2019 2020 2021 2022 %%
The fintech hub is vibrant
Fintech
Number of companies and employees
of fintech companies
Number of persons employed by fintech companies→
14
Source: Bank of Lithuania. 0 1000 2000 3000 4000 5000 6000 7000 0 50 100 150 200 250 300 350 2014 2015 2016 2017 2018 2019 2020 2021
←Number
Lithuania’s population will age rapidly
Note: The old age dependency ratio is the number of individuals aged 65 and more to the population aged between 15 and 64.
Source: United Nations, Department of Economic and Social Affairs, Population Division (2019). World Population Prospects 2019, Online Edition. Rev. 1.
15
0 10 20 30 40 50 60 70 0 10 20 30 40 50 60 70 2000 2010 2020 2030 2040 2050 2060 Old age dependency, %Old age dependency, % Old age dependency ratio, projections Lithuania OECD EU
Debt could rise significantly with population ageing
Gross government debt
% of GDP% of GDP
Historic Ageing cost scenario Ageing cost plus policy reform scenario
Primary balance at -0.5% of GDP scenario
Note: Debt projections until 2026 follow the fiscal plan as published in October 2021. The baseline scenario assumes a primary balance of minus 0.5% of GDP and the age structure of the population remaining the same. The “ageing cost scenario” adds public health, long-term care and pension spending obligations on top of the baseline scenario. The “ageing cost plus policy reform scenario” reflects the positive growth effects of reforms shown in Box 1.5, subtracted from the ageing cost scenario. Based on Guillemette et al. (2017).
OECD Economic Outlook No. 111 database; and OECD calculations.
16
Source:
0 20 40 60 80 100 120 140 160 0 20 40 60 80 100 120 140 160 2000 2010 2020 2030 2040 2050 2060
Raising the retirement age would help reduce spending pressures
Government spending on ageing
Health and long-term care
Public pensions
With reform of retirement age
. 17
Note: Debt projections until 2026 follow the fiscal plan as published in October 2021. Source: OECD Economic Outlook No. 111 database; and OECD calculations. 4.0 4.5 5.0 5.5 6.0 6.5 7.0 7.5 8.0 8.5 4.0 4.5 5.0 5.5 6.0 6.5 7.0 7.5 8.0 8.5 2020 2025 2030 2035 2040 2045 2050 2055 2060 % of GDP% of GDP
Local tax revenues are low
18
0 2 4 6 8 10 12 14 16 18 0 2 4 6 8 10 12 14 16 18 IRL EST LTU CZE SVK GRC AUT NLD LUX HUN GBR BEL PRT DEU ESP SVN OECD CHE POL ITA LVA FRA NOR FIN ISL DNK SWE % of GDP% of GDP Total tax revenues of local government 2020 Source: OECD, Global Revenue Statistics database.
Recommendations to improve financial and fiscal policies
• Tighten fiscal policy at an appropriate pace to help mitigate inflationary pressures.
• Ensure that support is targeted at vulnerable households and firms affected by high energy prices.
• Ensure that the budget deficit returns to a sustainable level over the medium term.
• Consider establishing an automatic link between the retirement age and life expectancy beyond the year 2026.
• Assign more own-source revenues to local government.
19
STRUCTURAL POLICIES
20
The state is active in many sectors
Involv. in network sectors
of SOEs
SOEs
control
controls
More stringent regulation
Note: Negative values reflect less stringent and positive values more stringent regulation. Green bars belong to the high-level indicator “Barriers to domestic and foreign entry”, while blue bars belong to the high-level indicator “Distortions induced by state involvement”.
OECD, Product Market Regulation database.
21
Source:
0 0.5 1 1.5 2 Price
Direct
Governance of
Scope
Gov’t
Distortions induced by state involvement, product market regulation gap with OECD average, 2018
Trust in government is relatively low
22
Source: OECD, Government at a Glance - 2021. -40 -20 0 20 40 60 80 100 -40 -20 0 20 40 60 80 100 LVA POL BEL SVK ITA ESP EST GRC FRA LTU CZE SVN GBR HUN IRL ISL PRT AUT DEU SWE DNK LUX NLD FIN NOR CHE %% Share of population that trusts government % in 2020 Percentage points change since 2007
Quality of institutions is below the OECD average
rights Security
governance
government
23
Source: World Economic Forum, Government Competitiveness Index 4.0. -15 -10 -5 0 5 Social capital Transparency Checks and balances Future orientation of
Corporate
Property
Institutions, overall Less competitive More competitive Institutional quality, gap to OECD countries
The fight against corruption is being strengthened
24
Source: World Bank, Worldwide Governance Indicators. 0 0.2 0.4 0.6 0.8 1 1.2 1.4 0 0.2 0.4 0.6 0.8 1 1.2 1.4 1996 1998 2000 2002 2004 2006 2008 2010 2012 2014 2016 2018 2020 Control of corruption Scale: -2.5 (higher) to 2.5 (lower corruption) Lithuania OECD EU
PISA outcomes have recently improved but remain below average
PISA scores by domain,
OECD average
Reading Science Mathematics
450 460 470 480 490 500 510 450 460 470 480 490 500 510 PISA 2006 PISA 2009 PISA 2012 PISA 2015 PISA 2018
2006-2018
25
Source: OECD, PISA 2018 database.
Small schools have weaker test scores
school test score
Note: Panel B: test scores are taken from standardised exams circulated to Grade 10 students and are scaled from one to 10.
Source: Ministry of Education, Science and Innovation; OECD Economic Survey of Lithuania, 2020.
26
2 3 4 5 6 7 8 2 3 4 5 6 7 8 Urban schools Rural schools Average
Under 200 students Over 500 students
Vocational education and training has little significance
Students in work- and school-based learning, share in upper-secondary education, 2018
School-based VET Firm-based VET Overall VET
Canada Chile Korea Japan Iceland (20-50%) Australia Lithuania Greece Spain (At least 35%) Ireland Mexico Sweden (60%) Hungary Denmark France (62-75%) Latvia (50%) Portugal (41-47%) Israel (25%) Estonia (18-25%) OECD average United Kingdom… Türkiye (50%) Germany (60%) Norway (50%) Italy Belgium Poland (46%) Luxembourg Switzerland (80%) Netherlands (70%) Slovak Republic Slovenia (22-50%) Austria (80%) Finland (8090%) Czech Republic
Note: Figures in parentheses refer to the most typical duration of the actual work-based component as a percentage of total programme duration. For example, in Germany, time spent at work accounts for about 60% of total programme duration, while the remainder is spent at school.
Source: OECD, Education at a Glance database. For the Czech Republic and Lithuania, data rely on European Centre for the Development of Vocational Training (CEDEFOP).
27
0 20 40 60 80 100 0 20 40 60 80 100
%%
The share of international students is
International students are those students who moved from their country of origin (defined as the country of prior
or of usual residence) for the purpose of study.
Education at a Glance database
0 5 10 15 20 25 30 0 5 10 15 20 25 30 COL MEX CHL TUR ITA ISR KOR GRC ESP POL NOR USA JPN LTU SVN SWE FIN ISL SVK FRA PRT OECD BEL DEU LVA DNK IRL EST HUN CZE CAN AUT CHE GBR NZL AUS LUX %% International student enrolment as a percentage of total tertiary enrolment, 2019 49 28
low Note:
education
Source: OECD,
Poverty is declining but remains high
Poverty rate after taxes and transfers
of population
of population
29
0 5 10 15 20 0 5 10 15 20 2004 2005 2006 2007 2008 2009 2010 2011 2012 2013 2014 2015 2016 2017 2018 2019 %
%
Source: OECD, Income Distribution database.
Transport is the largest source of greenhouse gas emissions
Greenhouse gas emissions by source
Transport Energy Industrial processes and product use
Waste
Note: Transport here corresponds to IPCC 1A3 sector, and includes domestic aviation (1A3a), road (1A3b ), rail (1A3c), domestic navigation (1A3d), pipeline transport, and non specified or non energy use transport (1A3e ).
Source: OECD, Environment Statistics database.
0 10 20 30 40 50 60 0 10 20 30 40 50 60
Agriculture
%%
2019 Lithuania OECD 30
Recommendations to make growth stronger and more sustainable
• Subject all public enterprises, whether state- or municipally-owned, to the same legal, financial and regulatory framework as private firms.
• Get vocational education and training closer to the labour market, by strengthening the apprenticeship system.
• Consolidate the school network further, and timely implement the new school curriculum.
• Continue to improve the quality and transparency of the policymaking process.
• Extend carbon pricing to all areas where it is not yet implemented, especially transport and agriculture, while compensating vulnerable households for potential cost increases.
31
UNLEASHING THE POTENTIAL OF DIGITALISATION
32
Lithuania has scope for further digitalisation
33
0 10 20 30 40 50 60 70 0 10 20 30 40 50 60 70 HUN POL LVA GRC SVK FRA CZE LUX DEU EST EU27 LTU PRT OECD ESP AUT SVN ITA IRL BEL NLD SWE DNK FIN Weighted score (0-100) Weighted score (0-100) Integration of digital technologies 2021 2015 Note: OECD refers to the average of 22 OECD countries that are members of EU. Source: European Commission, Digital Scoreboard.
Government funding for R&D is low and tilted towards tax incentives
34
1. In the case of Canada, Japan and Hungary subnational tax support for Business Enterprise Research and Development (BERD) is included in tax support for BERD. Source: OECD R&D Tax Incentives database. http://oe.cd/rdtax. 0.00 0.05 0.10 0.15 0.20 0.25 0.30 0.35 0.40 0.45 0.00 0.05 0.10 0.15 0.20 0.25 0.30 0.35 0.40 0.45 LVA LTU CHE LUX SVK GRC FIN EST DEU DNK ESP SWE CZE POL OECD ITA IRL SVN USA NOR NLD ISL PRT HUN AUT BEL FRA % of GDP% of GDP Direct government funding for BERD Tax incentive support for BERD¹
Smaller firms lag behind in terms of digital uptake
Note: Digital technologies include Website, E purchases, E sales, Customer Relationship Management (CRM), Enterprise
Resource Planning (ERP), Social media, Cloud computing, Big data, and High-speed broadband. “Small" stands for enterprises with 10-49 employees, "Medium" for enterprises with 50-249 employees and “Large” for enterprises with 250 employees and over.
Source: OECD, ICT Access and Usage by Businesses database.
35
30 35 40 45 50 55 60 65 70 75 30 35 40 45 50 55 60 65 70 75 Small firms Medium firms Large firms % of enterprises% of enterprises Proportion of firms adopting digital technology by firm size 2021 or latest Lithuania OECD
Broadband coverage is relatively low in rural areas
Following the
of
36
Note:
methodology
OECD (2019), Measuring the Digital Transformation, coverage of NGA technologies (VDSL, FTTP, DOCSIS 3.0) capable of delivering at least 30 Mbps download was used to estimate the coverage. Source: European Commission, Broadband Coverage in Europe in 2021 0 10 20 30 40 50 60 70 80 90 100 0 10 20 30 40 50 60 70 80 90 100 FRA FIN POL SVK LTU SWE SVN EST PRT EU27 GRC NOR CZE AUT LVA ESP DEU IRL HUN ITA DNK ISL CHE BEL NLD LUX % of households% of households Households in areas where fixed broadband with a speed of 30 Mbps or more is available, as a percentage of households in the total and rural categories, 2021 Total Rural
There is scope to raise venture capital
capital
or latest year
+ start-up
stage
Venture capital (VC) is private equity capital provided to young enterprises not quoted on a stock market. VC stages are defined according to the OECD VC Harmonised Stages definition and include support for pre-launch, launch and early stages under “Seed/start-up/early stage”, which also includes support provided by angel investors, and support for expansion and growth stages under “Later stage”. Data refer to 2021, except for Australia (2019) and the United States (2019).
37
Note:
Source: OECD (2021), OECD Enterprise Statistics database. 0 0.1 0.2 0.3 0.4 0.5 0 0.1 0.2 0.3 0.4 0.5 SVN POL ITA PRT LVA SVK AUS GRC NOR CZE LUX IRL JPN BEL HUN LTU CHE NZL ESP DEU FRA GBR SWE AUT NLD DNK KOR FIN EST CAN USA % of GDP% of GDP Venture
investments, 2021
Seed
Later
Total 0.6
Digital government could be developed further
38
Source: OECD Digital Government Index 2019. 0 0.1 0.2 0.3 0.4 0.5 0.6 0.7 0.8 0 0.1 0.2 0.3 0.4 0.5 0.6 0.7 0.8 SWE ISL GRC FIN LTU DEU BEL CHL IRL CZE NLD AUT LVA EST OECD SVN ITA LUX NOR NZL FRA PRT ISR ESP CAN JPN DNK COL GBR KOR Digital Government Index, 2019
Few firms only are evaluating cybersecurity risks
39
Source: OECD based on Eurostat, Digital Economy and Society Statistics, Comprehensive database. 0 20 40 60 80 100 0 20 40 60 80 100 FIN IRL NLD SWE DNK NOR BEL GBR PRT CZE EU28 ITA DEU FRA LUX SVK LVA AUT ESP GRC POL LTU EST SVN HUN %% Enterprises undertaking ICT risk assessment, 2019 All enterprises Small
Lithuanian schools can increase ICT capacity
Percentage of students in schools whose principal agreed or strongly agreed with statements about the school’s capacity to enhance learning and teaching using digital devices, 2018
OECD average OECD minimum OECD maximum Lithuania
80
60
40
20
Slovenia Lithuania Slovenia New Zealand New Zealand Denmark Austria Lithuania Lithuania Lithuania Lithuania Lithuania Lithuania
0
100 Number of digital devices connected to the Internet is sufficient
Colombia Colombia Japan Colombia Colombia Luxembourg Japan
School’s Internet bandwidth or speed is sufficient
Number of digital devices for instruction is sufficient
Digital devices at the school are sufficiently powerful in terms of computing capacity
The availability of adequate software is sufficient
An effective online learning support platform is available
Teachers have the necessary technical and pedagogical skills to integrate digital devices in instruction
Source: Minea-Pic, A. (2020), ICT resources in school education: What do we know from OECD work?
40
0 20 40 60 80 100
%%
Higher education provides many STEM graduates but few ICT skills
STEM graduates by field of study
a share of all tertiary graduates, 2019
Information and Communication Technologies (ICTs)
Other STEM staduates
Tertiary graduates refer to the
for
Engineering
graduating from
OECD, Education at a Glance database.
enrolled at
41
Note:
students
programmes
ISCED 2011 5-8 levels. STEM stands
Science, Technology,
and Mathematics. Source:
0 5 10 15 20 25 30 35 40 0 5 10 15 20 25 30 35 40 NLD BEL LUX LVA ISL POL NOR SVK ESP DNK HUN OECD ITA IRL CHE FRA CZE LTU GRC SWE EST SVN PRT FIN AUT DEU %%
As
Participation in adult learning remains low
42
Source: Eurostat, Labour Force Survey. 0 5 10 15 20 25 30 35 40 0 5 10 15 20 25 30 35 40 GRC SVK POL CZE TUR HUN DEU LTU LVA ITA BEL FRA EU27 PRT IRL ESP AUT GBR LUX EST SVN NOR DNK CHE ISL NLD FIN SWE Participation in adult learning % of population aged 25-64, 2021 or latest
•
Recommendations for unleashing the productive potential of digitalisation
Subject Provide R&D support through a more balanced combination of taxincentives and direct support to smaller innovative firms.
• Proceed with the implementation of the National Broadband Plan, ensuring universal access to high-speed broadband by 2027.
• Support the development of venture capital by prioritizing public support through privately-owned funds rather than direct engagement.
• Proceed with the digitalisation of public sector, implementing the planned reforms within the envisaged timeframe.
• Enhance awareness of good practices in digital risk management, especially in the case of SMEs.
• Strengthen the digital competencies of teachers by expanding, as envisaged, training opportunities in ICT areas.
• Provide additional funding to tertiary institutions for degree completions in disciplines that are important for the labour market, including digital transformation.
• Proceed with the development of national lifelong learning platform that will serve as a “one-stop shop” for adult education, complementing it with intensified information campaigns and provision of career counselling.
43
For more information
OECD Economics
OECD
Disclaimers:

The statistical data for Israel are supplied by and under the responsibility of the relevant Israeli authorities. The use of such data by the OECD is without prejudice to the status of the Golan Heights, East Jerusalem and Israeli settlements in the West Bank under the terms of international law.
This document and any map included herein are without prejudice to the status of or sovereignty over any territory, to the delim itation of international frontiers and boundaries and to the name of any territory, city or area.
44
http://www.oecd.org/economy/lithuania-economic-snapshot/
