163
Japan Confinement measures, weak external demand and surging prices for energy, materials and commodities in the context of COVID-19 and the Russia-Ukraine war weighed on domestic demand early in the year. In these conditions, pent-up demand has risen, further boosted by substantial policy support. As a result, the economy will pick up from the slow start to the year, with GDP growth projected to be 1.7% in 2022, and 1.8% in 2023. In the face of the Omicron wave and energy price surge, the Japanese government supported vulnerable households and affected businesses. The government has also acted to address supply bottlenecks, including by supporting investment in semiconductor capacity. Structural reforms are required to ensure sustainable and resilient growth. Monetary policy will remain accommodative until the inflation rate has reached its target sustainably. The Omicron shock and supply constraints slow Japan’s recovery While Japan had comparatively very low infection numbers until the end of 2021, the arrival of the Omicron variant caused a surge in the number of cases. The Japanese government applied state-of-emergency type measures (“Priority Preventive Measures”) during the first quarter of 2022 in most prefectures. These measures limited the operation of restaurants, bars and events. While the confinement measures have been lifted, the conflict in Ukraine and lockdowns in China have affected trade and prices. Headline inflation
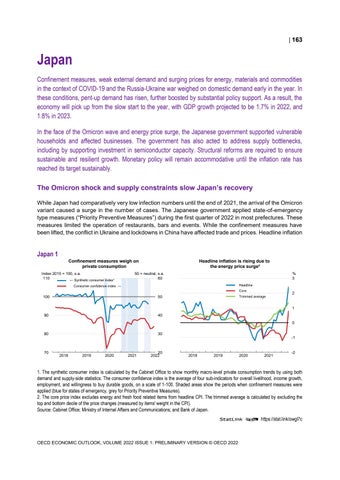
Japan 1 Confinement measures weigh on private consumption Index 2015 = 100, s.a. 110 ← Synthetic consumer index¹
Headline inflation is rising due to the energy price surge²
50 = neutral, s.a. 60
% 3 Headline
Consumer confidence index →
Core
100
50
90
40
Trimmed average
2
1
0 80
70
30
2018
2019
2020
2021
20 2022
-1
0
2018
2019
2020
2021
-2
1. The synthetic consumer index is calculated by the Cabinet Office to show monthly macro-level private consumption trends by using both demand and supply-side statistics. The consumer confidence index is the average of four sub-indicators for overall livelihood, income growth, employment, and willingness to buy durable goods, on a scale of 1-100. Shaded areas show the periods when confinement measures were applied (blue for states of emergency, grey for Priority Preventive Measures). 2. The core price index excludes energy and fresh food related items from headline CPI. The trimmed average is calculated by excluding the top and bottom decile of the price changes (measured by items' weight in the CPI). Source: Cabinet Office; Ministry of Internal Affairs and Communications; and Bank of Japan. StatLink 2 https://stat.link/owgl7c
OECD ECONOMIC OUTLOOK, VOLUME 2022 ISSUE 1: PRELIMINARY VERSION © OECD 2022