


ECONOMIC
From a challenging present towards a green future STOCKHOLM, 14 JUNE 2023 @OECD @OECDeconomy oe.cd/sweden
2023 OECD
SURVEY OF SWEDEN

2
Source:
Real GDP 88 90 92 94 96 98 100 102 104 106 108 2020 2021 2022 2023 OECD Sweden Index, 2019Q4=100
After rebounding strongly from COVID-19, the recovery has stalled
OECD Economic Outlook database.
Inflation peaked at a 30-year high
Note: Last observation for Sweden is May 2023 and for OECD April 2023.
Source: OECD (2023), Consumer price index.
3
Consumer price index -2 0 2 4 6 8 10 12 14 1990 1995 2000 2005 2010 2015 2020 Sweden OECD Y-o-y %-changes
inflation and inflation expectations
1. Money market participants' expectations. CPI stands for Consumer Price Index.
4
Monetary policy is appropriate, and needs to remain responsive to
-1.0 -0.5 0.0 0.5 1.0 1.5 2.0 2.5 3.0 3.5 4.0 2016 2018 2020 2022 Policy rate 5-year CPI inflation expectations¹ %
Source: Riksbank.
Reducing off-cycle spending decisions can help to safeguard fiscal sustainability
Number of extraordinary amendment budgets
Note: Extraordinary amendment budgets are fiscal decisions taken outside the regular budget process.
Source: Ministry of Finance of Sweden.
5
0 2 4 6 8 10 12 14 2015 2016 2017 2018 2019 2020 2021 2022 2023
Households face rising debt servicing burdens
Note: The shaded area represents the Riksbank's forecast on household debt servicing costs.
Source: Riksbank’s Monetary Policy Report, April 2023.
6
Household debt servicing cost 0 1 2 3 4 5 6 7 8 1995 2000 2005 2010 2015 2020 2025 % of household disposable income
Growth is expected to resume after a 2023 contraction
Source: OECD Economic Outlook No 113.
7
Annual growth rates, %, unless specified 2022 2023 2024 Real GDP 2.9 -0.3 1.4 Unemployment rate, % 7.5 7.9 8.0 Consumer price index 8.4 7.9 2.4 Fiscal balance, % of GDP 0.7 -0.4 -0.6
Reforms
for
stronger
growth and a more inclusive labour market
8
Reducing labour income taxes could prevent income shifting and increase work incentives
Tax wedge for a single person without children, earning 167% of the average wage, 2021
Source: OECD Taxing Wages.
9
0 10 20 30 40 50 60 70 CHL MEX NZL KOR CHE AUS ISR CAN USA JPN POL ISL GBR OECD NLD DNK EST NOR GRC CZE IRL TUR HUN SVK ESP SVN LUX PRT FIN SWE DEU AUT FRA ITA BEL %
There is room to raise property taxes to improve the tax mix
Tax on property, share of GDP, 2021¹
1. Tax on property is defined as recurrent and non-recurrent taxes on the use, ownership or transfer of property.
Source: OECD (2023), Tax on property (indicator).
10
0.0 0.5 1.0 1.5 2.0 2.5 3.0 3.5 4.0 4.5 5.0 EST CZE LTU MEX CRI SVK SVN AUT HUN LVA SWE TUR CHL IRL NOR DEU POL FIN PRT NLD COL OECD DNK NZL ISL CHE ITA JPN ESP GRC USA BEL ISR GBR FRA CAN LUX KOR %
Relaxing rent controls could reduce overcrowding and improve labour mobility
Overcrowding rate for the 20% households with the lowest income, 2021
Note: The overcrowding rate is defined as the percentage of households living in an overcrowded housing unit. 2020 data for Norway, the Slovak Republic, Switzerland and Türkiye.
Source: Eurostat, Income and Living Conditions database.
11
0 10 20 30 40 50 60 70 IRL NLD CHE ESP LUX BEL SVN FIN EST PRT NOR DNK DEU HUN FRA CZE LTU AUT ITA SWE SVK GRC POL LVA TUR %
Reviewing benefits and active labour market policies could reduce long-term unemployment
Long-term unemployment rate per group, 2022¹
Men
Women
1. People who have been unemployed longer than 27 weeks, as a share of the 15-74 labour force.
Source: Labour Force Surveys, Statistics Sweden.
12
0 1 2 3 4 5 6 7 8 9
Native-born Foreign-born Native-born Foreign-born
%
Less than 18 years
From 18 to 64 years
65 years or over
Note: Nordics is an average of values for Denmark, Finland and Norway. Data for Norway come from 2020.
Source: Eurostat, Income and Living Conditions database.
13
0 2 4 6 8 10 12 14
The pension system provides decent incomes, but sustainability and work incentives need to be reinforced
Material deprivation by age, 2021
% of population
SWE EU27 Nordics
Climate policies and Sweden’s green industrial revolution
14
Sweden’s success in reducing emissions needs to continue
Note: LULUCF stands for Land use, land-use change and forestry.
Source: Statistics Sweden.
15
Total greenhouse gas emissions, excl. LULUCF 0 10 20 30 40 50 60 70 80 90 1990 1995 2000 2005 2010 2015 2020 2025 2030 2035 2040 2045 2045 target (excl. LULUCF) Emissions (Mt CO2-e)
Policies in transport, agriculture and other non-ETS sectors need to be tightened
Note: ETS: Emissions Trading Scheme. Source: The Swedish Environmental Protection Agency.
16
0 2 4 6 8 10 12 14 16 Transport Industry Agriculture Electricity and heating Other¹ Outside EU-ETS Covered by EU-ETS Emissions (Mt CO2-e) Greenhouse gas emissions by sector, 2021
1. Emissions from waste, working machines and product use including solvents.
Natural and engineered emission removals should be incentivised like emission reductions
Total greenhouse gas emissions and uptake by LULUCF
Total greenhouse gas emissions, excl. LULUCF
Total greenhouse gas emissions, incl. LULUCF
Note: Net uptake by LULUCF (Land use, land-use change and forestry) is the annual increase in the amount of CO2 naturally stored in Sweden’s forests and soil.
Source: Statistics Sweden.
17
-60 -40 -20 0 20 40 60 80 1990 1995 2000 2005 2010 2015 2020 Emissions (Mt CO2-e)
LULUCF
Net uptake by
Most of Sweden’s electricity generation has low emissions
18
0 20 40 60 80 100 120 140 160 180 1970 1975 1980 1985 1990 1995 2000 2005 2010 2015 2020 Other thermal power Nuclear power Solar power Hydro power Wind power Combined heat and power Industrial combined heat and power TWh Electricity generation by type
Source: Statistics Sweden; Swedish Energy Agency.
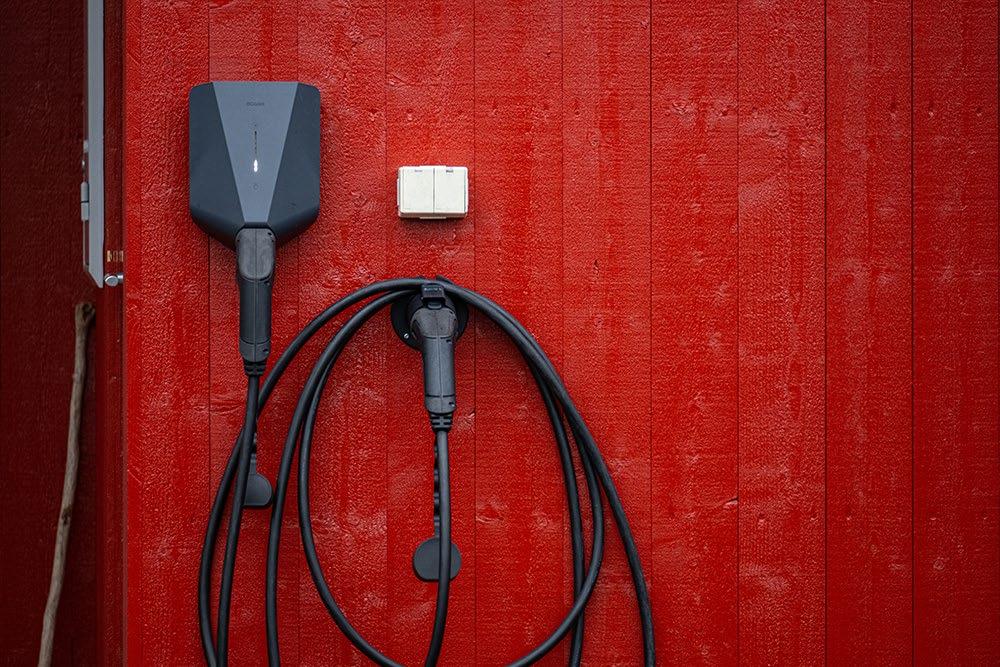
Electrification of industry and transport may double electricity demand
19
0 50 100 150 200 250 300 350 1970 1980 1990 2000 2010 2020 2030 2040 Actual Electrification scenario - Min Electrification scenario - Max TWh
Electricity demand
Source: Statistics Sweden; Gode et al. (2021).
Allocating a share of wind power profits to municipalities could reduce local resistance
Reasons
20
Municipal veto 46% Nature and outdoor life 23% Reindeer herding 11% Defence interests 4% Other 16%
for rejecting a wind power application, 2014-2021
Source: Westander, Risberg and Henryson (2022).
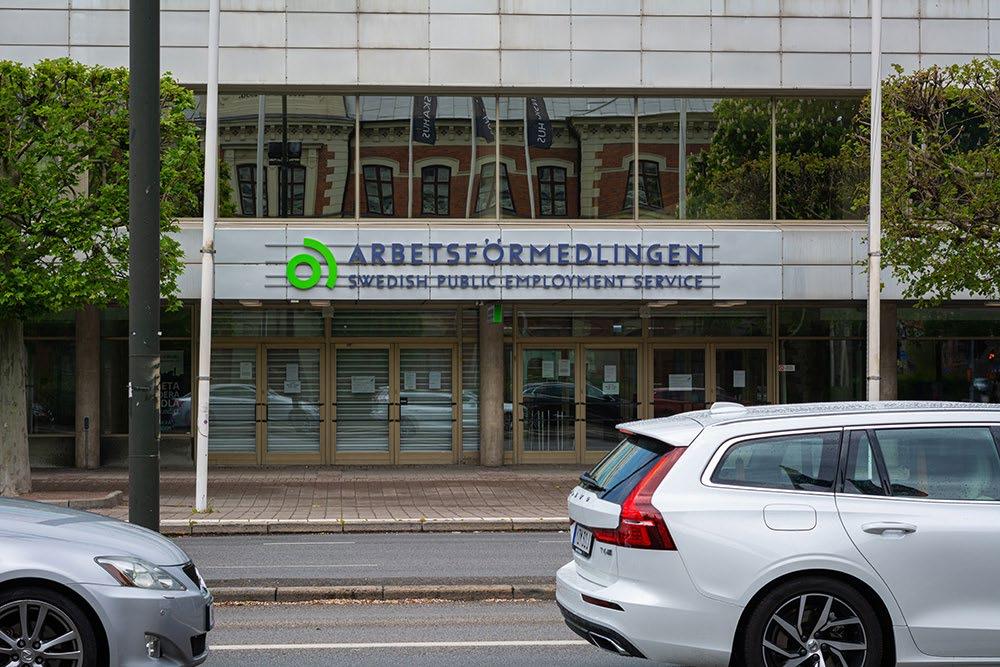
Public services need staffing to support green industry growth in the North
Skill shortages in % of projected demand by educational group, Norrbotten Region
2025 2035
HVE¹ - health and social care
Vocational studies teachers
Specialist nurses
1. Higher vocational education.
Source: Statistics Sweden, Regional Trends and Prognoses.
21
0 5 10 15 20 25 30 35 40 45 50
After-school centre personnel %


22
@OECDgov
2023 OECD PUBLIC GOVERNANCE MONITOR OF SWEDEN
https://doi.org/10.1787/086f9b89-en
Trust in the national government is slightly below the OECD average
Note: OECD shows the average values for the 20 OECD countries covered by the OECD Trust Survey and depicted in the figure.
Source: OECD (2022), Building Trust to Reinforce Democracy: Main Findings from the 2021 OECD Survey on Drivers of Trust in Public Institutions; OECD (2021), Government at Glance 2021
23
0% 10% 20% 30% 40% 50% 60% 70% 80% 90% 100% Trust Neutral Do not trust Don't know
.
Sweden scores better than other OECD countries in perceived public sector integrity
Note: Within-country distribution of responses to the question “If a public employee were offered money by a citizen or a firm for speeding up access to a public service, how likely or unlikely do you think it is that they would refuse it?”.
Source: OECD (2022), Building Trust to Reinforce Democracy: Main Findings from the 2021 OECD Survey on Drivers of Trust in Public Institutions; OECD (2022), OECD
Recovery Dashboard.
24
COVID-19
0% 10% 20% 30% 40% 50% 60% 70% 80% 90% 100% OECD AUS AUT BEL CAN COL DNK EST FIN FRA GBR IRL ISL JPN KOR LUX LVA MEX NLD NOR NZL PRT SWE Likely refuses a bribe Neutral Likely accepts a bribe Don't know
Disclaimers:
For more information
oe.cd/sweden
Public Governance Monitor


25
@OECD @OECD Economics
The statistical data for Israel are supplied by and under the responsibility of the relevant Israeli authorities. The use of such data by the OECD is without prejudice to the status of the Golan Heights, East Jerusalem and Israeli settlements in the West Bank under the terms of international law. This document and any map included herein are without prejudice to the status of or sovereignty over any territory, to the delim itation of international frontiers and boundaries and to the name of any territory, city or area. @OECDgov
