A pathway to decarbonise the EU fisheries sector
 by 2050
Funded by the European Union. Views and opinions expressed are however those of the author(s) only and do not necessarily reflect those of the European Union or CINEA. Neither the European Union nor CINEA can be held responsible for them.

Direct emissions from fuel burnt
Indirect emissions from disturbing blue carbon habitats
Potential for reducing the carbon footprint of the EU fleet
Potential fuel savings in EU fishing fleet by transitioning from mobile bottom-contacting gears to passive gears
Avoidance of carbon release through a transition towards an effective network of MPAs to conserve blue carbon habitats
Existing and new technological solutions for reducing the CO2 emissions in fisheries
Past trends and reduction paths of carbon footprint in meeting targets
Consumption Baselines
Forecast scenarios for 2030 and 2050
Credits
Title: A pathway to decarbonise the EU fisheries sector by 2050.
A roadmap to decarbonise the EU fishing sector
Feasibility of the energy transitions and barriers
Short-term actions (2023-2030)
Long-term actions (2023-2050)
Concluding Remarks
References
Appendix A - Tabulation of Fuel Use Intensity (FUI) and Fuel Use Efficiency (FUE) of EU Fleets
Appendix B - Switching of fishing techniques in the case of the Danish fleet
Appendix C - Switching of fishing techniques in the case of the Italian fleet
Appendix D - Mapping the seabed, biogenic habitats and carbon-rich habitats, and estimating the disturbance from fishing activities
Appendix E - Displacing effort from bluecarbon habitats in the OSPAR ecoregion
Appendix F - A non-exhaustive list of technological solutions
Citation: Alma-Maris. (2023). A pathway to decarbonise the EU fisheries sector by 2050. Report produced for Oceana Europe by Alma Maris Consulting. 96 pp. Alma Maris Report nº: 01-2023. Year: February 2023.
Author: François Bastardie for Alma Maris Consulting.
DOI number: 10.5281/zenodo.7757175
Design: Yago Yuste.
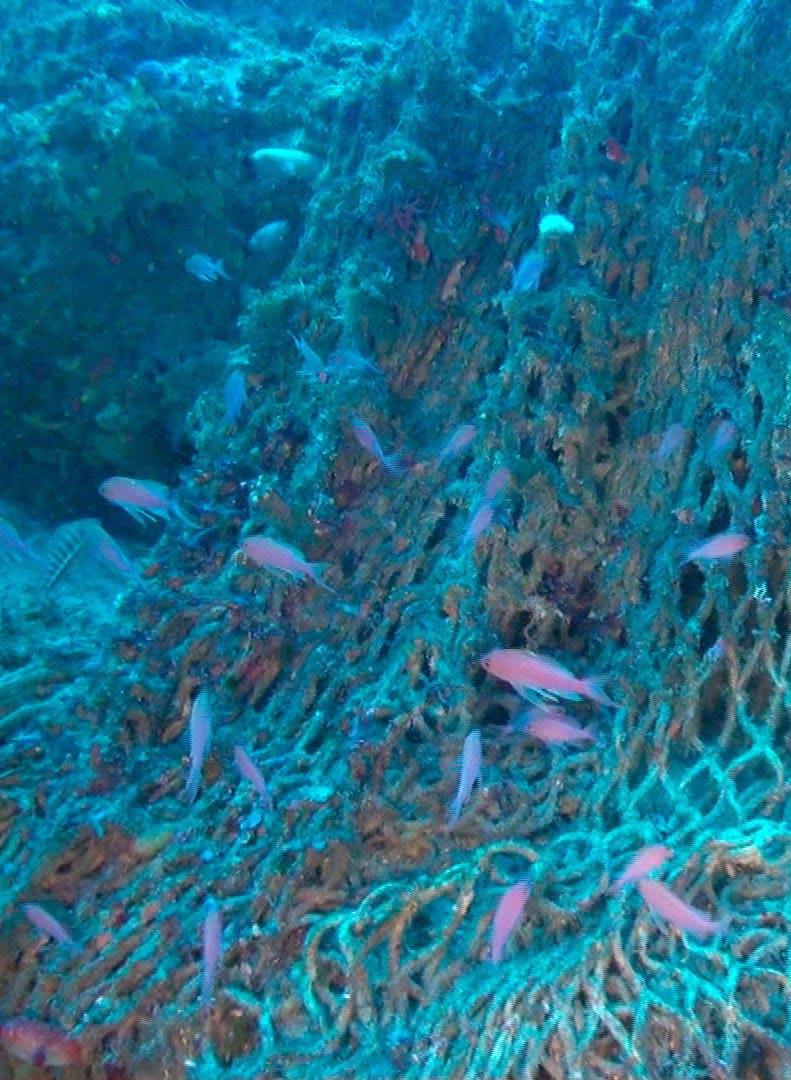
Cover photo: © OCEANA / Juan Cuetos.
The views expressed in this study are purely those of the authors and do not necessarily reflect the position of the institutions supporting Oceana. Neither these institutions can be held responsible for any use of the content of the document. The content of this report may not be reproduced, or even part thereof, without explicit reference to the source. Oceana is grateful for the support of EU LIFE Programme and Levine Family Foundation.
3
Executive Summary 4 1. 4. 2. 3. 7 9 10 11 34 52 53 11 34 41 61 66 70 72 84 88 48 15 18 30 31 24 28 18 30 List of Abbreviations Preliminary Remarks Report Objectives Fuel use and intensity in the fishing sector from a global to an EU perspective
Contents
1.1 4.1 4.2 4.3 1.2 2.1 3.1 3.2 2.2 2.3
Executive Summary
The European Green Deal sets out an objective of resource efficiency, reaching zero emissions by 2050 and protecting, conserving and enhancing the EU’s natural capital, with an intermediate target of a 50 to 55% reduction of emissions by 2030. The European Commission adopted a set of proposals to make the EU’s climate, energy, transport, and taxation policies fit for reducing net greenhouse gas (GHG) emissions by at least 55% by 2030, compared to 1990 levels. 1 In the fishing sector, this translates to a reduction of 30% by 2030 compared to 2005 levels. 2, 1 The Farm to Fork Strategy is at the heart of the European Green Deal, aiming to make food systems fair, healthy and environmentally friendly.
This GHG emission reduction objective in the EU occurs while fuel use is an essential component of the fisheries’ economy. Some fisheries are unprofitable without subsidies, but fuel-intensive fisheries can also be profitable when the landed species are highly priced - even with high fuel expenses. Most EU fisheries’ dependency on fossil fuels impairs their long-term economic profitability and resilience, and there has been no incentive to reduce absolute fuel consumption in the sector until recent years. The situation has worsened since the combined shocks of the COVID-19
pandemic and the Russian invasion of Ukraine caused oil and gas prices to soar in 2022. Fishers in Europe acknowledge their energy dependence on unreliable external sources. Hence, sustainable fisheries and normative management are crucial to developing incentives toward reducing fuel use and increasing the incentives for implementing lowcarbon or carbon-neutral alternatives to support the decarbonisation of the marine capture fishing sector.
This report investigates technical and strategic solutions to reduce fuel use in the EU fleet sector and aims to support the energy transition of the EU fleet. There are existing solutions to reduce fuel use in fisheries, from technical solutions ( Subsection 2.3 and Appendix F ) to more extensive changes such as phasing out the more energyhungry fishing techniques and practices. The study identifies emissions reduction potential from fuel savings when fisheries implement existing technical solutions, switch toward the least fuel-intensive fishing techniques, use green energy, and reduce or avoid indirect emissions by changing fishing grounds and displacing the more detrimental practices pressuring the seabed from carbon-rich habitats. Such actions should ultimately reduce CO 2 emissions released into the atmosphere to help achieve the
4 by 2050 A pathway to decarbonise the EU fisheries sector
© OCEANA / LX
1 Note : Reduction by 40% may now be the updated target. See Council of the European Union (2022, November 8).
2030 and 2050 environmental targets for the EU fishing sector.
This work aligns with supporting the requirements of the EU Common Fisheries Policy (CFP) 3 and the European Maritime and Fisheries Fund (EMFF) Regulation in financially supporting the implementation of the CFP and the sustainable development of EU fisheries, with a priority objective in “ Promoting environmentally sustainable, resource-efficient, innovative, competitive and knowledge-based fisheries .” 4 The CFP also includes provisions for EU Member States (MS), when distributing fishing opportunities among the fishing agents, to provide incentives for using energyefficient fishing vessels.
In relation to the direct consumption of fuel burnt by vessels whilst fishing, the study confirms that bottom trawling is the most intensive fishing technique in most cases in the EU , independent of vessel size. Based on these findings, the study suggests re-allocating the fishing effort currently used by bottom trawling to other fleet segments and estimates that this could translate in million litres of fuel saved each year and in turn, help reduce the harmful emissions of the EU fishing sector.
Related to the indirect release of marine carbon from the disturbance of bottom-contacting gears sweeping the seabed, here the study found that a tremendous amount of carbon currently stored in deep sediments is likely released by fishing activities touching the seabed. This may represent 10 to 15 times the amount of direct fuel burnt by fishing activities . However, significant uncertainties in those estimates require further research at different geographical scales. Such uncertainty also pertains to the gain (or risk) of displacing fishing efforts outside the identified blue carbon habitats.
The report identifies both short-term and strategic, long-term actions towards reducing fuel use. In the short term, the key finding is to recognize that reducing the GHG emissions of fisheries to reach a 30% reduction of direct emissions by 2030 is achievable . The target is reachable through a combination of different means, such as (i) fishing effort re-allocation to the least fuel intensive fishing techniques and phasing out the most energy-inefficient fishing techniques , such as mobile bottom-contacting gears.
(ii) Banning mobile bottom-contacting gears in existing Marine Protected Areas (MPAs) that have high carbon storage potential , as they are shown to have the most potential to disturb carbon storage. While also ensuring the avoidance of indirect CO 2 emissions and further degradation of carbonrich habitats by protecting and removing harmful fishing pressure from any identified “blue carbon” habitat. (iii) Reducing direct fuel consumption using alternative green fuels , refrigerants or innovative vessel propulsion with lower GHG emissions, and a myriad of other technological innovations such as newly, optimised gears, also to increase the catch for the same amount of fuel consumed (i.e. catch efficiency improvements).
In the long term, progress toward emissions reduction objectives needs to be secured with evidence-based, normative management, together with realistic funding opportunities to support the energy transition and compensate for the socioeconomic effects on producers and dependent retailers, as well as taxes on fossil fuels. These will incentivise the sector to change practices, unlock barriers and limit the risk of an unwished “rebound” effect whereby the fishing sector’s savings are not used to disinvest from fossil fuel use. Funding the energy transition, reducing and re-allocating fishing efforts while phasing out fuel use subsidies is key
Meanwhile, funding is also required to support the industry with capital to ensure the implementation of innovative solutions, which may be costly in the short-term (eg., electrification). However, accessing funding is too-often dependent on the existing quantity and health of fish stocks in fisheries. The current situation does not allow for companies to invest in better fishing practices that could ultimately help restore fisheries using energy transition grants or subsidies. 6 Recovering and maintaining the good health of fish populations are unavoidable prerequisites for a successful energy transition .
Without delay, we recommend that the European Union Institutions and MS ensure the following short-term 2023-2030 actions , prioritising the implementation of win-win actions with environmental co-benefits. This includes significantly reducing the contact of gears with the seabed, phasing out any bottom-contacting gears, and incentivising a switch toward other types of gears, as well as:
5
Robust data collection and research to help inform and develop a monitoring programme designed to collate accurate and standardized data on fuel consumption at the vessel level, using different types of innovative gears and optimised vessel specifications.
Implementing and improving the uptake of existing technologies proven to lead to fuel savings (such as optimising the vessel shape and equipment to reduce water resistance of towed nets, Subsection 2.3 and Appendix F ), as well as further research to develop and implement close-to-market, innovative and energy-efficient technologies (gear and vessel types, fishing operations).
An extensive regulatory effort to introduce fossil fuel taxes, replace subsidies that do not incentivise reducing fuel consumption, improve health and recovery of fish stocks, promote the small-scale fishing sector over the large scale fisheries, implement the current fisheries legislation to enable the EU Commission to submit proposals on areas intended to be protected jointly, and account for regional specificities and tailor-made actions in the context of the EU CFP regionalisation.
Dedicated financial instruments to fund the energy transition towards a carbon-neutral fishing sector in Europe. For example, funding could be used to reinvest money earned from fossil fuel taxes into supporting research and innovations, as well as to compensate stakeholders for the transition costs.
We further recommend that the European Union institutions and MS take longer-term 2023-2050 actions, to:
Support the development and implementation of innovative energy-efficient propulsion technologies (alternative fuel, electrification, wind-assisted propulsion), while continuing to restrict and phase-out proven energyinefficient fishing techniques. This also requires scaling up alternative gears and lowering fuel intensity to reduce adverse risks brought on by alternative gears.
Continue to identify negative side effects of some fisheries regulations (including subsidies), and identify barriers to unlock with policy solutions.
Implement stringent restrictions in already designated MPAs, that overlap with high carbon stores and create new MPAs based on protecting and restoring blue carbon habitats, accompanied by cost-efficient tools for enforcing them.
Improve the EU’s political soft power with MS and leadership in international climate policy , such as by pushing international leaders to decarbonise their fishing fleets, and continue the push for more renewable, affordable energy (electrification, green fuels and wind energy).
Implement a vessel buyback program for energy-inefficient vessels and push MS for efficient regional action plans to further reduce excess fishing capacity or imbalanced fleets.
Promote side-by-side comparison through a sustainable fishery ecolabel , and the development of a carbon footprint scoring system to influence retailers and seafood consumers to shift towards products sourced using sustainable, low-carbon fishing techniques and practices.
6 by 2050 A pathway to decarbonise the EU fisheries sector
01
03
02
01 03 04 05 06 02
04
List of Abbreviations
STECF Annual Economic Report
Automatic Identification System
Common Fisheries Policy
Catch Per Unit of Effort
Data Collection Framework
Data Collection Regulation
European Commission
European Environment Agency
Exclusive Economic Zone
EU Emission Trading System
European Market Observatory of Fisheries and Aquaculture
Food and Agriculture Organization of the United Nations
Fuel Use Efficiency
Fuel Use Intensity
Global Fishing Watch
Geographical Information System
International Council for the Exploration of the Sea
International Maritime Organization
Intergovernmental Panel on Climate Change
Joint Research Centre of the European Commission
Marine Bunker Exchange
Marine Environment Protection Committee
Marine Protected Area
Member State
Marine Strategy Framework Directive
Vessel Monitoring System
Fishing techniques
Drift and/or fixed netters
Dredgers
Demersal trawlers and/or demersal seiners
Vessels using pots and/or traps
Vessels using hooks
Vessel using other active gears
Vessels using polyvalent active gears only
Species assemblages
Demersal fishes
Small Pelagic Fishes
Crustaceans
Molluscs
Vessels using passive gears only for vessels < 12m
Fishing areas PGO
MBS NAO
OFR
PG PGP PMP TM PS TBB DEF SPF CRU MOL CAT BEL BGR CYP DEU DNK ESP EST EU
Vessels using other passive gears
Vessels using polyvalent passive gears only
Vessels using active and passive gears
Purse seiners
Pelagic trawlers
Beam trawlers
North-Atlantic Ocean
Seas
FIN FRA GBR GRC IRL ITA LTU LVA
MLT NLD POL PRT ROU SVN SWE
Belgium Bulgaria Cyprus Germany Denmark Spain Estonia European Union Finland France United Kingdom Greece Ireland Italy Lithuania Latvia Malta Netherlands Poland Portugal Romania Slovenia Sweden
7
European Countries AER AIS CFP CPUE DCF DCR EC EEA EEZ ETS EUMOFA FAO FUE FUI GFW GIS ICES IMO IPCC JRC MABUX MEPC MPA MS MSFD DFN DRB DTS FPO HOK MGO MGP
Catadromous species
Mediterranean and Black
Other Fishing Regions
© OCEANA / Carlos Minguell
STECF VMS
European Commission Scientific, Technical, and Economic Committee of Fisheries
Table of Figures List of Tables
•
Figure
2
Monthly average of marine gasoil prices for 20212022. Source: EUMOFA based on MABUX.
Fuel Use Intensity of the main EU national fleets contributing to the fuel consumption in the EU fishing sector deduced from the STECF AER data averaged over 2008-2018. The gear categories are ordered from the lowest to the highest FUI values. The bar widths in the plot are proportional to the landed tonnes by each gear category.
Fuel Use Efficiency (litre per day at sea) of the main EU national fleets contributing to the fuel consumption in the EU fishing sector, deduced from the STECF AER data averaged over 2008-2018. The gear categories are not ordered from the lowest to the highest FUE but from the lowest to the highest FUI values. The widths of the bars are proportional to the landed tonnes by each gear category.
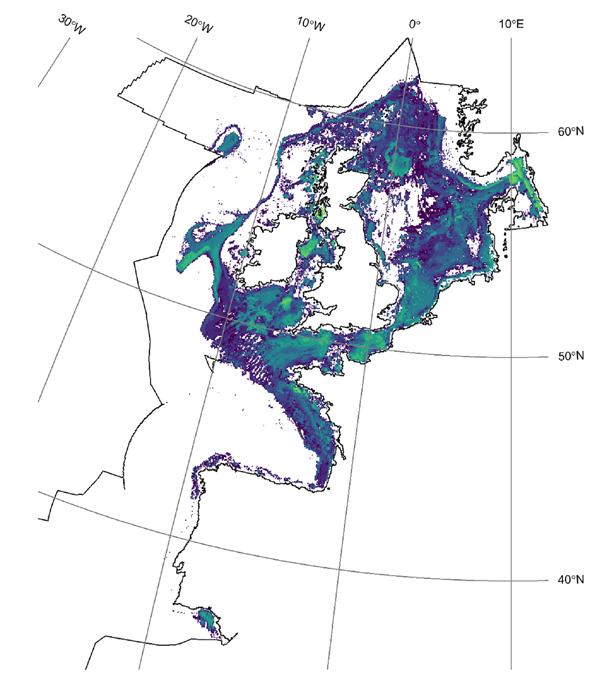
Estimated blue carbon stock (recalculated from Atwood et al. 2020) and known conservation areas designated inside the EU Marine Strategy. Framework Directive (MSFD) areas.
Percentage of carbon stock lying in the designated MPAs per region compared to % surface area represented by MPAs in each region.
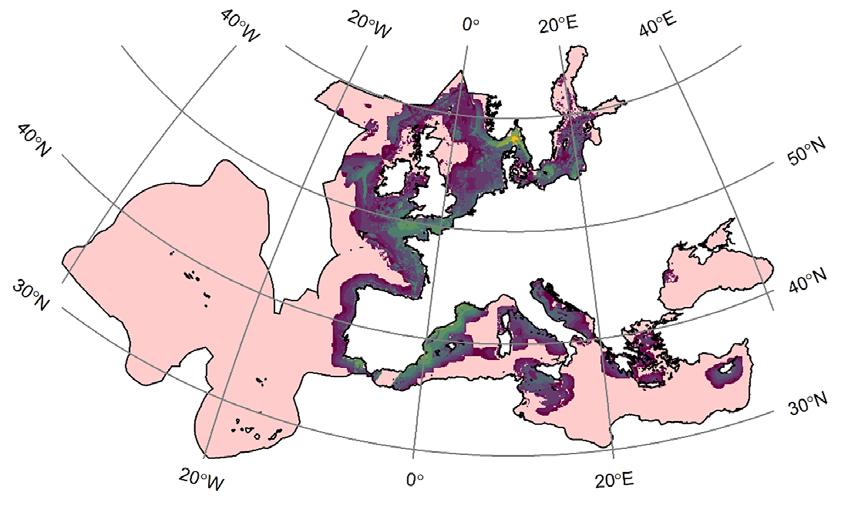
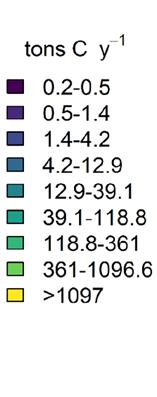
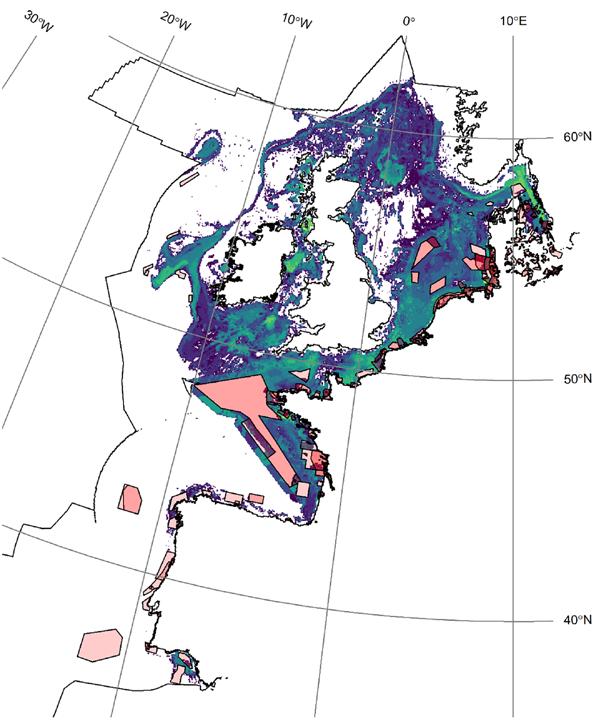
Estimated tonnes of carbon (C) lost per year (y) from the disturbance of bottom-contacting gear on the seabed. These estimates are deduced by overlaying the subsurface Swept Area Ratio computed in each grid cell in 2020 by EU fleets using bottom-contacting gears within the MSFD areas, together with the seabed carbon stock mapping of Atwood et al. (2020). Grid cells are 1km large. Geographical Lambert projection used here.
A possible linear decrease in EU 2008-2018 average fuel consumption split per country (MS + GBR)based fishing fleet segments along with scenarios for re-allocating the fishing effort from donor to receiver fleets (0 to 100% of the effort of segments using mobile bottom-contacting gears). Each panel's legend of the fleet segments is ordered from the highest to the lowest fuel consumption. Shown per EU ecoregion (MBS, NAO, and OFR).
Top 8 EU Fleets - Potential change in overall and fleet-disaggregated fuel use along with a scenario for a redistribution of the quotas (here: via fishing effort) from mobile bottom-contacting gears (i.e., demersal trawls and seines, represented in purple) to passive gears (represented in green) . Pelagic trawls and dredge (represented in yellow) were considered not affected by the scenario. The redistribution was made consistent with the vessel size category. Based on the EU STECF AER 2008-2018 collecting fuel and landings data.
• Figure 10
• Figure 11
• Figure 12
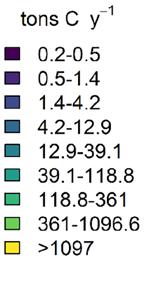
Estimated tonnes of carbon C lost per y from the disturbance of mobile bottom contacting gears on the seabed. These estimates are deduced by overlaying the subsurface Swept Area Ratio computed in each grid cell in 2020 by EU fleets using bottom-contacting gears within the OSPAR-MSFD areas, together with the seabed carbon stock mapping of Atwood et al 2020. Additional assumptions were required (see Appendices D and E). Grid cells are 800x800m large. Change in carbon loss induced by fishing pressure when displaced from the existing conservation areas (in red).
Semi-pelagic trawl doors tested in a water tank (Extracted from Bastardie et al. 2022).
Evolution of fuel burnt during fishing operations in the EU fisheries sector over the period 2008-2018 for the top 10 fleet and forecast based on possible savings identified by the present study (i.e. assuming a 20% overall gain during 2022-2030 from technological solutions (Top panel), added to country-specific percent from phasing out the most impacting bottomcontacting gears (Bottom panel).
Global fuel consumption of the EU Fleet (litre of fuel). Tonnes of fuel are estimated knowing the marine oil density assumed at 0.860, and the emissions estimated assuming 3.1144 tonne-CO2eq per tonne of fuel. Source: calculated from an average over the period (2008-2019) of the STECF AER 2020 data (using the “Energy consumption” variable).
Carbon stock aggregated per region inside MPAs compared to overall stock in the region. Aggregates in MSFD areas are provided deduced from geolocalised mean carbon stock estimated by Atwood et al. (2020). Overall fuel savings potentials and economic outcomes of re-allocation scenarios per country and ecoregion.
Estimated tonnes of carbon loss annually from the seabed disturbance by mobile bottom-contacting gears deployed by the EU Fleet (in 2020). Assuming a conversion factor of 3.67 gCO2 per g C. The Black Sea has been excluded because the 2020 GFW data coverage was found inadequate for this region, which means excluding Bulgarian and Romanian fleets; The estimates also exclude the UK fleet, which is no longer registered in the EU Fleet Register.
Estimated tonnes of carbon loss and CO2 emissions annually from the seabed disturbance by mobile bottom-contacting gears deployed by the EU Fleet, including the UK fleet. Assuming a conversion factor of 3.67 gCO2 per gC. Blue carbon habitats were arbitrarily defined in this case as areas with Atwood et al. 2020’s estimates >14,000 gC.m-2
Reconstruction of energy use of the fishing sector in the European Union (KP) . 2022 Common Reporting Format (CRF) Table (extracted from Table 1.A(a)s4, version 2 Dec 2022; Point iii of point c. Agriculture/ Forestry/ Fishing) collating GHG inventories for the European Union.
The present study estimated annual country-specific % reduction in litres of fuel used between 2022-2030 if the gain from the scenarios applies. Scenarios are: implementing the technological solutions; re-allocating the most severe impact bottom contacting gears to less impacting gears; *Not a country-specific scenario.
Annual country-specific % reductions between 20312050 that are required to reach the 0 emissions target by 2050.
Barriers to decarbonising the EU Fleet.
Win-wins for decarbonising the EU fishing sector when fishing effort is balanced with fishing opportunities, sustainable targets, and CFP minimal effects objectives. Short- and long-term technology, regulatory, research, public and policy solutions required to reduce the fuel used in the EU fishing sector. Negotiated country-specific 2021-2027 EMFAF funding (version Dec 2022).
Total Factor Productivity Levels in real terms for two areas (STECF 2020), i.e., North Atlantic Ocean (NAO) and Mediterranean (MBS) large-scale fishing (LSF), split for demersal target species vs pelagic, and small-scale fishing (SSCF).
pp. 10 pp. 12 pp. 16 pp. 23 pp. 24 pp. 24 pp. 31 pp. 32 pp. 32 pp. 38 pp. 39 pp. 40 pp. 45 pp. 47 pp. 13 pp. 14 pp. 16 pp. 17 pp. 17 pp. 21 pp. 22 pp. 25 pp. 25 pp. 29 pp. 33 pp. 43
8 by 2050 A pathway to decarbonise the EU fisheries sector
1
1
2
Semi-pelagic otter trawl, where the doors are lifted off the seabed while the ground gear remains in contact with the seafloor (top). Midwater or pelagic trawl where none of the gear is touching the seabed. The doors in both types of trawls have a higher height aspect ratio when compared to bottom otter trawls to generate the necessary lift (bottom). Image obtained from www.seafish.org on 24/11/21. 3
• Table
• Table
• Table
• Table 4 • Table 5 • Table 6 • Table 7 • Table 8
• Table 9
• Table 10 • Table 11 • Table 12 • Table 13 • Figure
• Figure 3 • Figure 4 • Figure 5 • Figure 6 • Figure 7 • Figure 8
• Figure 9
• Figure 13
Preliminary Remarks
Urgent action is needed to accelerate the energy transition and decarbonisation of the EU fisheries sector. Decarbonisation is the process by which countries, individuals or other entities aim to achieve zero fossil carbon emissions. This requires the fishing industry to reduce emissions by improving energy efficiency, necessitating a change in practices towards low or no carbon emissions, which has so far been limited as long as the fishing activity is profitable. However, the Russian invasion of Ukraine at the beginning of 2022 has highlighted risks to the profitability of fuel-dependent fisheries, and radical change is urgently needed to reduce energy use in the fishing sector. The EU fishing and aquaculture sectors are directly impacted by the increased costs of marine fuel, electricity, and fish feed and by a shortage in some critical raw materials and inputs (salt, flour, oil, tin). 7 The energy transition toward zero carbon in the fishing sector should also ensure that this sector plays its part in meeting the EU’s climate ambitions for 2030 and 2050.
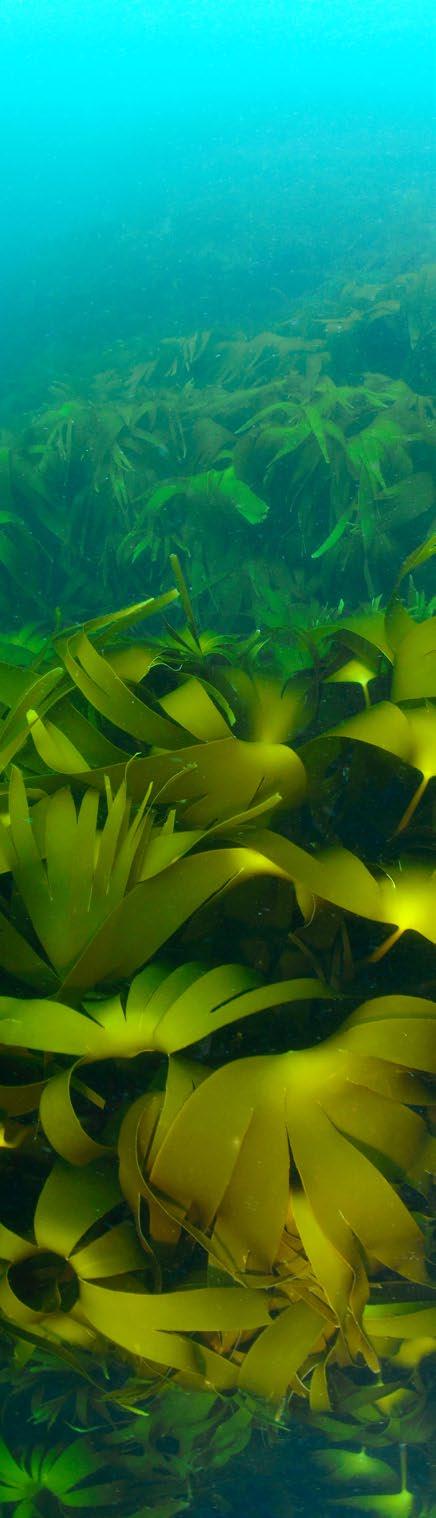
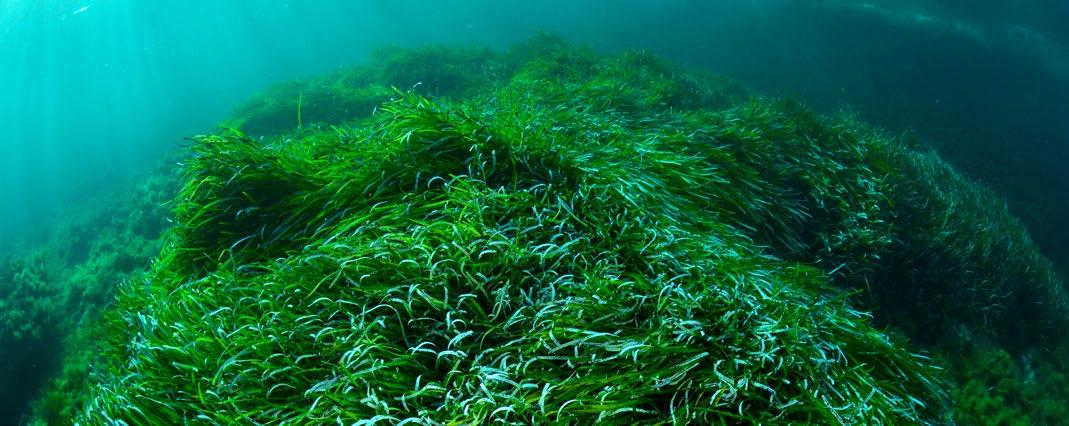
Previous studies have identified that win-wins and co-benefits likely exist in reducing the activity of mobile bottom-contacting gears by saving fuel while conserving marine life and supportive marine environments. 8 The ocean is a giant carbon pump.9 Blue carbon habitats - usually marine vegetated coastal ecosystems, estuaries, eelgrass seabeds, meadows, and kelp forest - are marine habitats that contribute disproportionally to the marine ecosystems’ functioning and services linked to the carbon cycle and are where the biological carbon pump is predominant.10,11 These habitats store and sequester large amounts of organic carbon in sediments and conserve rich biodiversity. The largest carbon sink is found as plankton floating in the open seas or lying at the bottom of the seas, where organic matter is trapped in the sediment (“Deep-blue carbon”). The release of carbon in the water column up to the atmosphere from either degrading these habitats or resuspending the carbon buried in seabed sediments may be tremendous.12,13 Such a release possibly makes CO2 emissions from wild fish caught with bottom trawls as extensive as those emitted by land-based food production systems, and may be even more damaging given the importance of the ocean as a climate buffer that can absorb excess atmospheric carbon.
Fuel consumption represents a large part of the cost of fishing. However, while fishing is profitable, there is little incentive to reduce fuel costs and consumption. Recent rising fuel prices ( Figure 1 ) have changed this perspective, and it is important to help the fishing sector reduce fuel use for cleaner and cheaper production. Fisheries development over the last century has been largely dependent on fuel input. There is now a strong call worldwide for a decoupling (e.g., IPCC) where growth is no longer strongly associated with fossil fuel consumption but instead where economic growth happens, but fossil fuels decline. 14
9
© OCEANA / Carlos Minguell
Report Objectives
In the search for a reduction path toward reaching the 2030 and 2050 targets in the EU, this report’s key objective is to provide an evidence-based snapshot of the fuel reduction effects that the EU policymakers could expect when phasing out the most fuelintensive fisheries from the EU Fleet, which are also the fisheries affecting the seabed, its carbon storage, and vulnerable benthic habitats (e.g., fragile biogenic structures). Accordingly, quantifying the effects of phasing out the most harmful fishing practices, displacing them away from carbon sink areas and generalising the use of the existing technical solutions (i.e., vessel and gear optimization, strategic navigation) will assess the likelihood of the environmental EU targets to be achieved in these ways. The report will also explore other complementary measures that could be mobilised to reduce fuel use and incentivise the switch to alternative gear and green fuels in the fishing sector.
1. The first part of the study is dedicated to evaluating the current fuel consumption in the EU wild fisheries sector to better understand its role in climate change from global and EU perspectives. We first assess the carbon footprint of the EU fisheries sector for all emissions related to fuel burnt at sea (ie., not accounting for other emissions, such as from onshore). Then, the study estimates indirect emissions induced by the fishing disturbance of the seabed. This is estimated by overlaying of EU fishing pressure of mobile bottomcontacting gears on “blue carbon” habitats after determining the activity of this mobile gear category.
2. In the second part, the study estimates possible fuel savings when assuming management actions and implementation of technological solutions:
• The first section in this second part focuses on testing effort re-allocation among EU-defined fleets. The study also illustrates more refined reallocation cases by focusing on two cases (Danish and Italian fleets) for which less aggregated data are publicly available. Dealing with a finer fleet definition aggregation enables testing the effect of re-allocating effort from bottom trawlers to demersal seiners and passive gears in the Danish case, and in an Italian case, re-allocating effort from “Rapido” trawls (a kind of beam trawl) to less fuel-intensive trawl fisheries.
• The second subsection explores the importance and vulnerabilities of carbon sinks to the fishing disturbance in EU waters, and the ability of current area-based management to mitigate the fishing pressure. The overlay of fishing pressures to habitats enables a cross-check of the currently implemented habitat protection network network (with a similar approach to Perry et al. (2022)15, or Black et al. (2022)16) quantifying the degree of matching as a proxy of current (possible) efficiency at protecting blue carbon habitats and retaining carbon already captured in the seabed. The study accounts for the possible fishing effort displacement effect on surrounding habitats in case the bottomcontacting gears are not entirely phased out.
10 by 2050 A pathway to decarbonise the EU fisheries sector
Figure 1. Monthly average of marine gasoil prices for 2021-2022. Source: EUMOFA based on MABUX.
2021-M012021-M02 0,2 0,4 0,6 0,8 1,0 1,2 1,4
EUR / litre Spain France Italy 2021-M012021-M02 0,2 0,4 2021-M032021-M042021-M052021-M062021-M072021-M082021-M092021-M102021-M112021-M122022-M012022-M022022-M032022-M042022-M052022-M062022-M072022-M082022-M092022-M10 Spain France Italy
2021-M032021-M042021-M052021-M062021-M072021-M082021-M092021-M102021-M112021-M122022-M012022-M022022-M032022-M042022-M052022-M062022-M072022-M082022-M092022-M10
• In the third subsection, the study lists the recent technological innovations and regulatory and policy-driven instruments that can be used to save fuel and transition to green fuels in the EU fishing sector. They have been listed in a previous study,18 and the report reuses them here. It is identified that fuel saving can be obtained at different levels: the vessel, the fishing gear, and the strategy for operating the fishing.
3. In the third part, the study combines the potential of fuel savings from re-allocating the fishing effort with implementing technological solutions to project the possible emissions reductions forward (up to 2030 and
2050). This concludes if the proposals are sufficient to achieve net-zero carbon emissions in the fisheries sector in the EU marine fishing capture sector.
4. Finally, the study examines the key enablers and barriers to decarbonising the EU fisheries sector. The study draws a roadmap with some recommendations for ways forward, including management principles and a short to a longterm strategic roadmap to decarbonise the EU fisheries sector that should contribute to helping preserve the ocean and blue carbon sinks and to reaching sustainable, low-impact, and net-zero EU fisheries targets.
1. Fuel use and intensity in the fishing sector from a global to an EU perspective
1.1. Direct emissions from fuel burnt
In 2018, world fisheries emitted 40.7 million tonnes of GHG emissions by consuming 12.86 million tonnes of fuel, representing 14.953 billion litres of fuel. This is 4% of the overall shipping emissions, while shipping emissions in global anthropogenic emissions have represented 2.89% in 2018. 21, 2
The energy needs in fisheries are primarily associated with fuel consumption during fishing operations for displacing the vessel on the water, towing the gear, and producing ice to conserve the catch (i.e., not including the energy used in building the vessel). The energy required for replacing fishing gears, antifouling paint, and scrapping the vessel at the end of its service life is less significant compared to the energy used in fuel consumption. 22
In a recent project for the European Commission, the state of play of energy use within the EU fishing industry was examined between 2002 and 2018. 23 Such economic data are aggregated at EU fleet level, with yearly costs and earnings (including energy costs) and the total amount of consumed fuel. This data source gives a standard aggregation per fleet, 24 making a comparison of fuel consumption of fleets possible across EU countries.
2 Note: 12.86 million tonnes of fuel - latest estimates from International Maritime Organisation (IMO) from MEPC (2020, Table 34) and 4% of overall shipping estimated from a bottom up-approach from MEPC (2020, Table 34).
11
© OCEANA / Enrique Talledo
A pathway to decarbonise the EU fisheries sector


From these public data, this present study estimates the total carbon footprint of the EU fleet. This study then collates FUI (litres of fuel per kilo of retained catch) and Fuel Use Efficiency (FUE, litre per day at sea) over time (2008-2018) and tabulates the average overall EU fleets’ fuel consumption per gear category (i.e., demersal trawlers & seiners [DTS], beam trawlers [TBB] and vessels using active & passive gears [PMP], vs vessels using polyvalent passive gears only [PGP]; dredgers [DRB] and midwater trawls [TM]).
From the STECF Annual Economic Report (AER) database,25 the part represented by the carbon


Table


footprint of the EU fleet was estimated to amount to 6.94 million tonnes of CO2 eq emissions annually on average over 2008-2019 (Table 1), which accounts for roughly 17% of the fishing sector’s world emissions and equivalent to 2,592 million litres of fuel.
In Europe, Spain, France, and Italy are the main fishing nations contributing to a large share of the CO2eq emissions (Table 1), followed by Netherlands, Greece, and Denmark. The UK fleet ranked fourth before leaving the EU.
12 by 2050
1. Global fuel consumption of the EU Fleet (litre of fuel). Tonnes of fuel are estimated knowing the marine oil density assumed at 0.860, and the emissions estimated assuming 3.1144 tonne-CO2eq per tonne of fuel. Source: calculated from an average over the period (2008-2019) of the STECF AER 2020 data (using the “Energy consumption” variable).
BEL 42.97 0.04 0.12 BGR 2.52 >0.01 0.01 CYP 3.01 >0.01 0.01 DEU 42.67 0.04 0.11 DNK 102.49 0.09 0.27 ESP 729.44 0.63 1.95 EST 3.69 >0.01 0.01 FIN 14.83 0.01 0.04 FRA 342.71 0.29 0.92 GBR 288.37 0.25 0.77 GRC 128.87 0.11 0.35 HRV 25.86 0.02 0.07 IRL 87.53 0.08 0.23 ITA 375.66 0.32 1.01 LTU 35.87 0.03 0.10 LVA 6.28 0.01 0.02 MLT 5.90 0.01 0.02 NLD 184.67 0.16 0.49 POL 19.04 0.02 0.05 PRT 99.18 0.09 0.27 ROU 0.56 >0.01 >0.01 SVN 0.53 >0.01 >0.01 SWE 48.94 0.04 0.13 TOTAL 2,591.59 2.23 6.94 Million litres fuel Million tonnes fuel Million tonnes CO2eq
The Fuel Use Intensity (FUI, litre per kilo of catch landed) of fisheries depends on the type of fleet deploying different fishing techniques and ranges from very high FUI for beam trawlers to low intensity for purse seiners ( Figure 2 ). The variability in FUI is generally large within a given segment among fishing nations. These differences in performance are likely the result of fleet segments exploiting different assemblages of species in various areas, especially between the North Atlantic Ocean (NAO) ( Appendix A) and Mediterranean and Black Seas (MBS) ( Appendix A) ecoregions that differ in biodiversity, stock status and fisheries management. For example, the FUI is much higher in the MBS than in the NAO for a similar fleet segment, while the lower intensity for passive gears and even more purse seiners than any other fleet segment still holds. On the contrary, passive gears in the OFR region are very
fuel-intensive ( Appendix A ), likely chasing for large pelagic species (e.g., tuna, swordfish).
Bottom trawling is the most fuel-intensive fishing activity, even if not the one having the largest Fuel Use Efficiency (FUE, litre of fuel burnt per effort unit). Depending on the Member State (MS) (Figure 3), some disparities exist for the same fleet segments. This likely reflects a different type of fisheries between MS, which are not captured here, given that fisheries level data are unavailable. There are also disparities across ecoregions. Many of the estimates of FUI in the MBS and OFR are larger than the globally averaged FUI of all fisheries (710 litres per tonnes of fish landed26,3,27). Because the FUI also depends on the catchability of the stocks, it reflects the degraded stock status in the MBS (on average, twice the fishing mortality rate that is deemed acceptable in this region28).
Bottom gears: 437336 tons
gears: 11714 tons
trawls: 358440 tons
gears: 120125 tons Passive gears: 57591 tons
Figure 2. Fuel Use Intensity of the main EU national fleets contributing to the fuel consumption in the EU fishing sector deduced from the STECF AER data averaged over 2008-2018. The gear categories are ordered from the lowest to the highest FUI values. The widths of the bars are proportional to the landed tonnes by each gear category.
3 Note: Calculated by Parker et al. (2018), as reported in Sala et al. (2022).
13
0.0 0.5 1.0 1.5 2.0 2.5 3.0 Bottom gears: 72573 tons Passive gears: 39570 tons Passive gears: 19423 tons Bottom gears: 13146 tons Purse seines: 23343 tons Purse seines: 27078 tons Dregde: 18791 tons Pelagic trawls: 41153 tons 0.0 0.5 1.0 1.5 2.0 2.5 3.0 Passive
Bottom
28175 tons Dregde: 338 tons Purse seines: 45032 tons 0.0 0.2 0.4 0.6 0.8 1.0 1.2 Bottom
Passive
Dregde: 4128 tons Pelagic trawls: 282355 tons 0.0 0.5 1.0 1.5 Bottom
Dregde:
Purse seines:
0.0 0.2 0.4 0.6 0.8 1.0 1.2 Bottom
tons Dregde: 35070 tons Passive
81858 tons Pelagic trawls: 65756 tons Purse seines: 22916 tons 0.0 0.5 1.0 1.5
Purse
0.0 0.5 1.0 1.5 2.0 2.5 3.0
Dregde:
tons 0.0 0.1 Average FUI (litre per kg) Average FUI (litre per kg) Average FUI (litre per kg) 0.2 0.3 0.4 0.5 Average FUI (litre per kg) Average FUI (litre per kg) Average FUI (litre per kg) Average FUI (litre per kg) Average FUI (litre per kg) ITA MBS ESP MBS NLD NAO FRA NAO ESP OFR GRC MBS DNK NAO ESP NAO
gears: 3162 tons
gears:
gears: 75490 tons
gears: 867 tons
gears: 139251 tons
6120 tons Passive gears: 59051 tons
123793 tons
gears: 187078
gears:
Bottom
seines: 239581 tons
Passive
Pelagic
42389
Bottom gears: 72573 tons
Passive gears: 39570 tons
Purse seines: 27078 tons
Dregde: 18791 tons
Pelagic trawls: 41153 tons
Passive gears: 19423 tons
Bottom gears: 13146 tons
Purse seines: 23343 tons
Bottom gears: 437336 tons
Passive gears: 11714 tons
Pelagic trawls: 358440 tons
Dregde: 42389 tons
Passive gears: 3162 tons
Bottom gears: 28175 tons
Dregde: 338 tons
Purse seines: 45032 tons
Bottom gears: 187078 tons
Dregde: 35070 tons
Passive gears: 81858 tons
Pelagic trawls: 65756 tons
Purse seines: 22916 tons
Bottom gears: 120125 tons
Passive gears: 57591 tons
Purse seines: 239581 tons
15000
Bottom gears: 75490 tons
Dregde: 4128 tons
Bottom gears: 139251 tons
Dregde: 6120 tons
Passive gears: 59051 tons
Pelagic trawls: 282355 tons
Purse seines: 123793 tons
The findings show that there are various fishing techniques to catch different fish assemblages over different fishing areas. The FUI largely depends on the fishing techniques, while the FUE depends on the vessel size. In all areas, passive gears and seiners are less fuelintensive than demersal trawls and purse seiners than pelagic gears. However, some longlining and pole fishing can be fuel-intensive when targeting large fish in the OFR. Pelagic vessels are large and have much higher FUE.
However, it is apparent that some fisheries target the same species and only differ by the fishing techniques used. This study identifies that as bottom trawling is more fuel-intensive (higher FUE and FUI) than other practices and does not constitute the “best available fishing technique” regarding fuel use intensity (Appendix A), it is the most appropriate to prioritise for fisheries’ technological improvement.
Figure 3. Fuel Use Efficiency (litre per day at sea) of the main EU national fleets contributing to the fuel consumption in the EU fishing sector, deduced from the STECF AER data averaged over 2008-2018. The gear categories are not ordered from the lowest to the highest FUE but from the lowest to the highest FUI values. The widths of the bars are proportional to the landed tonnes by each gear category.
This study notes that the data aggregation level does not allow for measuring the FUI per species targeted accurately. Data on landings and fuel consumption by vessel can only be available at the national and regional administrations. Transnational studies in Europe can only aggregate fuel use and catch per EU fleet segment and not per species, therefore disentangling the relative fuel use intensity and the catch-fuel efficiency of individual fisheries and species is quite a challenge.29 Two case studies are shown in Appendix B (for the Danish fleet) and Appendix C (for the Italian fleet) to overcome this limitation, and FUIs per fishery are provided here.
It is well known that differences in fuel use intensity and efficiency are the result of different practices identified at the level of individual fishing vessels. Vessels using mobile fishing gear such as trawls and dredges need powerful engines to pull the gear through the water, while fishing
14 by 2050 A pathway to decarbonise the EU fisheries sector
0 100 200 300 400 500 0 200 400 600 800 1000 1200 Average FUE (litre per days at sea) Average FUE (litre per days at sea) Average FUE (litre per days at sea) Average FUE (litre per days at sea) Average FUE (litre per days at sea) Average FUE (litre per days at sea) Average FUE (litre per days at sea) Average FUE (litre per days at sea)
0 1000 2000 3000 4000 5000
0 500 1000 1500 2000 2500 3000 0 50 100 150 200 250 300 350
0 500 1000 1500 2000 0 5000 10000 15000 20000 25000
0 5000 10000
ITA MBS GRC MBS DNK NAO ESP MBS FRA NAO NLD NAO ESP NAO ESP OFR
vessels using static gears (using pots and nets) only need enough power to cruise to and from their fishing grounds. However, some modern vessels
with passive gears have invested in larger engines to allow them to travel faster and use more gears in a day.30
1.2. Indirect emissions from disturbing blue carbon habitats
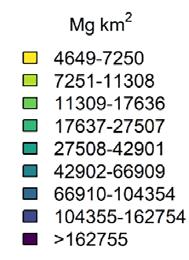
Blue carbon marine ecosystems include shallow waters with seagrass meadows, tidal marshes, and mangroves, all of which are among Earth’s most efficient absorbers and long-term storers of carbon. There are aquatic plants with rhizomes and roots that can retain carbon in the sediments for centuries, or macroalgae growing in the water column in dense populations (kelp forests or “blue forests”). This capacity for carbon storage makes them sources of CO2 emissions when they are degraded or destroyed.31,32 The deep ocean also has a vital role in storing carbon33 but is hardly explored by bottom fishing in EU waters and bottom fishing is now forbidden outside the historical footprint in the North-east Atlantic areas >800m deep34, and in areas >1,000m deep in the Mediterranean Sea.35 Therefore, the present study only focuses on the blue carbon habitats found in shallow waters of continental shelves (Figure 4). Maintaining, restoring, and extending blue carbon habitats is recognised as an ecosystem-based solution to remove and sequester excessive carbon currently released into the atmosphere.36
The study shows the fraction of the carbon stock lying within current conservation areas (Table 2 and Figure 5) and the possible annual release of the carbon sequestered in the seabed by bottom-contacting gears used in EU waters (Figure 6). Such information is timely as current access to designated areas of specific conservation interest are mostly still open to fishing, the EU's Biodiversity Strategy for 203037 and its recently proposed EU Nature Restoration law offer an opportunity to regulate mobile gears to protect these areas.38 The aim is to preserve seafloor integrity while conserving biodiversity and essential fish habitats. Retaining old carbon and sequestering new carbon on the seafloor should be an added benefit.
This study analyses available public data (Appendix D) for mapping the fishing effort, estimating the seabed sediment organic carbon stock in kg.m-2, and inside the currently designated protection areas (NATURA 2000 network of Marine Protected Areas [MPA] in EU waters39). GHG emissions hotspot areas are identifiable
by crossing spatial pressure and environmental data layers40,4 with seabed carbon fixation and release (or disturbance) assumptions.
Such hotspots would constitute priority areas for managers to act, which can be backed up with scenarios for fleet displacement or adaptation in response to restricting fishing. As well as disturbing marine sediment carbon stores, bottom trawling can also lower rates of carbon sequestration on the deep seafloor by reducing deep-sea biodiversity and biomass, given the critical role played by marine pelagic and benthic life.42 This latter aspect is not calculated in this report.
15
© OCEANA
4 Note: For example, mapping Posidonia meadows withdrawal in the Mediterranean estimated from a predictive model with geospatial modelling.
By comparing with emissions deduced in Section 1 (i.e., 6.94 million tonnes CO2 in all countries, minus 0.77 from the UK fleet), our present findings show that the indirect loss of sequestered carbon from disturbing the seabed may represent up to ca. 15fold the direct emissions of burning fossil fuels when operating the fishing itself.
However, estimates of carbon release from the seabed could be highly variable, along with different assumptions related to the C labile fraction 5 specific to sediment types and the organic carbon degradation rate that occur naturally on the seabed.
Blue carbon
16 by 2050 A pathway to decarbonise the EU fisheries sector
Figure 4. Estimated blue carbon stock (recalculated from Atwood et al. 2020) and known conservation areas designated inside the EU Marine Strategy. Framework Directive (MSFD) areas.
Table 2. Carbon stock aggregated per region inside MPAs compared to overall stock in the region. Aggregates in MSFD areas are provided deduced from geolocalised mean carbon stock estimated by Atwood et al. (2020).
5 Note: Labile organic carbon fraction (LOC) is organic carbon which represents the fraction of organic carbon found in the seabed that is easily biodegradable, opposed to the stable fraction of organic carbon, which is slowly biodegradable.
Baltic Sea 853,239 14,834 13,762 5,639,181 17.7 15.1 Black Sea 122,949 15,988 14,716 6,793,277 1.9 1.8 Med. Sea 1,571,577 9,927 9,021 28,655,140 5.6 5.5 Atlantic 3,258,790 6,698 7,312 72,087,261 5.2 4.5 Region Sum carbon stock in MPAs (thousand tonnes) Mean carbon stock in MPAs (g per m2) Mean carbon stock (g per m2) Overall carbon stock (thousand tonnes) % MPAs surface % Carbon in MPAs
% total surface area of MPAs in the region
% of total regional carbon stock in MPAs
Seabed carbon loss from fishing disturbance
lost
from the disturbance of bottom-contacting
on the
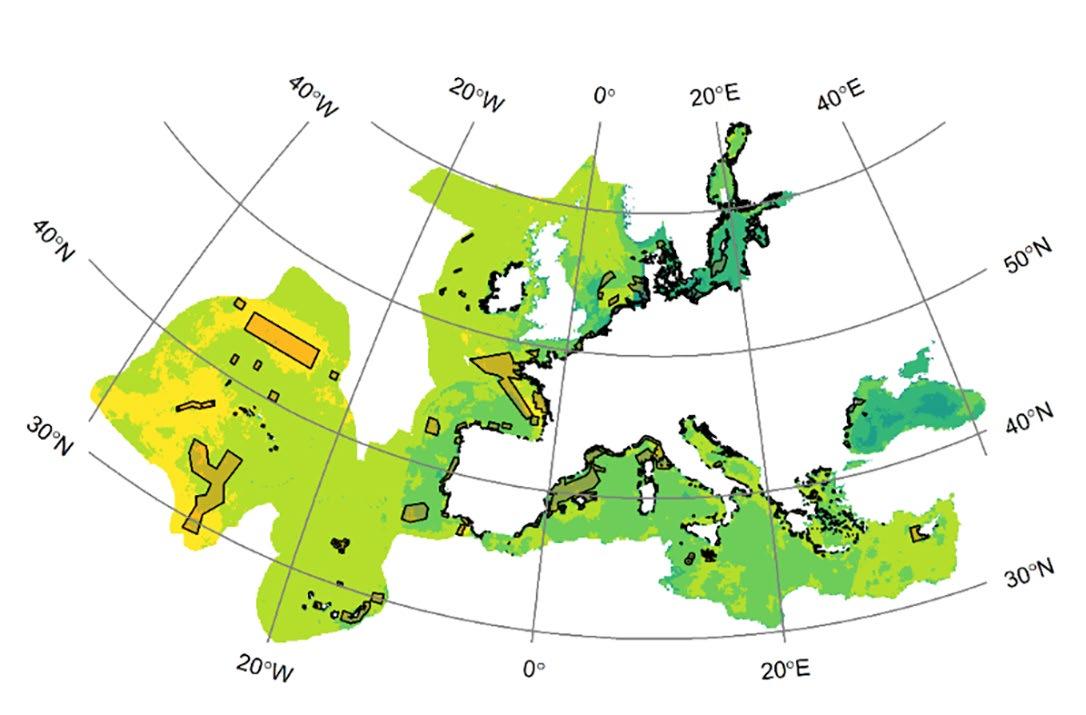
These estimates are deduced by overlaying the subsurface Swept Area Ratio computed in each grid cell in 2020 by EU fleets using bottom-contacting gears within the MSFD areas, together with the seabed carbon stock mapping of Atwood et al. (2020). Grid cells are 1km large. Geographical Lambert projection used here.
17 0 5 10 % 15 Baltic Sea Black Sea Med. Sea North Atlantic
Figure 5. Percentage of carbon stock lying in the designated MPAs per region compared to % surface area represented by MPAs in each region.
Figure 6. Estimated tonnes of carbon (C)
per year (y)
gear
seabed.
© OCEANA / Carlos Minguell
2. Potential for reducing the carbon footprint of the EU fleet
2.1. Potential fuel savings in EU fishing fleet by transitioning from mobile bottom contacting gears to passive gears
This present study provides an estimation of the average EU fleet fuel consumption per gear category for each EU country (i.e., demersal trawlers & seiners [DTS], beam trawlers [TBB] and vessels using active & passive gears [PMP], vs vessels using polyvalent passive gears only [PGP]; dredgers [DRB] and midwater trawls [TM]) (the 22 coastal EU countries, i.e., Belgium, Bulgaria, Denmark, Germany, Estonia, Ireland, Greece, Spain, France, Croatia, Italy, Cyprus, Latvia, Lithuania, Malta, the Netherlands, Poland, Portugal, Romania, Slovenia, Finland, and Sweden). This is possible by using the economic data allowing for a standard aggregation of fleet FUI over time (2008-2018) (Section 1.1). Despite data limitations highlighted in a previous study43, this study argues that the fuel use data (data that is routinely collated by the Joint Research Center (JRC) annually)43,44,45 is sufficient to detect noticeable differences across fishing fleets when averaged over 10 years.
From these estimates, the study can provide a static evaluation showing a scenario of switching fishing effort from the mobile bottom gear category to the passive gear category, leaving the pelagic gears and dredge gears untouched. This study focuses on bottom trawling because it is viewed as the most destructive 46,47 and fuel-intensive fishing practice 48 and has been compared to forest clear-cutting. 49 Dredging for molluscs also penetrates the seabed but in a much narrower surface area.
When available, the study provides a more refined data analysis illustrating two refined re-allocation cases focused on the Danish and Italian fleets, for which less aggregated data are publicly available. This is done at a less coarse fleet-segment resolution at the level of fisheries - defined as a combination of specific gear, area, and assemblage of species. This is a more specific data level than using only gear categories. The analysis is done at the fishery level based on supplementary data from scientific articles about Danish fleets, 50 re-used here for testing the switching toward Danish seining ( Appendix B ), and
from articles about mobile gears used by Italian fleets 51 for testing the effect of switching towards less-intensive trawling ( Appendix C ). As a follow-up, a comparison with the fleet segments aggregated per-nation analysis is made for a cross-check and error estimation. With such rare but finely resolved datasets, more specific scenarios can be examined, such as a transition from bottom trawling to demersal seines (a scenario analysis that cannot be done at EU level, given seiners and trawlers are pooled together in the EU Data Collection Framework).
Based on such analyses, the study can estimate the following:
• FUI (litres per kilo of fish), which helps identify the fuel-intensive fisheries and makes a ranking possible. If fishery-level data is available, this further enables ranking the targeted species per FUI and scoring a species favourably if the gear involved is low-intensity in terms of fuel use.
• FUE (litre per unit effort) which helps identify the efficient gear specifications and vessels. This enables specifications ranking (e.g., from passive gears, semi-pelagic trawls to bottom otter trawls) depending on gear efficiency.
• CPUF stands for catch-fuel efficiency in kg per unit of fuel.
• Catch Per Unit Efficiency (CPUE) is catchefficiency in kg per unit of effort.
It is observed that FUI=FUE/CPUE; therefore, FUI depends on the fuel required by the fishing technique deployed (specific vessel and gear in a given area) and the catchability of the target species with this technique. In contrast, FUE depends only on gear and vessel specifications and is sensitive to technological breakthroughs.
18 by 2050 A pathway to decarbonise the EU fisheries sector
Method used for re-allocating the effort from bottom-contacting gears to other gear types.
The present method to re-allocate fishing effort (days at sea) from fleet segments using mobile bottom-contacting gears to segments using passive gears is based on historical data on energy use, effort and landings per Data Collection Framework (DCF) fleet segment (STECF AER Transversal data) and average over 2008-2018 (i.e. after the introduction of the DCF in 2008).
In re-allocating the effort from one segment to the others, the additional fuel consumption induced by the segments receiving extra fishing effort is calculated by multiplying the effort (days at sea) received with the average catch rate (kg per day at sea) specific to each segment and finally to the average fuel use intensity (FUI, litre per kg), also specific to each segment. On the other way around, the removed fuel consumption from the donor fleet segment is calculated as the fuel consumption corresponding to the foregone effort by this segment. The re-allocation effect is tested along with a percentage of effort moving from 0% to 100%. The effect is anticipated on fuel consumption, landings, income from landings, variable costs, and contribution margin.
The contribution margin is expressed as the income from landings minus the variable costs as a proxy for a gross return from fishing. The re-allocation accounts for the vessel size making the fleet segment, and both the donor and receiver segments belong to the same vessel size category. A donor can give an effort to several receivers; in this case, the effort is evenly dispatched among the receivers. The re-allocation is done per region NAO, MBS, and OFR, to respect a reallocation consistent with the fishing areas.
When computing the emissions from the fuel consumed, a total direct emission from burning fuel of 2.64 kg CO2-eq per litre of fuel is assumed, based on the chemical content of marine fuels.52 This is a conservative assumption as it does not account for fuel-related GHG emissions calculated in the literature using a 3.1 kg CO2-eq per litre for accounting for direct emissions from burning fuel and emissions from upstream mining and processing and transport of fuel.53
There are shortcomings in applying this re-allocation method:
• It is assumed that a unit of effort can convert from one activity to another without transaction costs. However, the reconversion of fishing from one fishing technique to another is likely not straightforward and will have to consider viable transition paths (see next section). Alternatively, it could have been assumed that no re-allocation is made. However, phasing out every emission by the concerned fleets instead of assuming a ban without a replacement would have been a strong assumption.
• The re-allocation between segments could be made directly in landings terms, like re-allocating catch quotas, as soon as both the donor and the receiver fleet are observed to target the same marine species. In the absence of sufficient details in the dataset (i.e., data not by fishery), it was impossible to re-allocate this way. Instead, a re-allocation of fishing effort is made. It is known that the fishing effort metric expressed in days at sea does not describe the fishing pressure exerted by passive gears well.
• It is assumed that by re-allocating effort from one gear to another, the same fish that is being caught is accessible to any kind of fishing technique. In the scope of this study, it is reasonable to assume that any kind of fish caught with mobile bottom-contacting gears could be caught with passive gears.
Finally, it is observed that a refined effort re-allocation scenario among fishing agents would be best, based on sustainability considerations besides fuel use. In Europe, the harvested stocks should be exploited at or below the FMSY,54 which is a reference point not available for all stocks. When available, some stocks are proven to be overfished in EU waters.55 Hence, it might not be feasible to re-allocate efforts toward other types of fisheries if these fisheries are already found imbalanced with their fishing opportunities. If the finer fishery data level had been available, such effort re-allocation could have used the F/FMSY ratio to indicate which fisheries could receive extra effort and which fisheries could not because of current overexploitation status. Using a dynamic bioeconomic model informed at the fishery level would be best suited to account for these effects.
19
The ranges in FUI obtained by these present analyses confirm that fuel intensity for bottom trawls and several static gears are very similar among large vessels, as reported in previous studies, and that the least fuel intensity is achieved by segments using midwater trawls and purse seine. Active demersal segments generally have a slightly higher fuel use intensity than midwater trawls (TM) and passive gears (PG) segments. The overall look at the different fishing gears also seems to indicate that if very small vessels using PG are less fuel intense, some smallscale coastal fisheries (PGO) are not necessarily more fuel efficient than larger vessels, especially the vessels searching for the pelagic species. This outcome could seem counterintuitive as the small vessels are fishing close to shore and often with passive gears. The reason could be that the CPUE is lower, and the large vessels with pelagic trawls can catch many fish with relatively low fuel input.
The results from this investigation show that contrasting outcomes of re-allocating quotas (via effort) from the mobile to the passive gears categories could be expected, depending on the Fuel Use Intensity of the fleet segments making these categories, which is also specific to countries. The expected fuel-saving benefits from transitioning from bottom trawls to passive gears by re-allocation of effort will vary depending on the existing fuel intensity that the ones fisheries using passive gear have in a particular country.


Fuel savings from a transition might be expected in the Italian case (up to 42% if all catch allowances are redirected to passive gears, Figure 7 ). Similarly, there might also be such a fuel reduction in the Danish case (62% reduction in fuel use, Figure 7 ). For a few countries, there is a lack of fuel saving, even if all mobile bottom gears are phased out of the fleet. This is explained by the FUI of AER fleet segments deploying mobile gears similar to those of passive gears (likely when spending a significant amount of time searching for the fish). The pelagic fleet, which by nature does not touch the sea bottom and proves to have very low FUI, has not been affected by the re-allocation scenario.
The effort re-allocation among fleet segments ( Figure 8 ) enables some fuel savings that translate into millions of litres avoided ( Table 3 ). The cost of reducing emissions (e.g., +/- Euro per saved kg of CO 2 ) has also been investigated by analysing the


AER data for each country on the differential static revenue expected after re-allocating the fishing rights (here: the effort).


From these findings, there is an overall 34% fuel savings when phasing out 100% of the most severely impacting mobile bottom-contacting gears by re-allocating effort to less-impact fishing techniques ( Table 3 ). The economic contribution margin is 6% less in such a scenario, with great variation among countries. The main national fleets, Spain, France, and Greece increased their annual contribution margin, whereas contribution margins for other countries could lead to large losses compared to the status quo.
20 by 2050 A pathway to decarbonise the EU fisheries sector
From these findings, there is an overall 34% fuel savings when phasing out 100% of the most severely impacting mobile bottomcontacting gears by re-allocating effort to less-impact fishing techniques (Table 3).
© OCEANA / Carlos Minguell
% reallocation of bottom-contacting gears
% reallocation of bottom-contacting gears
Figure 7. A possible linear decrease in EU 2008-2018 average fuel consumption split per country (MS + GBR)-based fishing fleet segments along with scenarios for re-allocating the fishing effort from donor to receiver fleets (0 to 100% of the effort of segments using mobile bottom-contacting gears). Each panel's legend of the fleet segments is ordered from the highest to the lowest fuel consumption. Shown per EU ecoregion (MBS, NAO, and OFR).
21 Fuel consumption (thousands litres) 100,000 200,000 300,000 0 25 50 75 100 Fuel consumption (thousands litres) 100,000 200,000 300,000 0 25 50 75 100 0 0 Fuel consumption (thousands litres) 100,000 200,000 300,000 0 25 50 75 100 0
reallocation of bottom-contacting gears ITA MBS MS GRC MBS ESP MBS FRA MBS HRV MBS MLT MBS CYP MBS BGR MBS ROU MBS SVN MBS MBS
NAO
%
OFR GBR NAO MS FRA NAO ESP NAO NLD NAO DNK NAO IRL NAO PRT NAO SWE NAO DEU NAO BEL NAO POL NAO LTU NAO ESP OFR MS FRA OFR PRT OFR
Figure 8. Top 8 EU Fleets - Potential change in overall and fleet-disaggregated fuel use along with a scenario for a redistribution of the quotas (here: via fishing effort) from mobile bottom-contacting gears (i.e., demersal trawls and seines, represented in purple) to passive gears (represented in green) . Pelagic trawls and dredge (represented in yellow) were considered not affected by the scenario. The redistribution was made consistent with the vessel size category. Based on the EU STECF AER 2008-2018 collecting fuel and landings data.
22 by 2050 A pathway to decarbonise the EU fisheries sector
0 100,000 0 25 50 75 100 200,000 300,000 Fuel consumption (thousands litres) % reallocation of bottom-contacting gears Fuel use - ITA MBS fleet 0 50,000 0 25 50 75 100 100,000 Fuel consumption (thousands litres) % reallocation of bottom-contacting gears Fuel use - GRC MBS fleet 0 25,000 0 25 50 75 100 50,000 75,000 100,000 125,000 Fuel consumption (thousands litres) % reallocation of bottom-contacting gears Fuel use - ESP MBS fleet 0 100,000 0 25 50 75 100 200,000 Fuel consumption (thousands litres) % reallocation of bottom-contacting gears Fuel use - FRA NAO fleet 0 0 25 50 75 100 50,000 100,000 150,000 200,000 Fuel consumption (thousands litres) % reallocation of bottom-contacting gears Fuel use - NLD NAO fleet 0 50,000 100,000 0 25 50 75 100 200,000 250,000 150,000 Fuel consumption (thousands litres) % reallocation of bottom-contacting gears Fuel use - ESP NAO fleet 0 0 25 50 75 100 30,000 60,000 90,000 Fuel consumption (thousands litres) % reallocation of bottom-contacting gears Fuel use - DNK NAO fleet 0 100,000 0 25 50 75 100 200,000 300,000 Fuel consumption (thousands litres) % reallocation of bottom-contacting gears Fuel use - ESP OFR fleet


23
BEL NAO 23,215 -45.1 40,577 -33.0 43,402 -69.9 114,581 34,486 BGR MBS 9,115 -28.4 1,263 -116.0 2,713 41.7 7,162 10,148 CYP MBS 1,511 2.1 -4,629 7.0 3,096 -21.3 8,173 6,428 DEU NAO 79,803 -55.6 98,991 -51.0 45,334 -70.5 119,682 35,292 DNK NAO 843,156 -46.8 329,364 -39.0 108,275 -61.6 285,846 109,631 ESP MBS 81,250 -1.6 157,336 32.0 119,993 -25.5 316,782 235,881 ESP NAO 329,326 -0.7 422,564 9.0 240,299 -26.6 634,389 465,810 ESP OFR 469,237 -21.6 533,631 -46.0 320,278 -27.9 845,534 609,692 FRA MBS 23,754 -36.6 82,204 -28.0 35,169 -53.3 92,846 43,338 FRA NAO 393,855 8.9 510,312 91.0 266,025 -33.3 702,306 468,120 FRA OFR 107,142 0.6 37,999 11.0 50,470 -1.8 133,241 130,883 GBR NAO 646,968 -5.6 480,472 -7.0 295,910 -22.9 781,202 602,635 GRC MBS 56,587 -18.4 -82,301 30.0 131,363 -32 346,798 235,884 HRV MBS 71,236 -5.5 21,292 -17.0 26,156 -29.8 69,052 48,505 IRL NAO 247,596 0.9 131,439 -23.0 91,723 5.8 242,149 256,091 ITA MBS 198,970 -10.8 509,686 -11.0 373,694 -42.5 986,552 567,571 LTU NAO 22,239 -13.6 3,044 -17.0 2,910 -33 7,682 5,145 MLT MBS 3,348 -22.4 -8,061 136.0 9,245 -23.4 24,407 18,689 NLD NAO 362,241 -14.8 198,428 -48.0 202,427 -57.2 534,407 228,497 POL NAO 158,804 -15.3 27,787 -17.0 19,952 -21 52,673 41,614 PRT NAO 169,663 -19.2 199,242 -19.0 87,288 -39 230,440 140,583 PRT OFR 14,029 3.2 5,835 -36.0 15718 -10.6 41,496 37,079 ROU MBS 4,092 -88.9 3,006 -80.0 893 -56.1 2,358 1,035 SVN MBS 656 -13.3 505 -38.0 534 -33 1,410 942 SWE NAO 223,813 -14.8 69,648 -33.0 56328 -16.5 148,706 124,180 ALL 5,004,351 -15.1 3,801,045 -6.4 2549195 -33.8 4,944,543 3,704,237 M.S. Landings (initial) in tonnes Contribution margin (initial) in thousand euros Fuel use (initial) thousands of litres CO2eq tonnes (if no ban) % Landings change (if 100% ban) % Contribution change (if 100% ban) % fuel change (if 100% ban) CO2eq tonnes (if 100% ban)
Table 3. Overall fuel savings potentials and economic outcomes of re-allocation scenarios per country and ecoregion.
2.2. Avoidance of carbon release through a transition towards an effective network of MPAs to conserve blue carbon habitats
The study estimates the change in carbon release induced by displacing the fisheries (Table 4). We used the International Council for the Exploration of the Sea (ICES) Vessel Monitoring System (VMS) data as an ICES deliverable to the OSPAR organization.56 The dataset provides the swept area as the cumulative area contacted by a fishing gear within a grid cell over one year. The swept area ratio (SAR, also defined as fishing intensity) is the swept area divided by the surface area of the grid cell. Only the subsurface SAR is used in this report, as possible released carbon from the seabed is linked to the fishing intensity penetrating the sediment profile (Figure 9).
For the same region - the North-East Atlantic falling under the OSPAR convention - we observe a
significant difference with estimates of annual carbon loss depending on the fishing pressure dataset used to deduce them, i.e., from the Automatic Identification System (AIS) data treated by GFW or from the ICES VMS data. One obvious explanation is the presence of the now non-EU UK fleet in the ICES dataset (given the level of ICES data aggregation, there is no way to subset for it). Because the UK is present, the surface Swept Area Ratio (surfSAR) is much higher than deduced from Global Fishing Watch (GFW). However, there is likely some issue with the AIS data coverage, preventing accurate estimates from GFW. Because of this, it is better here to use the estimates deduced from the ICES data whenever available.
EU Fleet Register anymore.
24 by 2050 A pathway to decarbonise the EU fisheries sector
Table 4. Estimated tonnes of carbon loss annually from the seabed disturbance by mobile bottom-contacting gears deployed by the EU Fleet (in 2020). Assuming a conversion factor of 3.67 gCO2 per g C. The Black Sea has been excluded because the 2020 GFW data coverage was found inadequate for this region, which means excluding Bulgarian and Romanian fleets. The estimates are also excluding the UK fleet, which is not registered in the
Tonnes of carbon loss from seabed disturbance 10,494,208 Baltic Sea+Med Sea+NEA (loss tonnes CO2eq) 38,513,743 Baltic Sea (loss tonnes CO2eq) 3,849,365 Med Sea (loss tonnes CO2eq) 12,532,659 Northeast Atlantic in OSPAR (loss tonnes CO2eq) 22,231,969
carbon loss
seabed disturbance
Carbon loss from seabed disturbance by fishing in OSPAR areas (tonnes) 9,181,276 Emissions (tonnes CO2eq.y-1) 33,695,283 Emissions (tonnes CO2eq.y-1) when displaced from designated MPAs 34,996,122 +3.87 Emissions (tonnes CO2eq.y-1) when displaced from core grounds 28,111,318 -16.58 Emissions (tonnes CO2eq.y-1) when displaced from blue carbon habitats 32,087,660 -4.78 Annual carbon loss by seabed disturbance from fishing in OSPAR area % Change
Table 5. Estimated tonnes of carbon loss and CO2 emissions annually from the seabed disturbance by mobile bottomcontacting gears deployed by the EU Fleet, including the UK fleet. Assuming a conversion factor of 3.67 gCO2 per gC. Blue carbon habitats were arbitrarily defined in this case as areas with Atwood et al. 2020’s estimates >14,000 gC.m-2
Annual
by
from fishing
Seabed carbon loss from fishing disturbance
Figure 9. Estimated tonnes of carbon C lost per y from the disturbance of mobile bottom contacting gears on the seabed. These estimates are deduced by overlaying the subsurface Swept Area Ratio computed in each grid cell in 2020 by EU fleets using bottom-contacting gears within the OSPAR-MSFD areas, together with the seabed carbon stock mapping of Atwood et al. 2020. Additional assumptions were required (Appendices D and E). Grid cells are 800x800m large.
Seabed carbon loss from fishing disturbance
Figure 10. Change in carbon loss induced by fishing pressure when displaced from the existing conservation areas (in red). The dark pink polygons correspond to areas which occur from the overlap between the Natura 2000 sites and the CDDA sites.
25
For the OSPAR region, the findings show that the designated MPAs in this region would likely not help in mitigating the loss of carbon induced by the fishing disturbance of the sediment of the seabed ( Figure 10 ) as it might induce an increase of 4% in loss when the fishing effort of mobile bottom-contacting gears is displaced to surrounding areas ( Table 5 ). This result shows that the designated areas in this region were likely not based on preserving blue carbon habitats or on protecting them fully . Protection is counterproductive if the effort can be displaced to the surrounding accessible areas without reducing the total fishing effort.
Furthermore, the analysis confirms that it is possible to prevent blue carbon loss by 16% ( Table 5 ) when the fishing effort of mobile bottom-contacting gears is displaced from the main fishing grounds. Such a scenario, however, is quite unrealistic because restricting access to the currently exploited grounds would significantly impact the fisheries economy while displacing fishing efforts toward less impacted areas. However, what can be seen is that reducing the total fishing effort would help save part of this carbon, as indirectly indicated by the importance of the avoided carbon loss when closing the core fishing grounds of the OSPAR region.
OCEANA
In comparison, the estimated avoided carbon loss is 5% from displacing fishing effort away from hotspot areas of blue carbon ( Table 5 ). Preserving hotspots of blue habitats is helping avoid carbon loss but reducing fishing effort at the same time as implementing area restrictions would further help. However, the degree to secure a given amount of carbon loss avoided is uncertain and depends on the thresholds used to define those hotspots (here, it was >14,000 g.C.m 2 in the top 1m sediment).
Scientists call for the effective prohibition of all destructive fishing methods and harmful industrial activities in Marine Protected Areas. 57 A common criticism is that insufficient management measures have been put in place alongside the conservation areas (Natura 2000) in Europe to enable conservation benefits to both halt the loss of marine biodiversity and improve the state of commercial fish species in these areas. 58 There is a false promise that maintaining detrimental, impacting activities in sensitive habitats could ensure their long–term protection. Existing evidence indicates that, for certain species, a reduced level of fishing pressure and related fish mortality is unavoidable and can only be achieved by reducing effort or by using different fishing techniques, which will be better than banning all fishing techniques locally or displacing efforts to surrounding areas. 59
This calls for ensuring that compatible fishing techniques are still allowed within the protected areas, whereas incompatible techniques such as mobile bottom-contacting gears are excluded, phased out, or forced to reconvert.
There is now a push towards nature-based solutions to climate change mitigation. Blue carbon ecosystems are particularly important for their capacity to store carbon and are considered a key component of nature-based solutions. Unfortunately, many of these habitats are under threat and under pressure, partly due to destructive fishing methods. For example, seagrass meadows responsible for sequestering carbon in the seas are being lost at a rate of 2-7% annually worldwide, mainly due to pollution of coastal waters and destructive fishing practices. 60 Monitoring data shows an alarming declining trajectory of European seagrasses since 1869 61 with
26 by 2050 A pathway to decarbonise the EU
fisheries sector
©
a reversal trend in seagrass extent and density. 62 This improvement is likely related to renewed conservation efforts in Europe following the implementation of the Habitats Directive. 63 The target of environmental management should be to avoid emissions by keeping the carbon that is currently stored in soils and vegetation stable and undisturbed.
Research needs to help identify key areas to be protected from mobile bottom-contacting gears when these habitats are detected as more vulnerable than others. For example, scientists called for further research to continue to shed light on the fate of organic carbon after trawling (e.g., remineralization, transport, and consumption).64 However, chronic fishing disturbance has probably already shaped the seabed in some areas. In such a context, it is difficult for research studies to prove the effect of conservation measures such as managing fisheries spatially, also because historical data is limited to a few decades. The long-term evolution of marine ecosystems and the potential for seabed to return to a healthy, more productive ecosystem state is therefore likely underestimated when fishing is widespread, and no unaffected area is available for comparison.65
EU legislation already protects specific marine habitats, including seabed habitats, such as in the Technical Measures66 and Deep-Sea Access EU Regulations,67 but this protection is limited to shared waters and deepsea areas. However, there are now great expectations for the coming European Commission “Action plan to conserve fisheries resources and marine ecosystems” due by 2023 as announced in the “EU Biodiversity Strategy for 2030”, which should oversee identifying measures that will be introduced, where necessary, to restrict the use of fishing gear most harmful to biodiversity, including on the seabed. This would include increasing the carbon storage capacity of marine sediments and contributing to reducing CO2 emissions.
Member States have also designated many MPAs, including the Natura 2000 sites. However, enforcement of management plans is key and currently lacking for them to be effective. 68 Even if there are solid global commitments to protect 30% of the ocean by 2030 and especially Key Biodiversity Areas (KBA), as a follow-up of the 10% objective under the CDB Achai target 11 (also the UN SDG Target 14.5), in some jurisdictions, it is not followed with action. For example, France, the second largest Exclusive Economic Zone (EEZ) in the world,
committed to protecting 30% by 2022. However, it was found that while an MPA covers 33.7% of France’s waters, 12.5% of these areas do not impose regulations stronger inside than outside. Total and high levels of protection, which are the most effective for biodiversity conservation, represent only 1.6% of French waters. 69 MPAs need to be better designed to prohibit destructive practices and effectively enforced.
One side effect of implementing spatial measures is changing the effort allocation patterns and inducing effort displacement to the surrounding non-protected areas. To which extent this redirection can affect the habitats now suffering from extra pressure should be carefully estimated. Recent advice 70,72 and research 73 showed that each fishery typically has a ‘core’ fishing ground, which provides 90% of the catch value from less than 40% of the area fished. ICES advises reducing bottom trawling in ‘peripheral’ fishing areas of low economic return by concentrating the fishing effort on the core grounds. This also aligns with the fact that currently designated Natura 2000 sites do not typically belong to the core grounds. 74 However, adverse effects on exploited living marine resources are expected if fleets’ target species are strongly associated with sensitive habitats. In this case, it is necessary to reduce overall fishing effort.
27
There is now a push towards nature-based solutions to climate change mitigation. Blue carbon ecosystems are particularly important for their capacity to store carbon and are considered a key component of nature-based solutions. Unfortunately, many of these habitats are under threat and under pressure, partly due to destructive fishing methods.
2.3. Existing and new technological solutions for reducing the CO2 emissions in fisheries
Many solutions to reduce fuel use already exist ( Appendix F ). 75
In the short term, there are four main axes for action:
Vessel: Gear:
Technologies to improve vessel structure and onboard equipment such as hull and propeller improvements, improved propulsion and auxiliary engines, improved fuel performance, LED lighting, alternative refrigerants, and assisted fishing.
Strategy:
Strategies to improve fishing in operation, such as route optimization, onboard fuel control and monitoring, and slow steaming.
Not all solutions fit all types of fishing practices. Within the EU fishing fleet, energy-use patterns are highly related to whether the fishery employs passive or active fishing gears ; active fisheries that require towing gear, 76 such as trawlers or Danish seines, tend to consume most of their fuel during the fishing mode. Measures designed to reduce fuel consumption while in fishing operations are the most cost-efficient for such fisheries . There is substantial literature devoted to assessing how to reduce the drag in trawling fisheries, compared to actions undertaken to improve other measures related to the ‘vessel’ or ‘strategy’ categories. In contrast, for purse seiners and pole and liners targeting pelagic species, most fuel consumption is associated with time steaming to the fishing grounds or finding fish. This translates into higher fuel consumption spent during the steaming stage, so route optimization and slow steaming measures appear the most suitable for this type of fishery. Beside changing gears, for example, from bottom-contacting trawl to semipelagic trawls ( Figure 11 ), most of these solutions imply retrofitting vessels. Retrofitting may be costly in some occurrences, but it has also been reported as an easy-to-implement solution for converting trawlers toward using passive gears.
For more in-depth retrofitting, there are examples of success in transitioning vessels to other fishing techniques reported in the specialised press to
Fishing gear technologies to reduce fuel consumption, such as new netting and gear designs that reduce drag and fishing gears that improve catch efficiency.
Regulatory and management measures:
Measures that improve energy efficiency by regulatory or management means.
reduce fuel use drastically. In the example of Osprey Fish Group’s beam trawler Anna PZ-675, during the beamer’s couple of months at the yard, the main engine was replaced and coupled to a high-efficiency propeller.77 The yard carried out before and after bollard pull tests to ensure the figures, and the vessel is expected to reduce its fuel consumption by 25-28% for the same towing power. A vessel fit with a bulbous bow,78 a propeller channel set into the hull, or a large diameter propeller ensuring efficiency, seakeeping, and stability. A propeller channel set into the hull79 involves installing a nozzle under the counter. The tunnel above the nozzle enables a large-diameter propeller with a reasonable draught. The prototypes of Tunnel of LoC could have achieved fuel savings of 30%. As a co-benefit, with Tunnel of LoC, a low draught enables entering and leaving shallow draught ports at any time.
Another design that has proven its worth in the navy in the past but is still little used in the civilian naval industry is the “inverted bow” - including better seakeeping which improves safety and comfort on board in facing frequent rough sea conditions. 80 The inverted bow also improves the vessel's performance, which gains speed without consuming more fuel. This solution also offers a gain on the forward spaces, including the front deck. More equipment can be installed at the waterline, and the living quarters on board can be improved when space is limited.
28 by 2050 A pathway to decarbonise the EU fisheries sector
A vessel equipped with hybrid diesel-electric propulsion is a viable solution for large vessels (e.g., reported 15-17% saving with the Scombrus, an 81m French pelagic vessel, or smaller vessels like the “MDV-1 Immanuel” having a special shape and the diesel-electric propulsion that can provide 60% fuel and CO 2 savings compared to comparable fishing vessels 81 ). Transitioning to an electrical system reduces the carbon footprint but will not remove it entirely. Hybrid systems would not be of significant benefit to all vessels using mobile gears because of their need for high engine power most of the time. 82 Reduction from electrification will also depend on how electricity is produced by a national entity (hydroelectricity, coal, etc.). The electrical energy consumed onboard is sometimes directed to refrigeration chambers onboard that may be extensive (as large as cooling 2,000 tonnes of fish for larger pelagic vessels). Auxiliary electrical engines may also be used onboard for gear operations and to maintain the vessel at sea while switching the main engine. 83
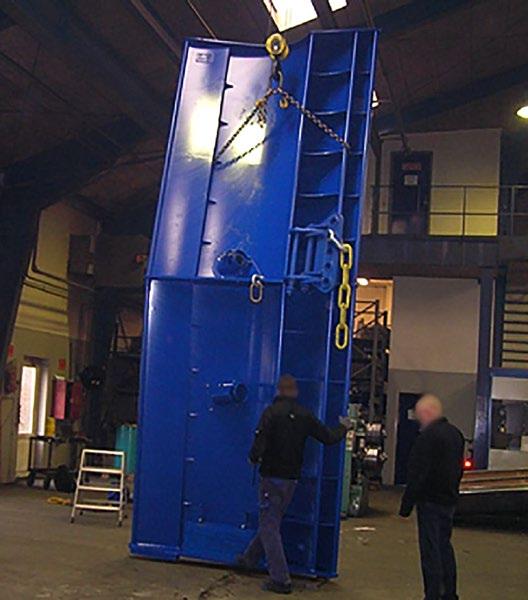
The use of alternative fuel is also being explored for the fishing sector. For example, there are cases of pelagic vessels fuelled with LNG. 84, 6 If a 10-20% fuel use reduction is expected with hybrid diesel propulsion, the expectation is 35% more with LNG. However, in France, the project identified
a regulation misfit that obstacles LNG onboard for vessels < 500GT (not allowing storage of LNG cylinders on board), and other technical barriers (lower volume density of LNG requiring more storage capacity, security onboard, toxicity), or using the waste oils, or carbon-free fuel such as bio-methanol or using an additive to the fuel to improve engine power energy efficiency.
If technologies to reduce fuel use in fisheries already exist, the uptake by the sector is low. 85 There are barriers that prevent the full uptake of such innovation in the EU fishing sector ( Section 4.1 ).
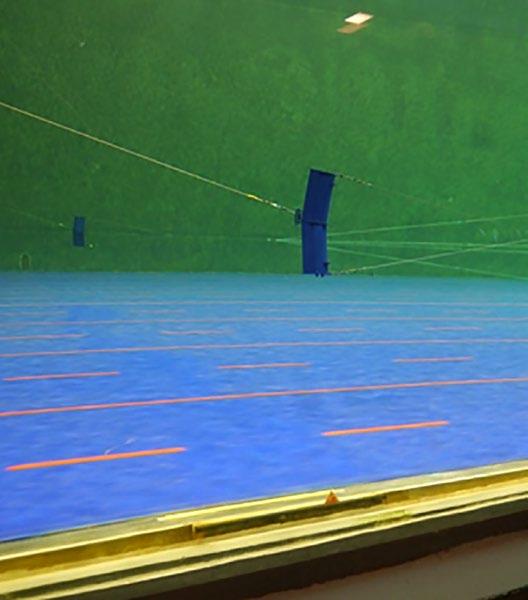
29
Figure 11. Semi-pelagic trawl doors tested in a water tank (Extracted from Bastardie et al. 2022).
6 Note: For example, Retrofit in Norway, in the Netherlands for large pelagics or in France (the "Fregate" project in 2013).
3. Past trends and reduction paths of carbon footprint in meeting targets
3.1. Consumption Baselines
In December 2019, the European Commission announced the Green Deal as a new policy with the ambition to reduce net GHG emissions by at least 55% by 2030, compared to 1990 levels, 86 on a responsible path to becoming climate neutral by 2050. 87 A set of proposals were adopted to make the EU's climate, energy, transport and taxation policies fit to meet this target. For the fishing sector, the energy transition should contribute to achieving the goal of the EU’s Common Fisheries Policy (CFP), aiming at ensuring that fishing (and aquaculture) is economically, socially, and environmentally sustainable. 88
Defining the 1990 baseline carbon footprint of the EU fisheries sector is first necessary to track the progress of such energy transition. The investigation in this study has so far used STECF AER back to 2008 (i.e., first year of implementation of the EU Data Collection Framework (DCF). This is because, before 2008, the EU Data Collection Regulation (DCR) collected back from 2002 energy use data only sparsely, which is considered unreliable. 89 Finding reliable fuel-consumption-related data to define the 1990 baseline is challenging.
From the collection of fisheries data, energy use data before 2002 is not accurate for the EU fishing sector,
also because fishing sector consumption is usually lumped together with the energy use of the forestry and agriculture sectors.
A few studies found have tried to reconstruct some of the energy use specific to the fishing sector from “bottom-up” approaches (i.e., based on estimates of fishing effort) that might complement this, including a global analysis of emissions from world fisheries, 90 or specific to the EU. 91
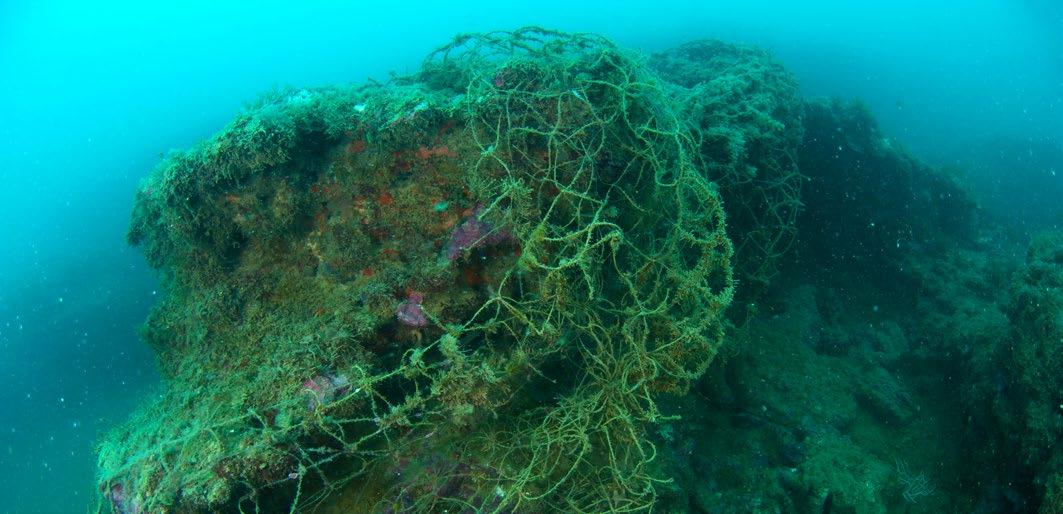
Official figures for the EU ( Table 6 ) are provided by the Greenhouse Gas Inventory of the United Nations Framework Convention on Climate Change. 92,93
The official figures for the EU show that the CO 2 emissions from the EU fishing sector have decreased by 49% between 1990 and 2020 and by 21% between 2005 and 2020 (calculated from Table 6 ). It is uncertain whether this drop in emission was due to better energy efficiency, more sustainable fishing with easier-to-catch quotas per unit of fuel burnt, or, more likely, due to a reduction in the number of active fishing vessels during this period.
30 by 2050 A pathway to decarbonise the EU fisheries sector
© OCEANA / Carlos Suárez
Historically, in the EU's 2008 climate and energy package, reducing non-quota-covered sectors (called non-ETS), which are the domestic greenhouse gas emissions from sectors – fisheries, construction, agriculture, and transport - that are not covered by the European Union Emission Trading System (EU ETS) is a national matter for individual EU Member States. The agreement on how reductions are distributed between the Member States (the burden-sharing agreement) sets out the framework for the national effort. Nevertheless, the agreement otherwise leaves it up to the MS to decide how the goal is to be achieved.
Reduction targets for the non-quota sectors were a percentage reduction compared to 2005. The target for 2020 compared to the 2005 level varied among Member States and was based on a distribution based on, among other things, the countries' Gross domestic product (GDP).
Current EU 2030 targets say that by 2030, the EU's total emissions must be reduced by 55% from 1990 levels;95 this entails the overall EU goal of a 30% reduction in 2030. However, for non-ETS, including the EU fisheries, the EU has set a sectoral baseline that uses the 2005 as the reference year, for which consumption should be reduced by 30% by 2030. There is debate around the validity of the 2005 level as a baseline estimate of fisheries' carbon footprint The fishing industry is challenging the choice of 2005 as the baseline year given the existing reductions already made compared to 1990 (see Table 6) and suggests that the EU should apply 1990 as a baseline year for the fishing sector. This dispute on the baseline year is even more notable given that the EU has recently called for a strengthening of emissions reduction targets for Member States.96 Pending formal adoption, the provisional deal endorses an EU-level greenhouse gas emissions reduction 2030 target of 40%, compared to 2005 for non-ETS sectors, therefore, including fisheries.
3.2. Forecast scenarios for 2030 and 2050
Based on historical fuel consumption per EU country (2008-2018) and from the findings on the potential savings the EU fleet could make by deploying the solutions identified here (see the previous sections), the present study applies a forecast up to 2030, and further to 2050 for which a carbon-neutral EU fleet is the target.
The study shows the evolution of the historical use of fuel consumed per Member State (MS) from 2008
onwards. The historical fuel consumption was relatively stable during the period 2008-2018 examined, illustrating that no apparent breakthroughs took place in the last decade that could be detected at this level of aggregation. The gap in data from the present day to 2018 led to assuming an annual average during the 2008-2022 period.
The investigation examines whether possible savings (from shifting practices or improving energy efficiency
31
Table 6. Reconstruction of energy use of the fishing sector in the European Union (KP)94. 2022 Common Reporting Format (CRF) Table (extracted from Table 1.A(a)s4, version 2 Dec 2022; Point iii of point c. Agriculture/ Forestry/ Fishing) collating GHG inventories for the European Union.
Kt Kt Kt 1990 10,524.20 0.83 0.29 2005 8,337.07 0.64 0.23 2020 5,342.04 0.41 0.15
CO2 CH4 N2O Fishing emissions
by implementing the identified technological solutions, i.e., 20% gain97,7) represent a sufficient effort to reach the 40% reduction target in 2030. The study’s 2030 forecast is also compared to the EU’s 40% reduction by 2030 target (based on 2005 levels), to evaluate whether the intermediate 2030 objective is achievable by the means identified. The study further deduces the annual emissions reduction required by each MS to reach the target by 2050.
The findings show that reaching the 40% reduction target by 2030 is feasible (Figure 12) if technological solutions are implemented (here assuming a minimal 20% gain in efficiency) together with switching practices from bottom-contacting gears towards passive gears (alongside the country-specific gain estimated, except for IRL). The pace of such forecast reduction is higher for some countries (Table 7), alongside the higher gain expected from switching practices in country-specific situations. The annual reduction pace is equivalent for the period 2030-2050 to reach carbon natural EU fleet by 2050 (Table 8).
One limitation to this forecast is the absence of an overview of the current level of implementation of the existing technical solutions that could already influence the historical time series with no further gain to expect. For this single reason, the forecast might be overly optimistic in reducing the emissions from these technical solutions. However, the industry has likely had a very low uptake so far, 98 as no breakthrough has been found in the FUE re-estimated here.
There may also be an account for national specificities in targets, given that some MS would take more stringent commitments than the ones required by the EU targets, such as the Danish national climate target of a 70% reduction in CO 2 emissions by 2030. 99 It also means that the EU's 2030 target for greenhouse gas reduction in the non-quota-covered sectors is translated into a Danish national reduction obligation concerning the emissions in the non-quota-covered sectors, including buildings, agriculture and transport, of 39% reduction compared to emissions in 2005.
32 by 2050 A pathway to decarbonise the EU fisheries sector
Table 7. The present study estimated annual, country-specific % reductions in litres of fuel used between 2022-2030 if the gain from the scenarios applies. Scenarios are: implementing the technological solutions; re-allocating the most severe impact bottomcontacting gears to less impacting gears; *Not a country-specific scenario.
Table 8. Annual country-specific % reductions between 2031-2050 that are required to reach the 0 emissions target by 2050.
Annual % if tech. solutions only* -2.8 -2.8 -2.8 -2.8 -2.8 -2.8 -2.8 -2.8 -2.8 -2.8 -2.8 Annual % if re-allocation only -11.3 -3.8 -4.3 -3.2 -4.7 0.7 -6.7 -10.1 -4.6 -3.5 -2.2 Annual % if tech. + re-allocation solutions apply -19.1 -7.6 -8.2 -6.8 -8.8 -1.9 -11.5 -16.9 -8.7 -7.2 -5.5 -3.2 -15.4 -12.8 -12.9 -7 -10.5 -12.2 -6.3 -10.4 -7.3 -5.4 DNK DNK ESP ESP FRA FRA GBR GBR GRC GRC IRL IRL ITA ITA NLD NLD OTH OTH PRT PRT SWE SWE
7 Note: Choosing a conservative value from European Commission (2022).
The forecast from 2031-2050 assumes a constant annual reduction rate to reach the 0 emissions targets ( Table 8 ). A gap in data from 2018-2022 has required assuming the consumption status quo during that period. Other national fleets are merged into an OTH category. Fuel consumption is calculated from the STECF Annual Economic Report 2020 database. These data have some gaps in fuel use declaration for some fleet segments; therefore, the curves shown for historical fuel use likely underestimate actual consumption. The UK Fleet has also been included here.
The socioeconomic consequences of such trajectories are quite unpredictable on individual actors, given that a change in vessel type and fisheries can lead to a change in fishing patterns
and profitability. Meanwhile, it seems the EU has not yet done a small- or large-scale impact assessment on the effect of decarbonising the EU fleet so far. The socioeconomic impact will likely affect performance related to achieving the objectives when actors react to those effects. However, it can be expected that sustainable fishing and a reduced carbon footprint will benefit society overall, along with ensuring viable, profitable, and resilient fisheries in the long term ( Section 4 ).
33 2008200920102011201220132014201520162017201820192020202120222023202420252026202720282029203020312032203320342035203620372038203920402041204220432044204520462047204820492050 0 1000 Year 2000 Energy consumption (million litres) 2008200920102011201220132014201520162017201820192020202120222023202420252026202720282029203020312032203320342035203620372038203920402041204220432044204520462047204820492050 0 1000 Year 2000 Energy consumption (million litres) country ESP ITA FRA GBR NLD GRC DNK PRT IRL SWE OTH country ESP ITA FRA GBR NLD GRC DNK PRT IRL SWE OTH 2008200920102011201220132014201520162017201820192020202120222023202420252026202720282029203020312032203320342035203620372038203920402041204220432044204520462047204820492050 0 1000 Year 2000 Energy consumption (million litres) 2008200920102011201220132014201520162017201820192020202120222023202420252026202720282029203020312032203320342035203620372038203920402041204220432044204520462047204820492050 0 1000 Year 2000 Energy consumption (million litres) country ESP ITA FRA GBR NLD GRC DNK PRT IRL SWE OTH country ESP ITA FRA GBR NLD GRC DNK PRT IRL SWE OTH
Figure 12. Evolution of fuel burnt during fishing operations in the EU fisheries sector over the period 2008-2018 for the top 10 fleet and forecast based on possible savings identified by the present study (i.e., assuming a 20% overall gain during 2022-2030 from technological solutions (top panel), added to country-specific percent from phasing out the most impacting bottom-contacting gears (bottom panel).
4. A roadmap to decarbonise the EU fishing sector
The fishing sector is not considered the most energy intense compared to other agricultural sectors (landbased production),100,101,102 or maritime sectors (e.g. emissions from shipping).103
However, when accounting for the most fuelintensive and least energy-efficient fishing techniques available, such as bottom trawling, and their impact on the seabed, the release of carbon from trawling in blue habitats could be of the same order of magnitude as the emissions from land-based animal protein production (chicken, lamb, or beef).
There are enablers and barriers to adopting new technological, regulatory, policy and market-based tools that would help reduce emissions of the EU fisheries sector. Although some solutions to reduce fuel use in fisheries already exist, there are many barriers to their implementation.104 Barriers include the individual attitude and mindset of fishers (e.g., possible reluctance from fishers to change business practices that might impact catch rates, to cope with the transitional costs associated with investing in new types of equipment, to be frontrunners and risk-takers testing new equipment, concern over equity issue if there is no perceived benefit to transition), and misfit fisheries management for a change (e.g., legislation possibly preventing modernization, installation and use of new technologies, limited catch quota swaps possibilities). This section identifies potential
barriers and enablers to the energy transition of the EU fisheries sector, and short- and long-term technology, regulatory, research, public and policy solutions that would help the sector reduce undesirable GHG emissions. It shows that several paths may be mobilised to meet the management target, but with likely obstacles (Table 9).
4.1. Feasibility of the energy transitions and barriers
Feasibility of retrofitting when converting to other fishing practices.
A possible technical barrier may arise when converting vessels with energy-intensive fishing gear to more energy-efficient gear (e.g., from trawlers to gillnets) as it would require large-scale decarbonisation retrofits of vessels that are likely to conflict with the existing EU fleet structure (path dependency) (e.g., need for making of conveyor table for nets, installing of fish tank). However, there are examples of successful transitions.
Cost-shifting analysis and return on investment studies are required, including assessing losses during the period the vessel is out of the water for at least a few months. The European Maritime, Fisheries and Aquaculture Fund (EMFAF) could support the transition to improve energy efficiency. Vessels using passive gears are usually polyvalent
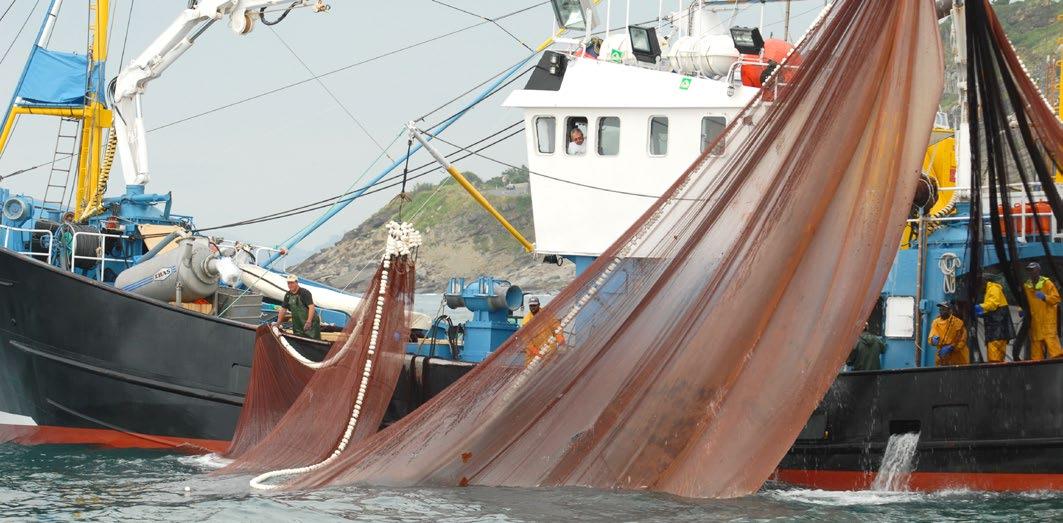
34 by 2050 A pathway to decarbonise the EU fisheries sector
01
© OCEANA / Enrique Talledo
and can, by nature, switch from longlines to pots and traps or seines, or even from trawls, which help them diversify the targeted species and insure against risks in changing targeted species productivity. Diversification has sometimes been the only way forward for certain fisheries whenever the resource becomes scarce (Example of French liners for Sole in English Channel transit toward pots fishery for molluscs). On the cost side, there is also a need for investment and recycling of old trawls with the possibility of recycling plastic fibre waste to produce fuel (e.g., Earthwake company proposing the “Chrysalis” device). Recycling depends on the material used to make the nets, and ropes (See for example the Danish company Plastixglobal retreating plastic fibre waste).
Feasibility of retrofitting when converting to alternative propulsion.
A more extensive retrofit would also include vessel electrification or alternative fuel (e.g., Liquefied Natural Gas - LNG8). However, there are possible side effects, such as increased electricity demand, and shortage in LNG and accessibility and also concerns on significant gas leaks during the extracting and transport phases alongside the supply chain9,10,11. Harbours and new port facilities and onshore power supplies will need to be modernised.108 Electric propulsion will require recharging facilities in ports and with further anticipated challenges in terms of grid infrastructure upstream109 as the result of competition with other energy-demanding sectors, switching from fossil fuels to a newer type of energy dependence on mineral elements (lithium etc.) required for producing the batteries while delivering to several industrial sectors. LNG as an alternative fuel presents several difficulties, such as the high initial conversion cost (25% more than oil-fuelled vessels), complexity, safety, and additional training required to ensure safe operation.110 Electrification and the use of alternative fuel (LNG, methanol, etc.) require much more space onboard than carrying fuel, and carry a much heavier engine. Such a limiting factor only permits relatively short trips at sea, closer to harbours, and with small boats and passive gears. Retrofitting vessels to fit such engines is also seen as a big challenge. As already seen within the shipping industry, there may be a growing interest in overcoming this by also applying wind propulsion technologies to fishing vessels.
Human behaviour, reluctance and lack of socioeconomic incentives.
A limited number of potential solutions that have arisen from research are accessible to the fishing sector,111 such as information sharing to fishers and between stakeholders (scientific, policymakers and fishers)112 on the existing available technologies, as well as a perception that not all proposed solutions are applicable due to their barriers nor suitable for all type of fisheries. All of these may generate mistrust towards innovation. There is also strong concern about safety onboard vessels that can be impaired with the new technologies. When at sea in a motor vessel, loss of power can be a threat to life, and electric motors are seen as neither reliable nor as easy to repair as the diesel engine.113
Stakeholders’ reluctance to make minor adjustments could also explain by a fear of economic loss, loss of control, mistrust, and lack of (immediate) reward. One factor limiting adoption is likely to be the availability of capital, and the subsequent payback time in reduced fuel consumption. For larger changes, the EMFAF funding is also not fit to support investment for building new vessels or conversion to alternative fuels that would require different vessels, also because ineligibility criteria disqualify any attempt to increase the fishing capacity in terms of engine power while an increase in gross tonnage is permitted.115,12 Hence, there are likely socioeconomic reasons why fishers are reluctant to change fishing practices, including financial debts, funding opportunities and market access for converting or changing vessel type, the need to train crew for a new job and equipment handling, or the need for marine engineers to install and maintain new propulsion systems. While
8 Note: see Korican et al. (2022). Alternative Power Options for Improvement of the Environmental Friendliness of Fishing Trawlers. Journal of Marine Science and Engineering. 2022; 10(12):1882.
9 Note: see Álvarez et al. (2018). Assessment of methane emissions from the U.S. oil and gas supply chain. Science 361:186-188.
10 Note: see NRDC. (2020). Sailing to nowhere: Liquefied natural gas is not an effective climate strategy. Report.
11 Note: see Transport & Environment web article investigation on "Methane escaping from ’green’ gas-powered ships fuelling climate crisis".
12 Note: EMFAF Reg Article 18c and d “other vessels up to 24 metres in overall length, the new or modernised engine does not have more power in kW than that of the current engine and emits at least 20 % less CO2 compared to the current engine.”.
35
02
03
energy efficiency can cut fuel costs and increase competitiveness, such fear could be justified when there are uncertainties on how to first fund the shift to new gear types or designs or adjust vessels. Fishers should also be offered alternative fishing techniques, such as developing traps and pots fishery (for example, see the French project “Baitfish” studying the behaviour of fish facing new traps design and choices of bait116) that catch high-quality fish because they are not as stressed as in trawl nets. Other gear types may also be likely to have impacts such as bycatch and lost nets (e.g., gillnets or trammel nets117). Passive gears are associated with the so-called “ghost fishing” issue (due to traps lost in the water after a storm118) and pollution from traps lost at sea.119,120 However, biodegradable products could also be used to make fishing pots and limit ghost fishing.
Biological barriers and increased ecological risk on certain components of marine biodiversity could be induced by shifting toward passive gears.
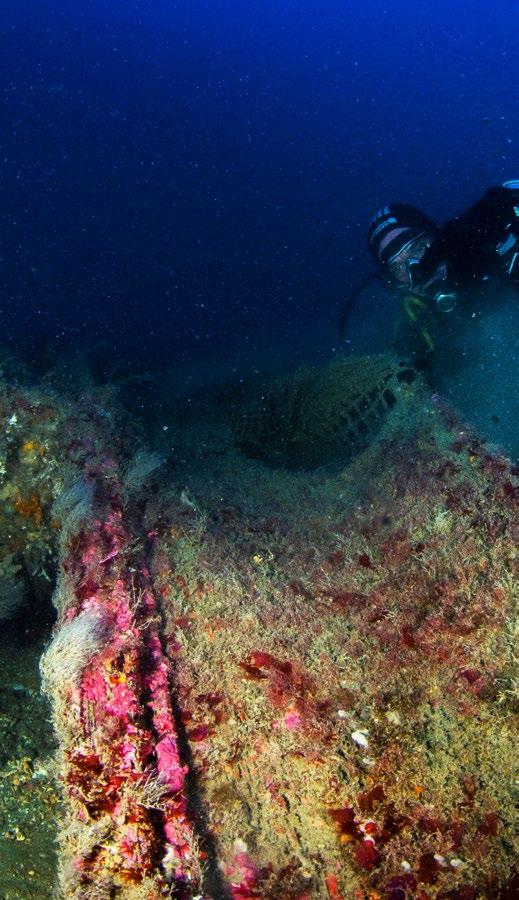
If more fisheries employ passive gear (netter, drift longliners), this could result in increased bycatch of sensitive marine species, such as cetaceans, seabirds, turtles, sharks, stakes, and rays. Besides, not all marketable species and areas are accessible to passive gears (usually a more coastal activity), and remote fishing grounds will not be accessible to all retrofitted vessels. Alternative gears have been identified in several places that could replace bottom trawling.122 Conflicts for space could also arise with the pelagic trawlers as soon as passive gears deploy in new, more offshore areas.
Seafood market disruption.
If passive gears are unable to sustain the seafood demand in the EU alone, importing fish from nonEU waters will be needed to feed the EU processing sector. The EMFAF funding could be considered to facilitate a shift to less fuel-intensive and lowimpact fishing techniques, and could go hand-inhand with incentivising the eco-certification of EU fishery products. The market could be positively affected by strong consumer demand for fish products with a small carbon footprint and could facilitate a shift to "green products".123 However, consumers are likely to focus on the price of the fish first, especially during economic crises (recession, inflation). Accordingly, reducing operating costs
would simultaneously make the fish more appealing to the consumers if the cost saving is partly used to decrease the market price of fish.
Obstacles and unintended effects in implementing Marine Protected Areas.
The current fishing effort of bottom-contacting gears should not be displaced or re-allocated elsewhere to preserve the most significant ecological and economic benefits from existing MPAs. Such displacement effect can cancel out the beneficial effect obtained inside the protected areas when re-allocating the fishing efforts to surrounding areas, with sometimes a net result worse than no area protection (this study on blue carbon habitats). It is therefore advisable in the short term to displace fishing efforts to other fisheries and reduce the fishing effort of fisheries using bottom-contacting gears to avoid such unintended effects.
36 by 2050 A pathway to decarbonise the EU
fisheries sector
04 05 06
© OCEANA / Enrique Talledo
Misfit legislation and management barriers.
Article 17 of the EU Common Fisheries Policy (CFP) needs to be better implemented to ensure that Member States endeavour to allocate fishing quotas among fleets in the EU to favour the reallocation of quotas to the least fuel-intensive and low-impact fisheries.
A decarbonisation plan should include restricting access to fishing opportunities (catch quotas or effort days) dependent on meeting environmental criteria, including carbon emission levels. EU instruments need to be better implemented and clarified to further restrict use of the most energy-intensive fishing techniques impacting the seabed (mobile bottom-contacting gears) in EU MPAs. The European Commission’s “Action Plan to conserve fisheries resources and protect marine ecosystems” is needed to clarify this by linking to the implementation of reporting under the recently adopted EU Regulation on Technical Measures124 and the CFP to propose concrete recommendations to Member States on actions they need to take, in line with how the CFP can contribute to the implementation of environmental legislation. Clarification should include restrictions to the most fuel-intensive fisheries. The Action Plan also presents an opportunity to support the delivery of the EU Biodiversity Strategy to 2030, including and more effective implementation of relevant EU environmental laws, notably the Birds, Habitats and Marine Strategy Framework Directives, as well as the opportunity to make national maritime spatial plans adapted to the EU Green Deal.
Research must document issues with evidence-based and experiential knowledge and develop innovations.
This includes attempts to change gear designs to reduce contact with the seabed and the towing speed when trawling. This also means developing pilot studies in cooperation with the industry, such as experimental fishing and demonstration programs for maritime climate solutions and trial schemes with electricity or new fuels. It is likely that if the fishing sector shifts from using diesel and oil toward using zero- and low-emission solutions, such as electric and hybrid engines, it can significantly reduce greenhouse gas emissions. Today, in most EU countries, there are only very
few green fuel fishing vessels, and there is a need to strengthen and adapt solutions for practical commercial use. The fishing sector might also borrow fuel reduction solutions from the shipping sector (slow steaming, sails, alternative fuel, etc.), and clean ship technologies, where implementing norms have recently reduced toxic air emissions of commercial ships cruising in EU waters (FuelEU initiative, Sulphur Directive, etc.).
To mitigate emissions, we identify win-wins (Table 10) within the EU CFP for the policymakers to act in the short term by enforcing the fisheries and environmental policies, and in the longer term by deploying a set of incentives toward reducing fuel use in the fishing sector, as the volunteerism from the industry will not be enough to meet the targets. However, ensuring good status for exploited stocks and preserving their habitats are prerequisites for profitable fisheries. Meanwhile, limiting fueldependency by transitioning away from dependent practices will increase resilience to possible future crises (Table 11).
Protected areas have also been shown to sometimes boost fishery yields125 to protect biodiversity and limit the emissions that would arise from the degradation of blue carbon marine habitats. Innovation in fisheries gear and fishing techniques may play a role in addressing this challenge.126 Cutting-edge technologies in fisheries should aim to achieve resource sustainability, improve animal welfare, enhance food quality and security, and optimise opportunities whilst supporting economic gains for fishers and coastal communities. This report quantifies the benefit of ending bottom trawling or displacing it from the blue carbon habitats. An overall win-win in the CFP is to improve the status of exploited stocks for sustainable exploitation, while maintaining non-target species and the marine ecosystem integrity that support and conserve fisheries. This could lower costs by saving on fuel and improving profitability and resistance to shocks, while reducing damaging GHG emissions, in absolute and per unit of edible protein obtained from the sea. A range of actions can be taken to support this goal (Table 11), some of them reachable in the short term (e.g., improvements of energy efficiency), others requiring funding for further and new research, innovation, and upscaling in the longer term (shift to alternative, low, or zero carbon fuel).
37
07
08
Barriers Description
Feasibility of retrofitting when converting to other fishing practices
Feasibility of retrofitting when converting to alternative propulsion, or greener fuels
Human behaviour, barriers, and lack of incentives
Biological barriers and increased ecological risk on specific components of the marine biodiversity induced by shifting toward passive gears
Seafood market disruption
Obstacles and unintended effects in implementing Marine Protected Areas
• New equipment required to use gillnets or other passive gears on former trawlers
• The vessel is out of the water for at least a few months with possible foregone revenue
• Electric propulsion will require recharging facilities in ports and further challenges in terms of grid infrastructure upstream and in competition with other energy-demanding sectors
• Need more space onboard to fit new, larger, heavier engines required by alternative fuels (all with less energy per volume)
• Limited knowledge transfer on the technologies
• Mistrust toward innovation
• Financial risks associated with changing catch rate, investing in new materials, or retrofitting vessels
• Not all marketable species and areas are accessible to passive gears
• Not all effort can be re-allocated to all types of species, because it depends on fishing opportunities linked to the stock biological status
• A new challenge with biodiversity (e.g. bycatch, ghost nets, etc.)
• Consumer demand for fish products with a small carbon footprint can be lacking
• The displacement effect can cancel out the beneficial effect obtained inside the protected areas when the re-allocation occurs in surrounding areas
• Need for clearer restrictions on using bottom-contacting gears in the EU-27 Waters
Misfit legislation and management barriers
• Fishing capacity limits are incompatible with the use of alternative fuels
• Some improvements are not eligible for EMFAF funding because of capacity limits. Abnormal vessel shapes induced by capacity limits
Research needs to document issues with evidence-based and experiential knowledge and develop innovations
• Require developing pilot studies and demonstration programs for maritime climate solutions and trial schemes with electricity or new fuels
• Lack of knowledge on success criteria for ensuring a followup and uptake of innovations
• Lack of knowledge on blue carbon habitats (seabed mapping, carbon sequestration, habitat restoration, carbon release rates, etc.)
38 by 2050 A pathway to decarbonise the EU fisheries sector
Table 9. Barriers to decarbonising the EU Fleet.
Win-wins Description
Fishing less saves fuel AND improves stock health (larger, more abundant, and fecund fish). Contrary to other sectors where more input leads to more output, the economic return in fisheries can improve with less input, especially along with overfished stocks recovery.
The hydrodynamic drag from the resistance of nets in the water is lower with larger meshes, requiring less fuel per unit of effort AND fuel use will decrease in the long run alongside stock recovery from more selective fisheries (even if larger gear meshes might decrease catch rate in the short time).
Fishing with existing technological solutions will save fuel and operating costs
Switching to alternative fishing techniques do not impair the seafloor integrity and its biodiversity and does not induce a release of currently sequestered carbon in the seabed
Switching to alternative low-carbon fishing techniques ensure higher resilience to future unexpected shocks
Fishing less to earn more Fishing with larger gear meshes consumes less fuel More stringent fisheries and environmental management can lead to engaging a virtuous cycle
Promoting small-scale fishing will save fuel and facilitate the feasibility of the energy transition when downsizing engines
Saving fuel contributes to reaching environmental targets (fuel reduction and seafloor integrity) AND reduces the operating costs for fishing, improving the economy of fisheries.
Switching to alternative fishing gears not touching the seabed is feasible AND suspicion that carbon released from the seabed sediments induced by fishing pressure exacerbates climate change, AND carbon-rich habitats host diverse communities of living species. A win-win-win is to urgently limit the effects of fishing on blue-carbon habitats.
Switching to lower carbon fisheries and saving fuel to reduce emissions AND decrease high dependency to fuel for fisheries at the edge of profitability to resist to unexpected crises (rise in fuel price, lower fishing opportunities, etc.).
A higher catch is obtained AND less fuel is burnt to attain the catch, AND the fisheries have a higher resistance and resilience to shock factors from climate-induced stresses.
Small-scale fishing in the EU deploys less power per unit effort AND uses low-carbon fishing techniques AND best fits alternative fuel and innovative propulsion system development (e.g., electrification) whenever fitting and retrofitting for implementing technological solutions is problematic on large fishing vessels.
39
Table 10. Win-wins for decarbonising the EU fishing sector when fishing effort is balanced with fishing opportunities, sustainable targets, and CFP minimal effects objectives.
Technology
Develop and inform a monitoring programme to collect accurate and standardised data on fuel consumption at the vessel level.
Implement and improve the uptake of existing technologies proven to lead to fuel savings and energy efficiency.
Research & Innovation Funding
Energy-efficiency: Developing and implementing innovative energy-efficient technologies (gear, vessel, operations).
Regulatory
Introduce taxes, including ending the fuel subsidies that do not incentivise reducing fuel use.
Improve the health and recovery of fish stocks.
Promote the small-scale fishing sector over the large-scale sector.
Account for regional specificities and tailor-made actions in the context of the EU CFP regionalisation and EU Cohesion policy.
Fund the energy transition and scale up.
Public
Promote a carbon footprint scoring system alongside a sustainability ecolabel.
Continue to detect negative side effects of fisheries regulations (and subsidies).
Policy
Improve the EU's political soft power and continue to push for more renewable energy.
Buyback programme and vessel scrapping to reduce fishing capacity, imbalanced segments, or energy inefficient vessels.
Shifting fuel: Develop and implement innovative, energy-efficient, propulsion technologies (alternative, low, or zero carbon fuel, electrification, wind-assisted propulsion).
Fully implement the CFP for managing EU stocks and fleets, with sustainability and precautionary objectives.
Phase out energy-inefficient fishing techniques (such as bottom trawling).
Implement MPAs based on blue carbon habitats and enforce them for protecting and restoring blue carbon habitats.
Fund the energy transition and scale up.
Promote a carbon footprint scoring system alongside a sustainability ecolabel.
Continue to detect negative side effects of fisheries regulations (and subsidies).
Improve the EU's political soft power and continue to push for more renewable energy.
Buyback programme and vessel scrapping to reduce fishing capacity, imbalanced segments, or energy inefficient vessels.
40 by 2050 A pathway to decarbonise the EU fisheries sector
Action level Short term (2023-2030) Long-term (2023-2050)
Table 11. Short- and long-term technology, regulatory, research, public and policy solutions required to reduce the fuel used in the EU fishing sector.
4.2. Short-term actions (2023-2030)
Direct action to save fuel with an environmental cobenefit consists of significantly reducing the contact of gears with the seabed, phasing out the most fuelintensive fishing techniques that have the greatest impact on the carbon storage, including bottomcontacting gears, and incentivising a switch toward other types of gears. Note that gears such as the Danish seine are shown to be more energy-efficient than trawl gear but still have a moderate impact on the seabed (See this study, or the “enersenne” project about assessing the energy efficiency of the Danish seine fishing technique). The co-benefit from this is that re-suspension of sediment (including blue carbon), which could otherwise be transported away and influence important marine biogeochemical processes, is avoided. Bottom-contacting gears impact habitat suitability for the residents' ecosystem by smoothing the seabed, reducing habitat complexity, damaging the physical structure, and changing the species composition of the seabed.129,130
To limit the consequences that phasing out mobile bottom-contacting gears would have on the shortterm economy, there are also less radical ways to save fuel use in the short term. Examples include uptake of existing fishing technologies that can reduce fuel use and incentivising the use of alternative gears to partially replace bottom trawling. For cleaner production, reducing fuel use intensity in fisheries across Europe to mitigate potential negative impacts (bycatch) brought on by alternative gears, and banning the most damaging fishing techniques in existing MPAs with high carbon storage potential may be tackled by different actions:
Develop and inform a monitoring programme collecting accurate and standardised data on fuel consumption at the vessel level for daily reporting by a significant sample of the fleet in each Member State. Direct fuel use measurements (and maybe GHG emissions) during fishing operations may be possible by installing fuel loggers onboard vessels completed via mandatory reporting in, for example, logbooks. This would be a simple but significant step forward, besides conducting regular energy audits. Some projects are currently pushing for implementing fuel meters onboard fishing vessels,131 but these projects are not covering the entire Member State fleet, nor are they geared towards data collection. Development in intelligent fuel meters may help close the data gaps by allowing fuel consumption to be reported
automatically without the need for vessel owners and skippers to transmit the data. Establishing and following standards are critical steps for robust contracts and eco-certification schemes, including shipbuilding, boat re-conversion and funding schemes, which allow parties to incorporate the relevant definition into their contracts. There is an urgent need to generalise energy audit protocols for standardised data collection and make the transmission of fuel use data mandatory, for example, via electronic logbooks that transmit data to shore in real-time. Energy audits are one of the most valid solutions to assess the energy performance of the fleets and tailor energyefficient solutions for fisheries.132,133
It is possible to install monitoring devices (fuel meters) onboard fishing vessels to collect fuel consumption data.13 The device would also inform vessel skippers about real-time consumption and suggest different scenarios for saving fuel depending on the motor charge (engine rpm), towing mode, vessel speed, and time to reach the fishing grounds. Electronic monitoring tools and technologies developed for fisheries can give rise to low-cost data collection as a critical component of effective ecosystem-based management and energy use reduction. Such tools can also be used to inform each individual skipper about how their own consumption compares to other skippers belonging to the same segment (this would refer to the “nudge” concept in behavioural economics).
13 Note: For example, 180 vessels in the AMARREE French project (2019-2021).
Implement and improve the uptake of already existing technologies proven to lead to fuel savings. This requires ensuring follow-up after the initial pilot demonstrations. Only a few solutions for reducing fuel use are transferred135 to the fishing sector from research, perhaps due to limited knowledge transfer on the technologies or because not all proposed solutions in the scientific literature are applicable due to the existence of barriers or that not all solutions are suitable for all type of fisheries, or the information among different stakeholders (scientific, policy-makers and fishers) is not fluid, generating lack of trust towards innovations. However, there are low-hanging
41
01
02
fruits, such as implementing existing strategies to reduce fuel use when operating the fishing. For example, as practised in the shipping sector, “slow steaming” is the easiest and most effective way to save fuel. Reducing speed is a simple measure that can be very effective; that is, up to 15% can be obtained by reducing the steaming speed by half a knot.136 However, savings with “slow steaming”, which is more suitable for seine and set nets, need to be balanced against a possible reduction in income in case of the effective time at fishing within daily trips is also reduced.137 It is also likely that a small engine tuning can provide a significant saving. A reduction in fuel use consumption by 15% represents millions of litres of fuel saved globally. Lower speed helps save fuel while reaching the fishing grounds but is not viable for otter trawlers during the fishing phase as minimal speed is required while towing the gear. This minimal speed is required to enable the gear mouth to stay open by spreading the trawl doors in the water,138 or catching high-speed fish like tuna (>10 knots). The trip duration is also elongated by lower speed, which may decrease the living standard of some skippers and crew. Besides, reducing speed is also unintendedly reducing the effective fishing effort, which is sometimes already constrained by the regulation as in the West MED plan.
This comprises developing ocean literacy and awareness raising with training for sustainable practices. Included in this is urgent extensive support for developing new education schemes and skills required by new challenges in naval construction, instructors for this new education, and needs for new certification. Knowledge and skills development in these areas should include current and future fishing vessel skippers learning how to save fuel, from fuel-saving technologies, gears, and fuel monitoring when at sea, to optimal speed and navigation, including trip and route planning. Fuel consumption reduction between 5-15% has been reported from making the skipper and shipowner aware of the relative fuel consumption of the vessel, e.g., showing the vessel's fuel consumption per nautical mile.139 This training also would include learning about the environmental impact of burning fuel on marine ecosystems, as well as basic facts on how fuel prices evolved, the level of dependency on fuel and the impact on the profitability of individual
vessels with the risk of being shocked facing a fuel crisis or long-term fuel price increase.140,14 In the long run, the new education curriculum should include how to safely operate with alternative fuels and new engines. For now, there is likely a shortage of qualified marine engineers or crew and naval construction facilities, which prevents the uptake and downscale appetite for new technologies.
Healthy stocks & ecosystems
Developing and implementing innovative energyefficient technologies for fishing, like innovative gears reducing/eliminating the drag on the seafloor (i.e., technologies that would decrease litres used per unit of effort) and incentivise the uptake of these technologies. The technique used to operate the fishing gear is also important.
This includes innovation for reducing contact with the seabed by lifting up the gear component touching the seabed (semi-pelagic doors, wheels etc.) and equipping the gear with sensors informing software which provides feedback to the skipper for reducing the door's friction on the seabed to prevent gear fatigue, fuel use, and sediment resuspension.15 It has been shown that very high-speed trawling cause a proportionally higher drag for similar gear frontal areas.142
42 by 2050 A pathway to decarbonise the EU fisheries sector
Fewer impacts reduced emissions, more long-term pro t Innovation for selective & fuel-savings practices Fishing precautionary or at MSY levels Less shing e ort deployed Adopting less fuel-intensive shing techniques Virtuous cycle in capture sheries
03
14 Note: Such education could build on a research project such as Catching the Potential (2023).
The drag of the trawl net itself is also the first driver in fuel consumption, meaning trawl gear with larger meshes will reduce fuel. On the cost side, using bottom trawls may also increase maintenance costs when towing a gear requires more engine power from a larger vessel. Hence, substituting conventional gears with innovative ones of reduced drag ( e.g., outrigged trawls, semi-pelagic trawls, lighter trawl doors 16 ) and optimised components may reduce fuel consumption up to 50% but comes with other considerations related to the legislation of new gears.144
This includes replacing or modernising the equipment to obtain a gain in efficiency or fishing vessels, such as substituting the old engine with a more energyefficient engine. More extensive adaptation would include retrofitting, for example, improving energy efficiency by reducing the hydrodynamic drag of the vessel hull. Retrofitting a fishing vessel to operate another fishing technique is potentially extensive because it requires adaptation of the working and living space onboard and new equipment for operating the fishing. Such transition usually requires expert studies of naval builders to evaluate the feasibility and costs of transition:
• from mid-water trawls to purse seines
• from trawl to gillnet, longline
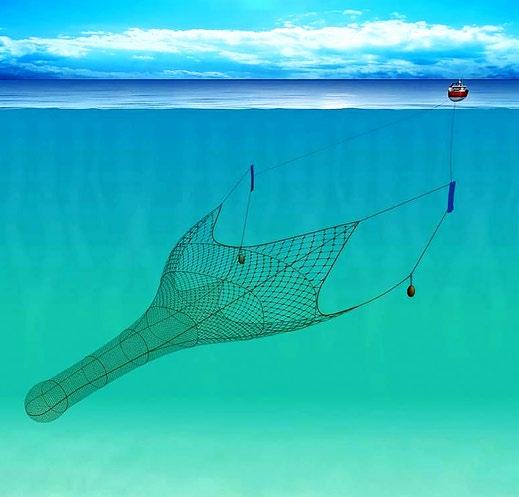
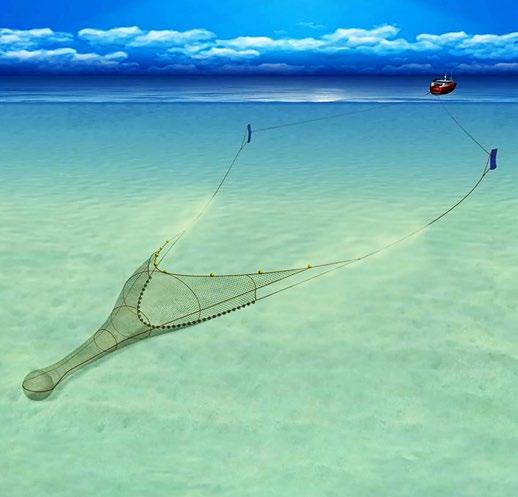
• for changing the number of rigs
• from single trawling
• for implementing an “assisted fishing” (i.e., a set of sensors on the vessel and gears, for "precision" fishing, aka “precision agriculture”).
The goal is to organise the switching to gears demonstrated as the "Best Available Technique" to catch specific assemblages of species (i.e., the least litre fuel use per kilo landed145). This would include the consumers with a dietary shift for low-carbon footprint fish and shellfish and possibly develop further the seafood market for such marine species.
15 Note: For example, the French project “Connect”, or “Game of Trawl” (Ifremer Lorient).
16 Note: For example, the otter doors with a metal frame and wood panels. The lighter equipment reduces seabed friction and fuel consumption.
Introduce taxes, including ending the fuel subsidies that do not incentivise reducing fuel. Subsidies on fuel are not refraining fishing fleets from travelling long distances and consuming large amounts of fossil fuel to reach remote fishing grounds in the high and deep seas.146,147 Subsidies artificially lower fishers’ operating costs. Countries should prevent fisheries subsidies which contribute to overcapacity and overfishing, in line with the United Nations Sustainable Development Goal (SDG) target
43
Figure 13. Semi-pelagic otter trawl, where the doors are lifted off the seabed while the ground gear remains in contact with the seafloor (top). Midwater or pelagic trawl where none of the gear is touching the seabed. The doors in both types of trawls have a higher height aspect ratio when compared to bottom otter trawls to generate the necessary lift (bottom). Image obtained from www.seafish.org on 24/11/21.
04
14.6.148 Instead, money for subsidies could be redirected towards supporting responsible practices. Compensation for taxes could be introduced to reward best practices and investment efforts, for example, exonerating green equipment intended to save energy.149 Such compensation for the fuel tax would not be accessible for those fishing in remote areas outside of EU waters or when circumventing the tax by refuelling abroad in a place where fuel price is lower.150 The more fuel intense segments in the EU fishing sector fear bankruptcy if tax exoneration ends. Hence the fishing industry usually wants to be offered green alternatives before the fuel tax exoneration ends.151 This “chicken and egg” situation will likely maintain a wicked status quo on the tax issue, even if there is a legislative will at the EU level to strengthen environmentally positive incentives and phase out environmentally harmful subsidies.152 In this bargaining, the fishing sector should not forget that improving stock health is the first way to improve profitability (see point 5 below), so transitioning fishing fleets to paying the real price for fuel will be less harmful if the sector can compensate with a better catch.
The efficacy of reducing fuel use should be closely monitored as saving energy could result in a “rebound” effect that could maintain and increase total energy consumption. The rebound effect results from savings on fuel costs to be redirected toward fishing more and toward new investment, eventually increasing the fishing power and capacity. Ecological economists argue that the efficiency approach is thus unlikely to halt environmental degradation. Any savings should be associated with a reduction in fishing effort to avoid the “rebound” effect.153 What is needed instead is to invest savings from fuel use into further decarbonisation, as well as complement efficiency measures with a so-called sufficiency approach.154,155
Improving the health and recovery of fish stocks to save fuel. This is particularly important as there is evidence that lower fish biomass requires more extensive fuel use for fishing. Stocks in better shape increase the catch rate; therefore, the volume and the value landed per unit of fuel used. Further analyses of the International Council for the Exploration of the Sea (ICES) on annual stock status would be necessary to demonstrate that healthier, abundant stocks are expected to lower the fuel use required to catch
them and to lower the fuel use intensity with bigger fish catch.
Improving the health and recovery of fish stocks requires further effort by reducing the fishing effort and eliminating excess fishing capacity.156 This implies management plans to continue reducing the fishing effort in areas where fishing quotas are challenging to implement (e.g., the Med) and keep monitoring the health status of stocks. This also includes increasing fishing gear selectivity for cleaner, “precision” fisheries by developing onboard devices and underwater devices and providing real-time data analyses with new machine learning algorithms. Improved gear selectivity is a win-win for i) selecting older, more valued fish and ii) reducing the resistance of gears to water displacement. Point (i) would avoid growth overfishing, a symptom of a pronounced depletion of juvenile fish in an exploited fish population. Point (ii) would limit the water resistance effect, which is proportional to the mesh sizes, characteristics, and overall gear orientation. Remote Electronic Monitoring already exists in some instances to monitor compliance with the Landing Obligation in the EU157 and could be complemented with underwater CCTV to help the skipper to deploy the gear optimally (see the “precision” fishing).158,159 The winches sensor system (WSS) may also be installed on board trawlers (e.g., see GFCM pilot projects for WSS in the Adriatic) and record and report in real-time the shooting and hauling of deployed demersal towed gear. Electronic monitoring improves traceability, sustainability claims and market access in the seafood supply chains, and its broad development could therefore be a win-win for the fishing sector.
Funding the energy transition and the scaling up of innovation. A prominent factor limiting the adoption of new technologies and switching to new practices is the availability of capital and the subsequent payback time in reduced fuel consumption. The European Maritime, Fisheries and Aquaculture Fund (EMFAF) (Table 12) and other funding sources can support this transition, including deploying fiscal incentives (green and innovation funds, etc.). However, the cost associated with the transition likely exceeds the funds available from EMFAF, given that the scope is also to ensure food security, sustainable fishing, and the growth of a sustainable blue economy. Concerning supporting the search for more energy-efficient solutions, the EMFAF
44 by 2050 A pathway to decarbonise the EU fisheries sector
05 06
is restricted to “increasing energy efficiency and reducing CO2 emissions through the replacement or modernisation of engines of fishing vessels.”161 As such, there is a need for the EU to secure greater funds to support the energy transition of the EU fleet.162


Along with proposing existing and new funding, there is a need to clarify and support the accession of potential beneficiaries to the funds. There are likely conditions to access these funds that intend to avoid any side effects, such as increasing vessel fishing power and the sector fishing capacity. Funding should not be allowed where it will contribute to increasing the fishing capacity for proven imbalanced fleets with the fishing opportunities, as is still the case for many fisheries in Europe.163
Special care should be brought to the small-scale fishing sector (SSF comprise 63% of EU fishing vessels17) as small operators have been shown to face various obstacles in accessing funding in the past.165 These obstacles range from a lack of communication with the local administration and awareness of EU funding opportunities, to structural problems (such as reduced capability for effective handling of new technological equipment, to adopting innovations, and lack of representation in decision-making processes). Given the difficulties for small-scale fishers in managing the administrative procedures to access EU funding, between March and May 2021, WWF and Blue Seeds launched a pre-financing scheme as a call for grants for smallscale fishers in the Mediterranean.166
AUS €6.7 million
BEL €40.3 million
BGR €85 million
CYP €38 million
DEU €212 million


DNK €201 million
CZE €42.8 million


ESP €1.12 billion


EST €97 million
FIN €71 million
FRA €567.1 million
GRC €364 million
HRV €243.6 million
IRL €142 million
ITA €518 million

LTU €61.2 million
LVA €135 million
MLT 21.8 million
NLD €98 million


POL €512 million
PRT €392.6 million
ROU €232 million

SVN €24 million

SWE €115 million


TOTAL 4.332 billion


45
Table 12. Negotiated country-specific 2021-2027 EMFAF funding (version Dec 2022).
A prominent factor limiting the adoption of new technologies and switching to new practices is the availability of capital and the subsequent payback time in reduced fuel consumption. The European Maritime, Fisheries and Aquaculture Fund (EMFAF) 134 and other funding sources can support this transition, including deploying fiscal incentives (green and innovation funds, etc.).
MS 2021-2027 EMFAF
17 Note: Source: 2020 FDI data.
In response to the hardships and global energy market disruption caused by Russia's invasion of Ukraine, the European Commission presented the REPowerEU Plan.167 RePowerEU Strategy should achieve targets of reducing fossil fuel dependence by 2027 by savings and accelerating the development of clean energy (solar, wind, renewable hydrogen, biomethane), which comes with boosting industrial decarbonisation with €3 billion of frontloaded projects under the Innovation Fund. The Commission should ensure that the fishing sector's decarbonisation is also covered by it.
For more fundamental research work, Horizon Europe is the EU’s research and innovation programme for 2021-2027, with a budget of €95.5 billion. The new programme tackles the climate change issue, helps achieve the UN’s Sustainable Development Goals and boosts the EU’s competitiveness and growth. The European Commission should use the outcomes of the Horizon Europe projects with high Technology Readiness Level, TRL (e.g., TRL 7 is “System prototype demonstration in an operational environment”)18 to help the sector decarbonise by implementing research and innovation outcomes. There is also room for funding research projects that would close the bridge between the search for decarbonisation and the need to comply with the EU biodiversity strategy for 2030 in the Farm-toFork Strategy context.169
For scaling up innovation, there is a significant need for public and private money and partnerships across sectors to invest in infrastructure (e.g., renewable electricity grid in ports, alternative fuels tanks etc.), and fund research and development. This spans from supporting the search for disruptive technological developments to more research on understanding the challenges and monitoring the efficacy of implemented solutions. For a large part, these solutions should also plug into - and be compatible with - existing equipment, which requires funding research to ensure this. Because of the so-called “path dependency”, the transition towards low-fuel fisheries will be costly. All the technological solutions listed earlier (optimising fuel use, installing new engines, improving the engine technology, etc.), and the foregone revenue from re-allocating or displacing the fisheries will directly affect the cost of any existing fishing activity, which would require developing compensation schemes.
On the infrastructure side, EU law makes ports eligible to receive aid when it comes to developing alternative fuel infrastructure170 but not for fishing activities, except for training aid, aid for SMEs’ access to finance, aid in the field of research and development, innovation aid for SMEs, and some other exceptions.
18 Note: For example, see TOPIC ID: HORIZON-CL6-2022CIRCBIO-02-05: advancing the digital transition for fisheries inspection and control and delivering data for fisheries science, management, and monitoring in a cost-efficient way to fully achieve the objectives of the CFP; delivering innovative technological solutions such as machine learning and artificial intelligence and advanced sensing technologies to support biologically complex data analysis.
Promoting the small-scale fishing sector over the large scale. The Commission should ensure fishing rights and quotas for small-scale fishing are respected and augmented. Ensuring a small-scale fishing sector is a win-win because this sector could be more economically efficient, sustainable, and less fuel intense. For example, the performance of smaller compared to larger vessels show that the small-scale fleet was more efficient using their input factors than the large-scale fleet in two areas (NAO and MBS). On average, the small-scale fleet generates more output per unit of input than larger vessels (Table 13).
In the chase for profitable fisheries, the EU CFP should recognise that increasing revenue is not the only way to ensure profitability. Reducing costs can lead to better profitability even if the revenue decreases. In 2020, increasing profitability in EU LSF resulted from lowering the number of jobs and labour costs.172
Besides lowering costs, improving profitability alongside a lower impact on the exploited ecosystems, as small-scale fishing does,174 could also be done by implementing marketing strategies for organized producers to avoid being “pricetakers” only (i.e., with no possibility to impose a rewarding price), such as by stimulating new demand for high-quality products and asking retailers or other customers for a fair price, also to compensate for the rise of operating costs including fuel price. The EU CFP should promote such initiatives with political support, including combating unfair trading practices.175
46 by 2050 A pathway to decarbonise the EU fisheries sector
07
Phasing out the most damaging fishing techniques from blue-carbon habitats. There is an urgent need for the EU to finally phase out destructive fishing practices in carbon-rich marine habitats and areas designed to safeguard ecosystem integrity and biodiversity, starting with restricting bottom trawling in carbon-rich habitats and MPAs that are found to overlap highly with carbon storage potential. For this to happen, further investigation is necessary to estimate the carbon potential in existing MPAs. This will then need to be placed in EU regulations, beginning with the upcoming European Commission Action Plan176 announced in the EU Biodiversity Strategy for 2030, and would require including a roadmap for the enforcement of area-based management plans.

This includes promoting the full implementation of the CFP for managing marine space with conservation areas. The current legislation requires a Joint Recommendation from Member States to first be submitted to the Commission, in case a Member State wants to implement a conservation area outside their jurisdiction and where several countries are involved. Clarifying this process (CFP Art. 11) to enable action to be taken on conservation issues identified in countries' jurisdictions that do not voluntarily submit a plan.177 The Commission should take measures in case of a severe threat to marine biological resources (CFP Art. 12), which currently would not include designing long-term conservation areas.
Account for regional specificities and tailor-made actions in the context of the EU CFP regionalisation and EU Cohesion policy. This includes accounting for different regional disparities as diverse as the type of fisheries and environmental conditions (such as weather, etc.). This study has shown that energy efficiency in fisheries is lower in the Mediterranean
region. One reason for this would likely be the trip pattern of fishing vessels (e.g., daily trips that require more fuel). The EU management plans in the Med178 and the GFCM multi-annual management plan of demersal fisheries in the Adriatic179 aiming to limit the effective fishing effort to reduce catches, makes the fishing less efficient with purpose, which mechanically implies more fuel burnt per catch. The CFP should consider such regional effects in comparing fuel use intensity and efficiency.
There are also regional disparities concerning opportunities for renewable energy supply, and port facilities' access and development. An operational infrastructure is a prerequisite for a fishing vessel to switch to a new alternative fuel, such as hydrogen,180 bio-methanol181 or ammonia.182 To limit the effects of such regional disparities, the EU should accompany the transition with legislation ensuring the availability and usability of a dense, widespread network of alternative fuel infrastructure throughout the EU, including mandatory facilities in ports.183
47
Table 13. Total Factor Productivity Levels in real terms for two areas (STECF 2020), i.e., North Atlantic Ocean (NAO) and Mediterranean (MBS) large-scale fishing (LSF), split for demersal target species vs pelagic, and small-scale fishing (SSCF).
08 09
Fleet categories LSF SSCF LSF SSCF Fisheries Demersal Pelagic All Demersal Pelagic All TFP 2.05 2.03 4.02 1.71 1.80 2.12 Area NAO MBS
© OCEANA / Carlos Minguell
4.3.
Fully implementing the Common Fisheries Policy (CFP) to ensure the sustainable exploitation of EU stocks. Overfishing continues to prevail despite commitments under the CFP to end overfishing and manage fisheries according to ecosystem limits. There is an urgency to eliminate overfishing to ensure healthy stocks and reduce carbon emissions. More available stocks mean less time and economic effort to reach fish stocks, which inevitably leads to higher profits and fewer emissions. Contrary to agricultural sectors, where more input leads to more output (in the short term, i.e., as long as the biodiversity erosion is limited), a fisheries sector reducing fishing effort deployed at sea goes with improving and increasing the ocean productivity.184,185
Phasing-out the most energy-inefficient fishing techniques in the long term, but with the caveat that doing this requires scaling up alternative gears and reducing fuel intensity to reduce adverse risks brought on by alternative gears. Simultaneously, the restriction or prohibition of mobile bottom-contacting gears will likely help store and retain old carbon and sequester new carbon in the seabed. Decreasing the fishing power of trawling could be counterproductive (in the short term) due to the likely increased cost for the skipper to operate the fishing when it is necessary to spend more time seeking fish aggregation. Closed areas often induce displacing the fishing effort to the other surrounding areas. Provided that the short-term recommendations have been put in place, particularly scaling up alternative gears for bottom trawlers and reducing the overall
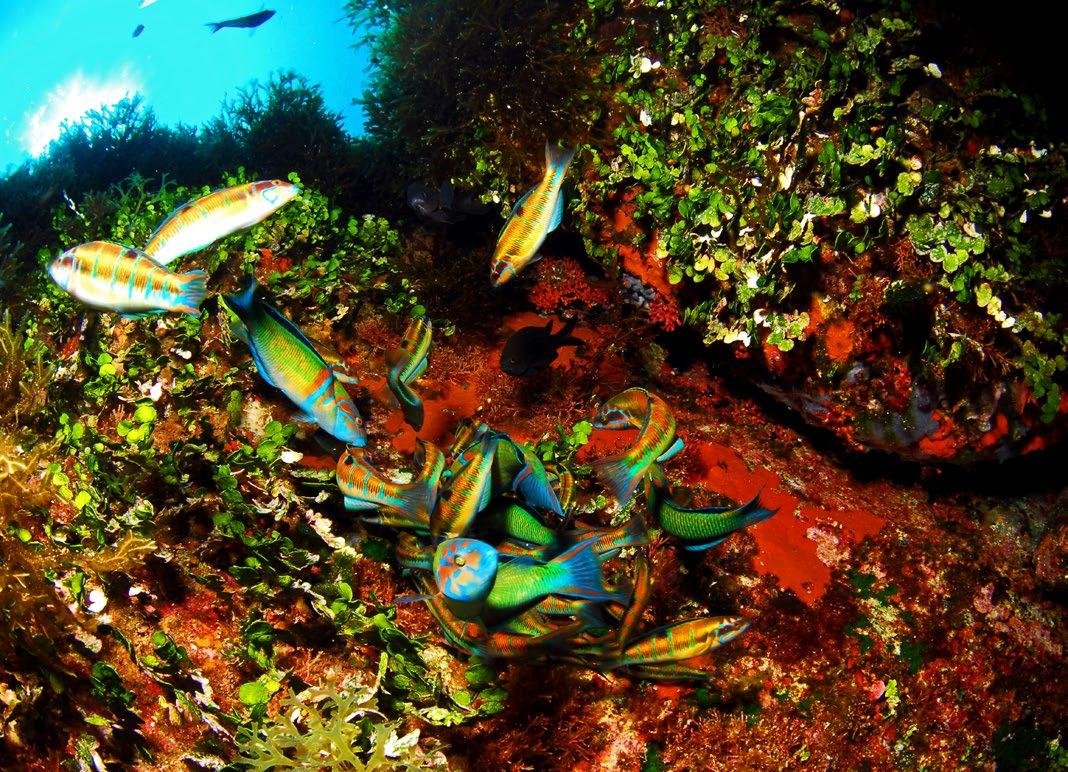
48 by 2050 A pathway to decarbonise the EU fisheries sector
01 02
The long-term strategic decarbonisation of the EU fishing and transition to zero carbon fisheries sector by 2050 will include:
Long-term actions (2023-2050)
© OCEANA / Juan Cuetos
fishing effort to reduce the most adverse risks from alternative gears (bycatch), in the long term, phasing out bottom trawling will benefit. Such protection is assumed to benefit the marine ecosystem and, therefore, the ocean productivity with a higher yield for fisheries. The return on investment of protecting such areas should be redistributed with care.
Implementing MPAs based on blue carbon habitats and enforcing them to protect and restore blue carbon habitats 186 . MPAs have an essential role in enhancing carbon sinks. Imposing stringent restrictions in already designated MPAs is necessary if they are proven to host carbon-rich habitats, to further limit disturbance from bottom-trawlers in the short-term and, in the long-term, create new MPAs based on protecting and restoring blue carbon habitats, accompanied with cost-efficient tools to enforce them. These habitats are a hotspot of carbon sequestration, whereas restoring such habitats takes a very long time ( Posidonia oceanica in the MED distributed between 0-40m deep, has a very slow recovery 187 ca. 3cm per year). Research efforts should be continued to document the vulnerabilities of these habitats to fisheries. 188, 19 Previous studies, including this one, showed that limiting fisheries on bluecarbon habitats, particularly in unprofitable areas, could avoid CO 2 indirect emissions and strengthen a natural carbon pump as a naturebased solution. 189 At the same time, blue carbon-rich habitats host a diverse biological community. 190 As such, fisheries management and environmental conservation must go hand to hand and close their historical divide for the long-term benefit of the fisheries, the exploited ecosystems and the reduction of collateral effects such as GHG emissions. 191 This would also require the timely reporting of data collected to monitor the protection of these carbon sinks and transparent information sharing with research institutes and the public society at large. Meeting the Convention on Biological Diversity (CBD) targets of protecting at least 30% coverage of EU Waters by 2030 192 should prioritise including blue carbon habitats in the designated areas.
Developing and implementing innovative energy-efficient propulsion technologies. Knowledge and development of alternative fuel for alternative propulsion (LNG, methanol, hydrogen obtained from water catalysis, electrification, etc.) of fishing vessels is growing. 193,194 However, such alternative fuels have lower volumetric energy density than diesel, 195 requiring a much larger space onboard vessels (not feasible with current batteries and full electrification). A more flexible regulation on the currently constraining vessel capacity limits could be a way forward.
There are many obstacles to overcome in scaling up these solutions,196,197 from prototypes to widescale use, including vessel design, port facilities and upstream sectors, as well as enormous competition with other industrial sectors for new resource requirements (e.g., rare mineral elements). Such competition might reduce if the “Sufficiency” concept198 is also implemented. The Commission should ensure that cross-sectoral policies also include the fishing sector to make the decarbonisation of the EU fleet coherent with other sectors' needs and supply.
Promoting a carbon footprint scoring system alongside a sustainability ecolabel. This carbon footprint scoring system could be similar to the scoring of "washing machine" energy efficiency 199 and could complement the Common Market Standards for fisheries products 200 to influence retailers and consumers toward buying seafood products from fisheries with a low or lower carbon footprint. This would continue the effort for eco-certification of fisheries products and extend this certification to include scoring of fuel use intensity. 201,202 Such scoring could be based on the fuel used during the fishing operations at sea. Ideally, even if operating the fishing is likely the primary source of emission, accounting for other use would complement Life Cycle Assessments 203 (LCAs) of fisheries products. This would account for upstream and downstream emissions (upstream business: raw materials, net making etc.; downstream business: processing, packaging, transport).
19 Note: See French project “Repic”.
49
03 04 05
The eco-certification incentive is to accelerate the market phase-out of fishing techniques and fish products that require too much fuel for too little edible protein (eg. shrimp fisheries). Eco-certification will also give a better price and add value to the catch, so that fishermen can fish less (if they wish) and use less fuel. However, a price premium for eco-friendly seafood products might burden consumers, which can unexpectedly result in consumers opting for cheaper, less sustainable fish products if the product price is the driver of consumers' choice. Such side effects may be mitigated by combining eco-certification with taxes on practices ranked as less responsible and sustainable, so that the price increases for GHG-intensive food.
Continual detecting of undesirable side effects of fisheries regulations (and subsidies). For example, management per vessel size category with differential access to the resource can incentivise misfit equipment and abnormally shaped vessels that could have poor fuel use performance (e.g., rearranging a vessel to have a wider deck while staying smaller than the 12m length overall limit (LOA), in EU or worldwide 204 ). This is because the cost of a fishing license depends on the LOA of a vessel, and hence hull forms have changed over time to give less priority to hydrodynamic efficiency and more to maximising the deck area available within a given length. The speed lost by having a shorter boat has been partially regained by using more powerful engines, which burn more fuel. 206
Decarbonisation measures taken in Europe should also avoid exporting negative environmental externalities to countries outside the EU. This includes ceasing to support fisheries with tax exoneration (Exemption introduced in EU Directive 2003/96/EC Art 14). 207 Because of the invasion of Ukraine and the rising marine gasoil price above €1/litre, governments helped the fishing sector with further tax exoneration to decrease the marine gasoil price during the summer of 2022 (for example, up to €0.35/litre in France 208 ). However, if punctual help may be required to avoid individual bankruptcy,
repeated and generalised short-sighted financial help is counterproductive as subsidies are a symptom of unviable fisheries, do not encourage changing practices, and are prone to induce misfit behaviour and long-term overfishing. 209 Fishermen can also complain about their situation while conducting very profitable fisheries (e.g., trawlers for highly priced catch). In chasing funds, some fishermen might also declare past trawl activities to access and get subsidies. Such subsidies on fuel naturally benefit the largest fuel consumers, which poses an obvious equity problem; low-impact fisheries, not benefiting from the subsidy, will also be the ones paying the price for declining fish stocks and degraded habitats.
Taxes are also a source of revenue for the regulators to invest in monitoring and surveillance, research, and innovation, helping from prototype to full-scale deployment of energy transition solutions. The currently foregone revenue from taxes by the EU governments also misses an obvious opportunity to help best practices and low-impact, fuel-efficient fishing techniques with beneficial subsidies and the transition towards these solutions.
50 by 2050 A pathway to decarbonise the EU fisheries sector
06
© OCEANA / Carlos Minguell
Improve the EU's political soft power. For example, with Member States by speaking with one voice with the external energy supplier and coastal countries to reinforce the EU as a front-runner in world ocean governance 210 and in the international forums 211 (e.g., Conference Of Parties). The EU is the world’s biggest exporter and thirdlargest importer of agri-food products and seafood. 212 With this bargaining power, the EU should encourage other international leaders to decarbonise their fishing fleet and work in synergy with decarbonising the EU's aquaculture industry and other relevant sectors. This includes continuing the push for more renewable energy in the energy production mix at national level, to incentivise energy price reduction and improve the resilience of fisheries to economic shocks. Considerations should also be given to reducing possible conflicts at sea brought on by competing for shared marine space with other offshore development such as wind farm development. 213 Efforts to implement mitigation measures for lowering the existing amount of CO 2 in the atmosphere should be explored, such as the potential solution of re-injecting CO 2 into the ocean and storage beneath the seabed. 214, 20
Buyback programmes and scrapping of energy-inefficient vessels to reduce fishing capacity or imbalanced segments. The EMFAF in the EU can grant financial compensation to fishers under specific conditions if they permanently cease their fishing activities. Buyback programmes, also called de-commissioning schemes, of fishing vessels, have been widely used to reduce overcapacity in fisheries. Their effectiveness in achieving their intended objectives has been disputed, but equally, through effective design, successful programmes have been documented. 215 A buyback programme is also one of the actions that the Commission can approve when embedded in national plans deployed to fix imbalances reported by EU Member States. 216
51
07 08
Phasing-out the most energyinefficient fishing techniques in the long term, but with the caveat that doing this requires scaling up alternative gears and reducing fuel intensity to reduce adverse risks brought on by alternative gears.
20 Note: For example, see the Danish-led project “Greensand” targeting storing 1.5 million of tonnes of CO2 per year in 2025 and 8 million by 2030, 13% of the current Denmark annual emission.
© OCEANA
Concluding Remarks
Reducing the GHG emissions of fisheries to reach a 30% reduction of direct emissions by 2030 and be carbon-neutral by 2050 is achievable. Fishers in Europe now acknowledge their energy dependence on unreliable external sources. 217 Energy independence has recently emerged as an absolute priority in the EU. At a time of rising fuel costs in a returned fuel and energy crisis, it is even more crucial to ensure a viable fishing sector and sustainable exploitation of the seas. This includes paying a fair price to fishers for their catch, deterring unfair trade practices/pressures from big retailers and also promoting fish of better quality and nutritional content, 219 resources that are usually more valued on the seafood market. 220,21 Managers can mitigate overfishing and barriers to fuel reduction as soon as win-win situations are identified, such as reducing the activity of the most harmful fishing practices degrading the marine ecosystems that also demonstrate inefficient use of energy while releasing carbon stored in the seabed.
Nowadays, governments are taking emergency actions by cutting the fuel tax across the EU, even if the sector is already protected by public subsidies. 221 Such help to support the fishing sector might be needed for social reasons in the short term and to maintain a standard of living for the fishing sector producers. However, such a tax cut has the enormous consequence of artificially prolonging the life of non-viable fisheries, which overly depend on considerable energy input without bearing the actual economic and environmental cost to society. The EU needs to re-think risk and crisis management approaches to avoid delaying action or muchneeded investments . Instead of de-prioritising sustainability and greener energy objectives in an emergency, the best available low-carbon techniques with minimal impact on marine ecosystems should always be greatly encouraged. The most unfit, energy inefficient and detrimental fishing techniques should be phased out, while limiting the impact on blue-carbon habitats and other types of marine environments, delivering supportive and provisioning ecosystem services that benefit societies. As a cobenefit, the energy transition will also help improve the fishing sector’s economic resilience.
52 by 2050 A pathway to decarbonise the EU fisheries sector
© OCEANA / Enrique Talledo
The three main pathways investigated in the report (implementing the existing technical solutions proven to reduce fuel use, phasing out the bottom-contacting gears and removing the bottom-contacting gears from the "blue carbon" habitats) will prove to be more viable and safe socio-ecological paths in the long run compared to managers responding inconsistently to repeated and more and more intense crises as experienced in recent years (COVID-19, climate, energy, pollution and biodiversity crises).
21 Note: Albeit such a price premium would vanish if 100% fish were caught with passive gears.
European Commission. (2019). COMMUNICATION FROM THE COMMISSION TO THE EUROPEAN PARLIAMENT, THE EUROPEAN COUNCIL, THE COUNCIL, THE EUROPEAN ECONOMIC AND SOCIAL COMMITTEE AND THE COMMITTEE OF THE REGIONS The European Green Deal. COM/2019/640 Final. European Union. Retrieved at: https://Eur-Lex.Europa.Eu/ Legal-Content/EN/TXT/?Uri=COM%3A2019%3A640%3AFIN
Council of the European Union. (2022, November 8). ‘Fit for 55’: EU strengthens emission reduction targets for member states [Press release]. European Union. Retrieved at: https://www.consilium. europa.eu/en/press/press-releases/2022/11/08/fit-for-55-eustrengthens-emission-reduction-targets-for-member-states/
European Union. (2013). Regulation (EU) No 1380/2013 of the European Parliament and of the Council of 11 December 2013 on the Common Fisheries Policy, amending Council Regulations (EC) No 1954/2003 and (EC) No 1224/2009 and repealing Council Regulations (EC) No 2371/2002 and (EC) No 639/2004 and Council Decision 2004/585/EC. European Union. Retrieved at: http://data.europa.eu/eli/reg/2013/1380/oj
European Union. (2014). Regulation (EU) No 508/2014 of the European Parliament and of the Council of 15 May 2014 on the European Maritime and Fisheries Fund and repealing Council Regulations (EC) No 2328/2003, (EC) No 861/2006, (EC) No 1198/2006 and (EC) No 791/2007 and Regulation (EU) No 1255/2011 of the European Parliament and of the Council. European Union. Retrieved at: http://data.europa.eu/eli/reg/2014/508/oj
European Union. (2022). Scientific, Technical and Economic Committee for Fisheries (STECF) – Assessment of balance indicators for key fleet segments and review of national reports on Member States efforts to achieve balance between fleet capacity and fishing opportunities (STECF-21-16). EUR 28359 EN, Publications Office of the European Union, Luxembourg, 2022, ISBN 978-92-76-46337-5, doi:10.2760/565659, JRC128038.
European Market Observatory for Fisheries and Aquaculture Products. (2022). First Sales in Europe. Monthly highlights, No. 7 /2022. Retrieved at: https://www.eumofa.eu/ documents/20178/509903/MH+7+2022+EN_Final.pdf
Bastardie, F., Feary, D.A., Kell, L., Brunel, T., Metz, S., Döring, R., Eigaard, O.R., Basurko, O.C. (2022). European Union. (2022). Climate change and the Common Fisheries Policy: adaptation \ and building resilience to the effects of climate change on fisheries and reducing emissions of greenhouse gases from fishing EASME/ EMFF/2020/3.2.6 - Lot1/SC07 EASME/EMFF/2020/3.2.6 - Lot2/ SC08 Final Report. Retrieved at: https://cinea.ec.europa.eu/system/ files/2022-12/climate%20change%20and%20the%20common%20 fisheries%20policy-HZ0422057ENN.pdf
Gruber, N., Clement, D., Carter, B.R., Feely, R.A., van Heuven, S., Hoppema, M., Ishii, M., Key, R. M., Kozyr, A., Lauvset, S. K., Lo Monaco, C., Mathis, J. T., Murata, A., Olsen, A., Perez, F. F., Sabine, C. L., Tanhua, T., & Wanninkhof, R. (2019). The oceanic sink for anthropogenic CO2 from 1994 to 2007. Science, 363(6432) 1193–1199. https://doi.org/10.1126/science.aau5153
Duarte, C., Losada, I., Hendriks, I., Mazarrasa, I., & Marbà, N. (2013). The Role of Coastal Plant Communities for Climate Change Mitigation and Adaptation. Nature Climate Change, 3(11), 961–968. https://doi.org/10.1038/nclimate1970
Kennedy, H., Pagès, J.F., Lagpean parliament.masino, D., Arias-Ortiz, A., Colarusso, P., Fourqurean, J. W., Githaiga, M.N., Howard, J.L., Krause-Jensen, D., Kuwae, T., Lavery, P.S., Macreadie, P.I., Marbà, N., Masqué, P., Mazarrasa, I., Miyajima, T., Serrano, O., & Duarte, C.M. (2022). Species traits and geomorphic setting as drivers of global soil carbon stocks in seagrass meadows. Global Biogeochemical Cycles, 36(10). https://doi.org/10.1029/2022GB007481
Epstein, G., Middelburg, J.J., Hawkins, J.P., Norris, C.R., & Roberts, C.M. (2022). The impact of mobile demersal fishing on carbon storage in seabed sediments. Global Change Biology, 28, 2875– 2894. https://doi.org/10.1111/gcb.16105
Sala, A., De Carlo, F., Buglioni, G. & Lucchetti, A. (2011). Energy performance evaluation of fishing vessels by fuel mass flow measuring system. Ocean Engineering, 38(5-6), 804–809. https://doi.org/10.1016/j.oceaneng.2011.02.004
Haber, H., Wiedenhofer, D., Virág, D., Kalt, G., Plank, B., Brockway, P., Fishman, T., Hausknost, D., Krausmann, F., Leon-Gruchalski, B., Mayer, A., Pichler, M., Schaffartzik, A., Sousa, T., Streeck, J., Creutzig, F. (2020). A Systematic Review of the Evidence on Decoupling of GDP, Resource Use and GHG Emissions, Part II: Synthesizing the Insights. Environmental Research Letters, 15(6), [065003]. https://doi.org/10.1088/1748-9326/ab842a
Perry, A.L., Blanco, J., García, S., & Fournier, N. (2022).Extensive Use of Habitat-Damaging Fishing Gears Inside Habitat-Protecting Marine Protected Areas. Frontiers in Marine Science, 9 https://doi.org/10.3389/fmars.2022.811926
Black, K. E., Smeaton, C., Turrell, W. R., & Austin, W. E. (2022). Assessing the potential vulnerability of sedimentary carbon stores to bottom trawling disturbance within the UK EEZ. Frontiers in Marine Science, 9 https://doi.org/10.3389/fmars.2022.892892
European Union. (2022). Climate change and the Common Fisheries Policy: adaptation and building resilience to the effects of climate change on fisheries and reducing emissions of greenhouse gases from fishing EASME/EMFF/2020/3.2.6 - Lot1/SC07 EASME/ EMFF/2020/3.2.6 - Lot2/SC08 Final Report. Retrieved at: https://cinea. ec.europa.eu/system/files/2022-12/climate%20change%20and%20 the%20common%20fisheries%20policy-HZ0422057ENN.pdf
MEPC. (2020). Marine Environment Protection Committee, International Maritime Organisation. Reduction of GHG Study 2020 – Final report. MEPC 75/7/15. https://www.imo.org/en/OurWork/ Environment/Pages/Fourth-IMO-Greenhouse-Gas-Study-2020.aspx
Food and Agriculture Organization of the United Nations, (2012). Fuel savings for small fishing vessels – a manual. United Nations FAO. https://www.fao.org/3/i2461e/i2461e.pdf
European Union. (2022). Climate change and the Common Fisheries Policy: adaptation \and building resilience to the effects of climate change on fisheries and reducing emissions of greenhouse gases from fishing EASME/EMFF/2020/3.2.6 - Lot1/SC07 EASME/ EMFF/2020/3.2.6 - Lot2/SC08 Final Report. Retrieved at: https://cinea. ec.europa.eu/system/files/2022-12/climate%20change%20and%20 the%20common%20fisheries%20policy-HZ0422057ENN.pdf
Scientific, Technical and Economic Committee for Fisheries (STECF). (2020). Annual Economic Report (AER) Database: Scientific, Technical, and Economic Committee for Fisheries. (STECF): The 2020 Annual Economic Report on the EU Fishing Fleet (STECF 20-06), Prellezo, R., Dentes De Carvalho Gaspar, N. and Guillen Garcia, J. editor(s), EUR 28359 EN, Publications Office of the European Union, Luxembourg, 2020, ISBN 978-92-76-27164-2 (main), doi:10.2760/500525 (main), JRC123089
Scientific, Technical, and Economic Committee for Fisheries (STECF). (2022). The 2020 Annual Economic Report on the EU Fishing Fleet (STECF 20-06), Prellezo, R., Dentes De Carvalho Gaspar, N. and Guillen Garcia, J. editor(s), EUR 28359 EN, Publications Office of the European Union, Luxembourg, 2020, ISBN 978-92-76-27164-2 (main), doi:10.2760/500525 (main), JRC123089.
Parker, R.W., Blanchard, J.L., Gardner, C., Green, B.S., Hartmann, K., Tyedmers, P.H., & Watson, R.A. (2018). Fuel use and greenhouse gas emissions of world fisheries. Nature Climate Change, 8(4), 333–337. https://doi.org/10.1038/s41558-018-0117-x
Sala, A., Damalas, D., Labanchi, L., Martinsohn, J., Moro, F., Sabatella, R., & Notti, E. (2022). Energy audit and carbon footprint in trawl fisheries. Scientific Data, 9(1). https://doi.org/10.1038/s41597-022-01478-0
53
1 13 14 15 16 21 22 24 25 26 27 23 18 2 3 4 6 7 8 9 10 11 12
References
A pathway to decarbonise the EU fisheries sector
Scientific, Technical and Economic Committee for Fisheries (STECF). (2022). Scientific, Technical and Economic Committee for Fisheries (STECF) – Monitoring of the performance of the Common Fisheries Policy (STECF-Adhoc-22-01). EUR 28359 EN, Publications Office of the European Union, Luxembourg, 2022, ISBN 978-92-76-51702-3, doi:10.2760/566544, JRC129080.
Guillen, J., Cheilari, A., Damalas, D., Barbas, T. (2015). Oil for Fish: An Energy Return on Investment Analysis of Selected European Union Fishing Fleets: EROI of the EU Fishing Fleet. Journal of Industrial Ecology, 20 (1).
National Federation of Fishermen’s Organisations, NFFO. (2022). “Electrifying The Fleet” More sustainable propulsion options for the small-scale fishing fleet. Report prepared for National Federation of Fisherman’s Organisations (NFFO), Future Fisheries Alliance (RSPB, MCS, WWF), North Sea Wildlife Trusts. DOI: 10.5281/zenodo.6547083
Douvere, F. (2021). Blue carbon can't wait. Science. 373(6555), 601601. https://doi.org/10.1126/science.abl7128
Duffy, J.E., Benedetti-Cecchi, L., Trinanes, J., Muller-Karger, F.E., Ambo-Rappe, R., Boström, C., Buschmann, A. H., Byrnes, J., Coles, R. G., Creed, J., Cullen-Unsworth, L. C., Diaz-Pulido, G., Duarte, C. M., Edgar, G. J., Fortes, M., Goni, G., Hu, C., Huang, X., Hurd, C. L., Johnson, C., Konar, B., Krause-Jensen, D., Krumhansl, K., Macreadie, P., Marsh, H., McKenszie, L.J., Mieszkowska, N., Miloslavich, P., Montes, E., Nakaoka, M., Norderhaug, K.J., Norlund, L.M., Orth, R.J., Prathep, A., Putman, N.F., Samper-Villarreal, J., Serrao, E.A., Short, F., Sousa Pinto, I., Steinberg, P., Stuart-Smith, R., Unsworth, R.K.F., van Keulen, M., van Tussenbroek, V.I., Wang, M., Waycott, M., Weatherdon, L.V., Wernberg, T, & Yaakub, S.M. (2019). Toward a coordinated global observing system for seagrasses and marine macroalgae. Frontiers in Marine Science, 6, 317. https://doi.org/10.3389/fmars.2019.00317
Amon, D. J., Gollner, S., Morato, T., Smith, C. R., Chen, C., Christiansen, S., Currie, B., Drazen, J. C., Fukushima, T., Gianni, M., Gjerde, K. M., Gooday, A. J., Grillo, G. G., Haeckel, M., Joyini, T., Ju, S.-J., Levin, L. A., Metaxas, A., Mianowicz, K., … Pickens, C. (2022). Assessment of scientific gaps related to the effective environmental management of deep-seabed mining. Marine Policy, 138, 105006. https://doi.org/10.1016/j.marpol.2022.105006
European Union. (2016). Regulation (EU) 2016/2336 of the European Parliament and of the Council of 14 December 2016 establishing specific conditions for fishing for deep-sea stocks in the north-east Atlantic and provisions for fishing in international waters of the north-east Atlantic and repealing Council.
European Union. (2006). Council Regulation (EC) No 1967/2006 of 21 December 2006 concerning management measures for the sustainable exploitation of fishery resources in the Mediterranean Sea, amending Regulation (EEC) No 2847/93 and repealing Regulation (EC) No 1626/94.
National Academies of Sciences, Engineering, and Medicine. (2022). A Research Strategy for Ocean-based Carbon Dioxide Removal and Sequestration. Washington, DC: The National Academies Press. https://doi.org/10.17226/26278
European Commission. (2021). EU biodiversity strategy for 2030: bringing nature back into our lives. Publications Office of the European Union. https://data.europa.eu/doi/10.2779/677548
European Commission (2022). Proposal for a REGULATION OF THE EUROPEAN PARLIAMENT AND OF THE COUNCIL on nature restoration COM/2022/304 final. European Union.
Scientific, Technical, and Economic Committee for Fisheries (STECF). (2022). The 2020 Annual Economic Report on the EU Fishing Fleet (STECF 20-06), Prellezo, R., Dentes De Carvalho Gaspar, N. and Guillen Garcia, J. editor(s), EUR 28359 EN, Publications Office of the European Union, Luxembourg, 2020, ISBN 978-92-76-27164-2 (main), doi:10.2760/500525 (main), JRC123089.
Montefaclone, M., Vacchi, M., Archetti, R., Ardizzone, G., Astruch, P., Bianchi, C., Calvo, S., Criscoli, A., Fernández-Torquemada, Y., Luzzu, F., Misson, G., Morri, C., Pergent, G., Tomasello, A., & Ferrari, M. (2019). Geospatial modelling and map analysis allowed measuring regression of the upper limit of Posidonia Oceanica seagrass meadows under human pressure. Estuarine, Coastal and Shelf Science, 217, 148–157. https://doi.org/10.1016/j.ecss.2018.11.006
Mariani, G., Cheung, W. W., Lyet, A., Sala, E., Mayorga, J., Velez, L., Gaines, S. D., Dejean, T., Troussellier, M., & Mouillot, D. (2020). Let more big fish sink: Fisheries prevent blue carbon sequestration—half in unprofitable areas. Science Advances, 6(44). https://doi.org/10.1126/sciadv.abb4848
European Commission. (2022). Climate change and the Common Fisheries Policy: adaptation and building resilience to the effects of climate change on fisheries and reducing emissions of greenhouse gases from fishing EASME/EMFF/2020/3.2.6 - Lot1/SC07 EASME/ EMFF/2020/3.2.6 - Lot2/SC08 Final Report. Retrieved at: https://cinea. ec.europa.eu/system/files/2022-12/climate%20change%20and%20 the%20common%20fisheries%20policy-HZ0422057ENN.pdf
Scientific, Technical, and Economic Committee for Fisheries (STECF). (2022). The 2020 Annual Economic Report on the EU Fishing Fleet (STECF 20-06), Prellezo, R., Dentes De Carvalho Gaspar, N. and Guillen Garcia, J. editor(s), EUR 28359 EN, Publications Office of the European Union, Luxembourg, 2020, ISBN 978-92-76-27164-2 (main), doi:10.2760/500525 (main), JRC123089
Eigaard, O.R., Bastardie, F., Breen, M., Dinesen, G.E., Hintzen, N.T., Laffargue, P., Mortensen, L. O., Nielsen, J.R., Nilsson, H. C., O’Neill, F.G., Polet, H., Reid, D.G., Sala, A., Sköld, M., Smith, C., Sørensen, T.K., Tully, O., Zengin, M., & Rijnsdorp, A.D. et al. (2016). Estimating seabed pressure from demersal trawls, seines, and dredges based on gear design and dimensions. ICES Journal of Marine Science, 73(Suppl. 1), 27-43. https://doi.org/10.1093/icesjms/fsv099
Deep Sea Conservation Coalition. (2022, November 3). SCIENTISTS CALL FOR URGENT PROTECTION OF DEEP SEA IN THE FACE OF THE GLOBAL CLIMATE CRISIS [Press release]. https://savethehighseas.org/2022/11/03/press-release-scientistscall-for-urgent-protection-of-deep-sea-in-the-face-of-the-globalclimate-crisis/
Bastardie, F., Feary, D.A., Kell, L., Brunel, T., Metz, S., Döring, R., Eigaard, O.R., Basurko, O.C. (2022). European Union. (2022).
Climate change and the Common Fisheries Policy: adaptation \ and building resilience to the effects of climate change on fisheries and reducing emissions of greenhouse gases from fishing EASME/ EMFF/2020/3.2.6 - Lot1/SC07 EASME/EMFF/2020/3.2.6 - Lot2/ SC08 Final Report. Retrieved at: https://cinea.ec.europa.eu/system/ files/2022-12/climate%20change%20and%20the%20common%20 fisheries%20policy-HZ0422057ENN.pdf
Watling, L., & Norse, E.A. (1998). Disturbance of the Seabed by Mobile Fishing Gear: A Comparison to Forest Clearcutting. Conservation Biology, 12(6), 1180-1197. https://doi.org/10.1046/j.1523-1739.1998.0120061180.x
Bastardie, F., Feary, D.A., Kell, L., Brunel, T., Metz, S., Döring, R., Eigaard, O.R., Basurko, O.C. (2022). European Union. (2022). Climate change and the Common Fisheries Policy: adaptation \ and building resilience to the effects of climate change on fisheries and reducing emissions of greenhouse gases from fishing EASME/ EMFF/2020/3.2.6 - Lot1/SC07 EASME/EMFF/2020/3.2.6 - Lot2/ SC08 Final Report. Retrieved at: https://cinea.ec.europa.eu/system/ files/2022-12/climate%20change%20and%20the%20common%20 fisheries%20policy-HZ0422057ENN.pdf
Sala, A., Damalas, D., Labanchi, L., Martinsohn, J., Moro, F., Sabatella, R., & Notti, E. (2022). Energy audit and carbon footprint in trawl fisheries. Scientific Data, 9(1).
https://doi.org/10.1038/s41597-022-01478-0
54 by 2050
28 40 42 45 46 47 48 49 50 51 43 29 30 31 32 33 34 35 36 37 38 39
Parker, R.W., Blanchard, J.L., Gardner, C., Green, B.S., Hartmann, K., Tyedmers, P.H., & Watson, R.A. (2018). Fuel use and greenhouse gas emissions of world fisheries. Nature Climate Change, 8(4), 333–337. https://doi.org/10.1038/s41558-018-0117-x
Parker, R.W., Blanchard, J.L., Gardner, C., Green, B.S., Hartmann, K., Tyedmers, P.H., & Watson, R.A. (2018). Fuel use and greenhouse gas emissions of world fisheries. Nature Climate Change, 8(4), 333–337. https://doi.org/10.1038/s41558-018-0117-x
European Commission. (2013). Regulation (EU) No 1380/2013 of the European Parliament and of the Council of 11 December 2013 on the Common Fisheries Policy, amending Council Regulations (EC) No 1954/2003 and (EC) No 1224/2009 and repealing Council Regulations (EC) No 2371/2002 and (EC) No 639/2004 and Council Decision 2004/585/EC. European Union. http://data.europa.eu/eli/reg/2013/1380/oj
Scientific, Technical, and Economic Committee for Fisheries (STECF). (2022). The 2020 Annual Economic Report on the EU Fishing Fleet (STECF 20-06), Prellezo, R., Dentes De Carvalho Gaspar, N. and Guillen Garcia, J. editor(s), EUR 28359 EN, Publications Office of the European Union, Luxembourg, 2020, ISBN 978-92-76-27164-2 (main), doi:10.2760/500525 (main), JRC123089
International Council for the Exploration of the Seas (2018). Technical Service - OSPAR request on the production of spatial data layers of fishing intensity/pressure. ICES Advice: Technical Services. https://doi.org/10.17895/ices.pub.4508
Deep Sea Conservation Coalition. (2022, November 3). SCIENTISTS CALL FOR URGENT PROTECTION OF DEEP SEA IN THE FACE OF THE GLOBAL CLIMATE CRISIS [Press release]. https://savethehighseas.org/2022/11/03/press-release-scientistscall-for-urgent-protection-of-deep-sea-in-the-face-of-the-globalclimate-crisis/
Russi, D., Pantzar, M., Kettunen, M., Gitti, G., Mutafoglu, K., Kotulak, M., & ten Brink P. (2016). Socio-Economic Benefits of the EU Marine Protected Areas. Report prepared by the Institute for European Environmental Policy (IEEP) for DG Environment. https://ec.europa. eu/environment/nature/natura2000/marine/docs/Socio%20 -Economic%20Benefits%20of%20EU%20MPAs.pdf
Russi, D., Pantzar, M., Kettunen, M., Gitti, G., Mutafoglu, K., Kotulak, M., & ten Brink P. (2016). Socio-Economic Benefits of the EU Marine Protected Areas. Report prepared by the Institute for European Environmental Policy (IEEP) for DG Environment. https://ec.europa. eu/environment/nature/natura2000/marine/docs/Socio%20 -Economic%20Benefits%20of%20EU%20MPAs.pdf
Turschwell, M.P., Connolly, R.M., Dunic, J.C., Sievers, M., Buelow, C.A., Pearson, R. M., Tulloch, V.J., Côté, I.M., Unsworth, R.K., Collier, C.J., & Brown, C.J. (2021). Anthropogenic pressures and life history predict trajectories of seagrass meadow extent at a global scale. Proceedings of the National Academy of Sciences, 118(45). https://doi.org/10.1073/pnas.2110802118
de los Santos, C.B., Krause-Jensen, D., Alcoverro, T. , Marbà, N., Duarte, C. M., van Katwijk, M. M., Pérez, M., Romero, J., SánchezLizaso, J. L., Roca, G., Jankowska, E., Pérez-Lloréns, J. L., Fournier, J., Montefalcone, M., Pergent, G., Ruiz, J. M., Cabaço, S., Cook, K., Wilkes, R. J., Moy, F.E., Muñoz-Ramos Trayter, G., Seglar Arañó, X., de Jong, D.J., Fernández-Torquemada, Y., Auby, I., Vergara, J.J., & Santos, R. (2019). Recent trend reversal for declining European seagrass meadows. Nature Communications, 10(1), 3356. https://doi.org/10.1038/s41467-019-11340-4
de los Santos, C.B., Krause-Jensen, D., Alcoverro, T. , Marbà, N., Duarte, C. M., van Katwijk, M. M., Pérez, M., Romero, J., SánchezLizaso, J. L., Roca, G., Jankowska, E., Pérez-Lloréns, J. L., Fournier, J., Montefalcone, M., Pergent, G., Ruiz, J. M., Cabaço, S., Cook, K., Wilkes, R. J., Moy, F.E., Muñoz-Ramos Trayter, G., Seglar Arañó, X., de Jong, D.J., Fernández-Torquemada, Y., Auby, I., Vergara, J.J., & Santos, R. (2019). Recent trend reversal for declining European seagrass meadows. Nature Communications, 10(1), 3356. https://doi.org/10.1038/s41467-019-11340-4
European Communities. (1992). Council Directive 92/43/EEC of 21 May 1992 on the conservation of natural habitats and of wild fauna and flora. http://data.europa.eu/eli/dir/1992/43/oj
Black, K.E., Smeaton, C., Turrell, W.R., & Austin, W.E.N. (2022). Assessing the potential vulnerability of sedimentary carbon stores to bottom trawling disturbance within the UK EEZ. Frontiers in Marine Science, 9, [892892]. https://doi.org/10.3389/fmars.2022.892892
Montefaclone, M., Vacchi, M., Archetti, R., Ardizzone, G., Astruch, P., Bianchi, C., Calvo, S., Criscoli, A., Fernández-Torquemada, Y., Luzzu, F., Misson, G., Morri, C., Pergent, G., Tomasello, A., & Ferrari, M. (2019). Geospatial modelling and map analysis allowed measuring regression of the upper limit of Posidonia Oceanica seagrass meadows under human pressure. Estuarine, Coastal and Shelf Science, 217, 148–157. https://doi.org/10.1016/j.ecss.2018.11.006
European Union. (2019). Regulation (EU) 2019/1241 of the European Parliament and of the Council of 20 June 2019 on the conservation of fisheries resources and the protection of marine ecosystems through technical measures amending Council Regulations (EC) No 1967/2006, (EC) No 1224/2009 and Regulations (EU) No 1380/2013, (EU) 2016/1139, (EU) 2018/973, (EU) 2019/472 and (EU) 2019/1022 of the European Parliament and of the Council, and repealing Council Regulations (EC) No 894/97, (EC) No 850/98, (EC) No 2549/2000, (EC) No 254/2002, (EC) No 812/2004 and (EC) No 2187/2005 PE/59/2019/REV/1. http://data.europa.eu/eli/reg/2019/1241/oj
European Union. (2016). Regulation (EU) 2016/2336 of the European Parliament and of the Council of 14 December 2016 establishing specific conditions for fishing for deep-sea stocks in the north-east Atlantic and provisions for fishing in international waters of the north-east Atlantic and repealing Council Regulation (EC) No 2347/2002.
Grorud-Colvert, K., Sullivan-Stack, J., Roberts, C., Constant, V., Horta e Costa, B., Pike, E.P., Kingston, N., Laffoley, D., Sala, E., Claudet, J., Friedlander, A.M., Gill, D.A., Lester, S.E., Day, J. C., Gonçalves, E.J., Ahmadia, G.N., Rand, M., Villagomez, A., Ban, N.C., … Lubchenco, J. (2021). The MPA guide: A framework to achieve global goals for the ocean. Science, 373(6560). https://doi.org/10.1126/science.abf0861
Claudet, J., Loiseau, C., & Pebayle, A. (2021). Critical gaps in the protection of the second largest exclusive economic zone in the world. Marine Policy, 124, 104379. ff10.1016/j. marpol.2020.104379ff. ffhal-03090152
ICES. (2019). Workshop on Tradeoffs Scenarios between the Impact on Seafloor Habitats and Provisions of catch/value (WKTRADE2). ICES Scientific Reports. 1:63. 67 pp. http://doi.org/10.17895/ices.pub.5598
ICES. (2021). A series of two Workshops to develop a suite of management options to reduce the impacts of bottom fishing on seabed habitats and undertake analysis of the trade-offs between overall benefit to seabed habitats and loss of fisheries revenue/ contribution margin for these options (WKTRADE3). ICES Scientific Reports. 3:61. 100 pp. http://doi.org/10.17895/ices.pub.8206
Bastardie, F., Danto, J., Rufener, M.-C., van Denderen, D., Eigaard, O. R., Dinesen, G. E., & Nielsen, J. R. (2020). Reducing fisheries impacts on the seafloor: A bio-economic evaluation of policy strategies for improving sustainability in the Baltic Sea. Fisheries Research, 230, 105681.
https://doi.org/10.1016/j.fishres.2020.105681
Scientific, Technical and Economic Committee for Fisheries (STECF). (2022). Support of the Action plan to conserve fisheries resources and protect marine ecosystems (STECF-OWP-22-01). EUR 28359
EN. Publications Office of the European Union, Luxembourg, 2022, ISBN 978-92-76-52911-8, doi:10.2760/25269, JRC129455
55
52 63 64 65 66 67 68 69 70 72 73 74 53 54 55 56 57 58 59 60 61 62
A pathway to decarbonise the EU fisheries sector
European Union. (2022). Climate change and the Common Fisheries Policy: adaptation and building resilience to the effects of climate change on fisheries and reducing emissions of greenhouse gases from fishing EASME/EMFF/2020/3.2.6 - Lot1/SC07 EASME/ EMFF/2020/3.2.6 - Lot2/SC08 Final Report. Retrieved at: https://cinea. ec.europa.eu/system/files/2022-12/climate%20change%20and%20 the%20common%20fisheries%20policy-HZ0422057ENN.pdf
He, P., Chopin, F., Suuronen, P., Ferro, R.S.T., & Lansley, J. (2021). Classification and illustrated definition of fishing gears. FAO Fisheries and Aquaculture Technical Paper No. 672. United Nations, Food and Agriculture Organization.
Fiskerforum. (October 13, 2022). Beamer’s fuel saving refit. FiskerForum [Press release]. Retrieved at: https://fiskerforum.com/beamers-fuel-saving-refit/
Commodores Boats. (March 13, 2019). Mystic Era – New Bulbous bow and Paint. Retrieve at: http://www.commodoresboats.com/ past-projects/mystic-era-new-bulbous-bow-and-paint/
Coprexma.(2022). Innovations: Tunnel of LoC or Low Consumption. Retrieved at: https://en.coprexma.fr/innovations/
Coprexma.(2022). Innovations: IR bow. Retrieved at: https://en.coprexma.fr/innovations/
Masterplan Duurzame Visserij. (2002). Retrieved at: https://masterplanduurzamevisserij.nl/
National Federation of Fishermen’s Organisations, NFFO. (2022). “Electrifying The Fleet” More sustainable propulsion options for the small-scale fishing fleet. Report prepared for National Federation of Fisherman’s Organisations (NFFO), Future Fisheries Alliance (RSPB, MCS, WWF), North Sea Wildlife Trusts.
DOI: 10.5281/zenodo.6547083
LNG Prime. (2021, November 22). Cemre launches Norwegian LNG-fueled fishing vessel. [Press release]. https://lngprime.com/europe/cemre-launches-norwegian-lng-fueledfishing-vessel/34388/
Bastardie, F., Feary, D.A., Kell, L., Brunel, T., Metz, S., Döring, R., Eigaard, O.R., Basurko, O.C. (2022). European Union. (2022). Climate change and the Common Fisheries Policy: adaptation \ and building resilience to the effects of climate change on fisheries and reducing emissions of greenhouse gases from fishing EASME/ EMFF/2020/3.2.6 - Lot1/ SC07 EASME/EMFF/2020/3.2.6 - Lot2/ SC08 Final Report. Retrieved at: https://cinea.ec.europa.eu/system/ files/2022-12/climate%20 change%20and%20the%20common%20 fisheries%20policyHZ0422057ENN.pdf
European Commission. (2020). COMMUNICATION FROM THE COMMISSION TO THE EUROPEAN PARLIAMENT, THE COUNCIL, THE EUROPEAN ECONOMIC AND SOCIAL COMMITTEE AND THE COMMITTEE OF THE REGIONS Stepping up Europe’s 2030 climate ambition Investing in a climate-neutral future for the benefit of our people.COM/2020/562 final.
European Commission. (2022). 2050 long-term strategy. Retrieved at: https://climate.ec.europa.eu/eu-action/climate-strategiestargets/2050-long-term-strategy_en
European Commission. (2020). COMMUNICATION FROM THE COMMISSION TO THE EUROPEAN PARLIAMENT, THE COUNCIL, THE EUROPEAN ECONOMIC AND SOCIAL COMMITTEE AND THE COMMITTEE OF THE REGIONS A Farm to Fork Strategy for a fair, healthy and environmentally-friendly food system. COM/2020/381 final.
European Union. (2022). Climate change and the Common Fisheries Policy: adaptation and building resilience to the effects of climate change on fisheries and reducing emissions of greenhouse gases from fishing EASME/EMFF/2020/3.2.6 - Lot1/SC07 EASME/ EMFF/2020/3.2.6 - Lot2/SC08 Final Report. Retrieved at: https://cinea. ec.europa.eu/system/files/2022-12/climate%20change%20and%20 the%20common%20fisheries%20policy-HZ0422057ENN.pdf
Parker, R.W., Blanchard, J.L., Gardner, C., Green, B.S., Hartmann, K., Tyedmers, P.H., & Watson, R.A. (2018). Fuel use and greenhouse gas emissions of world fisheries. Nature
Cheilari, A., Guillen, J., Damalas, D., & Barbas, T. (2013). Effects of the Fuel Price Crisis on the Energy Efficiency and the Economic Performance of the European Union Fishing Fleets. Marine policy, 40, 18-24. https://doi.org/10.1016/j.marpol.2012.12.006
United Nations Framework Convention on Climate Change.(2023). Greemhouse Gas Inventory Data, Time Series – Annex I GHG total without LLUCF, in kt CO2 equivalent. Retrieved at: https://di.unfccc.int/time_series
European Commission. (2021). Annual European Union greenhouse gas inventory 1990-2010 and inventory report 2021. European Commission, DG Climate Action, European Environment Agency. f454ae4c825646b2a15497b17a71dbf0
European Union. (2020). COMMUNICATION FROM THE COMMISSION TO THE EUROPEAN PARLIAMENT, THE COUNCIL, THE EUROPEAN ECONOMIC AND SOCIAL COMMITTEE AND THE COMMITTEE OF THE REGIONS Stepping up Europe’s 2030 climate ambition Investing in a climate-neutral future for the benefit of our people.COM/2020/562 final
Council of the European Union. (2022, November 8). ‘Fit for 55’: EU strengthens emission reduction targets for member states [Press release]. European Union. Retrieved at: https://www.consilium.europa.eu/en/ press/press-releases/2022/11/08/fit-for-55-eu-strengthens-emissionreduction-targets-for-member-states/
European Union. (2022). Climate change and the Common Fisheries Policy: adaptation \and building resilience to the effects of climate change on fisheries and reducing emissions of greenhouse gases from fishing EASME/EMFF/2020/3.2.6 - Lot1/SC07 EASME/ EMFF/2020/3.2.6 - Lot2/SC08 Final Report. Retrieved at: https://cinea. ec.europa.eu/system/files/2022-12/climate%20change%20and%20 the%20common%20fisheries%20policy-HZ0422057ENN.pdf
European Union. (2022). Climate change and the Common Fisheries Policy: adaptation \and building resilience to the effects of climate change on fisheries and reducing emissions of greenhouse gases from fishing EASME/EMFF/2020/3.2.6 - Lot1/SC07 EASME/ EMFF/2020/3.2.6 - Lot2/SC08 Final Report. Retrieved at: https://cinea. ec.europa.eu/system/files/2022-12/climate%20change%20and%20 the%20common%20fisheries%20policy-HZ0422057ENN.pdf
European Commission.(2022, December 2). Denmark will receive €201 million from the European Maritime, Fisheries and Aquaculture Fund 2021-2027 [Press conference]. https://oceans-and-fisheries.ec.europa. eu/news/denmark-will-receive-eu201-million-european-maritimefisheries-and-aquaculture-fund-2021-2027-2022-12-06_en
Poore, J., & Nemecek, T. (2018). Reducing food's environmental impacts through producers and consumers. Science, 360(6392),987-992. https://doi.org/10.1126/science.aaq0216
Hornborg, S., Bastardie, F., Eigaard, O. R., & Ziegler, F. (2022). Greenhouse gas emissions of seafood from Danish capture fisheries in the Skagerrak, Kattegat, and western Baltic. RISE Research Institutes of Sweden AB. RISE Report No. 2022:40. https://orbit.dtu.dk/en/ publications/greenhouse-gas-emissions-of-seafood-from-danishcapture-fisheries
Hilborn, R., & Tellier, P. (2012). The environmental cost of New Zealand food production. The New Zealand Seafood Industry Council Ltd. ISBN: 978-0473-17824-6. Available at seafood.co.nz
56 by 2050
75 76 77 78 79 80 81 82 83 84 85 86 87 88
92 93 95 96 97 98 99 100 101 102
89 90 91
MEPC. (2020). Marine Environment Protection Committee, International Maritime Organisation. Reduction of GHG Study 2020 – Final report. MEPC 75/7/15. https://www.imo.org/en/OurWork/ Environment/Pages/Fourth-IMO-Greenhouse-Gas-Study-2020.aspx
Bastardie, F., Feary, D.A., Kell, L., Brunel, T., Metz, S., Döring, R., Eigaard, O.R., Basurko, O.C. (2022). European Union. (2022). Climate change and the Common Fisheries Policy: adaptation \and building resilience to the effects of climate change on fisheries and reducing emissions of greenhouse gases from fishing EASME/EMFF/2020/3.2.6 - Lot1/ SC07 EASME/EMFF/2020/3.2.6 - Lot2/SC08 Final Report. Retrieved at: https://cinea.ec.europa.eu/system/files/2022-12/climate%20 change%20and%20the%20common%20fisheries%20policyHZ0422057ENN.pdf
National Federation of Fishermen’s Organisations, NFFO. (2022). “Electrifying The Fleet” More sustainable propulsion options for the small-scale fishing fleet. Report prepared for National Federation of Fisherman’s Organisations (NFFO), Future Fisheries Alliance (RSPB, MCS, WWF), North Sea Wildlife Trusts. DOI: 10.5281/zenodo.6547083
Jafarzadeh, S., Paltrinieri, N., Utne, I.B., & Ellingsen, H. (2017). LNGfuelled fishing vessels: A systems engineering approach. Transportation Research Part D: Transport and Environment, 50, 202-222.
European Union. (2022). Climate change and the Common Fisheries Policy: adaptation \and building resilience to the effects of climate change on fisheries and reducing emissions of greenhouse gases from fishing EASME/EMFF/2020/3.2.6 - Lot1/SC07 EASME/ EMFF/2020/3.2.6 - Lot2/SC08 Final Report. Retrieved at: https://cinea. ec.europa.eu/system/files/2022-12/climate%20change%20and%20 the%20common%20fisheries%20policy-HZ0422057ENN.pdf
Cvitanovic, C. Mackay, M., Shellock, R.J., van Putten, E.I., Karcher, D.B., Dickey-Collas, M. (2021). Understanding and evidencing a broader range of ‘successes’ that can occur at the interface of marine science and policy. Marine Policy, 134 (4), [104802]. https://doi.org/10.1016/j.marpol.2021.104802
National Federation of Fishermen’s Organisations, NFFO. (2022). “Electrifying The Fleet” More sustainable propulsion options for the small-scale fishing fleet. Report prepared for National Federation of Fisherman’s Organisations (NFFO), Future Fisheries Alliance (RSPB, MCS, WWF), North Sea Wildlife Trusts. DOI: 10.5281/zenodo.6547083
European Union. (2021). REGULATION (EU) 2021/1060 OF THE EUROPEAN PARLIAMENT AND OF THE COUNCIL of 24 June 2021 laying down common provisions on the European Regional Development Fund, the European Social Fund Plus, the Cohesion Fund, the Just Transition Fund and the European Maritime, Fisheries and Aquaculture Fund and financial rules for those and for the Asylum, Migration and Integration Fund, the Internal Security Fund and the Instrument for Financial Support for Border Management and Visa Policy.
Kopp, D., Coupeau, Y., Vincent, B., Morandeau, F., Méhault, S., & Simon, J. (2020). The low impact of fish traps on the seabed makes it an ecofriendly fishing technique. PLOS ONE, 15(8).
https://doi.org/10.1371/journal.pone.0237819
Erzini, K., Monteiro, C.C., Ribeiro, J., Santos, M.N., Gaspar, M., Monteiro, P., & Borges, T.C. (1997). An experimental study of gill net and trammel net “ghost fishing” off the Algarve (southern Portugal). Marine Ecology Progress Series, 158, 257–265. https://doi.org/10.3354/meps158257
Al-Masroori, H., Al-Oufi, H., McIlwain, J.L., & McLean E. (2004). Catches of lost fish traps (ghost fishing) from fishing grounds near Muscat, Sultanate of Oman. Fisheries Research, 69(3), 407–414. https://doi.org/10.1016/j.fishres.2004.05.014
Unger, A., & Harrison, N. (2016). Fisheries as a source of marine debris on beaches in the United Kingdom. Marine Pollution Bulletin, 107(1), 52–58. https://doi.org/10.1016/j.marpolbul.2016.04.024
Naranjo-Elizondo, B., Cortés, J. (2018). Observations of litter deposited in the deep waters of Isla del Coco National Park, Eastern Tropical Pacific. Frontiers in Marine Science; 5, 1–8. https://doi.org/10.3389/fmars.2018.00091
Seas at Risk & Oceana (2022, May). Exploring alternatives to Europe’s bottom trawl fishing gears https://seas-at-risk.org/wp-content/ uploads/2022/09/SAR-Oceana-Bottom-trawling-FINAL-2.pdf Scientific, Technical and Economic Committee for Fisheries (STECF). (2022). Validation of selected sustainability indicators and underlying methodologies for the revision of the EU marketing standards for fisheries products (STECF-22-12). Publications Office of the European Union, Luxembourg, 2022.
European Union. (2019). Regulation (EU) 2019/1241 of the European Parliament and of the Council of 20 June 2019 on the conservation of fisheries resources and the protection of marine ecosystems through technical measures amending Council Regulations (EC) No 1967/2006, (EC) No 1224/2009 and Regulations (EU) No 1380/2013, (EU) 2016/1139, (EU) 2018/973, (EU) 2019/472 and (EU) 2019/1022 of the European Parliament and of the Council, and repealing Council Regulations (EC) No 894/97, (EC) No 850/98, (EC) No 2549/2000, (EC) No 254/2002, (EC) No 812/2004 and (EC) No 2187/2005 PE/59/2019/REV/1. http://data.europa.eu/eli/reg/2019/1241/oj
Claudet, J., Ban, N.C., Blythe, J., Briggs, J., Darling, E., Gurney, G.G., Palardy, J. E., Pike, E. P., Agostini, V. N., Ahmadia, G. N., Campbell, S. J., Epstein, G., Estradivari, Gill, D., Himes-Cornell, A., Jonas, H. D., Jupiter, S. D., Mangubhai, S., & Morgan, L. (2022). Avoiding the misuse of other effective area-based conservation measures in the wake of the blue economy. One Earth, 5(9), 969-974. https://doi.org/10.1016/j.oneear.2022.08.010
European Union. (2022). Climate change and the Common Fisheries Policy: adaptation \and building resilience to the effects of climate change on fisheries and reducing emissions of greenhouse gases from fishing EASME/EMFF/2020/3.2.6 - Lot1/SC07 EASME/ EMFF/2020/3.2.6 - Lot2/SC08 Final Report. Retrieved at: https://cinea. ec.europa.eu/system/files/2022-12/climate%20change%20and%20 the%20common%20fisheries%20policy-HZ0422057ENN.pdf
Oberle, F.K., Storlazzi, C.D., & Hanebuth, T.J.J.J. (2016). What a drag: Quantifying the global impact of chronic bottom trawling on continental shelf sediment. Journal of Marine Systems, 159, 109-119. https://doi.org/10.1016/j.jmarsys.2015.12.007
Daly, E., Johnson, M. P., Wilson, A. M., Gerritsen, H. D., Kiriakoulakis, K., Allcock, A. L., & White, M. (2018). Bottom trawling at Whittard Canyon: Evidence for seabed modification, trawl plumes and food source heterogeneity. Progress in Oceanography, 169, 227-240.
Basurko, O.C., Gabiña, G., Lopez, J., Granado, I., Murua, H., Fernandes, J.A., Krug, I., Ruiz, J., & Uriondo, Z. (2022). Fuel consumption of freeswimming school versus FAD strategies in tropical tuna purse seine fishing. Fisheries Research, 245, 106139.
Guillen, J., Santos, A. C., Carpenter, G., Casey, J., Lleonart, J., Maynou, F., ... & Carvalho, N. (2016). Sustainability now or later? Estimating the benefits of pathways to maximum sustainable yield for EU Northeast Atlantic fisheries.
Cheilari, A., Guillen, J., Damalas, D., & Barbas, T. (2013). Effects of the Fuel Price Crisis on the Energy Efficiency and the Economic Performance of the European Union Fishing Fleets. Marine policy, 40, 18-24. https://doi.org/10.1016/j.marpol.2012.12.006
European Union. (2022). Climate change and the Common Fisheries Policy: adaptation and building resilience to the effects of climate change on fisheries and reducing emissions of greenhouse gases from fishing EASME/EMFF/2020/3.2.6 - Lot1/SC07 EASME/ EMFF/2020/3.2.6 - Lot2/SC08 Final Report. Retrieved at: https://cinea. ec.europa.eu/system/files/2022-12/climate%20change%20and%20 the%20common%20fisheries%20policy-HZ0422057ENN.pdf
Sala, A., De Carlo, F., Buglioni, G. & Lucchetti, A. (2011). Energy performance evaluation of fishing vessels by fuel mass flow measuring system. Ocean Engineering, 38(5-6), 804–809. https://doi.org/10.1016/j.oceaneng.2011.02.004
57
103 104
124 125 126 129 130 131 132 133 135 136
109 110 111 112 113 116 117 118 119 115
120 122 123
Basurko, O.C., Gabiña, G., & Uriondo, Z. (2013). Energy performance of fishing vessels and potential savings. Journal of Cleaner Production, 54, 30-40.
European Parliament. (2014). The conflict between static gear and mobile gear in inshore fisheries. Study for the European Parliament. Policy Department B: Structural and cohesion policies. Fisheries. IP/ B/PECH/IC/2014-018. https://www.europarl.europa.eu/RegData/ etudes/STUD/2014/529070/IPOL_STU(2014)529070_EN.pdf
Basurko, O.C., Gabiña, G., & Uriondo, Z. (2013). Energy performance of fishing vessels and potential savings. Journal of Cleaner Production, 54, 30-40.
Catching the potential. (2023). Retrieved at: https://catchingthepotential.eu/project/
Liu, W., Tang, H., You, X., Dong, S., Xu, L., & Hu, F. (2021). Effect of Cutting Ratio and Catch on Drag Characteristics and Fluttering Motions of Midwater Trawl Codend. Journal of Marine Science and Engineering, 9(3), 256. https://doi.org/10.3390/jmse9030256
European Union. (2022). Climate change and the Common Fisheries Policy: adaptation \and building resilience to the effects of climate change on fisheries and reducing emissions of greenhouse gases from fishing EASME/EMFF/2020/3.2.6 - Lot1/SC07 EASME/ EMFF/2020/3.2.6 - Lot2/SC08 Final Report. Retrieved at: https://cinea. ec.europa.eu/system/files/2022-12/climate%20change%20and%20 the%20common%20fisheries%20policy-HZ0422057ENN.pdf
Bastardie, F., Feary, D.A., Kell, L., Brunel, T., Metz, S., Döring, R., Eigaard, O.R., Basurko, O.C. (2022). European Union. (2022). Climate change and the Common Fisheries Policy: adaptation \and building resilience to the effects of climate change on fisheries and reducing emissions of greenhouse gases from fishing EASME/EMFF/2020/3.2.6 - Lot1/ SC07 EASME/EMFF/2020/3.2.6 - Lot2/SC08 Final Report. Retrieved at: https://cinea.ec.europa.eu/system/files/2022-12/climate%20 change%20and%20the%20common%20fisheries%20policyHZ0422057ENN.pdf
Mariani, G., Cheung, W. W., Lyet, A., Sala, E., Mayorga, J., Velez, L., Gaines, S. D., Dejean, T., Troussellier, M., & Mouillot, D. (2020). Let more big fish sink: Fisheries prevent blue carbon sequestration—half in unprofitable areas. Science Advances, 6(44). https://doi.org/10.1126/sciadv.abb4848
Sumaila , U. R., Walsh, M., Hoareau, K., Cox, A., Teh, L., Abdallah, P., Akpalu, W., Anna, Z., Benzaken, D., Crona, B., Fitzgerald, T., Heaps, L., Issifu, I., Karousakis, K., Lange, G. M., Leland, A., Miller, D., Sack, K., Shahnaz, D., … Zhang, J. (2021). Financing a sustainable ocean economy. Nature Communications, 12(1). https://doi.org/10.1038/s41467-021-23168-y
United Nations. (2023). Department of Economic and Social Affairs –Statistics. Retrieved at : unstats.un.org
Ministère de L’économie des Finances et de la souveraineté Industrielle et Numérique. (2023). Aides aux entreprises pour favoriser leur transition écologique - Aides aux entreprises pour favoriser leur transition écologique. Retrieved at: https://www.economie.gouv.fr/ cedef/aides-entreprises-transition-ecologique
EFTA Surveillance Authority. (2022). The Norwegian CO2 Compensation Sceme post-2021. Decision No 171/22/COI. Document No: 1255057. Case No. 89101. Norway compensation scheme. Retrieved at: https://www.eftasurv.int/cms/sites/default/files/ documents/gopro/COL%20-%20State%20aid%20-%20Norway%20 -%20the%20Norwegian%20CO2%20compensation%20scheme%20 post%202021.pdf
North Sea Advisory Council. (2022). NSAC Advice Ref. 17-2122, NSAC Advice on decarbonisation of fishing fleet. https://www.nsrac.org/latest-advice/
European Union. (2022). Decision (EU) 2022/591 of the European Parliament and of the Council of 6 April 2022 on a General Union Environment Action Programme to 2030. https://eur-lex.europa.eu/ legal-content/EN/TXT/?uri=CELEX%3A32022D0591
Bastardie, F., Feary, D.A., Kell, L., Brunel, T., Metz, S., Döring, R., Ritzau, O., Oihane, E., & Basurko, C. (2022). Climate change and the Common Fisheries Policy: adaptation and building resilience to the effects of climate change on fisheries and reducing emissions of greenhouse gases from fishing EASME/EMFF/2020/3.2.6 - Lot1/SC07 EASME/ EMFF/2020/3.2.6 - Lot2/SC08 Final Report. European Union. Retrieved at: https://cinea.ec.europa.eu/system/files/2022-12/ climate%20change%20and%20the%20common%20fisheries%20 policy-HZ0422057ENN.pdf
Jackson, T. (2016). Foundations for the Economy of Tomorrow. Prosperity without Growth, 179–198. https://doi.org/10.4324/9781315677453-17
Sandberg, M. (2021). Sufficiency transitions: A review of consumption changes for environmental sustainability. Journal of Cleaner Production, 293: 126097. https://doi.org/10.1016/j.jclepro.2021.126097
European Commission, Scientific, technical, and economic committee for fisheries. (2020). STECF - Assessment of balance indicators for key fleet segments and review of national reports on Member states’ efforts to achieve balance between fleet capacity and fishing opportunities (STECF-21-16) Publications Office of the European Union.
Helmond, A. T. M., Mortensen, L. O., Plet-Hansen, K. S., Ulrich, C., Needle, C. L., Oesterwind, D., Kindt-Larsen, L., Catchpole, T., Mangi, S., Zimmermann, C., Olesen, H. J., Bailey, N., Bergsson, H., Dalskov, J., Elson, J., Hosken, M., Peterson, L., McElderry, H., Ruiz, J., … Poos, J. J. (2019). Electronic monitoring in fisheries: Lessons from global experiences and future opportunities. Fish and Fisheries, 21(1), 162–189. https://doi.org/10.1111/faf.12425
017-2023 SINTEF Ocean. (2023). Smartfish H2020 Innovation for sustainable fisheries. (http://smartfishh2020.eu/) for Nephrops
Gladju, J., Kamalam, B.S., & Kanagaraj, A. (2022). Applications of data mining and machine learning framework in aquaculture and fisheries: A review. Smart Agricultural Technology, 2, 100061. https://doi.org/10.1016/j.atech.2022.100061
European Union. (2021). Regulation (EU) 2021/1139 of the European Parliament and of the Council of 7 July 2021 establishing the European Maritime, Fisheries and Aquaculture Fund and amending Regulation (EU) 2017/1004.
European Commission. (2023). EU fisheries and aquaculture – energy transition. https://ec.europa.eu/info/law/better-regulation/haveyour-say/initiatives/13619-EU-fisheries-and-aquaculture-energytransition_en
European Commission, Scientific, technical, and economic committee for fisheries. (2020). STECF - Assessment of balance indicators for key fleet segments and review of national reports on Member states’ efforts to achieve balance between fleet capacity and fishing opportunities (STECF-21-16) Publications Office of the European Union.
European Parliament. (2022). Report - A9-0291/2022 - REPORT on the small-scale fisheries situation in the EU and future perspectives. 9.12.2022 - (2021/2056(INI)). https://www.europarl.europa.e u/ doceo/document/A-9-2022-0291_EN.html
European Commission. (2022). REPowerEU: affordable, secure and sustainable energy for Europe. https://commission.europa.eu/ strategy-and-policy/priorities-2019-2024/european-green-deal/ repowereu-affordable-secure-and-sustainable-energy-europe_en European Commission. (2022). Horizon Europe - Work Programme 2023-2024 Food, Bioeconomy, Natural Resources, Agriculture and Environment (European Commission Decision C(2022)7550 of 6 December 2022). https://ec.europa.eu/info/funding-tenders/ opportunities/docs/2021-2027/horizon/wp-call/2023-2024/wp-9food-bioeconomy-natural-resources-agriculture-and-environment_ horizon-2023-2024_en.pdf
European Union. (2014). Commission Regulation (EU) No 651/2014 of 17 June 2014 declaring certain categories of aid compatible with the internal market in application of Articles 107 and 108 of the Treaty Text with EEA relevance. http://data.europa.eu/eli/reg/2014/651/oj
58 by 2050 A
pathway to decarbonise the EU fisheries sector
157 158 159 161 162 163 166 167 169 170
140 142 144 145 146 147 148 149 150 151 152
137 138 139
153 154 155 156
Scientific, Technical and Economic Committee for Fisheries (STECF). (2020). Annual Economic Report (AER) Database: Scientific, Technical, and Economic Committee for Fisheries. (STECF): The 2020 Annual Economic Report on the EU Fishing Fleet (STECF 20-06), Prellezo, R., Dentes De Carvalho Gaspar, N. and Guillen Garcia, J. editor(s), EUR 28359 EN, Publications Office of the European Union, Luxembourg, 2020, ISBN 978-92-76-27164-2 (main), doi:10.2760/500525 (main), JRC123089
Dinesen, G.E., Rathje, I.W., Højrup, M., Bastardie, F., Larsen, F., Sørensen, T.K., Hoffmann, E., & Eigaard, O.R. (2018). Individual transferable quotas, does one size fit all? Sustainability analysis of an alternative model for quota allocation in a small-scale coastal fishery. Marine Policy, 88, 23–31. https://doi.org/10.1016/j.marpol.2017.10.038
European Union. (2019). Directive (EU) 2019/633 of the European Parliament and of the Council of 17 April 2019 on unfair trading practices in business-to-business relationships in the agricultural and food supply chain. PE/4/2019/REV/2. http://data.europa.eu/eli/dir/2019/633/oj
European Commission. (2020). COMMUNICATION FROM THE COMMISSION TO THE EUROPEAN PARLIAMENT, THE COUNCIL, THE EUROPEAN ECONOMIC AND SOCIAL COMMITTEE AND THE COMMITTEE OF THE REGIONS EU Biodiversity Strategy for 2030 Bringing nature back into our lives. COM/2020/380 final. https://eurlex.europa.eu/legal-content/EN/TXT/?uri=CELEX:52020DC0380
European Union. (2006). COUNCIL REGULATION (EC) No 1967/2006 of 21 December 2006 concerning management measures for the sustainable exploitation of fishery resources in the Mediterranean Sea,amending Regulation (EEC) No 2847/93 and repealing Regulation (EC) No 1626/94. https://eur-lex.europa.eu/LexUriServ/LexUriServ. do?uri=OJ:L:2006:409:0011:0085:En:PDF
The General Fisheries Commission for the Mediterranean (GFCM). (2019). Resolution GFCM/43/2019/5. Resolution GFCM/43/2019/5on a compliance assessment scheme for the implementation of Recommendation GFCM/38/2014/2 concerning the identification of non-compliance
Bretagne Développement Innovation. (2021). Annuaire et carte des projects hydrogene renouvelable en Bretagne. Retrieved at: https://www.bdi.fr/fr/publications/annuaire-et-carte-des-projetshydrogene-renouvelable-en-bretagne/
Maersk. (2022, March 10). A.P. Moller - Maersk engages in strategic partnerships across the globe to scale green methanol production by 2025. [Press release]. Retrieved at: https://www.maersk.com/news/ articles/2022/03/10/maersk-engages-in-strategic-partnerships-toscale-green-methanol-production
State of Green. (2022, August 2). REDDAP: The world’s first dynamic green ammonia plant. [Press conference]. Retrieved at: https://stateofgreen.com/en/solutions/reddap-the-worlds-firstdynamic-green-ammonia-plant/
European Commission. (2021). Proposal for a REGULATION OF THE EUROPEAN PARLIAMENT AND OF THE COUNCIL on the deployment of alternative fuels infrastructure, and repealing Directive 2014/94/EU of the European Parliament and of the Council. COM/2021/559 final.
Bastardie, F., Brown, E. J., Andonegi, E., Arthur, R., Beukhof, E., Depestele, J., Döring, R., Eigaard, O. R., García-Barón, I., Llope, M., Mendes, H., Piet, G. J., & Reid, D. (2021). A review characterizing 25 ecosystem challenges to be addressed by an ecosystem approach to fisheries management in Europe. Frontiers in Marine Science, 7 https://doi.org/10.3389/fmars.2020.629186
North Sea Advisory Council. (2022). NSAC Advice Ref. 17-2122, NSAC Advice on decarbonisation of fishing fleet. https://www.nsrac.org/ latest-advice/ The ‘8th Environment Action programme’ at https://eurlex.europa.eu/legal-content/EN/TXT/?uri=CELEX%3A32022D0591
Scientific, Technical and Economic Committee for Fisheries (STECF). (2022). Support of the Action plan to conserve fisheries resources and protect marine ecosystems (STECF-OWP-22-01). EUR 28359 EN. Publications Office of the European Union, Luxembourg, 2022, ISBN 978-92-76-52911-8, doi:10.2760/25269, JRC129455.
Marbà, N., Duarte, C. M., Cebrián, J., Gallegos, M. E., Olesen, B., & Sand-Jensen, K. (1996). Growth and population dynamics of Posidonia oceanica on the Spanish Mediterranean coast: elucidating seagrass decline. Marine Ecology Progress Series, 137(1/3), 203–213. http://www.jstor.org/stable/24857076
Mariani, G., Cheung, W. W., Lyet, A., Sala, E., Mayorga, J., Velez, L., Gaines, S. D., Dejean, T., Troussellier, M., & Mouillot, D. (2020). Let more big fish sink: Fisheries prevent blue carbon sequestration—half in unprofitable areas. Science Advances, 6(44).
https://doi.org/10.1126/sciadv.abb4848
National Academies of Sciences, Engineering, and Medicine. (2022). A Research Strategy for Ocean-based Carbon Dioxide Removal and Sequestration. Washington, DC: The National Academies Press. https://doi.org/10.17226/26278
Bastardie, F., Brown, E.J., Andonegi, E., Arthur, R., Beukhof, E., Depestele, J., Döring, R.,Eigaard, O.R., García-Barón, I., Llope, M., Mendes, H., Piet, G., Reid, D. (2021). A review characterizing 25 ecosystem challenges to be addressed by an ecosystemapproach to fisheries management in Europe. Frontiers in Marine Science 7 European Union. (2023). Biodiversity : how the EU protects nature.
https://www.consilium.europa.eu/en/policies/biodiversity/#2030
National Fishermen. (2022, January 27). ‘We are the pioneers’: Building a hydrogen-powered fishing vessel. https://www.nationalfisherman. com/boats-gear/-we-are-the-pioneers-building-a-hydrogen-poweredfishing-vessel
SINTEF Ocean. (2021).Rapportnr. 2021:00632. 30. november 2021.
Sluttrapport: Elektrifisering av kystfiskeflåten ved bruk av batterier og brenselceller. Retrieved at:
https://www.fhf.no/prosjekter/prosjektbasen/901640/
IRENA & METHANOL INSTITUTE. (2021). Innovation Outlook: Renewable Methanol. https://www.irena.org/publications/2021/Jan/ Innovation-Outlook-Renewable-Methanol
SINTEF Ocean. (2021).Rapportnr. 2021:00632. 30. november 2021. Sluttrapport: Elektrifisering av kystfiskeflåten ved bruk av batterier og brenselceller. Retrieved at:
https://www.fhf.no/prosjekter/prosjektbasen/901640/
National Federation of Fishermen’s Organisations, NFFO. (2022). “Electrifying The Fleet” More sustainable propulsion options for the small-scale fishing fleet. Report prepared for National Federation of Fisherman’s Organisations (NFFO), Future Fisheries Alliance (RSPB, MCS, WWF), North Sea Wildlife Trusts.
DOI: 10.5281/zenodo.6547083
Sandberg, M. (2021). Sufficiency transitions: A review of consumption changes for environmental sustainability. Journal of Cleaner Production, 293: 126097. https://doi.org/10.1016/j.jclepro.2021.126097 STECF 2022 EWG 22-12. European Commission, STECF (2022).
Sandberg, M. (2021). Sufficiency transitions: A review of consumption changes for environmental sustainability. Journal of Cleaner Production, 293: 126097. https://doi.org/10.1016/j.jclepro.2021.126097 STECF 2022 EWG 22-12. European Commission, STECF (2022).
European Union. (2013). Regulation (EU) No 1379/2013 of the European Parliament and of the Council of 11 December 2013 on the common organisation of the markets in fishery and aquaculture products, amending Council Regulations (EC) No 1184/2006 and (EC) No 1224/2009 and repealing Council Regulation (EC) No 104/2000.
59
191 192 193 194 195 196 197 198 199
176 178 179 180 181 182 183 184 185 186 187 189 190
172 174 175
Bastardie, F., Brown, E. J., Andonegi, E., Arthur, R., Beukhof, E., Depestele, J., Döring, R., Eigaard, O. R., García-Barón, I., Llope, M., Mendes, H., Piet, G. J., & Reid, D. (2021). A review characterizing 25 ecosystem challenges to be addressed by an ecosystem approach to fisheries management in Europe. Frontiers in Marine Science, 7 https://doi.org/10.3389/fmars.2020.629186
Anderson, J.L., Anderson, C.M., Chu, J., Meredith, J., Asche, F., Sylvia, G., Smith, M. D., Anggraeni, D., Arthur, R., Guttormsen, A., McCluney, J.K., Ward, T., Akpalu, W., Eggert, H., Flores, J., Freeman, M.A., Holland, D.S., Knapp, G., Kobayashi, M., Larkin, S., MacLauchlin, K., Schnier, K., Soboil, M., Tveteras, S., Uchida, H., & Valderrama, D. (2015). The Fishery Performance Indicators: A Management Tool for Triple Bottom Line Outcomes. PLOS ONE, 10(5), e0122809. https://doi.org/10.1371/journal.pone.0122809
Avadí, A., & Fréon, P. (2013). Life cycle assessment of fisheries: A review for fisheries scientists and managers. Fisheries Research, 143, 21–38. https://doi.org/10.1016/j.fishres.2013.01.006
Food and Agriculture Organization of the United Nations, Gulbrandsen, O. (2012). Fuel savings for small fishing vessels – a manual. United Nations FAO. https://www.fao.org/3/i2461e/i2461e.pdf National Federation of Fishermen’s Organisations
NFFO. (2022). “Electrifying The Fleet” More sustainable propulsion options for the small-scale fishing fleet. Report prepared for National Federation of Fisherman’s Organisations (NFFO), Future Fisheries Alliance (RSPB, MCS, WWF), North Sea Wildlife Trusts.
DOI: 10.5281/zenodo.6547083
European Union. (2003). Council Directive 2003/96/EC of 27 October 2003 restructuring the Community framework for the taxation of energy products and electricity (Text with EEA relevance).
Cooperation Maritime. (2023). Observatoire – Le prix du carburant pêche. https://amarree.fr/observatoire/
Millage, K.D., Saccomanno, V.R., Warham, M.M., Rubino, L.L., Schuhbauer, A., Sumaila, U.R., & Costello, C. (2022). SubsidyExplorer: A decision-support tool to improve our understanding of the ecological and economic effects of reforming fisheries subsidies. PLoS ONE 17(6). https://doi.org/10.1371/journal.pone.0265829
European Commission. (2022). SWD (2022) 157 final. COMMISSION STAFF WORKING DOCUMENT. Accompanying the document Communication from the Commission to the European Parliament and the CouncilTowards more sustainable fishing in the EU: state of play and orientations for 2023 {COM(2022) 253 final}. http://www.bsac.dk/ getattachment/bb1aead9-2933-4456-bdf0-ab045cfea43f/swd-2022157_en.pdf.aspx?lang=en-GB
European Commission. (2016). JOINT COMMUNICATION TO THE EUROPEAN PARLIAMENT, THE COUNCIL, THE EUROPEAN ECONOMIC AND SOCIAL COMMITTEE AND THE COMMITTEE OF THE REGIONS International ocean governance: an agenda for the future of our oceans.JOIN/2016/049 final. https://eur-lex.europa.eu/ legal-content/EN/TXT/?uri=CELEX%3A52016JC0049
European Commission (2021, September 8). EU reinforces its leading position in global agri-food trade. [ Press release ]. https://ec.europa.eu/commission/presscorner/detail/en/IP_21_4584
Van Hoey, G., Bastardie, F., Birchenough, S., De Backer, A., Gill, A., De Koning, S., Hodgson, S., Mangi Chai, S., Steenbergen, J., Termeer, E., Van den Burg, S., & Hintzen, N. (2021). Overview of the effects of offshore wind farms on fisheries and aquaculture. Publications Office of the European Union.
Project Greensand. (2023). Why should we store CO2? Retrieved at: https://www.projectgreensand.com/en
Teh, L.S.L., Hotte, N., & Sumaila, U.R. (2017). Having it all: can fisheries buybacks achieve capacity, economic, ecological, and social objectives?. Maritime Studies, 16(1). https://doi.org/10.1186/s40152-016-0055-z
European Union. 2013. Regulation (EU) No 1380/2013 of the European Parliament and of the Council of 11 December 2013 on the Common Fisheries Policy, amending Council Regulations (EC) No 1954/2003 and (EC) No 1224/2009 and repealing Council Regulations (EC) No 2371/2002 and (EC) No 639/2004 and Council Decision 2004/585/ EC. http://data.europa.eu/eli/reg/2013/1380/oj
North Sea Advisory Council. (2022). NSAC Advice Ref. 17-2122, NSAC Advice on decarbonisation of fishing fleet. https://www.nsrac.org/ latest-advice/ The ‘8th Environment Action programme’ at https://eurlex.europa.eu/legal-content/EN/TXT/?uri=CELEX%3A32022D0591
Hornborg, S., Bastardie, F., Eigaard, O. R., & Ziegler, F. (2022). Greenhouse gas emissions of seafood from Danish capture fisheries in the Skagerrak, Kattegat, and western Baltic. RISE Research Institutes of Sweden AB. RISE Report No. 2022:40 https://orbit.dtu.dk/en/ publications/greenhouse-gas-emissions-of-seafood-from-danishcapture-fisheries
60 by 2050
A pathway to decarbonise the EU fisheries sector
205 206 207 208 209 210 211 212 213 214 215 216 218
201 202 203 204
© OCEANA / Keith Ellenbogen
Appendix A
Tabulation of Fuel Use Intensity (FUI) and Fuel Use Efficiency (FUE) of EU Fleets
Table A.1. Fuel Use Intensity (litre per tonne landed) per fleet segments making the national fishing fleets, with fishing areas in the NAO (North-East Atlantic and Baltic Sea) region. (DCF coding defines DFN: Drift nets, DRB: dredge, DTS: demersal trawls and seines, FPO: pots, MGO: other mobile gears, MGP: polyvalent active gears, PGP: polyvalent passive gears, PMP: active and passive gears, P.S.: purse seine, TBB: beam trawl, TM: pelagic and midwater trawls). [Total EU includes U.K.]. The best energy-efficient performers per fleet segment are marked in bold.
(continued on next page)
61 DFN0012 566 607 704 441 1,517 576 1,427 DFN1218 95 787 603 626 2,683 731 330 658 839 DFN1824 811 652 1,128 1,157 790 DFN2440 1,382 817 454 614 537 DRB0012 36 1,385 246 786 1,239 814 DRB1218 20 1,884 653 537 400 DRB1824 870 494 DRB2440 4,506 703 1,300 315 DTS0012 184 643 1,321 839 606 519 393 942 1,377 DTS1218 182 286 2,898 1,366 962 719 253 1,106 908 DTS1824 368 221 2,830 1,207 883 1,039 1,145 227 3,099 660 DTS2440 1577 457 316 1,239 1,079 736 978 423 1,112 252 1,040 3,574 DTS40XX 621 80 589 683 738 926 FPO0012 841 367 579 586 433 FPO1218 984 301 553 802 485 FPO1824 546 485 634 FPO2440 949 HOK0012 530 862 2,445 623 952 HOK1218 820 817 1,651 567 HOK1824 808 514 HOK2440 684 678 995 860 MGO0012 3,859 65 fs BEL DEU DNK ESP EST FIN FRA GBR IRL LTU LVA NLD POL PRT SWE
62 by 2050
MGP0012 258 759 341 MGP1218 779 1759 MGP1824 1,648 404 MGP2440 1,946 PG0012 126 68 139 137 1,310 170 PGO0012 174 PGP0012 216 826 825 813 32 493 PGP1218 307 815 1,618 504 PGP1824 1,440 884 PGP2440 830 7,293 PMP0012 378 951 172 801 474 PMP1218 366 1,450 477 1,375 PMP1824 1,024 784 474 PMP2440 1,060 5,029 PS0012 439 192 PS1218 182 74 105 PS1824 184 241 121 PS2440 313 134 TBB0012 675 2,610 5,295 1,108 760 TBB1218 731 971 1,821 1,965 883 TBB1824 1,906 930 980 1,396 2,694 1,122 TBB2440 1,946 1,651 3,707 2,441 2,274 TBB40XX 2,501 TM0012 308 3,319 TM1218 45 52 44 584 2,175 134 TM1824 37 616 243 93 TM2440 68 126 1,019 137 142 76 111 TM40XX 79 226 150 133 216 fs BEL DEU DNK ESP EST FIN FRA GBR IRL LTU LVA NLD POL PRT SWE (continued from previous page)
A pathway to decarbonise the EU fisheries sector
continued on next page
63 DFN0012 845 1,465 801 2,824 2,324 1,143 DFN1218 1,609 1,727 5,455 3,864 2,969 DFN1824 1,673 DFN2440 1,674 1,827 DRB0012 1,407 1,067 942 DRB1218 3,502 2,392 558 DRB1824 1,526 DTS0012 1,691 852 830 1,181 2,507 DTS1218 2,452 2,184 1,161 2,393 3,151 1,941 DTS1824 3,640 2,888 4,315 3,074 3,648 7,840 DTS2440 4,211 4,571 2,329 3,503 3,368 5,403 7,903 FPO0012 248 2,922 412 3,599 2,919 3,736 FPO1218 628 7,923 1,499 4,967 FPO2440 5,789 HOK0012 1,742 1,599 1,173 4,147 3,317 3,182 HOK1218 4,709 1,167 6,353 6,828 2,022 1,393 HOK1824 2,056 1,647 2,381 HOK2440 850 MGO0012 433 1,393 1,907 MGO1218 6,195 1,156 MGO1824 1,997 MGP0012 1,337 MGP2440 1,470 2,412 PG0012 2,199 525 fs BGR CYP ESP FRA GRC HRV ITA MLT PRT ROU SVN
)
(
Table A.2. Fuel Use Intensity (litre per tonne landed) per fleet segments making the national fishing fleets, with fishing areas in the MBS (Med and Black Sea) region. Best energy-efficient performers per fleet segment are marked in bold.
64 by 2050 A
PGO0012 5,949 417 3,445 PGO1218 1,573 PGP0012 811 610 556 3,548 1,411 7,043 PGP1218 575 1,018 1,344 1,716 1,155 PGP1824 772 1,530 PMP0012 91 3,063 741 1,567 1,752 1,982 266 PMP1218 407 2,046 516 2,683 2,739 6,157 201 PMP1824 459 1,305 93 PMP2440 253 NA 219 PS0012 350 243 639 1,344 644 PS1218 204 239 1,474 134 764 311 178 PS1824 826 276 1,031 773 122 440 234 PS2440 477 1,795 624 136 364 2,458 PS40XX 1,041 182 827 TBB0012 244 30 TBB1218 212 1,934 TBB1824 941 3,863 TBB2440 2,483 TM0012 981 TM1218 386 3,323 345 TM1824 374 415 TM2440 199 1,565 592 8,657 1,667 665 fs BGR CYP ESP FRA GRC HRV ITA MLT PRT ROU SVN (continued from previous page)
pathway to decarbonise the EU fisheries sector
Table A.3. Fuel Use Intensity (litre per tonne landed) per fleet segments making the national fishing fleets, with fishing areas in the OFR region. Best energy-efficient performers per fleet segment are marked in bold.
65 DFN0012 NA DTS1824 3,593 DTS2440 2,689 NA 3,162 DTS40XX 610 3,203 FPO0012 2,738 NA FPO1218 1,182 NA FPO1824 NA HOK0012 761 NA 486 HOK1218 585 987 573 HOK1824 936 1,860 776 HOK2440 759 1,017 HOK40XX 1,136 1,307 MGP0012 432 MGP1824 159 PGO0012 NA PGP0012 1,255 NA PGP1218 987 PGP2440 1,908 PMP0012 1,190 PMP1218 833 PMP2440 1,057 PS0012 1,261 NA PS1218 410 PS40XX 493 485 TM40XX 419 fs ESP FRA ITA LTU PRT
Appendix B
Switching of fishing techniques in the case of the Danish fleet
Several recent studies point to the fact that smallscale coastal fisheries are less fuel intense than large-scale fisheries for demersal stocks, for example targeting cod. 222,223
The average Norwegian cod in 2017 was associated with considerably lower emissions than the average value for Danish cod (2.02kg CO 2 eq/kg edible compared to 8.67kg CO 2 eq/kg edible) .
In 2017, Norwegian cod was mainly caught by the coastal fleet using coastal gear like gillnets, longlines, and handlines (51%), by demersal trawlers (35%) plus some by ocean-going longliners (9%) and coastal seines (5%). 224 The fuel use intensity of the Danish demersal trawl fisheries drives the higher emissions. When fished with Danish seine or gillnets, Danish cod has the same or lower emissions than the average value for Norwegian cod. 225
Table B.1. 2005-2019 average of fuel use intensity and annual CO2 emissions for Danish fleet segments active in the North Sea deduced from Bastardie et al. (2021) and assuming 2.2kg CO2-eq per kg of landed fish. Gear Code: OTB, TBB, SDN, GNS, TM, PS, DRB, FPN. Species assemblage code: DEF, SPF, CRU, MOL, CAT. Note that kg catch is not equivalent to edible kg. Obtaining edible kg estimates from the catch would use species-specific conversion factors, e.g., 0.52 for the pelagic herring, 0.33 for the gadoid cod, and 0.37 for the flatfish Plaice.
Large vessels using a bottom gear with small or
meshes
on next page)
66 by 2050 A pathway to decarbonise the EU fisheries sector
Large vessels using a bottom gear with large meshes OTB DEF >=120 0.987 2.605 13,836 171 80,839 36,041 SDN DEF >=120 0.254 0.67 1,398 99 14,092 936 GNS DEF 120-219 0.408 1.076 945 19 48,614 1,016 OTB DEF 100-119 1.02 2.693 925 90 10,231 2,491 GNS DEF >=220 1.164 3.073 104 13 7,855 319 GNS DEF 100-119 1.236 3.262 79 9 8,905 257
(continued
OTB DEF <16 0.078 0.207 160,216 5,160 31,048 33,118 OTB SPF 16-31 0.077 0.204 29,234 6,242 4,684 5,950 OTB DEF 16-31 0.205 0.542 20,563 2,945 6,982 11,150 PTB SPF 16-31 0.054 0.144 15,456 3,723 4,151 2,220 TBB CRU 16-31 1.131 2.986 2,516 52 48,717 7,513 OTB CRU 80-99 2.152 5.68 1,268 48 26,386 7,205 OTB DEF 70-99 1.894 4.999 425 69 6,177 2,123 OTB CRU 70-99 1.619 4.275 417 68 6,160 1,782
no
Type Fleet-segments Litre per kg catch CO2eq per kg catch Catch tonnes kg per h Hours at sea Tonnes of CO2eq emitted
(continued from previous page)
To reduce fuel use and CO2 emissions, it makes sense to test, with the example of the Danish fleets, a switch from bottom trawling towards Danish seining. Bottom trawling significantly impacts the seafloor (depending on the trawled habitats and the seasonality 226) because some components of the towed gear penetrate the seabed227 even if the trawl net makers are working to mitigate this effect precisely to save fuel (see morgère company and e.g the “exocet” doors).
However, Danish seine is not a popular fishing technique everywhere. In France, for example, there is a reluctance to implement this gear given its high efficiency and capacity to sweep a large seafloor area.228 There may not be a rational reason for such a reluctance, as seine does not penetrate the seabed profile.229,230 An efficiency gain is also expected to limit the operating cost in a quotalimited fishery without increasing fishing pressure, which is precisely limited by the quotas.
By re-allocating the effort from fuel-intense to lowerintense fishing techniques, it is found here that a saving of up to 42% can be achieved by phasing out bottom trawling from the Danish fleet (Figure B.1). This is equivalent to reducing the average annual emissions from 250,457 tonnes to 14,6293 tonnes of CO2eq (average for the period 2005-2018). The
extra consumption by the Danish fleet segments using passive gears is increased but kept strikingly low. The fuel savings come from much lower historical FUI of the receivers' fleets (Table B.5).
Figure B.1. Potential change in overall and fleet-disaggregated fuel use along with a scenario for a redistribution of the quotas (here, via fishing effort) from demersal trawls (purple) to seiners and to passive gears (green), the dredge and pelagic gears untouched (yellow). The redistribution was made consistent with the vessel size category. Based on the Danish data shown Table B.1, estimating average FUI per segment over the 2005-2019 period.
67
Type Fleet-segments Litre per kg catch CO2eq per kg catch Catch tonnes kg per h Hours at sea Tonnes of CO2eq emitted Large vessels using a bottom gear with small or no meshes OTB CRU 32-69 2.294 6.056 213 57 3,741 1,291 GNS DEF 90-99 1.362 3.596 69 9 7,761 247 Small vessels using a bottom gear with large meshes GNS DEF 110-156 0.246 0.648 710 27 26,256 460 GNS DEF 120-219 0.237 0.626 280 28 10,081 175 GNS DEF >=157 0.216 0.57 264 32 8,302 151 Small vessels using a passive gear DRB MOL >0 0.032 0.084 6,058 656 9,235 509 FPN CAT >0 0.107 0.282 95 26 3,717 27 GNS CRU >0 1.361 3.593 12 6 2,063 42 Large vessels using a pelagic trawl gear TM SPF 32-69 0.1176 0.306 108,987 18,803 5,796 33,347 TM SPF 16-31 0.092 0.242 95,368 5,929 16,084 23,113 PS SPF >0 0.071 0.186 17,291 11,681 1,480 3,223
0 25,000 50,000 75,000 Fuel consumption (thousands litres) % reallocation of bottom-contacting gears Fuel use - Danish fleet 0 25 50 75 100
A pathway to decarbonise the EU fisheries sector
B.2. Thousand litres along with a percentage re-allocation of fishing effort currently spent by the bottom-contacting gears to the passive gears. The considered fleet segments represented more than 75% of the total effort deployed during the period 2005-2018.
68 by 2050
All segments 94,870 90,927 86,983 83,032 79,087 75,143 71,196 67,250 63,308 59,358 55,414 Bottom-contacting gears (donors) 46,880 42,193 37,504 32,814 28,127 23,440 18,752 14,065 9,376 4,687 0 Passive gears (receivers) 2,545 3,289 4,034 4,773 5,515 6,258 6,999 7,740 8,487 9,226 9,969 Pelagic gears & dredge (unaffected) 45,445 45,445 45,445 45,445 45,445 45,445 45,445 45,445 45,445 45,445 45,445 Danish Fleet 94,870 75,143 55,414 -20.8 -41.6 250,457 146,293
Table
27.4:
Table B.4. 2005-2019 annual average of fuel use intensity and annual CO2 emissions for EU DCF donor fleet segmentation in the North Sea and Baltic Sea. Area coding is
North Sea; 27.3: Baltic Sea
27.4_OTB_DEF_>=120_0_0 0.9867 171 80,839 13,836 27.3_OTB_DEF_>=105_1_120 0.3422 234 45,051 10,550 27.3_OTB_DEF_90-119_0_0 1.3535 52 155,768 8,056 27.3_OTB_DEF_>=105_1_110 0.3622 206 37,193 7,659 27.3_OTB_DEF_>=120_0_0 1.2622 107 14,656 1,566 27.3_OTB_CRU_>=120_0_0 1.4695 123 8,001 987 27.4_OTB_DEF_100-119_0_0 1.0199 90 10,231 925 27.4_TBB_CRU_16-31_0_0 1.1309 52 48,717 2,516 27.3_OTB_CRU_32-69_0_0 1.7160 72 30,967 2,217 27.4_OTB_CRU_80-99_0_0 2.1515 48 26,386 1,268 27.4_OTB_DEF_70-99_0_0 1.8936 69 6,177 425 27.4_OTB_CRU_70-99_0_0 1.6195 68 6,160 417 27.4_OTB_CRU_32-69_0_0 2.2939 57 3,741 213 27.3_OTB_DEF_90-119_0_0 0.8389 29 9,208 264 0% 100% 90% 80% 70% 60% 50% 40% 30% 20% 10% MS 0% 50% 100% % Fuel change (50%) % Fuel change (100%) CO2eq_tonnes if 0% CO2eq_tonnes if 100% Segment Litre per kg of catch Tonnes of CO2eq emitted kg per hour Hours at sea
Table B.3. Potential savings of CO2 emissions induced by the effort re-allocation to passive gears among the Danish fleet.
References in Appendix B:
Hornborg, S., Bastardie, F., Eigaard, O. R., & Ziegler, F. (2022). Greenhouse gas emissions of seafood from Danish capture fisheries in the Skagerrak, Kattegat, and western Baltic. RISE Research Institutes of Sweden AB. RISE Report No. 2022:40. https://orbit.dtu.dk/en/publications/greenhouse-gasemissions-of-seafood-from-danish-capture-fisheries
Bastardie, F., Feary, D.A., Brunel, T., Kell, L.T., Döring, R., Metz, S., Eigaard, O.R., Basurko, O., Bartolino, V., Bentley, J., Berges, B., Bossier, S., Brooks, M., Caballero, A., Citores, L., Daskalov, G., Depestele, J., Gabiña, G., Aranda, M., & Vlasselaer, J. (2022). Ten lessons on the resilience of the EU common fisheries policy towards climate change and fuel efficiency - A call for adaptive, flexible, and well-informed fisheries management. Frontiers in Marine Science, 9. [947150]. https://doi.org/10.3389/fmars.2022.947150
Winther, U., Hognes, E. S., Jafarzadeh, S., & Ziegler, F. (2020). Greenhouse gas emissions of Norwegian seafood products in 2017. SINTEF Ocean Hornborg, S., Bastardie, F., Eigaard, O. R., & Ziegler, F. (2022). Greenhouse gas emissions of seafood from Danish capture fisheries in the Skagerrak, Kattegat, and western Baltic. RISE Research Institutes of Sweden AB. RISE Report No. 2022:40. https://orbit.dtu.dk/en/publications/greenhouse-gasemissions-of-seafood-from-danish-capture-fisheries
Nielsen, J.R., Vastenhoud, B.M.J., Bossier, S., Møhlenberg, F., Christensen, A., Diekman, R., et al. Dinesen, G.E., Eigaard, O.R., Gogina, M., Zettler, M.L., Darr, A., & Bastardie, F. (2023). Impacts of habitat-specific benthic fishing compared to those of short-term induced variability by environmental drivers in a turbulent Baltic Sea environment. Fisheries Research, 257, p.106514. https://doi.org/10.1016/j.fishres.2022.106514
European Parliament. (2014). The conflict between static gear and mobile gear in inshore fisheries. Study for the European Parliament. Policy Department B: Structural and cohesion policies. Fisheries. IP/ B/ PECH/IC/2014-018. https://www.europarl.europa.eu/RegData/etudes/ STUD/2014/529070/IPOL_STU(2014)529070_EN.pdf
Bloom Association. (2022, September 3). Scientists call for the prohibition of all destructive fishing methods and industrial activities in Marine Protected Areas [Press release]. https://www.bloomassociation.org/en/200-scientists-callban-bottomtrawling-mpas/
Eigaard, O.R. (Ed.), Bastardie, F., Bromhall, K., Brooks, M.E., Gislason, H., McLaverty, C., Noack, T., Olesen, J., O'Neill, F.G., Reijden, K.J.V.D., Saurel, C., Wilms, T.J.G., & Dinesen, G.E. (2022). Sandbanks and fisheries effects in relation to EU’s fishery and environmental policy. DTU Aqua. DTU Aqua Report No. 409-2022.
Bastardie, F., Feary, D.A., Brunel, T., Kell, L.T., Döring, R., Metz, S., Eigaard, O.R., Basurko, O., Bartolino, V., Bentley, J., Berges, B., Bossier, S., Brooks, M., Caballero, A., Citores, L., Daskalov, G., Depestele, J., Gabiña, G., Aranda, M., & Vlasselaer, J. (2022). Ten lessons on the resilience of the EU common fisheries policy towards climate change and fuel efficiency - A call for adaptive, flexible, and well-informed fisheries management. Frontiers in Marine Science, 9 [947150]. https://doi.org/10.3389/fmars.2022.947150
69
27.3_SDN_DEF_>=120_0_0 0.1458 207 10,520 2,182 27.3_SDN_DEF_90-119_0_0 0.1507 133 11,348 1,509 27.4_SDN_DEF_>=120_0_0 0.2536 99 14,092 1,398 27.4_GNS_DEF_120-219_0_0 0.4075 19 48,614 945 27.3_GNS_DEF_120-219_0_0 0.3525 7 31,836 236 27.4_GNS_DEF_>=220_0_0 1.1640 13 7,855 104 27.4_GNS_DEF_100-119_0_0 1.2356 9 8,905 79 27.4_GNS_DEF_90-99_0_0 1.3622 9 7,761 69 27.3_GNS_DEF_110-156_0_0 0.2016 33 35,501 1,186 27.4_GNS_DEF_110-156_0_0 0.2456 27 26,256 710 27.3_GNS_DEF_120-219_0_0 0.1949 33 19,454 645 27.3_GNS_DEF_>=157_0_0 0.1710 40 12,217 490 27.4_GNS_DEF_120-219_0_0 0.2373 28 10,081 280 27.4_GNS_DEF_>=157_0_0 0.2158 32 8,302 264 27.3_LLS_DEF_0_0_0 0.0967 32 7,487 241 27.4_FPN_CAT_>0_0_0 0.1067 26 3,717 95 27.3_LHP_FIF_0_0_0 0.2994 22 2,171 48 27.3_LLD_ANA_0_0_0 1.1587 7 6,734 48 27.4_GNS_CRU_>0_0_0 1.3609 6 2,063 12 Segment Litre per kg of catch Tonnes of CO2eq emitted kg per hour Hours at sea
Table B.5. 2005-2019 average of fuel use intensity and annual CO2 emissions on EU DCF receivers’ fleets in North Sea and Baltic Sea. Area coding is 27.4: North Sea; 27.3: Baltic Sea.
222 221 225 226 227 228 229 223 224
Appendix C
Switching of fishing techniques in the case of the Italian fleet
Among Italian trawl fisheries, the most-energyintensive fishery is the bottom otter trawl targeting shrimp in the Strait of Sicily with ca. 11.4 litres of fuel per kilo caught fish, i.e., 11,400 litres of fuel per tonne of landed fish.231 The present study has tested the effect of switching toward less fuel-intense demersal trawling based on an Italian dataset available in Sala et al. (2022) on mobile gears used by Italian fleets. Especially the effect of re-allocating to demersal mixed fisheries (Table C.1.) is tested from both the trawl fishery for shrimps and the Rapido trawl fishery for the common sole (Solea solea) in the northern Adriatic. The Rapido trawl fishery for sole and murex in central Adriatic has been left unaffected because being the least fuel intense because of the valuable bycatch on the purple dye murex (Bolinus brandaris).
The re-allocation is irrespective of the vessel size, as it was found that the difference between the size segments in terms of fuel use per unit landing is tiny. 232 The difference in fishing techniques and the areas trawled associated with different fishing opportunities explain a large part of the differences in fuel use intensity, not the vessel size.
The present study has not tested the effect of switching toward midwater trawl because midwater pair trawlers target anchovies and sardines, which
is a different set of species assemblage than the one targeted by demersal trawlers. However, if a downscale of the demersal trawling is the chosen path, a reconversion toward targeting pelagic species is likely to decrease the overall fuel consumption in the Italian fishing fleet sector as using midwater trawl is the least energy-intense occupation (<0.5 litres per kg 233). Such a scenario might not appear realistic, given that pelagic species are priced less than any other species. It is also not sure that such stocks could support extra pressure created by any effort reallocation, if permitted.
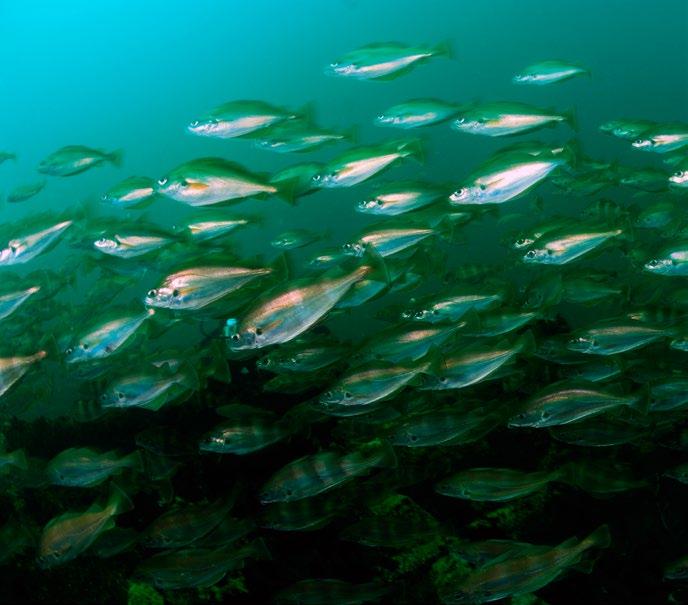
70 by 2050 A pathway to decarbonise the EU fisheries sector
0 2,000 4,000 6,000 8,000 Fuel consumption (thousands litres) % reallocation from fuel intense gears Fuel use
0 25 50 75 100
Figure C.1. Thousand litres along with a percentage re-allocation of fishing effort currently spent by the trawl for shrimp and North Adriatic Rapido trawl for sole to (purple) to the mixed demersal trawl fishery (green), while the central Adriatic fishery is untouched (yellow).
- Italian
fleet
© OCEANA / Juan Cuetos
230
231
232
The results of this study indicate that 12% fuel savings may be achieved by re-allocating the fishing effort toward the least fuel intense trawl fishery. This would consist in phasing out the trawl fishery for shrimp as well as the use of the Rapido trawl to target sole in the northern Adriatic Sea.
In the Mediterranean, measures are needed to reduce the most fuel-intensive fisheries. The globally averaged FUI of all fisheries was estimated at 710 litres of fuel per tonne of landed fish, which is still less than the Italian fisheries and trawl fisheries in other Mediterranean countries.
References in Appendix C:
Sala, A., Damalas, D., Labanchi, L., Martinsohn, J., Moro, F., Sabatella, R., & Notti, E. (2022). Energy audit and carbon footprint in trawl fisheries. Scientific Data, 9(1). https://doi.org/10.1038/s41597-022-01478-0
Sala, A., Notti, E., Martinsohn, J., & Damalas, D. (2012). Information Collection in Energy Efficiency for Fisheries. ICEEF2011 Final report. JRC Scientific and Policy Reports. European Union. https://stecf.jrc.ec.europa.eu/c/document_library/get_file?uuid=1f6e7308-5212-46d9-85ed-3d1da4cb6569&groupId=12762
Sala, A., Damalas, D., Labanchi, L., Martinsohn, J., Moro, F., Sabatella, R., & Notti, E. (2022). Energy audit and carbon footprint in trawl fisheries. Scientific Data, 9(1). https://doi.org/10.1038/s41597-022-01478-0
71
Table C.1. Thousand litres and a percentage re-allocation of fishing effort currently spent by the trawl for shrimp and Rapido trawl for sole to the mixed demersal fishery.
Table C.2. 2008-2019 average fuel use intensity and kg fish landed of the Italian mixed demersal trawl receiver fleet segments in the re-allocation scenario.
Italian Fleet 7,694 7,248 6,800 -5.8 -11.6 20,312 17,952
Table C.3. 2008-2019 average fuel use intensity and kg fish landed of the Italian donor fleet segments in the re-allocation scenario.
Table C.4. Expected fuel reduction and CO2-eq emissions from a re-allocation scenario redirecting fishing effort from fuel-intense fleet segments to midwater trawl less fuel-intense segment.
Total 7,694 7,605 7,516 7,425 7,336 7,248 7,158 7,069 6,979 6,889 6,800 Shrimp, or North Adriatic Rapido trawls (donors) 2,701 2,431 2,161 1,890 1,620 1,351 1,081 811 540 270 0 Mixed demersal trawls (receivers) 3,212 3,393 3,574 3,754 3,935 4,116 4,296 4,477 4,658 4,838 5,019 Central Rapido trawls (unaffected) 1,781 1,781 1,781 1,781 1,781 1,781 1,781 1,781 1,781 1,781 1,781 0% 100% 90% 80% 70% 60% 50% 40% 30% 20% 10% Mixed demersal trawls 4.243 11 67,580 757 litre per kg of catch kg per hour Hours at sea Tonnes of landed fish MS 0% 50% 100% % Fuel change (50%) % Fuel change (100%) CO2eq_tonnes if 0% CO2eq_tonnes if 100% Shrimp trawl 11.379 6 21,122 136 Rapido trawl North Adriatic 5.418 13 16,895 213 litre per kg of catch kg per hour Hours at sea Tonnes of landed fish
Appendix D
Mapping the seabed, biogenic habitats and carbon-rich habitats, and estimating the disturbance from fishing activities
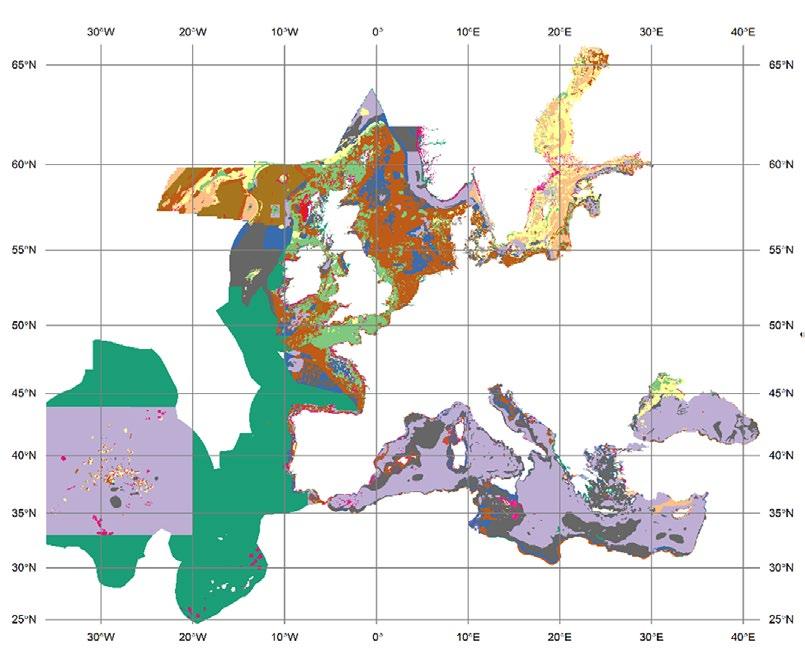
Marine sediments represent an enormous carbon sink, storing more carbon than terrestrial soils.234 Such storage is specific to the sediment type and mapping seabeds can help deduce the overall carbon stock retained in marine habitats. There are several seabed mapping and classification databases, but the one now widely used in Europe is collated by the EMODnet platform.235 This report used the EUNIS classification for marine habitats available at a coarse level (Figures D.1. and D.2.), or at a finer classification resolution (Figure D.3.).
Managers and policymakers could have the option of protecting disproportionally important habitats as an alternative to banning bottom-contacting gears or complementary to it (if only a partial ban or fish or effort quota reduction allocated to bottom trawling is implemented). An assessment of the relative contribution of such mitigation pathways (i.e., a ban and/or a displacement) in reducing carbon release to the atmosphere could be carried out, albeit carbon release rates from the seabed and how they scale relative to other emissions are much less certain because this is still under-studied.
Coarse substrate
Fine mud
Fine mud or Sandy mud or Muddy sand
Mixed sediment
Muddy sand
Rock or other hard substrata
Sand
Sandy mud
Seabed [Lophelia pertusa] reefs [Posidonia oceanica] meadows
Coarse & mixed sediment
Coralligenous platforms
Dead mattes of [Posidonia oceanica]
Sandy mud or Muddy sand [Modiolus modiolus] beds [Mytilus edulis] beds [Sabellaria alveolata] reefs [Sabellaria spinulosa] reefs
Biogenic substrate
Mussel beds
Sediment
Worm reefs [Limaria hians] beds
Bivalve reefs [Ostrea edulis] beds
72 by 2050 A pathway to decarbonise the EU fisheries sector
Figure D.1. Substrate2011. Seabed Habitat classification (source: EMODnet broad-scale seabed habitat map for Europe Substrate2011 retrieved at https://www.emodnet-seabedhabitats.eu/access-data/download-data Classified habitat descriptors → Substrate type). For this study, the area extent is clipped on the area defining the MSFD areas. Mercator projection.
Abyssal seabeds
Circalittoral seabed
Infralittoral seabed
MB1: Infralittoral rock
MB2: Infralittoral biogenic habitat
MB3: Infralittoral coarse sediment
MB5 or MB6: infralittoral sand or infralittoral mud
MB5: Infralittoral sand
MB6: Infralittoral mud
MC1: Circalittoral rock
MC2: Circalittoral biogenic habitat
MC3 or MC6: Circalittoral coarse sediment or Circalittoral mud
MC3: Circalittoral coarse sediment
MC4: Circalittoral mixed sediment
MC5: Circalittoral sand
MC6: Circalittoral mud
MD1: Offshore circalittoral rock
MD3: Offshore circalittoral coarse sediment
MD4: Offshore circalittoral mixed sediment
MD5 or MD6: Offshore circalittoral sand or Offshore circalittoral mud
[Limaria hians] beds
[Lophelia pertusa] reefs
[Modiolus modiolus] beds
[Mytilus edulis] beds
[Ostrea edulis] beds
[Posidonia oceanica] meadows
[Sabellaria alveolata] reefs
[Sabellaria spinulosa] reefs
Biogenic substrate
Bivalve reefs
Coarse & mixed sediment
Coarse substrate
Coralligenous platforms
Dead mattes of [Posidonia oceanica]
Fine mud
Fine mud or Sandy mud or Muddy sand
Mixed sediment
Muddy sands
Mussel beds
Rock or other hard substrata
Sand
Sandy mud
Sandy mud or Muddy sand
Seabed
Sediment
Worm reefs
MD5: Offshore circalittoral sand
MD6: Offshore circalittoral mud
ME1 or MF1: Upper bathyal rock or Lower bathyal rock
ME3 or MF3: Upper bathyal coarse sediment or Lower bathyal coarse sediment
ME4 or MF4: Upper bathyal mixed sediment or Lower bathyal mixed sediment
ME5 or MF5: Upper bathyal sand or Lower bathyal sand
ME6 or MF6 or ME5 or MF5: Upper bathyal mud or Lower bathyal mud or Upper bathyal sand or Lower bathyal sand
ME6 or MF6: Upper bathyal mud or Lower bathyal mud
MG1: Abyssal rock
MG3: Abyssal coarse sediment
MG5: Abyssal sand
MG6: Abyssal mud
Offshore circalittoral seabed
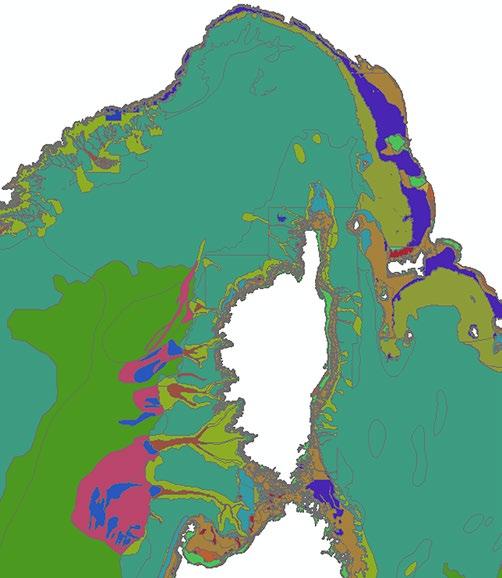
Upper bathyal seabed or Lower bathyal seabed
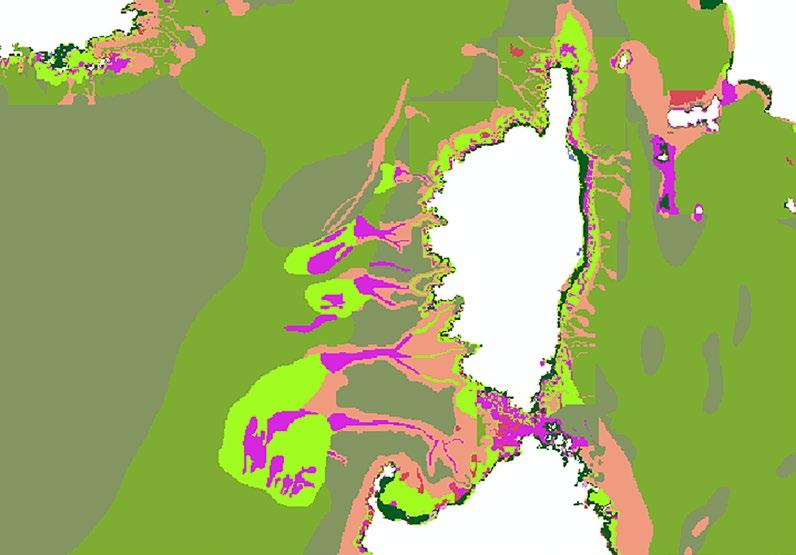
73
Figure D.2. Zoom-in on seabed Habitat classification around Corsica (same source as shown in the previous figure). Posidonia areas appear in dark green on the map.
Figure D.3. Zoom-in on seabed Habitat classification around Corsica (with a finer classification based on EUNIS EUSeaMap 2019 – All2019DL2). Posidonia areas appear in dark green on the map. Now with EUNIS 2019 code, Level2. (See explanation in Vasquez et al. 2021)
There are several levels of refinements in the seabed habitat classification. As stated online: “EUSeaMap is classified into EUNIS 2019 level 3 (or more detailed levels where appropriate), EUNIS 2019 level 2, EUNIS 2007-2011, the MSFD benthic broad habitat types, the HELCOM HUB classification in the Baltic, and the recently revised habitat classification in
MSFD_BBHT
the Mediterranean. In the Black Sea, EUSeaMap is not classified into EUNIS 2007-2011 (due to inapplicability) but according to a classification that was developed by EMODnet Seabed Habitats.” 236,237,238
Coding for these habitat layers is described in Vasquez et al . (2021):
Habitat description using the MSFD Benthic Broad Habitat types (as defined in COMMISION DECISION (EU) 2017/848.)
Na where the classification is not applicable.
Habitat description using EUNIS 2019 code (e.g. ‘MB23’). Na where EUNIS 2019 is not applicable.
Habitat description using EUNIS 2019 full description (e.g. ‘MB23: Baltic infralittoral biogenic habitat’). Na where EUNIS 2019 is not applicable.
Habitat description using EUNIS 2019 full description (e.g. ‘MB23: Baltic infralittoral biogenic habitat’) where EUNIS 2019 is applicable, or other unpublished classification (e.g. ‘Baltic infralittoral seabed’) where EUNIS 2019 is not applicable.
Habitat description using EUNIS 2019 description at level 2 (e.g. ‘MB5: Infralittoral sand’), or other unpublished classification (e.g. ‘Infralittoral seabed’) where EUNIS 2019 is not applicable.
The EUNIS habitat classification is a comprehensive, pan-European system for habitat identification. The classification is hierarchical and covers all habitats, from natural to artificial, terrestrial to freshwater and marine. The habitat types are identified by specific codes, names and descriptions and come with crosswalks to other habitat typologies.
On the European Environment Agency (EEA) website, it reads “ The review of the marine component of the EUNIS habitat classification was initiated in 2014. Marine benthic habitats, marine pelagic and marine ice-associated habitats are separated into three distinct groups, each with a separate classification structure. The first major division in the benthic marine part of the EUNIS classification is based on major biological zones (related to depth) and substrate type. Level 3 of the classification reflects the main biogeographical regions of Europe’s seas based on their distinct combinations of salinity and temperature regimes (Arctic, Baltic, Atlantic, Mediterranean and
Black Sea). A first review was published in 2019, and an update to this version concerning mostly the Atlantic regional sea is available since March 2022. Crosswalks to Habitats Directive Annex I and to European Red List of Habitats are available while crosswalks to EUNIS marine habitats of version 2012 for the regional seas apart from the Atlantic need to be revisited .” 239
In European waters, there are marine habitats known to be carbon-rich. 240 In the Mediterranean, it is Posidonia oceanica , the most important and abundant seagrass of the Mediterranean Sea, 241,242 forms extensive meadows that border most Mediterranean coasts. 243
74 by 2050 A
pathway to decarbonise the EU fisheries sector
EUNIS2019C EUNIS2019D All2019D All2019DL2
Table D.1. A compilation of carbon stocks per type of habitat extracted from https://www.eea.europa.eu/data-and-maps/data/ carbon-storage-in-global-terrestrial (Prod-ID: DAT-274-en Published 27 Apr 2022). This results from a quick literature scan regarding carbon stocks and carbon sequestration rates in marine ecosystems. Based on this information, supplemented with expert knowledge, a list has been drawn up for EEA in which the EUNIS habitat types are classified based on their total carbon stock and carbon sequestration rate. This list is an annexe in the report that documents the project “Framework service contract EEA/NSS/17/002/Lot 1 - services EEA10 –Task III.”
*1=<10Mg C ha-1, 2=10-50Mg C ha-1, 3=50-100Mg C ha-1, 4=100-150Mg C ha-1, 5=>150Mg C ha-1,? = no or little data;
**1=negligible, 2: <0.01Mg C ha-1 yr-1, 3=0.01-0.5Mg C ha-1 yr-1, 4=0.5-1.0Mg C ha-1 yr-1, 5=>1.0Mg C ha-1 yr-1, ? = no or little data.
The majority in the underlying sediment, although some storage is in roots and rhizomes. Significant differences depend on the species with the highest values in P.oceanica. Carbon storage ability can also increase with sediment depth.
Temporary storage in living material. Exported (offshore and beach cast) and can be sequestered in deep-sea surficial sediments.
Temporary storage in living material, exported to shelf sediments.
Longer-term store for organic and inorganic carbon. Rates vary between species. E.g., P.calcareum sequesters approx. one fifth less than L.glaciale.
(continued on next page)
75 Carbon stocks (Mg C ha-1) Carbon sequestration rate (Mg C ha-1 yr-1) Carbon stock class (Mg C ha-1)* Carbon sequestration rate class (Mg C ha-1 yr-1)** Habitat type Code 2019 EUNIS MARINE LEVEL Notes 4 MA332, MB532, MB547, MB548, MB553, MB554, MB652, MA522, MA623, MB522, MA623, MB522 Seagrass beds 20-50 0.83 2 4
4 MA123, MA124, MA126, MB121 Kelp forest 5.0-9.0 1 1
4 MA123, MA124, MA126 Intertidal macroalgae 5 1 1
4 MB322, MB421, MB622 Maerl beds 620 > 1 5 5
4 ME112, MC222, MD221,ME123, ME221, ME322, ME151, MF151 Lophelia reefs 100 0.35 4 3 4 MB222 Flame shell beds 0.6-0.7 1 1 4 MC128 Horse mussel beds 40 0.4 2 3 Beds
deep.
assumed to be 75cm
It might be possible to associate a carbon content and a carbon sequestration rate with each of the habitats described in these geospatial habitat type data. However, this approach would be quite qualitative at this stage, given the large ranges of carbon content found in each category collected here (Table D.1.).
Another approach adopted in this present study is to use modelled data from a global mapping exercise of the carbon stored in the seabed. These maps were obtained by machine learning (Random Forest Regressions), as described in Atwood et al. (2020). In this study, the
Shellfish beds often considered being a source of atmospheric CO2 due to the calcification process during shell formation. Source or sinks depends on the relative balance between organic and inorganic carbon burial.
Shallow subtidal reefs dominated by organic-carbon-rich sediments and functioned as net carbon sinks.
Reefs composed of masses of aggregated tubes very localised phenomenon. Calcareous tubes (occupied or relict) are a potential blue carbon sink.
Based on O.fragilis bed in Dover strait. After death brittlestar skeletons and calcareous plates incorporated into the bottom sediments.
Higher levels in sediments with higher mud fractions. Based on accretion rate of 2mm/yr.
Surficial sediments, and particularly deep-sea sediments, are the primary marine store of biologically-derived carbon. Higher levels in sediments with higher mud fractions. Based on 0.1mm accretion per year.
global map is cropped to match the EU MSFD area (Figure D.4). Random Forest Regressions in Atwood et al (2020) were based on the compiled carbon C data and 12 predictor variables i.e. the mean annual temperature of nearest land point, mean annual precipitation of nearest land point, the maximum annual temperature of nearest land point, the minimum annual temperature of nearest land point, ocean mean annual sea surface temperatures, ocean chlorophyll a concentration, elevation and bathymetry, sea surface height anomaly, sea surface salinity, distance from land, and distance from rivers.244
76 by 2050 A pathway to decarbonise the EU fisheries sector 4 MA122, MA124, MA227, MB126, MC128, MB231, MC231, MD631, MB143, MB144, MB148, MB149, MB242, MC241, MA154 Blue mussel beds 0.15 0.01-0.4 1 3
2 MB222, MB243 Subtidal oyster beds 1.3 0.01 1 3
4 MB221, MC221 Tubeworm (Serpulid reefs) 7.81 1 1
4 MC421 Brittlestar beds 0.66 0.82 1 4
Faunal turfs 0.14 1 1 2 MA3, MA4, MA5, MA6 Intertidal sediments 0.5 to 20 0.11-0.37 2 3
2 MB3, MB4, MB5, MB6, MC3, MC4, MC5, MC6 Subtidal sediments <10 0.0030.009 1 2
(continued from previous page)
Carbon stocks (Mg C ha-1) Carbon sequestration rate (Mg C ha-1 yr-1) Carbon stock class (Mg C ha-1)* Carbon sequestration rate class (Mg C ha-1 yr-1)** Habitat type Code 2019 EUNIS MARINE LEVEL Notes
Blue carbon
As shown in Figure (D.4), the Mediterranean is a hotspot of seagrass carbon sequestration, given the specific capacity of Posidonia oceanica to support large stocks.245 Similarly, the Black Sea and the Baltic Sea are hotspots of carbon sequestration in the Baltic Sea because of the hosting of eelgrass in coastal areas and because of non-oxygenated areas where the carbon is being trapped because not degraded further whenever the microbial loop is inhibited.
This report investigated the conservation areas using Natura 2000 and the European inventory of nationally designated areas (CDDA) shapefiles in the MSFD areas to overlay carbon stock and fishing pressure. Such an overlay enables a tabulation of carbon storage inside or outside the designated areas. Many of these areas have no management plan enforced yet or with varying levels of implementation,246 which regularly leads environmental non-governmental organisations to call them “paper parks”. Therefore, some or most of these areas are still visited by fishing vessels. We can retrieve some information about which areas are visited and which are not by crossing with the fishing activities data (see Section 1.2), provided the spatial resolution is refined enough. One uncertainty is that the degree of implementation of the monitoring plan associated with each of these areas is currently unknown and likely requires contacting each (MSFD) national correspondent to figure it out. Therefore hereafter, what is measured is the effect of excluding all fishing activities from these designated conservation areas, which would give the extreme boundary of such an excluding measure on the avoidance of carbon stock disturbance.
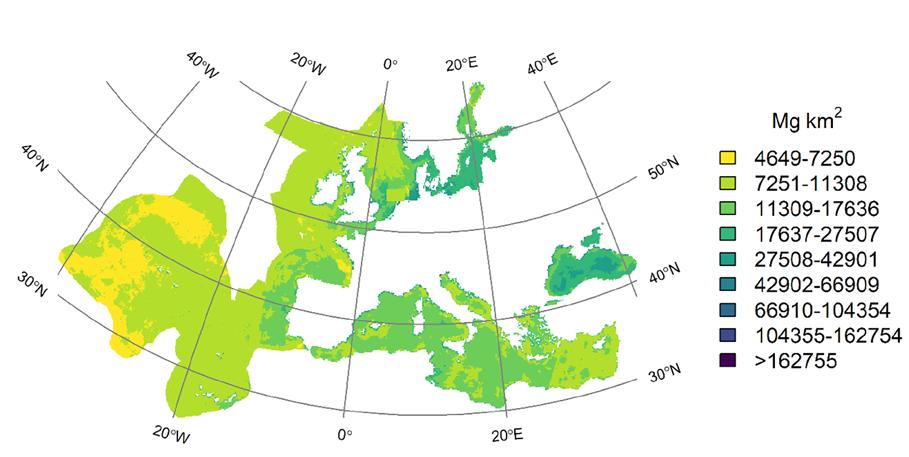
Unfortunately, there are also conservation areas prohibited from trawling that are not complied with. The Med Sea Alliance, a diverse coalition of NGOs, provide pieces of evidence with an atlas which maps areas permanently closed to bottom trawling across the Mediterranean and investigates illegal trawling in these areas.247
The geographical layers used in the present study are:
• the Natura 2000 dataset248
• the European inventory of nationally designated areas (CDDA)249
The European inventory of nationally designated protected areas holds information about designated areas and their designation types, which directly or indirectly create protected areas. This is version 20 and covers data reported until May 2022. The dataset contains data on individual nationally Designated Areas and corresponding Protected Site spatial features in EEA member and collaborating countries (Figure D.5.).
77
Figure D.4. Mapping the average carbon stock stored in the top 1m of the seabed (cropped and re-projected to the EU Waters MSFD areas based on the estimation of Atwood et al. 2020). The unit Mg km-2 equals 1g per m2, and 1Mg is 1tonne. (Unexpectedly, we had to correct manually for lack of estimation in two boxes in the southern North Sea).
Blue carbon
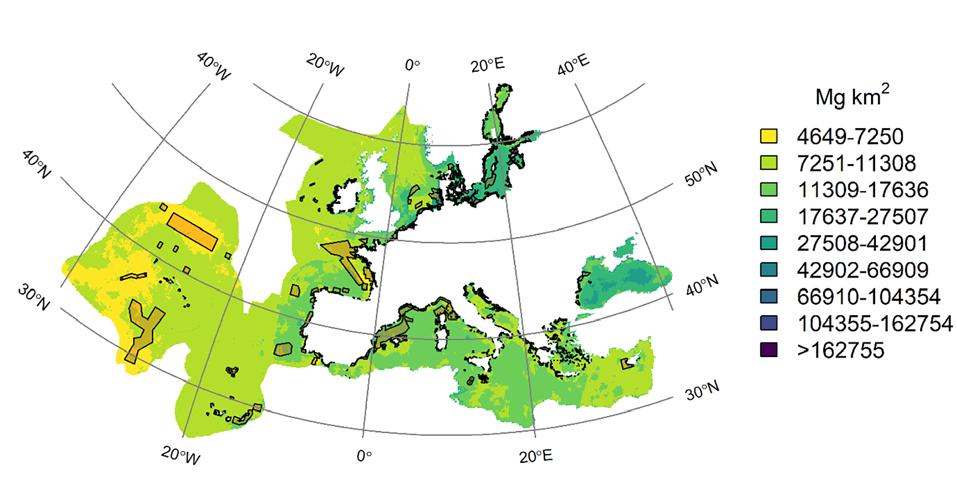
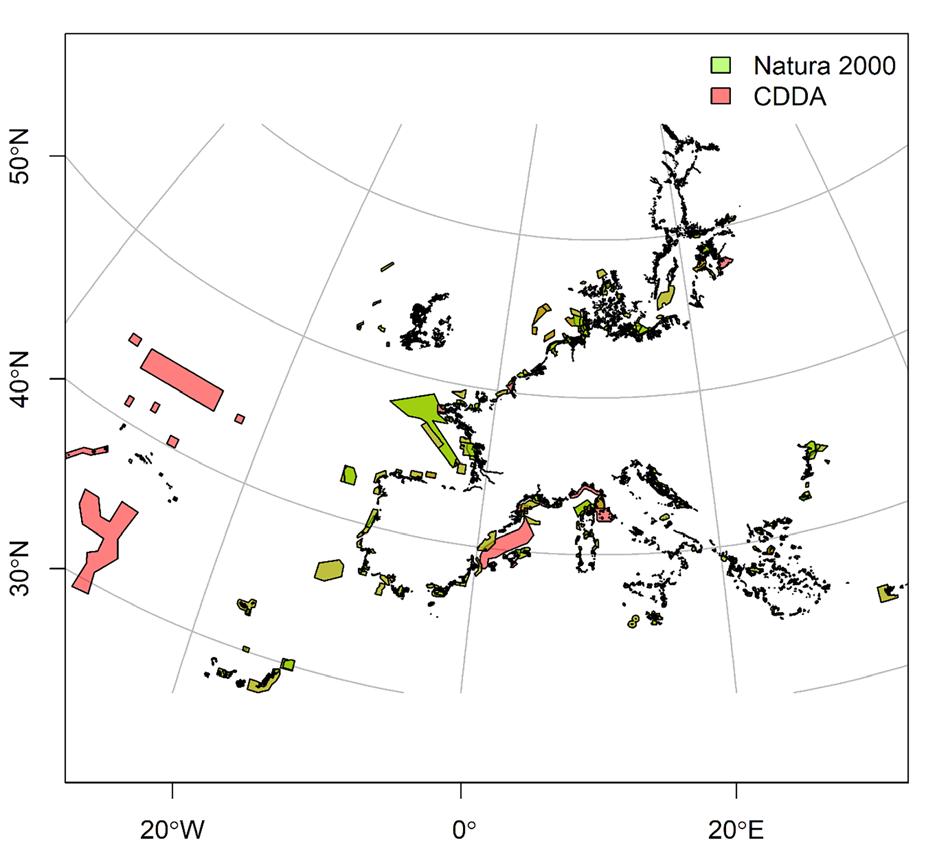
78 by 2050 A pathway to decarbonise the EU fisheries sector
Figure D.5. Nationally designated conservation areas in the EU MSFD areas, merging and dissolving two different datasets, i.e., Natura 2000 sites and CDDA sites. Overlapping areas appear as a mixture of colours.
Figure D.6. Estimated blue carbon stock (re-calculated from Atwood et al. [2020]) and known conservation areas designated inside the EU MSFD areas.
From the present calculation it is found that the g of C per m2 is higher both in the Baltic and Black seas (Figure D.6., D.7. and Table D.2.). Across all regions, the currently designated conservation areas are not protecting blue carbon habitats, because their surface area is approx. to the proportional carbon stock (Figure D.7.). On the contrary, in the Baltic Sea, it is found that the percentage of carbon stock lying outside conservation areas is disproportionally slightly higher than within these zones. This criterion has likely not been used to designate these areas.
Fishing pressure can be deduced by mapping fishing activity at sea obtained from satellite data. There are two types of satellite data tracking fishing vessel activities: AIS (Automatic Identification Signal) data and VMS (Vessel Monitoring System) data. Since 2012, VMS is a mandatory device that each fishing vessel larger than 12m must carry onboard in EU Waters and
collect the vessel’s position data at least every two hours. AIS data has the potential to provide more finely resolved data (every second) but has a lower coverage because it is not mandatory to carry transmitters (if the vessel is below 15m in length), and these transmitters can be switched off to avoid sharing fishing locations250 or locations in risky areas. VMS data are reliable data sources but economically and legally sensitive. These data are usually kept confidential and are not shared by national data owners apart from the ICES, which is the intergovernmental organization tasked to produce annual aggregation data for the Northeast Atlantic for scientific use.251 No VMS data from the Mediterranean are processed by ICES because they are out of the scope of the ICES duties. For this study, we used the AIS data analysed by the Global Fishing Watch (GFW) organisation,252,253,254 which is public data and will ensure equal treatment of data across regions. We then coupled the geospatial data stored by GFW
79
0 5 10 % 15
Table D.2. Carbon stock aggregated per region inside MPAs compared to overall stock in the region. Aggregate in MSFD areas from mean carbon stock estimates given by Atwood et al. (2020).
Baltic Sea Black Sea Med. Sea North Atlantic
% total surface area of MPAs in the region % of total regional carbon stock in MPAs
Figure D.7. Percentage of carbon stock lying in the designated MPAs per region compared to % surface area represented by MPAs in each region.
Baltic Sea 853,239 14,834 13,762 5,639,181 17.7 15.1 Black Sea 122,949 15,988 14,716 6,793,277 1.9 1.8 Med. Sea 1,571,577 9,927 9,021 28,655,140 5.6 5.5 Atlantic 3,258,790 6,698 7,312 72,087,261 5.2 4.5 Region Sum carbon stock in MPAs (thousand tonnes) Mean carbon stock in MPAs (g per m2) Mean carbon stock (g per m2) Overall carbon stock (thousand tonnes) % MPAs surface % carbon in MPAs
with the EU Fleet Register 255 to make sure to identify fishing vessels, the main activity of each vessel tracked, and only keep the vessel using bottomcontacting gears. The number of vessels kept in the analysis is shown in Table D.3 (below). Note that the EU Fleet Register does not include the U.K. (since the withdrawal of the UK from the EU on 31 January 2020), Norway or south Mediterranean countries, which makes the mapping of the fishing activity in MSFD areas imperfect.
Bottom trawling impacts seabed habitats and disturbs the bio-geochemical processes by mixing and mobilizing fine sediment. It is suspected that this impact might worsen by several orders of magnitude the direct emission issued from bottom trawling, because the re-mobilisation of sediments could also release the carbon already stored and sequestered into the seabed.
Previous studies in the North Sea showed that small vessels (<221 kW) typically mobilize between 4.2 to 4.6 kg per m 2 of swept area 256 and between 7-9.4 kg per m 2 for beam trawl with tickler chains for larger vessels. The differences among fishing gears come from differences in penetration depth, the type of areas visited, along with a difference in the silt fraction of the sediments resuspended. 257
Here we estimated the swept volume of sediment disturbed and then the carbon released into the water column by the fishing vessels belonging to the EU fleet and using bottom-contacting gears using different data sources accompanied by some expert knowledge assumptions: 258
• The swept area per hour fished for a given fishing hour vessel record in the 2020 GFW data depends on the gear used (retrieved from the EU Fleet Register), the gear width of the towed gear and the vessel speed (assumed to be 4 knots), while the gear width depends on the vessel main engine power or the vessel length with the relationships defined in Eigaard et al. (2016).
• The swept volume by each vessel depends on the type of gear used and its penetration depth into the sediments profile (2.244cm on average259) and the proportion of its different subcomponents (trawl doors, footrope, bridle) penetrating the sediment defined in Eigaard et al. (2016).
• The carbon released and lost for the sediment is assumed to depend on the fraction of labile carbon disturbed that will not settle back, depending on the fraction of labile C in sediment specific to the dominant sediment type in a grid cell (0.7 for fine sediments; 0.286 for coarse sediments; 0.04 for other sandy sediments260), and an annual decay rate k, which is the degradation rate constant (for the Mediterranean is 12.3 yr-1 or 1.0 yr-1 in Atlantic261).
• The CO2 emissions released from the activity of EU vessels using bottom-contacting gears are assumed to be equal to the sum over all fished area cells of the swept volume of carbon loss time, a conversion factor of 3.67 gC02 per g of C.
On the methodological side, to obtain these estimates, there are many limitations to the current approach. For example, such limitations are discussed in Black et al (2022). These authors “have chosen not to estimate the efflux of CO2 from the seabed arising from benthic disturbance because of the assumptions required to make this type of calculation and the misleading outputs that can arise. Cross-comparisons of this type of calculation with in-situ data are difficult due to the lack of studies investigating the post-disturbance effects of trawling on benthic CO2 efflux and nutrient efflux within the UK EEZ, or elsewhere.” In addition to this, these authors recall that the biological dynamics that occur on the seabed is being ignored by the current version of the approach, “which can result in increased primary productivity, indirectly resulting in increased OM and OC supply to the sediments (...) Equally, these models do not account for the removal of benthic fauna during a trawling event.”262
These authors, as also argued by Hiddink et al. (2021), recall the challenge “to estimate the accumulation of multiple years of fishing impact on sedimentary OC stores (…) due to a lack of information about sediment accumulation rates and OC sequestration rates”. Large assumptions would have to be made with this type of calculation. For example, based on current data, we would have to assume that there was a single accumulation rate throughout the UK EEZ and that OC is lost from the sediments at the same rate annually. However, we know this is not the case, especially within coastal fjord environments where accumulation is reported to be high263,264 in comparison to the low accumulation rate reported within the North Sea. 265-269” However, “Recent research has allowed for the sediment accumulation rate to be modelled within the Greater North Sea region, highlighting that these types of predictive models are possible”.270
80 by 2050 A pathway to decarbonise the EU fisheries sector
Table D.3. Indicators of data coverage for data extracted from the EU Fleet Register. The EU Fleet Register is a database where all the fishing vessels flying the flag of an EU country must be registered. Any changes in the status of a fishing vessel, for example, if it has been scrapped, need to be registered by the member country in the Fleet Register. Source: calculated from extracted data on https://webgate.ec.europa.eu/fleet-europa/index_en. Bottom-contacting gears are defined according to the main gear declared in the register based on the International Standard Statistical Classification of Fishing Gear (ISSCFG, 1980). *However, we cannot ensure the AIS signal is covering the entire activity of each vessel; **This may be used to raise the estimates of swept volume.
AIS signals and an informed
Subsurface Swept Area
Figure D.8. The estimated swept area of sediments disturbed in 2020 by EU fleets using bottom-contacting gears within the MSFD areas. Norway and U.K. fleets are not included. Calculated from combining the GFW database and the EU Fleet Register. Data are gridded on grid cells of 0.5 degrees latitude and 1 degree longitude. Lambert projection. Only partial data in the Black Sea.
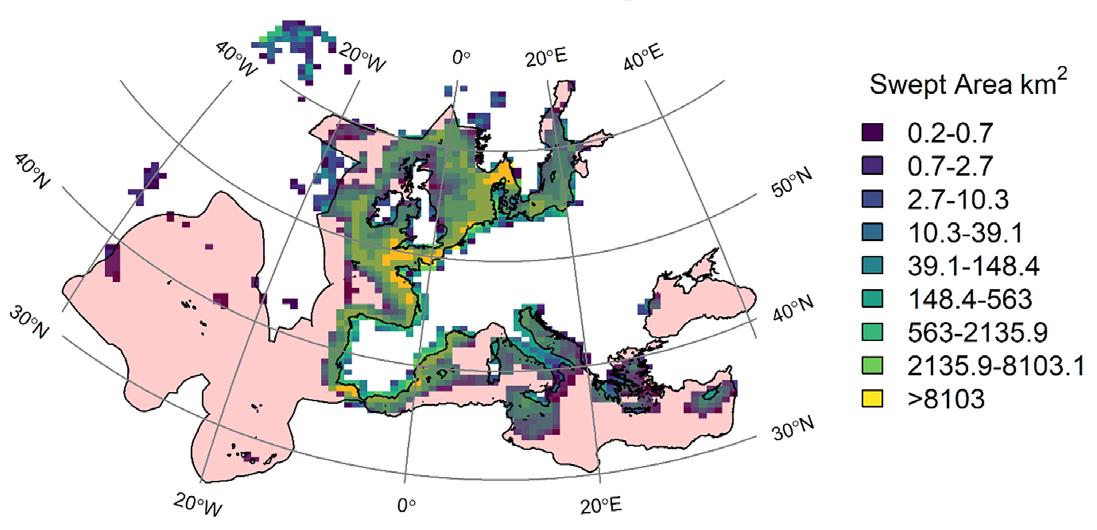
81
Indicators of data coverage All vessels’ EU immatriculation 156,190 No active vessels after 1st Jan 2020 65,994 No active vessels after 1st Jan 2020 with AIS signals 15,775 No active vessels after 1st Jan 2020 with AIS signals and an informed MMSI 14,694 No active vessels after 1st Jan 2020
MMSI and gear 14,694 No active vessels after 1st Jan 2020 with AIS signals and
MMSI, and a bottom-contacting gear as primary gear* 3,144 No active vessels after 1st Jan 2020 WITHOUT AIS signals but with a bottom contacting gear 1,493 Percent of summed main engine kW of missing vessels with a bottom contacting gear compared to the overall main engine of all vessels using bottom contacting gears** 18.3%
with
an informed
Subsurface Swept Area Ratio
Figure D.9. Estimated swept area ratio (SAR) in each grid cell in 2020 by EU fleets using bottom-contacting gears within the MSFD areas. Norway and U.K. fleets are not included. Calculated from combining the GFW database and the EU Fleet Register. Grid cells are 0.5-degrees latitude and 1-degree longitude—Lambert projection. Subsurface estimates only keep the part of the total swept area for which the gear is known to penetrate the sediments. A SAR of 1 means the entire grid cell has been swept at least once. These subsurface SAR estimates are notoriously lower than the surface SAR for which the entire gear width paths are accounted for. Only partial data in the Black Sea.
References in Appendix D:
Atwood, T.B., Witt, A., Mayorga, J., Hammill. E., & Sala, E. (2020). Global Patterns in Marine Sediment Carbon Stocks. Frontiers in Marine Science, 7 https://doi.org/10.3389/fmars.2020.00165
EMODnet. (2022). Spatial data downloads - EMODnet broad-scale seabed habitat map for Europe (EUSeaMap). Retrieved from: https://www.emodnet-seabedhabitats.eu/access-data/download-data
Populus, J., & Vasquez, M. (2017). EUSeaMap, a European broad-scale seabed habitat map. Ifremer Available from: http://archimer.ifremer.fr/doc/00388/49975/
Vasquez M., Allen, H., Manca E., Castle L., Lillis H., Agnesi S., Al H.Z., Annunziatellis, A., Askew, N., Bekkby, T., Bentes, L., Doncheva, V., Drakopoulou, V., Duncan, G,, Gonçalves, J., Inghilesi, R., Laamanen, L., Loukaidi, Valia, Martin Simon, McGrath Fergal, Mo Giulia, Monteiro Pedro, Muresan Mihaela, Nikilova Christina, O'Keeffe E., Pesch, R., Pinder, J., Populus, J., Ridgeway, A., Sakellariou, D., Teaca, A., Tempera, F., Todorova, V., Tunesi, L., Virtanen, E. et al. (2021). EUSeaMap 2021. A European broad-scale seabed habitat map. D1.13 EASME/EMFF/2018/1.3.1.8/Lot2/ SI2.810241– EMODnet Thematic Lot n° 2 – Seabed Habitats EUSeaMap 2021 - Technical Report. https://doi.org/10.13155/83528
ICES. (2023). EISeaMap 2021 Broad-Scale Predicive Habitat Map for Europe. Licensed under CC-BY 4.0 from the European Marine Observation and Data Network (EMODnet) Seabed Habitats initiative (www.emodnetseabedhabitats.eu), funded by the European Commission. http://gis.ices.dk/geonetwork/srv/eng/catalog.search#/ metadata/10d3d35c-8f8e-40ff-898f-32e0b037356c
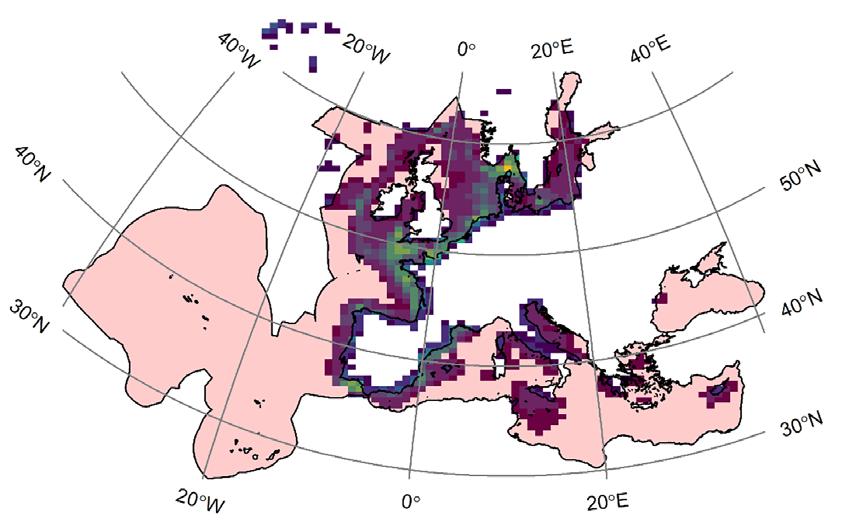
European Environment Agency. (2022). EUNIS marine habitat classification review 2022. https://www.eea.europa.eu/data-and-maps/data/eunishabitat-classification-1/eunis-marine-habitat-classification-review-2022
Kennedy, H., Pagès, J.F., Lagpean parliament.masino, D., Arias-Ortiz, A., Colarusso, P., Fourqurean, J. W., Githaiga, M.N., Howard, J.L., KrauseJensen, D., Kuwae, T., Lavery, P.S., Macreadie, P.I., Marbà, N., Masqué, P., Mazarrasa, I., Miyajima, T., Serrano, O., & Duarte, C.M. (2022). Species traits and geomorphic setting as drivers of global soil carbon stocks in seagrass meadows. Global Biogeochemical Cycles, 36(10). https://doi.org/10.1029/2022GB007481
Boudouresque, C. F., Pergent, G., Pergent-Martini, C., Ruitton, S., Thibaut, T., & Verlaque, M. (2016). The necromass of the Posidonia oceanica seagrass meadow: Fate, role, ecosystem services and vulnerability. Hydrobiologia, 781(1), 25–42. https://doi.org/10.1007/s10750-015-2333
Diesing, M., Thorsnes, T., & Bjarnadóttir, L. R. (2021). Organic carbon densities and accumulation rates in surface sediments of the North Sea and Skagerrak. Biogeosciences, 18(6), 2139–2160. https://doi.org/10.5194/ bg-18-2139-2021Vacchi, M., De Falco, G., Simeone, S., Montefalcone, M., Morri, C., Ferrari, M., & Bianchi, C.N. (2017) Biogeomorphology of the Mediterranean Posidonia oceanica seagrass meadows. Earth Surf. Process. Landforms, 42: 42– 54
Atwood, T.B., Witt, A., Mayorga, J., Hammill. E., & Sala, E. (2020). Global Patterns in Marine Sediment Carbon Stocks. Frontiers in Marine Science, 7 https://doi.org/10.3389/fmars.2020.00165 Kennedy et al. (2022).
Kennedy, H., Pagès, J. F., Lagomasino, D., Arias-Ortiz, A., Colarusso, P., Fourqurean, J. W., Githaiga, M. N., Howard, J. L., Krause-Jensen, D., Kuwae, T., Lavery, P. S., Macreadie, P. I., Marbà, N., Masqué, P., Mazarrasa, I., Miyajima, T., Serrano, O., & Duarte, C. M. et al. (2022). Species traits and geomorphic setting as drivers of global soil carbon stocks in seagrass meadows. Global Biogeochemical Cycles, 36(10), e2022GB007481. https://doi.org/10.1029/2022GB007481
Grorud-Colvert, K., Sullivan-Stack, J., Roberts, C., Constant, V., Horta e Costa, B., Pike, E. P., Kingston, N., Laffoley, D., Sala, E., Claudet, J., Friedlander, A. M., Gill, D. A., Lester, S. E., Day, J. C., Gonçalves, E. J., Ahmadia, G. N., Rand, M., Villagomez, A., Ban, N. C., … Lubchenco, J. et al (2021). The MPA guide: A framework to achieve global goals for the ocean. Science, 373(6560). https://doi.org/10.1126/science.abf0861, 1215
Fish Focus. (2022, November 1). NEW DATA REVEALS BOTTOM TRAWLING IN PROTECTED AREAS. Fish Focus. [Press release]. https:// fishfocus.co.uk/new-data-reveals-bottom-trawling-in-protected-areas/ European Environmental Agency. (2020). https://sdi.eea.europa.eu/data/ b1777027-6c85-4d19-bdf2-5840184d6e13?path=%2F
European Environment Agency. (2014). Datasets – Nationally designated areas (CDDA). https://www.eea.europa.eu/data-and-maps/data/nationallydesignated-areas-national-cdda-1
82 by 2050 A pathway to decarbonise the EU fisheries sector
245 246 247
234 235 236 237 238 239 240 241 242 243 244
233
Welch, H., Clavelle et al. T., White, T.D., Cimino, M.A… & Hazen, L.E. (2022). “Hot spots of unseen fishing vessels,” Science Advances, 8(44). https://doi.org/10.1126/sciadv.abq2109
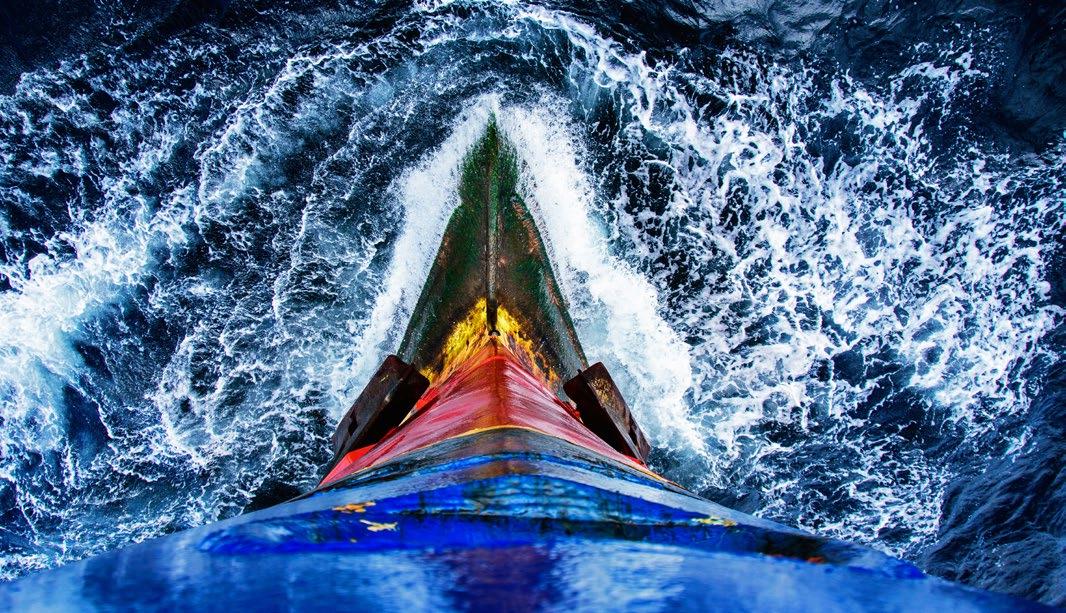
International Council for the Exploration of the Sea.(2022). Working Group on Spatial Fisheries Data (WGSFD; outputs from 2021 meeting). ICES Scientific Reports. 4(92), 151. https://doi.org/10.17895/ices.pub.21630236
Global Fishing Watch. (2023). Datasets and Code: Apparent Fishing Effort. https://globalfishingwatch.org/dataset-and-code-fishing-effort/
Kroodsma, D. A., Mayorga, J., Hochberg, T., Miller, N. A., Boerder, K., Ferretti, F., Wilson, A., Bergman, B., White, T. D., Block, B. A., Woods, P., Sullivan, B., Costello, C., & Worm, B. (2018). Tracking the global footprint of fisheries. Science, 359(6378), 904–908. https://doi.org/10.1126/science.aao5646de Souza, E. N., Boerder, K., Matwin, S., & Worm, B. (2016). Improving fishing pattern detection from satellite AIS using data mining and machine learning. PLoS One, 11(7), e0158248. https://doi.org/10.1371/journal.pone.0158248
European Commission. (2023). Fisheries - Fleet Register. https://webgate.ec.europa.eu/fleet-europa/index_en
Rijnsdorp, A. D., De Borger, E., Tiano, J., Braeckman, U., & Soetaert, K. (2021). Impact of bottom trawling on sediment biogeochemistry: A modelling approach. Biogeosciences, 18(8), 2539–2557. https://doi.org/10.5194/bg18-2539-2021 Eigaard, O.R. (Ed.), Bastardie, F., Bromhall, K., Brooks, M.E., Gislason, H., McLaverty, C., Noack, T., Olesen, J., O'Neill, F.G., Reijden, K.J.V.D., Saurel, C., Wilms, T.J.G., & Dinesen, G.E. (2022). Sandbanks and fisheries effects in relation to EU’s fishery and environmental policy. DTU Aqua. DTU Aqua Report No. 409-2022.See also Black et al. (2022)
Black et al. (2022). Black, K.E., Smeaton, C., Turrell, W.R., & and Austin, W.E.N. (2022). Assessing the potential vulnerability of sedimentary carbon stores to bottom trawling disturbance within the UK EEZ. Frontiers in Marine Science, 9, :[892892]. https://doi.org/10.3389/fmars.2022.892892
Hiddink,J. G., Jennings, S., Sciberras, M., Szostek, C. L., Hughes, K. M., Ellis, N., Rijnsdorp, A. D., McConnaughey, R. A., Mazor, T., Hilborn, R., Collie, J. S., Pitcher, C. R., Amoroso, R. O., Parma, A. M., Suuronen, P., & Kaiser, M. J. (2017). Global analysis of depletion and recovery of seabed biota after bottom trawling disturbance. Proceedings of the National Academy of Sciences, 114(31), 8301–8306. https://doi.org/10.1073/pnas.1618858114
Sala E., Mayorga J., Bradley D., Cabral R. B., Atwood T. B., Auber A., et al (2021). Protecting the global ocean for biodiversity, food and climate. Nature 592, 397–402. doi: 10.1038/s41586-021-03371-z
Sala E., Mayorga J., Bradley D., Cabral R. B., Atwood T. B., Auber A., et al. (2021). Protecting the global ocean for biodiversity, food and climate. Nature 592, 397–402. doi: 10.1038/s41586-021-03371-z
Black et al. (2022). Black, K.E., Smeaton, C., Turrell, W.R., & and Austin, W.E.N. (2022). Assessing the potential vulnerability of sedimentary carbon stores to bottom trawling disturbance within the UK EEZ. Frontiers in Marine Science, 9, :[892892]. https://doi.org/10.3389/fmars.2022.892892
Smeaton, C., Austin, W., Davies, A., Baltzar, A., Abell, R. E., & Howe, J. A. (2016). Substantial stores of sedimentary carbon held in midlatitude fjords. Biogeosciences, 13, 5771–5787. doi: 10.5194/bg-13-5771- 2016
Smeaton, C., Hunt, C.A., Turrell, W.R., & Austin, W.E.N. (2021b). Marine Sedimentary Carbon 929 Stocks of the United Kingdom’s Exclusive Economic Zone. Front. Earth Sci. 9. 930 https://doi.org/10.3389/feart.2021.593324
De Haas , H., Boer, W., & van Weering, T. C. E. (1997). Recent sedimentation and organic carbon burial in a shelf sea: The North Sea. Marine Geology, 144(1-3), 131–146. https://doi.org/10.1016/s0025-3227(97)00082-0 Evans J. R., Austin W. E. N., Brew D. S., Wilkinson I. P., Kennedy H. A. (2002). Holocene Shelf sea evolution offshore northeast England. Mar. Geol. 191, 147–164. doi: 10.1016/S0025-3227(02)00529-7
Scourse J. D., Austin W. E. N., Long B. T., Assinder D. J., Huws D. (2002). Holocene Evolution of seasonal stratification in the celtic Sea: Refined age model, mixing depths and foraminiferal stratigraphy. Mar. Geol. 191, 119–145. doi: 10.1016/S0025-3227(02)00528-5
Diesing, M., Thorsnes, T., & Bjarnadóttir, L. R. (2021). Organic carbon densities and accumulation rates in surface sediments of the North Sea and Skagerrak. Biogeosciences, 18(6), 2139–2160. https://doi.org/10.5194/bg18-2139-2021 De Haas , H., Van Weering, T. C. E., & De Stigter, H.(2002). Organic carbon in shelf seas: sinks or sources, processes and products, Continental Shelf Research, 22, 691–717.
Diesing, M., Thorsnes, T., & Bjarnadóttir, L. R. (2021). Organic carbon densities and accumulation rates in surface sediments of the North Sea and Skagerrak. Biogeosciences, 18(6), 2139–2160.
https://doi.org/10.5194/bg-18-2139-2021
83
249 260 261 262 263 264 265 250 251 252 253 254 255 256 257 258 259
© OCEANA / Juan Cuetos
248
Appendix E
Displacing effort from blue-carbon habitats in the OSPAR ecoregion
The study estimated the change in carbon release induced by displacing the fisheries. Because GFW public data resolution is too coarse (rasterized by MMSI number the data are gridded at 10th degree resolution), this cannot overlay with the conservation area adequately as most of these areas are more finely resolved. However, instead this study uses another data source to map the fishing activities, which does not cover the entire EU Waters but the OSPAR area only. The OSPAR area is used as a pilot study to evaluate the effect of displacing the effort from the current conservation areas designated in the Atlantic EU Waters .
Using as data source the ICES VMS data aggregated on a grid of 800x800m. 267,268, 272 The dataset provides the swept area as the cumulative area contacted by a fishing gear within a grid cell over one year. The swept area ratio (SAR, also defined as fishing intensity) is the swept area divided by the surface area of the grid cell. The area contacted by fishing gear is provided by geographically distinct Vessel Monitoring System (VMS) points for which speed and course are available at intervals of maximum 2
hours, coupled with information on vessel size and gear used derived from EU logbooks. 273 The data provide the Swept Area Ratio SAR, both the surface SAR and the subsurface SAR ( Figure E.1. ), which is an indicator of the intensity of the fishing pressure induced by all types of bottom-contacting gears pooled. Only the subsurface SAR is used in this report as possible released carbon from the seabed is linked to the fishing intensity penetrating the sediment profile.
2018-2020 Subsurface Swept Area Ratio
2018-2020
EU
the OSPAR area (here, including the UK). A SAR of value 1 in a grid cell means that the corresponding grid cell has been swept at least once within a year. The grid cell resolution is 800x800m. Lambert projection. The subsurface SAR gives the surface area impacted by the part of the bottom-contacting gear components penetrating the sediment profile.
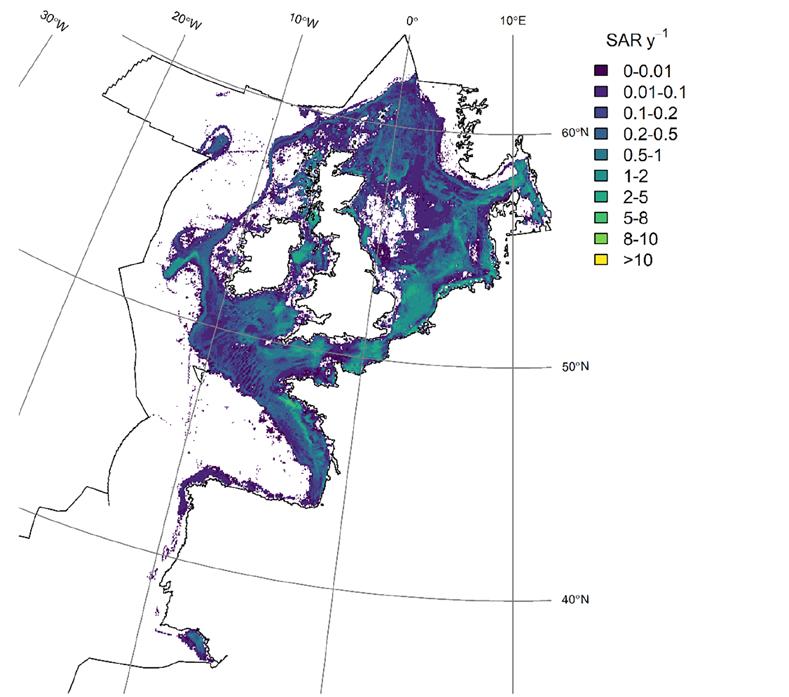
84 by 2050 A pathway to decarbonise the EU fisheries sector
Figure E.1. Average of the Subsurface Swept Area Ratio over the 3y period of
from the
fleet active in
Seabed carbon loss from fishing disturbance
Figure E.2. Estimated tonnes of carbon (C) lost per year (y) from the disturbance of bottom-contacting gear on the seabed. These estimates are deduced by overlaying the subsurface Swept Area Ratio computed in each grid cell in 2020 by EU fleets using bottom-contacting gears within the OSPARMSFD areas, together with the seabed carbon stock mapping of Atwood et al. (2020). Additional assumptions were required (i.e., average gear penetration of 2.44 cm,274 fraction of sediment remobilized that settle back assumed to be 0.87,275 natural degradation of C to be 12.3y-1,276 C labile fraction depending on the seabed sediment types). Non-EU Fleet e.g., Norway is not included, apart from the UK fleet. Gear-specific fishing activities were calculated from an average of the 2021 ICES dataset delivered to OSPAR for the years 20182020. Grid cells are 800x800m large. Lambert projection. Subsurface estimates only keep the part of the total swept area for which the gear is known to penetrate the sediments.
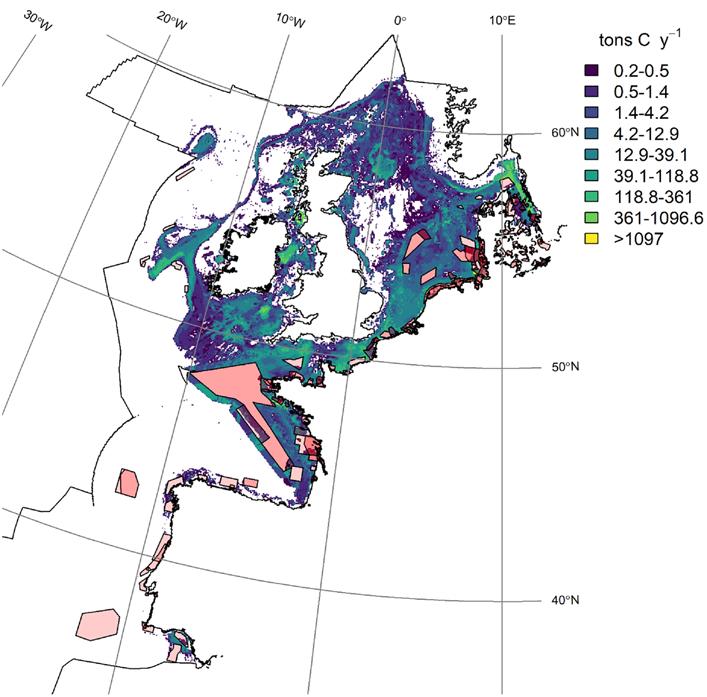
Seabed carbon loss from fishing disturbance

85
Figure E.3. . Change induced in fishing pressure when displaced from the existing conservation areas (in red).
Seabed carbon loss from fishing disturbance
Seabed carbon loss from fishing disturbance
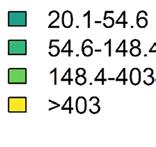
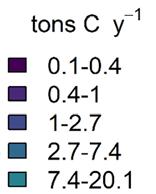
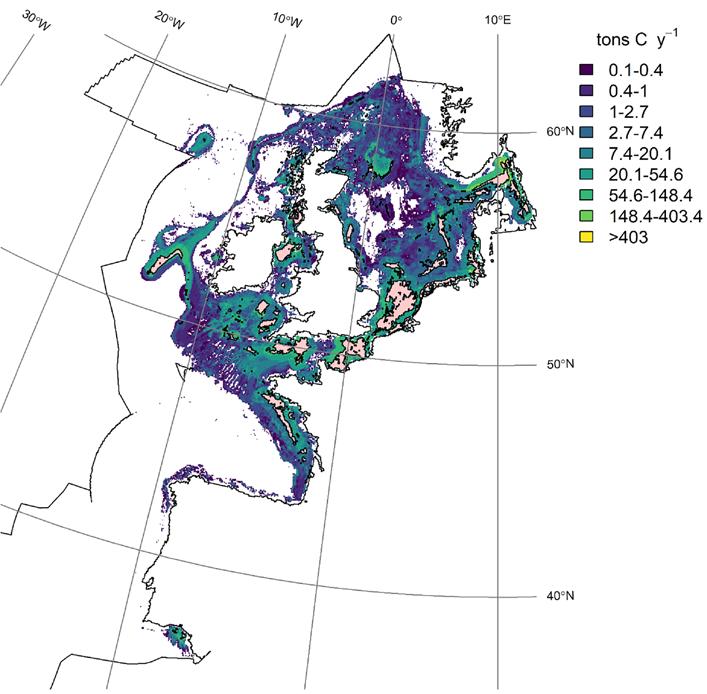
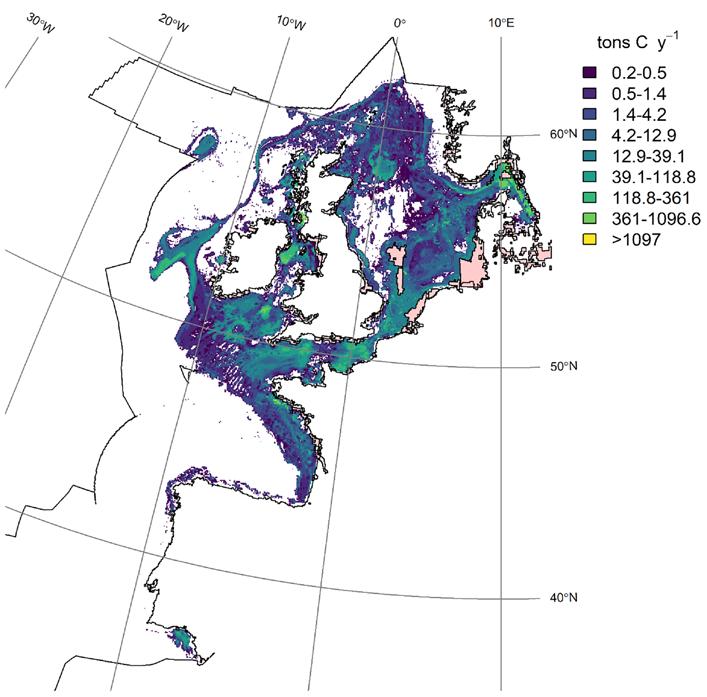
86 by 2050 A pathway to decarbonise the EU fisheries sector
Figure E.5. Change induced in fishing pressure when displaced from the blue carbon habitats (defined here as >14,000 gC per m2, areas in red).
Figure E.4. Change induced in fishing pressure when displaced from the core fishing grounds (defined here as >95% percentile, areas in red).
Table E.1. Estimated tonnes of carbon loss and CO 2 emissions annually from the seabed disturbance by bottom-contacting gears deployed by the EU Fleet, including the UK fleet. Assumes a conversion factor of 3.67 gCO 2 per gC. Blue carbon habitats were arbitrarily defined in this case as areas with Atwood et al . (2020) estimates >14,000 gC.m -2
References in Appendix E:
OSPAR Commission. (2022). OSPAR Bottom Fishing Intensity - Surface & Subsurface. https://odims.ospar.org/en/maps/map-bottom-fishing-i_surface-subsurface_khexe/
European Commission. European Marine Observation and Data Network (EMODnet). https://emodnet.ec.europa.eu/geonetwork/srv/eng/catalog. search#/metadata/d57fbdea-489e-4e11-9ff1-f0f706cfe783
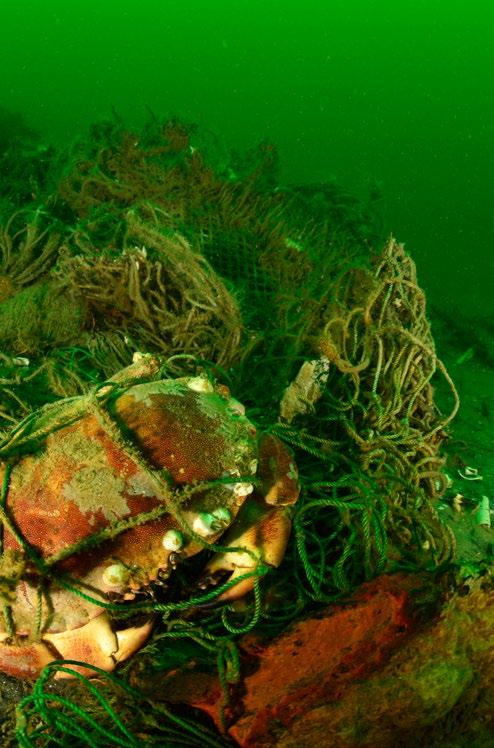
Eigaard, O.R., Bastardie, F., Breen, M., Dinesen, G.E., Hintzen, N.T., Laffargue, P., Mortensen, L.O., Nielsen, J.R., Nilsson, H.C., O’Neill, F.G., Polet, H., Reid, D.G., Sala, A., Sköld, M., Smith, C., Sørensen, T.K., Tully, O., Zengin, M., & Rijnsdorp, A.D. (2016). Estimating seabed pressure from demersal trawls, seines, and dredges based on gear design and dimensions. ICES Journal of Marine Science, 73 (Suppl. 1), 27-43. https://doi.org/10.1093/ icesjms/fsv099
Hiddink, J. G., Jennings, S., Sciberras, M., Szostek, C. L., Hughes, K. M., Ellis, N., Rijnsdorp, A. D., McConnaughey, R. A., Mazor, T., Hilborn, R., Collie, J. S., Pitcher, C. R., Amoroso, R. O., Parma, A. M., Suuronen, P., & Kaiser, M. J. (2017). Global analysis of depletion and recovery of seabed biota after bottom trawling disturbance. Proceedings of the National Academy of Sciences, 114(31), 8301–8306. https://doi.org/10.1073/pnas.1618858114
Sala, E., Mayorga, J., Bradley, D., Cabral, R.B., Atwood, T.B., Auber, A., Cheung, W., Costello, C., Costello, C., Ferretti, F., Friedlander, A. M., Gaines, S. D., Garilao, C., Goodell, W., Halpern, B. S., Hinson, A., Kaschner, K., Kesner-Reyes, K., Leprieur, F., McGowan, J., … Lubchenco, J. (2021). Protecting the global ocean for biodiversity, food, and climate. Nature, 592 (7854), 397–402. https://doi.org/10.1038/s41586-021-03371-z
Sala, E., Mayorga, J., Bradley, D., Cabral, R.B., Atwood, T.B., Auber, A., Cheung, W., Costello, C., Costello, C., Ferretti, F., Friedlander, A. M., Gaines, S. D., Garilao, C., Goodell, W., Halpern, B. S., Hinson, A., Kaschner, K., Kesner-Reyes, K., Leprieur, F., McGowan, J., … Lubchenco, J. (2021). Protecting the global ocean for biodiversity, food, and climate. Nature, 592(7854), 397–402.
https://doi.org/10.1038/s41586-021-03371-z
Atwood, T.B., Witt, A., Mayorga, J., Hammill, E., & Sala, E. (2020). Global Patterns in Marine Sediment Carbon Stocks. Frontiers in Marine Science, 7,165. https://doi.org/10.3389/fmars.2020.00165
87
Carbon loss from seabed disturbance by fishing in OSPAR areas (tonnes) 9,181,276 Emissions (tonnes CO 2eq.y -1) 33,695,283 Emissions (tonnes CO 2eq.y -1) when displaced from designated MPAs 34,996,122 +3.87 Emissions (tonnes CO 2eq.y -1) when displaced from core grounds 28,111,318 -16.58 Emissions (tonnes CO 2eq.y -1) when displaced from blue carbon habitats 32,087,660 -4.78
carbon loss by seabed disturbance from fishing in OSPAR area % Change
Annual
© OCEANA / Carlos Minguell
267 268 269 270 271 272 273
Appendix F A non-exhaustive list of technological solutions
NSAC 2022´s opinion about potentials for saving fuel use
(see the outcome of Climate Change Focus Group of NSAC established in March 2022)
According to Bastardie et al . (2022) 274 , active fisheries (pelagic and bottom trawls) consume the most fuel during their fishing operations. It makes sense, cost-wise, to adopt measures tackling energy efficiency during fishing. When asked to list potential solutions, stakeholders from bottom-trawl fisheries covered measures in all aspects, such as engine change, strategic measures such as the use of auto-pilot, route optimisation and slow steaming, as well as behavioural changes of the skipper, more efficient propulsion systems, improved maintenance, shift to electric-powered mechanisms from mechanicalhydraulic mechanism, use of LED lights and fuel monitoring devices.
Available concepts should be utilized in combination if complete phasing out of GHG emissions is to be achieved, including:
• Technical energy efficiency (hull and superstructure [2-20% GHG reduction], speed optimization [<75% GHG reduction], concept, speed, and capability [2-50% GHG reduction], power and propulsion systems [5-15% GHG reduction]).
• Direct use of Renewable energy; sails (<100% GHG reduction).
• Alternative fuels (hydrogen and other synthetic fuels [80-100% GHG reduction], ammonia, biofuel 3 rd generation [90% GHG reduction], bio-LNG/LPG [35% GHG reduction], electricity [50-90% GHG reduction]).
• Operational energy efficiency (fleet management, logistics and incentives [5-50% GHG reduction]; voyage optimization [1-10% GHG reduction]).
Operational energy efficiency upgrades:
• Transport capacity (deadweight decrease by ship size, material, and lightweight structures, e.g., existing fibber ship project).
• Design speed reduction (slow steaming, reduced power demand)
• Hydrodynamic optimization (reduction of resistance [hull form optimization, air lubrication, antifouling solutions], improved propulsion [propeller optimization, appendages]).
• Reduction in installed energy (direct use of wind energy [sail], direct use of solar energy, waste heat recovery).
• Reduction of specific fuel consumption (SFC; improved energy converters, fuel cells).
• Alternative fuels (hydrogen, uranium, e-methanol, ammonia etc. Synthetic liquid fuels are favourable for transition).
Alternative fuels currently on the market tend to be more costly per unit than traditionally used fossil fuels. To remain cost-efficient, these need to be combined with other operational energy efficiency upgrades.
88 by 2050 A pathway to decarbonise the EU fisheries sector
Table F.1. Extracted from Bastardie et al. (2022) 274. Energy efficient technology usage reported in the scientific and grey literature and by consulted stakeholders within the commissioned study. Cited references can be found in European Union (2022).
*Source of info: S: Scientific literature, G: Grey literature, CQ: Commercial questionnaire, SQ: Scientist questionnaire
** No quantitative data is presented about the reduction in grey literature.
***There is a mention about the potential for saving but no quantitative data are shown.
Subcategories
Hull and propeller
3 - 20
Source
Basurko et al., 2013; Notti & Sala, 2014; Sala et al., 2012; Sala et al., 2011; Thomas et al., 2010
et al., 2012; Van Marlen, 2009
Basurko et al., 2013; European Commission, 2006; Notti & Sala, 2014; Thomas et al., 2010; Van Marlen, 2009
3 - 20
Basurko et al., 2013; Notti & Sala, 2014; Sala et al., 2012; Sala et al., 2011; Thomas et al., 2010
Bastos et al., 2021; Basurko et al., 2013; European Commission, 2006; Gabrielii & Jafarzadeh, 2020; Jaurola et al., 2020; Notti & Sala, 2014; Sala et al., 2011; Sala et al., 2012; Tadros et al., 2020; Thomas et al., 2010; Van Marlen, 2009 Renewable
Amble, 1985; Bose & Macgregor, 1987; Schau et al., 2009; Van Marlen, 2009; Ziegler & Hansson, 2003
Renewable
(continued on next page)
89
Vessel Drag force reduction (hull)
improvements
hull designs
Improved
of rudders
Sala
Addition of a bulb
Use
5
30
6 -
Use of stabilizer fins 2 (in drag) Thomas et al., 2010 Use of stern post 11 (Antifouling) 0.8 – 5 (Hull cl.)
et al.,
Thomas et al., 2010; Van Marlen, 2009 Antifouling coatings and cleaning 26 Polyester covering of hull to reduce friction
Notti
2019;
Fuel consumption and GHG emissions Improved propulsion and auxiliary engines Improved propulsion system
- 100
5
energy (sail-assisted propulsion)
- 25
5
energy (for onboard consumers)
*** Gabrielii & Jafarzadeh, 2020 Target Category % Fuel saving potential Source of info * S G CQ SQ
(continued from previous page)
Vessel Fuel consumption and GHG
% Fuel saving potential Source of info * S G CQ SQ
Improved propulsion and auxiliary engines
3 - 8 Basurko et al., 2015; Van Marlen, 2009
Heat recovery systems
Magnetic devices
Frequency converters
Shore power/ shore supply of electricity
Shift from mechanicalhydraulic consumers to electric consumers
5 - 10
Gabrielii & Jafarzadeh, 2020; Notti & Sala, 2014; Palomba et al., 2017; Wang & Wang 20059
2 - 6 Gabiña et al., 2016a; Notti and Sala, 2014
9.1 - 25
Basurko et al., 2013; Lee & Hsu, 2015; Notti & Sala, 20141
90 - 100 (consump. in port) Gabrielii & Jafarzadeh, 2020
Gabrielii & Jafarzadeh, 2020; Notti & Sala, 2014; Sala et al., 2012 Energy
10 - 15
2009
Chang et al., 2016; Basurko et al., 2013; European Commission, 2006; Latorre, 2001; Parente et al., 2008; Sala et al., 2011; Van Marlen, 2009
(continued on next page)
90 by 2050 A pathway to decarbonise the EU fisheries sector
emissions
Improved maintenance (predictive maintenance)
onboard
consuming machinery Led lighting 26 - 55 Basurko et al.,
Sala et al., 2012; Thomas et al., 2010 Alternative refrigerants for cooling system 50 (in electricity) Sandison
fuel performance Alternative fuels 1.2 (1.9% for CO2 red.)
2013;
et al., 2021; Ziegler et al., 2013 Improved
Additives - Hsieh et al.,
Autopilot 3
Route optimization Route optimization (based on metocean data) Slow steaming, speed optimisation
Gabiña et al., 2016b; Gabiña et al., 2019; Gabrielii and Jafarzadeh, 2020; Goldsworthy, 2009; Jafarzadeh et al., 2017; Schau et al., 2009; Thomas et al., 2010; Uriondo et al., 2018 Fishing zone prediction systems
Strategy
15 - 59
Source Subcategories Target Category
(continued from previous page)
Target Category
Source Subcategories
Route optimization (based on metocean data)
Route planning systems, route optimisation
Route optimization
Strategy
Chang et al ., 2016; Granado et al ., 2021; Groba et al ., 2020
Basurko et al., 2013; Basurko et al., 2022; Sala et al., 2012; Sala et al., 2011; Thomas et al, 2010
3 - 15
Different mesh size, type of knots, panel cuttings
Electronically controlled gears
17 - 22
Balash et al., 2015a; European Commission, 2006; Hansen et al., 2013; ICES, 2020b; Lee et al., 2018; Notti & Sala, 2014; Parente et al., 2008; Priour, 2009; Sala et al., 2011; Sala et al., 2012; Van Marlen, 2009
2 - 40
Balash et al., 2015a; European Commission, 2006; Hansen et al., 2013; ICES, 2020b; Lee et al., 2018; Notti & Sala, 2014; Sala et al., 2012; Van Marlen, 2009
Basurko et al., 2013; European Commission, 2006; Latorre, 2001; Notti & Sala, 2014; Sala et al., 2011; Van Marlen, 2009; Gear
25 - 27
European Commission, 2006; Hansen et al., 2013; Khaled et al., 2012; Lee et al., 2018; Parente et al., 2008; Sala et al., 2011; Sala et al., 2012; Van Marlen, 2009
Operational improvement
>15 ICES, 2020a
New gear designs
1.6 – 19
Basurko et al., 2013; European Commission, 2006; Guijarro et al., 2017; Hansen et al., 2013; ICES, 2020b; Lee et al., 2018; Notti & Sala, 2014
(continued on next page)
91
Change of fishing ground
Energy consumption control and management
control and monitoring Energy audits ***
Change the fishing ground based on the catch and changing the return day
Onboard
monitoring devices and operative advice
Onboard energy
Drag force reduction (gear)
netting
or improved
New
designs New
designs
Alternative materials (DyneemaTM)
from demersal to semi pelagic trawling doors
Change
% Fuel saving potential Source of info * S G CQ SQ
Target Category
Source Subcategories
New gear designs
Gear
Drag force reduction (gear)
Alternative designs of trawl doors, trawl net, Sumwing
Ground gear
Alternative ropes (Helix ropes)
Sledges
Gear change: change from trawl to gillnet
Fishing gear change
Gear change: change from mid-water trawl to purse seine
Gear change: pulse trawling
Change the number of rigs from single trawling
Assisted fishing
4.5 - 20
European Commission, 2006; ICES, 2020b ; Lee et al., 2018 Notti & Sala, 2014; Priour, 2009; Sala et al., 2012; Van Marlen, 20096
** ICES, 2020b; Larsen et al., 2018; Van Marlen, 2009
** ICES, 2020b; Kebede et al., 2020; Sistiaga et al., 2015; Van Marlen, 2009
*** Kaykac et al., 2017; Van Marlen, 2009
From active to passive
*** Van Marlen, 2009
Within active
5 - 25
Driscoll & Tyedmers, 2010; Parker & Tyedmers, 2015; Van Marlen, 2009
35 - 54
Batsleer et al., 2016; European Commission, 2006; Sala et al., 2012; Taal & Klok, 2014; Van Marlen, 2009; Van Marlen et al., 2014
10 - 30
Broadhurst et al., 2013; European Commission, 2006; Van Marlen, 2009; Ziegler and Hansson 2003
*** Sala et al., 2012
Improve catchability and reduce mortality
Selective fishing: LED lighting
Catchability and reduced mortality
Selective fishing: use of selective gears
Technology to increase catch efficiency
8 - 25
An et al., 2017; Bryhn et al., 2014; Kuo & Shen, 2018; Matsushita et al., 2012; Yamashita et al., 2012
ICES, 2020b; Jørgensen et al., 2017; Hornborg et al., 2012; Van Marlen, 2009 ; Ziegler & Hornborg, 2014
10 - 30 Chassot et al., 2021
92 by 2050 A pathway to decarbonise the EU
sector
page)
fisheries
(continued from previous
% Fuel saving potential Source of info * S G CQ SQ
References in Appendix F:
Bastardie, F., Feary, D.A., Kell, L., Brunel, T., Metz, S., Döring, R., Ritzau, O., Oihane, E., & Basurko, C. (2022). Climate change and the Common Fisheries Policy: adaptation and building resilience to the effects of climate change on fisheries and reducing emissions of greenhouse gases from fishing EASME/ EMFF/2020/3.2.6 - Lot1/SC07 EASME/EMFF/2020/3.2.6 - Lot2/SC08 Final Report. European Union. Retrieved at: https://cinea.ec.europa.eu/system/files/2022-12/climate%20change%20and%20the%20common%20fisheries%20policy-HZ0422057ENN.pdf
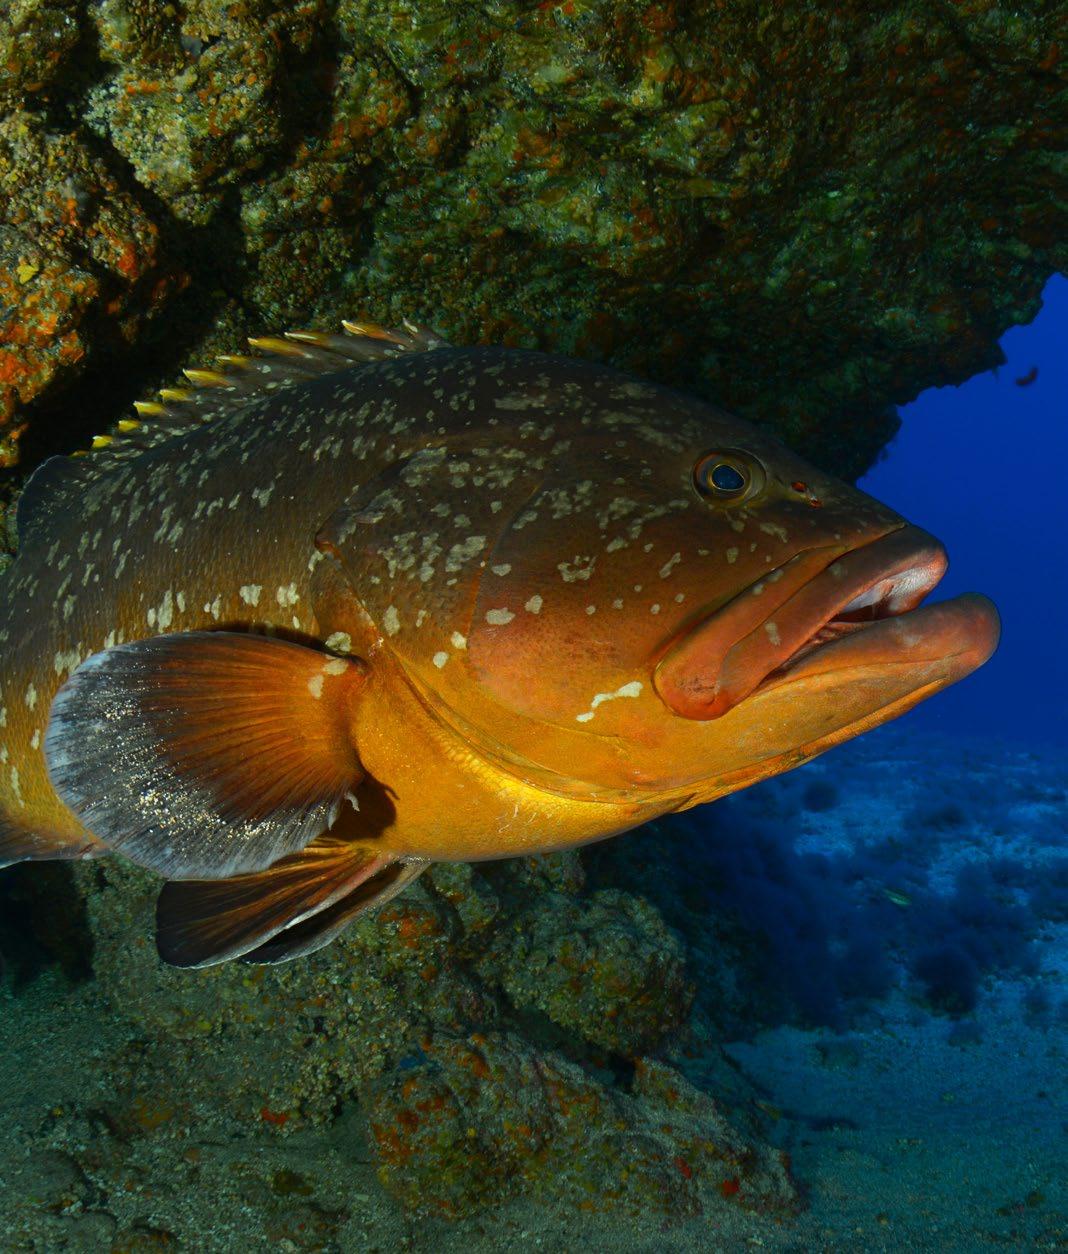
93
274
© OCEANA / Carlos Minguell
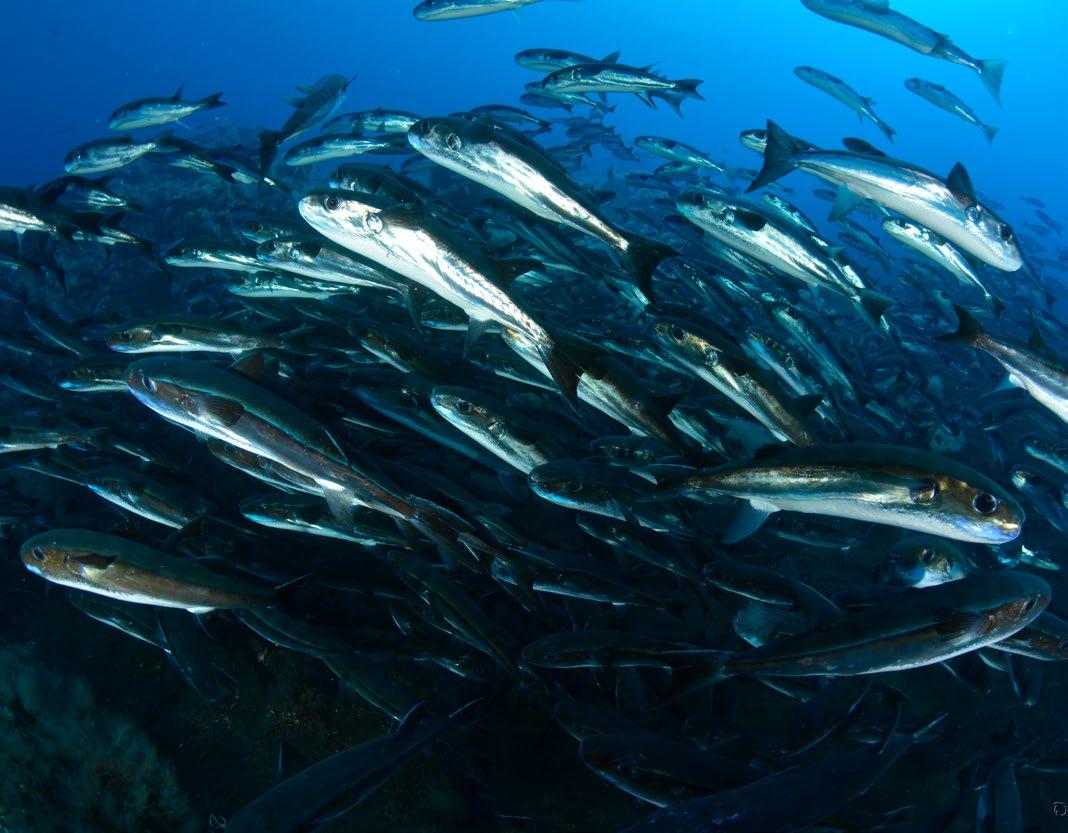
94 by 2050 A pathway to decarbonise the EU fisheries sector
© OCEANA / Juan Cuetos
© OCEANA / Carlos Minguell
95
OCEANA IN EUROPE
European Headquarters: Madrid, Spain
europe@oceana.org
European Union Office: Brussels, Belgium
brussels@oceana.org
Baltic and North Sea Office:
Copenhagen, Denmark
copenhagen@oceana.org
europe.oceana.org
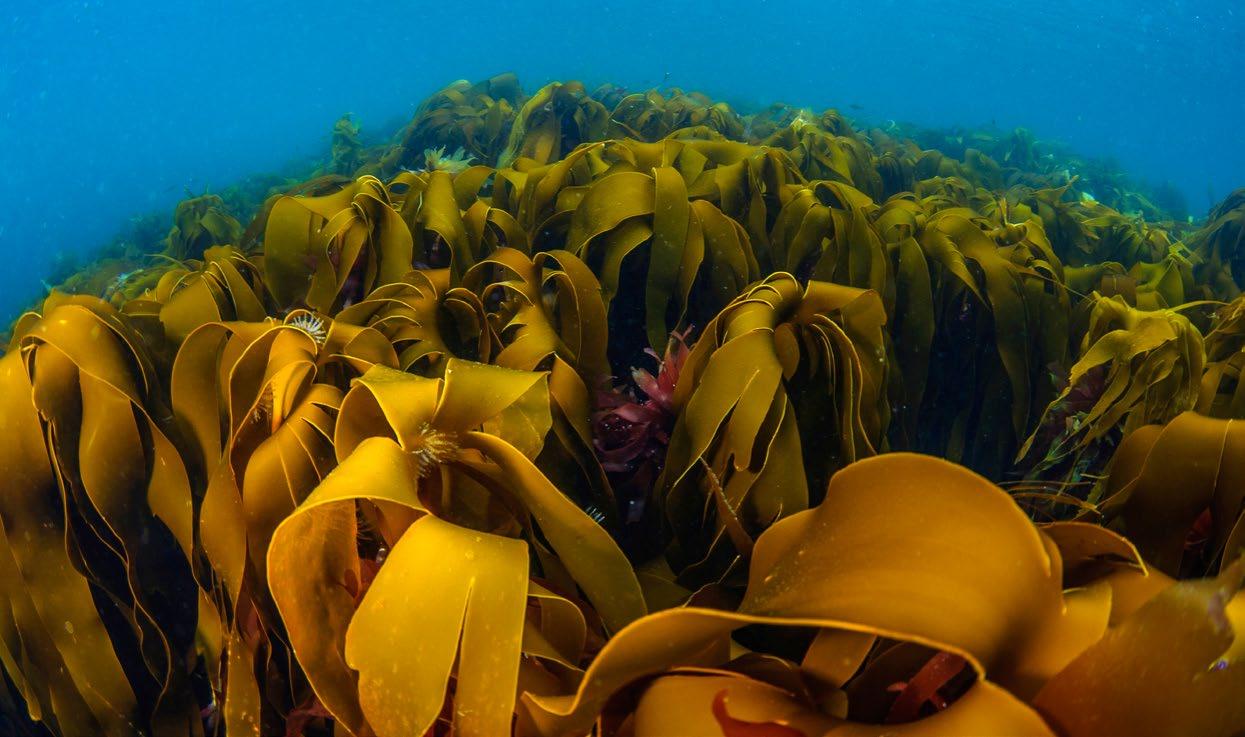 © OCEANA / Juan Cuetos
