KEY FIGURES
Insurance in Africa
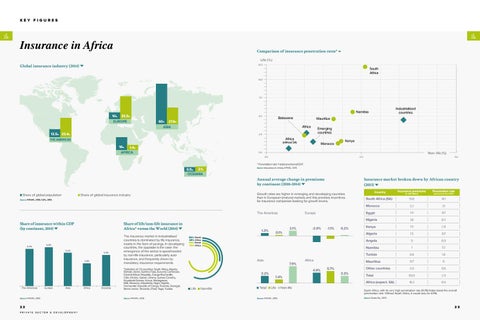
Comparison of insurance penetration rates* Life ( % )
Global insurance industry (2014)
12.5
South Africa 10.0
7.5
Industrialized countries
Namibia 10%
35.5%
EUROPE
5.0
Botswana
60% 27.6% ASIA
Mauritius Africa
13.5% 33.4%
Emerging countries
2.5
Africa
THE AMERICAS
(without SA)
Morocco
16%
1.4% AFRICA
Kenya Non - life (%)
0.0 2.5
0.0
5.0
* Penetration rate = total premiums/GDP.
0.5% 2.1% OCEANIA
Source: Insurance in Africa, KPMG, 2015
Annual average change in premiums by continent (2010-2014) Share of global population
Growth rates are higher in emerging and developing countries than in European (mature) markets and this provides incentives for insurance companies looking for growth levers.
Share of global insurance industry
Source: FANAF, 2016 / UN, 2015
The Americas
Share of insurance within GDP (by continent, 2014)
6.3%
Share of life/non-life insurance in Africa* versus the World (2014)
6.8% 5.2%
5.9%
2.8%
The Americas
Europe
Asia
Source: FANAF, 2016
22 PRIVATE SECTOR & DEVELOPMENT
Africa
Oceania
The insurance market in industrialised countries is dominated by life insurance, mainly in the form of savings. In developing countries, the opposite is the case: the emergence of the sector is spearheaded by non-life insurance, particularly auto insurance, and frequently driven by mandatory insurance requirements. *Selection of 29 countries: South Africa, Algeria, Bahrain, Benin, Burkina Faso, Burundi, Cameroon, Central African Republic, Congo Brazzaville, Côte d’Ivoire, Gabon, Ghana, Guinea Conakry, Equatorial Guinea, Kenya, Madagascar, Mali, Morocco, Mauritania, Niger, Nigeria, Democratic Republic of Congo, Rwanda, Senegal, Sierra Leone, Tanzania, Chad, Togo, Tunisia. Source: FANAF, 2016
Insurance market broken down by African country (2013)
1.3%
Europe
2.1%
-2.9%
-1.1%
0.2%
0.1%
56% World 28% Africa 44% World 72% Africa
Asia
Africa 7.9%
3.2%
Life
Non-life
Total
4.9% 1.4% Life
Source: FANAF, 2016
Non-life
5.7% 3.3%
Country
Insurance premiums
Penetration rate
South Africa (SA)
51.6
14.1
Morocco
3.2
3.1
Egypt
1.9
0.7
Nigeria
1.6
0.3
Kenya
1.5
2.8
Algeria
1.5
0.7
Angola
1.1
0.9
Namibia
1
7.2
Tunisia
0.8
1.8
Mauritius
0.7
6
Other countries
4.9
0.8
Total
69.9
2.9
Africa (expect. SA)
18.3
0.9
(in USD billions)
(premiums as % of GDP)
South Africa, with its very high penetration rate (14.1%) helps boost the overall penetration rate. Without South Africa, it would only be 0.9%. Source: Swiss Re, 2013
23