Industrialization in Sub-Saharan Africa

Page 163

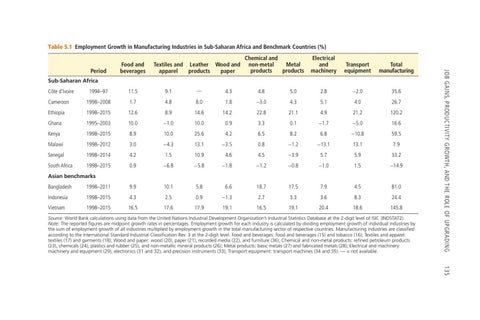
Table 5.1  Employment Growth in Manufacturing Industries in Sub-Saharan Africa and Benchmark Countries (%) Textiles and Leather Wood and apparel products paper

Chemical and non-metal Metal products products

Electrical and machinery

Transport equipment

Total manufacturing

Sub-Saharan Africa 1994–97

11.5

9.1

4.3

4.8

5.0

2.8

−2.0

35.6

Cameroon

1998–2008

1.7

4.8

8.0

1.8

−3.0

4.3

5.1

4.0

26.7

Ethiopia

1998–2015

12.6

8.9

14.6

14.2

22.8

21.1

4.9

21.2

120.2

Ghana

1995–2003

10.0

−1.0

10.0

0.9

3.3

0.1

−1.7

−5.0

16.6

Kenya

1998–2015

8.9

10.0

25.6

4.2

6.5

8.2

6.8

−10.8

59.5

Côte d’Ivoire

Malawi

1998–2012

3.0

−4.3

13.1

−3.5

0.8

−1.2

−13.1

13.1

7.9

Senegal

1998–2014

4.2

1.5

10.9

4.6

4.5

−3.9

5.7

5.9

33.2

South Africa

1998–2015

0.9

−6.8

−5.8

−1.8

−1.2

−0.8

−1.0

1.5

−14.9

9.9

10.1

5.8

6.6

18.7

17.5

7.9

4.5

81.0

Asian benchmarks Bangladesh

1998–2011

Indonesia

1998–2015

4.3

2.5

0.9

−1.3

2.7

3.3

3.6

8.3

24.4

Vietnam

1998–2015

16.5

17.6

17.9

19.1

16.5

19.1

20.4

18.6

145.8

Source: World Bank calculations using data from the United Nations Industrial Development Organization’s Industrial Statistics Database at the 2-digit level of ISIC (INDSTAT2). Note: The reported figures are midpoint growth rates in percentages. Employment growth for each industry is calculated by dividing employment growth of individual industries by the sum of employment growth of all industries multiplied by employment growth in the total manufacturing sector of respective countries. Manufacturing industries are classified according to the International Standard Industrial Classification Rev. 3 at the 2‐digit level: Food and beverages: food and beverages (15) and tobacco (16); Textiles and apparel: textiles (17) and garments (18); Wood and paper: wood (20), paper (21), recorded media (22), and furniture (36); Chemical and non-metal products: refined petroleum products (23), chemicals (24), plastics and rubber (25), and non-metallic mineral products (26); Metal products: basic metals (27) and fabricated metals (28); Electrical and machinery: machinery and equipment (29), electronics (31 and 32), and precision instruments (33); Transport equipment: transport machines (34 and 35). — = not available.

JOB GAINS, PRODUCTIVITY GROWTH, AND THE ROLE OF UPGRADING   135

Period

Food and beverages

Turn static files into dynamic content formats.

Create a flipbook

Articles inside

References

7min
pages 199-203

Notes

1min
page 198

6.7 Policy Framework: Integrate, Compete, Upgrade, and Enable

2min
page 197

Policy Framework: Integrate, Compete, Upgrade, and Enable

1min
page 196

Policy in Ethiopia

2min
page 194

6.2 Women in Manufacturing Jobs: The Role of Industrial Policy

4min
pages 191-192

Education and Skills Enhancement

3min
pages 189-190

Opportunity Act, Everything But Arms, and the Generalized System of Preferences

2min
page 177

Competition Policy

4min
pages 187-188

Infrastructure Development

1min
page 185

Trade Policy

1min
page 176

Industry Employment Shares

3min
pages 169-170

Role of Industrial Upgrading in Jobs Growth in Manufacturing in Sub-Saharan Africa

6min
pages 160-162

Sub-Saharan Africa and Benchmark Countries

1min
page 163

Countries, 2014

3min
pages 153-154

Current Trends in Job Growth in Sub-Saharan Africa across GVCs

2min
page 152

4.2 COVID-19 and Potential Disruptions to Global Value Chains

2min
page 141

Conclusion and Policy Options

3min
pages 139-140

Annex 4A Gravity Model of Global Value Chain Participation

3min
pages 142-143

Neighbor South Africa

1min
page 138

Africa Sold as Intermediate Inputs, 2015

1min
page 135

Evolution of Sourcing Patterns for Intermediate Inputs among Manufacturing Firms

1min
page 130

Metals Exporters

3min
pages 128-129

4.1 Country Groups and Comparators

2min
page 122

Resource Endowment and Participation in Manufacturing GVCs

6min
pages 123-127

Global Value Chains: Definition and Measures

2min
page 118

References

9min
pages 112-117

Conclusion and Policy Options

3min
pages 106-107

Notes

3min
pages 110-111

Annex 3A Productivity Growth Decomposition

3min
pages 108-109

Physical Infrastructure and Productivity

2min
page 105

Market Structure, Entry Regulation, and Productivity

2min
page 104

Sources of Productivity Growth: Within-Firm Productivity Growth, Innovation, and Technology Adoption

8min
pages 100-103

Sources of Productivity Growth: Interindustry and Intraindustry Resource Reallocation

5min
pages 97-99

Jobs Growth at the Intensive Margin with Productivity as the Driver

1min
page 96

References

4min
pages 93-95

Notes

4min
pages 91-92

Conclusion and Policy Options

2min
page 90

Underlying Factors and Policy Interventions

5min
pages 87-89

The Case of Ethiopia

5min
pages 78-81

Note

1min
page 67

The Future of Industrialization in Africa

4min
pages 60-61

Rethinking Industrial Policy for Africa

4min
pages 62-63

A Policy Framework for Industrializing along Global Value Chains: Integrate, Compete, Upgrade, Enable

6min
pages 44-46

Key Messages

2min
page 31

References

2min
pages 68-70

Sustainable Growth and Structural Transformation in Africa

2min
page 52

1 Establishment Age Effects on Job Growth across Size Groups

2min
page 30
Issuu converts static files into: digital portfolios, online yearbooks, online catalogs, digital photo albums and more. Sign up and create your flipbook.