THE RETURN OF THE TARIFF & THE IMPACT ON INVESTORS
JOHN NORRIS Chief Investment Officer
DAVID MCGRATH, CFA Managing Director
SAM CLEMENT
Associate
Managing Director
A Letter from Our
CHIEF INVESTMENT OFFICER
At the beginning of the 2nd quarter, many people questioned how things could get any more chaotic than they were in the first. It didn’t take long to find out.
On April 2, speaking from the White House Rose Garden, President Trump announced a broad slate of tariffs on the remainder of the world. The larger the U.S. trade deficit with an individual country, the higher the tariff. Everyone, however, got at least a 10% tariff, as the president exercised authority under the International Emergency Economic Powers Act of 1977.
Let’s just say the markets’ reaction wasn’t very positive. In fact, the U.S. stock market, as defined by the S&P 500, fell from 5,670.97 at the close of trading on April 2 to 4,982.77 at the end of April 8. That is roughly a 12.13% principal decline over four trading sessions.1 Obviously, that wasn’t a lot of fun.
Then came the waiting game.
We spent the remainder of the quarter agonizing over tariff announcements, parsing the president’s social media posts and speculating about the Federal Reserve’s next move. Would it cut the target overnight lending rate again? If not if, then when?
Unfortunately for those wanting an immediate rate cut, the economic data during the quarter wouldn’t cooperate. The numbers were just a little too strong. The official unemployment rate best illustrates this, which was 4.2% at the start of April and 4.1% at the end of June.2
Inflation, as defined by the trailing 12-month Consumer Price Index (CPI), came in at 2.4% in March, 2.3% in April and 2.4% in May 2025. While those numbers are much better than the peak of 9.1% back in June 2022, they still aren’t as low as the Fed-desired 2% target.3
Then, as if all of this weren’t maddening enough, the Israelis started bombing Iran on June 13, 2025. The Iranians quickly retaliated, and for a moment, it appeared as though the world might be on the cusp of a major meltdown. In a surprising turn, however, on June 22, the United States joined the conflict by striking several key Iranian nuclear sites, and the situation deescalated shortly afterward.
Whew. Given all the turmoil, you’d expect investors to be anxious and rattled — but you’d be wrong.
When the dust settled and smoke cleared at the end of June, the S&P 500 had reached an all-time high of 6,204.95 — marking a principal return of roughly 10.56% for the 2nd quarter of 2025.1 On the flip side, crude oil prices, as defined by the Generic 1st Crude Oil WTI futures contract, actually declined during the quarter. That isn’t what one might have expected, given all the geopolitical uncertainty.4
In the end, it wasn’t just the craziness of what was happening in the world that made the 2nd quarter of 2025 so unusual. It was how investors responded to it. Regardless, whether everything and everyone was crazy or not, few people complain when the major U.S. stock indices generate positive results.
Thank you for your continued support.
John Norris Chief Investment Officer
Our Investment Committee distributes information on a regular basis to better inform our clients about pending investment decisions, the current state of the economy and our forecasts for the economy and financial markets. Oakworth Capital currently advises on approximately $2.37 billion in client assets. The allocation breakdown is in the chart below.
2ND QUARTER KEY TAKEAWAYS
Rising tariff threats took center stage, unsettling consumers. Trade tensions spiked, the dollar slid, and gold soared. While uncertainty lingered, markets shrugged, tech rebounded and the Fed held firm.
ECONOMIC GLOBALIZATION
During the 2 nd quarter, economic globalism either seemed to have died or veered wildly off course. If actions speak louder than words, domestic investors didn’t really seem to mind too terribly much.
TARIFF THREAT EFFECT
The threat of tariffs wreaked havoc on the consumer psyche during the quarter. At first blush, it would seem the average U.S. consumer cares more about the immediate prospects for higher prices than the long-term benefit of bringing long-outsourced manufacturing back to the U.S.
THE FED HOLDS STEADY
Will the Federal Reserve cut the target overnight lending rate or not? That seems to be all investors and analysts wanted to know. It didn’t happen in the 2 nd quarter — and oddly enough, the markets didn’t seem to mind. I suppose it was enough for the Fed to reiterate that the next move would most definitely be a cut. 1
A MATTER OF DUAL MANDATE
Unless it was about inflation or the labor market, analysts didn’t appear to care too much about it. If an economic release didn’t directly relate to the Fed’s dual mandate — price stability and full employment — no one seemed to care.
DOLLAR DROPS, FOREIGN GAINS
Continued U.S. fiscal imbalances and the administration’s domestically focused agenda appeared to discourage international investors. As a result, the U.S. dollar fell sharply during the quarter relative to other major reserve currencies, providing a boost to foreign stock market returns. 2
THE GOLD RUSH CONTINUES
As of June 25, 2025, gold continued its climb during 2 nd quarter. Although it doesn’t generate a profit or pay a dividend, investors seem to like the stuff when geopolitical events are strained, and the world is awash in debt and fiat currencies. To me, it makes sense when you think about it.
TRADE TURBULENCE
On April 2, President Trump announced a broad package of tariffs and import duties on the remainder of the world. This was an attempt to address what the administration viewed as unfair trading practices. Initially, investors reacted negatively. So much so, the president seemed to renege on much of it, leaving many people very confused.
FLAT INFLATION, RISING FEAR
Despite all the wringing of hands and gnashing of teeth, the administration’s tariff schemes have yet to show up in the official inflation data. Unfortunately, the fear of tariff-driven price hikes has likely caused the Federal Reserve to postpone its next rate cut. 3 Without this fear, it is highly possible the Fed may well have already cut the overnight rate at least once in 2025.
MARKET DEFIANCE
If you had told me in March that Israel and the United States would bomb Iran’s nuclear facilities — and that crude oil prices would drop by the end of June — I wouldn’t have believed you. Add in a surge in U.S. stock prices and a U.S. bond market sell-off? I would have had you committed. However, that is exactly what happened.
THE GROWING DIVIDE
If there were any doubts about the growing divide between the United States and Western Europe, the events of the 2 nd quarter likely put them to bed. The two seem to be moving in opposite directions — and at different speeds — and not in a good way that bodes well for the Europeans over the long term.
A BEAUTIFUL BILL BUT BIG BUDGET
Despite public outrage over the federal deficit, the strong reactions to DOGE and the president’s so-called “One Big, Beautiful Bill” suggest that people may not actually want to reduce federal spending.
TECH MAKES A TURNAROUND
No matter how dysfunctional things seem, how uncertain the world feels or what the Fed is doing, one thing remains clear: many domestic investors love their tech stocks. After a difficult 1 st quarter, the sector came roaring back with a vengeance in Q2. As loosely defined by the NASDAQ Composite, tech was up 15.31% through 6/24/2025.
STATE OF THE ECONOMY
A volatile first half marked by inventory swings, inflation fears and a Fed that’s focused elsewhere. In the words of Mr. Dylan: “The times, they are a-changin'."
John Norris
Predicting the future of U.S. economic growth used to be pretty easy. All you did was take what happened during the previous quarter, then either add or subtract based on your analysis of a host of economic reports. That is part of the reason everyone on television seems to be saying the same thing.
However, as Bob Dylan sang, “The times they are a-changin’.” Why bust your back doing the necessary work when it doesn’t matter what you do?
INVENTORY RUSH, TRADE GAPS AND GDP MATH
During the 1st quarter of 2025, the threat of U.S. tariffs on major trading partners led to a surge in inventory building, pulling forward
many planned purchases. Put another way, businesses didn’t want to be caught flat-footed if and when the administration slapped additional taxes on imports. So, they went ahead and got what they thought they needed.
As a result, the trade deficit ballooned. So much so, according to 1st quarter Gross Domestic Product (GDP), the Bureau of Economic Analysis (BEA) estimated that the deterioration in our trade balance took a whopping 461 basis points (4.61%) off of the GDP equation. Conversely, the increase in inventories added back 259 basis points.1
All told, the BEA estimated that U.S. GDP shrank 0.5% during the 1st quarter. Obviously, negative signs in front of economic releases aren’t desirable. However, if “we” can easily explain away 4.6% of the 0.5% contraction, as yours truly (and undoubtedly others) did, were
things really that bad? Further, what did the future hold?
Well, if we are to believe the economic reports Washington feeds us, we should expect a significant “improvement” in the trade deficit in the BEA’s 2nd quarter 2025 GDP report. As the chart below suggests, the sharp reversal in our trade picture during the last quarter will likely add to the overall GDP equation, perhaps significantly. Further, businesses will have likely worked down their huge increase in inventories.
As a result, the BEA will likely report the trade deficit added to the economy during the quarter and the inventories subtracted from it.
MONTHLY U.S. TRADE DEFICIT – FROM BAD TO WORSE TO JUST BAD AGAIN
*Source: Bloomberg Financial
Even so, if others feel like I do, it seems people don’t care as much about the recent GDP data as they once did. After all, IF the economy can shrink 0.5% in the 1st quarter (as reported by the BEA), AND the Federal Reserve (the Fed) didn’t make any substantial changes to monetary policy, well, the Fed must be focused on other things. And it is.
The second paragraph of the Federal Open Market Committee (FOMC)’s June 2025 statement best captures where the Fed’s focus lies:
“The Committee seeks to achieve maximum employment and inflation at the rate of 2 percent over the longer run. Uncertainty about the economic outlook has diminished but remains elevated. The Committee is attentive to the risks to both sides of its dual mandate.”
Please note items that were not mentioned:
• The FOMC didn’t mention anything about the 1st quarter 2025 GDP report.
• It didn’t breathe a word about the trade deficit or inventory growth.
• Believe it or not, there wasn’t any mention of tariffs or presidential social media posts either.
• Consumer confidence? Business optimism? Corporate profitability?
While it is difficult to imagine the Fed not caring about those things, none of them made the cut in the official statement.
Basically, it seems the future of monetary policy in the United States comes down to 2 things: inflation and the labor markets. So, where were they during the quarter?
INFLATION
After spiking in June 2022, the trailing 12-month Consumer Price Index (CPI) seems to have found a cooler home in the mid-2% range. In April and May 2025, it was 2.3% and 2.4%, respectively. This is a significant improvement from April and May 2024, with figures at 3.4% and 3.3%. As such, the rate of price increases for consumer goods and services in the U.S. economy appears to be better under control.
IS INFLATION REALLY THAT MUCH OF A PROBLEM ANY LONGER?
*Source: Bloomberg Financial
However, the Fed hasn’t been ready to claim victory over inflation yet. The reason? Tariffs.
While it might not admit so in official statements, like it didn’t after the June 2025 FOMC meeting, the impact tariffs might have on the CPI, and other inflation gauges, is significant.
Consider the following “executive” statement from an economic letter Fed economists Bart Hobijn and Fernanda Nechio released on May 19, 2025:
“A range of tariffs on U.S. imports has been enacted or considered recently. Trade tariffs can potentially affect price inflation for consumption and investment goods. Estimates suggest that the impact on prices for investment goods is likely to be much larger than for consumption goods. For example, if an across-theboard 25% tariff is fully passed through to finished goods, near-term price increases are estimated to be about 9.5% for investment goods and 2.2% for consumption goods. These price increases for investment goods can have important implications for businesses’ investment decisions.” 2
Understandably, the Fed is hesitant to cut the target overnight lending rate. However, in this business economist’s humble opinion, inflation ultimately comes down to supply, demand and the amount of money floating around the economy. As such, IF there is not a commensurate increase in the money supply, tariffs likely wouldn’t have the impact on consumer prices that the Fed fears.
The consumer will simply run out of cash, and demand will lessen. If that happens, prices should fall over the long term. However, in the short term, a sudden increase in consumer prices due to tariffs could have a detrimental impact on overall economic activity. After all, the less people consume, the less companies will need to produce. The less they need to produce, the fewer workers they need to employ, and so on and so forth.
LABOR MARKETS
As for the labor markets and employment, the U.S. economy has been surprisingly resilient in creating jobs since the end of 2020. While
monthly job growth has decreased somewhat over time, it has been a remarkable run for new payrolls. As the chart below demonstrates, through May 2025, payrolls have increased every month since January 2021.
JOB GROWTH HAS BEEN WEAKENING
*Source: Bloomberg Financial
However, as the chart also shows, monthly job growth appears to be increasing at a decreasing rate. In other words, the trend is slowing.
Further, the type of jobs the economy has recently been creating is a little concerning to me.
• For instance, according to the “Employment Situation – May 2025,” 3 prior to any adjustments made after June 30, 2025, the economy created 1.733 million new payroll jobs over the 12-months ending in May 2025. That is pretty good news, right? However:
◉ 312,000 were in ‘state & local government
◉ 923,000 were in private education and health services
◉ 262,000 were in leisure and hospitality
In May 2024, these three sectors accounted for roughly 40.2% of all payroll jobs in the U.S. economy. However, they accounted for 86.4% of all official payroll growth.
The rest of the economy, the remaining 59.8%, officially created only 236,000 new payroll jobs over those same 12 months – just under 20,000 jobs per month.
Again, prior to any revisions to the “Employment Situation – May 2025” report after June 30.
IN CONCLUSION
So, how would one describe an economy with modest levels of inflation, as defined by the 12-month CPI, and modest levels of job growth, as I outlined in the previous two paragraphs? In this instance, the equation for economic growth is: modest + modest = modest.
However, due to the spectre of tariffs the administration has hung over the economy, you could write that simple equation as:
In the end, predicting the future of U.S. economic growth used to be pretty easy. All you did was take what had happened the previous quarter, and either add or subtract based on your analysis of a host of economic reports. Easy peasy, nice and easy.
These days, when you throw in punitive tariffs and a president who can move the markets with a single tweet? Again, as Dylan used to sing: “The times, they are a-changin’.”
1. 2. 3.
Bureau of Economic Analysis: Gross Domestic Product, 1st Quarter 2025
Federal Reserve Bank of San Francisco: The Effects of Tariffs on Inflation and Production Costs
Bureau of Labor Statistics: The Employment Situation – May 2025
Oakworth Asset Management is a registered investment advisor. All advisory services, including investment management and financial planning, are offered through Oakworth Asset Management, LLC. Oakworth Asset Management is owned by Oakworth Capital Bank, member FDIC, Equal Housing Lender. Investment products and services offered via Oakworth Asset Management, LLC are independent of the products and services offered by Oakworth Capital Bank and are NOT FDIC INSURED, NOT BANK GUARANTEED, and MAY LOSE VALUE. The information, opinions, comments, statements, views or recommendations expressed are general in nature and should not be considered professional, tax or legal advice; or as an offer to buy or sell or to make or consider any investment or course of action.
For more information visit Oakworth.com.
SPECIAL REPORT: TRADE, TENSIONS AND TRUMP
From “Liberation Day” to record market highs—what Trump’s second-term trade policy means for investors, businesses and consumers.
Ryan Bernal
Whether you agreed with his policies or not, the stock market loved Trump during his first term in office. The S&P 500 grew at a blistering clip of 64% during his first presidency, averaging roughly 16% per year.1 Tech stocks led the charge, soaring 166%, while Bitcoin posted an eye-popping 3,000% jump.1 Though the U.S. dollar weakened in relative value, as seen by the DXY index, that wasn’t surprising – and sounds familiar to those who have kept tabs on the U.S. dollar index so far this year.
The bond market, on the other hand, did not enjoy the same rally throughout Trump’s first term. Treasury yields were higher across the board by end of 2019 (excluding the COVID-era disruptions), signaling investor caution. 2 The tax cuts proposed in the Tax Cuts and Jobs Act of 2017 appeared to increase investor appetite for risk, leading to a further selloff of bonds. 3 Expectations of lower corporate taxes and reduced regulation under the bill helped drive the stock market higher, as reflected in the strength of the DXY index. Meanwhile, Trump’s tariff uncertainty and growing deficits from expansive fiscal policies led to an
TRUMP’S FIRST TERM EFFECTS
increase in Treasury issuance, putting downward pressure on bond prices and pushing yields even higher. 4 To anyone following financial news during Trump 2.0, you can see the parallels.5
TRUMP RETURNS
That takes us to Trump’s 2024 re-election, giving him a second chance at many of the policies he dabbled with in his first term. One of his first moves was the “America First Trade Policy” memorandum, in which he addressed his administration’s desire to review and reassess the U.S. trade policy, which emphasized reducing trade deficits, onshoring U.S. manufacturing and strengthening the country’s national security. 6
On February 1, he established a 25% tariff on imports from Mexico and Canada, then levied a 10% tariff on all Chinese goods. 7 Tariffs were paused briefly for negotiation, but when no deals were reached, they resumed on March 4. This prompted retaliation from Canada and China, while Mexico opted to continue negotiating.
Then came April 2 — “Liberation Day” — when Trump unveiled a slew of new tariffs across more than 180 foreign countries. 8
A blanket 10% global tariff began on April 5. Then on April 9, more severe tariffs were activated for 57 of the United States’ major trading partners. Some highlights include:8
• 34% tariff on all goods from China
• 20% on all exports from the EU
• 24% on Japanese goods
• 25% on South Korean goods
Trump also doubled down on the EU, threatening an additional 25% increase on steel, aluminum and auto if no deal was struck before June 1.9 Throughout the following month, China and the U.S. would appear to play a game of tariff chicken, culminating in a whopping 145% on all Chinese imports bound for the U.S. That is enough tariff talk to make any economist’s head spin. A deal was made with China around May 12 that set a
90-day truce on trade war escalation between the two countries, reducing the effective tariff rate from 145% to 30%. Meanwhile, Trump doubled the steel tariffs on the EU from 25% to 50%.9
So, who is paying for all of these tariffs?
Like all tough questions, the answer usually is: it depends. One of the factors at play is the type of product and who is using it. Tariffs on intermediary goods — like steel — usually affect businesses more than consumers. The end consumer may see some change in prices, but it will largely — in the short term — be absorbed in the cost of goods sold. Inversely, some direct-to-consumer products, especially from China, already appear to be showing price increases. Chinese Amazon executives mention their largest sellers looking to increase prices directly for goods shipped to the U.S., while others have thought about pausing operations in the U.S. entirely while searching for less costly markets.10 Amazon executives have even proposed breaking the tariff costs out on the checkout page, showing exactly how much of the cost was passed along to the customer, although this was shut down by the Trump Administration.11 Walmart has also warned of direct price hikes, citing disruptions to supply chain operations.12
Official data has been mixed — but Federal Reserve surveys show many firms — from New York to Atlanta — have either passed or plan to pass tariff-related costs on to consumers, with about 20% passing on all costs associated with the tariffs.13
INFLATION
Usually, with price hikes come inflation worries. In June, the president of the Richmond Fed Thomas Barkin warned of renewed price pressure — though later clarified it wouldn’t rival recent inflation spikes.14 Despite his comments, recent PCE Price Index data shows that inflation continues to cool — with April’s reading of 2.2% the lowest since 2021 — and May inching up slightly to 2.3%.15
Daily, Jan. 20 to June 3, 2025
AVERAGE EFFECTIVE TARIFF RATE
20% tariff on China; 25% on Canada and Mexico 10% tariff on China
10% worldwide baseline tariff; 25% auto tariff
UK trade deal; Chinese tariffs paused
Court invalidates emergency tariffs; reversed on appeal 15.6%
Most members of the Fed Board of Governors do not believe we will see the impact of price hikes on the inflation reports.16 Moreover, some are looking toward “front loading” as an explanation, where consumers and purchasing managers were buying goods in excess in anticipation of tariffs going into effect. Evidence for this theory can be found in the US Retail Sales report for the month of April, which surged upward 1.7%.17
TRADE NEGOTIATIONS: A WORK IN PROGRESS
The only major economically impactful nation that Trump has signed a trade agreement with has been the UK. After softening some of the initial tariffs (28% to 10% on cars and adding maximum quota caps),18 the U.S. was able to finalize a deal. Additionally, a 90-day truce with China proved to be a positive development, reducing the massive 145% tariffs to around 30%.19
• India appears to be the next likely trade deal candidate after PM Modi has met with Trump.
• Additionally, spokespeople in the administration have stated they are working with Japan, the EU, Canada, South Korea, Vietnam, and more. 20
With the reciprocal July 9 tariff deadline looming large, Trump’s team is trying to ink deals as soon as possible to avoid another tariff shock.5
MARKET REACTIONS
As expected, markets have reacted sharply. Immediately after “Liberation Day” (April 2) markets went into a freefall. The S&P 500 fell 4.9%, while the Nasdaq dropped 6%, the worst day since 2020. The sectors that were the most impacted included the most import-heavy and tariff-sensitive industries, such as retail, tech, and small caps. 21 Yet the Nasdaq and S&P rebounded
Sources - Data: Budget Lab at Yale; Chart: Axios Visuals
rapidly in May and June during the tariff pause — hitting alltime highs — and continued to push upward.
It was a different story for bonds.
• Treasury yields spiked due to the unstable environment. 2
• Longer-term yields increased due to higher long-term inflation expectations and were compounded by the market expectation of delayed rate cuts. 22
• Furthermore, foreign investors began selling off their Treasury holdings, causing prices to fall and yields to rise. 22
Trump’s $4 trillion “One Big, Beautiful Bill” seemed to fuel deficit concerns, worrying investors about new inflation risks and the overall financial health of the United States government. In practice, as long-term yields rise, so do borrowing costs. This affects businesses, especially small ones, as higher borrowing costs can flow directly to their bottom line. Consumers are often impacted too, with rising rates on mortgages and auto loans, which are often tied to long-term Treasury yields.
LOOKING AHEAD
Trump’s second term has reintroduced tariffs as a central policy tool, reshaping the global trade landscape. While intended to rebalance trade relationships and promote domestic manufacturing, the 2025 tariffs have introduced global volatility and uncertainty. 23 While it remains to be seen just how much of an impact this will have on domestic businesses and consumers, the recent effects have been somewhat muted. The stock market seems to have proven surprisingly resilient, rebounding from initial shocks to reach record highs, 21 but tariff-sensitive sectors continue to remain anxious.
Bond markets may reflect deeper concerns, with rising yields fueled by inflation fears and fiscal instability. Ongoing negotiations with key trade partners — including Japan, India, and the EU — highlight the foreign response to U.S. economic assertiveness and the careful equilibrium between protectionist policies and globalization. As we move into the second half of 2025, the success of Trump’s tariff strategy will hinge not only on diplomatic breakthroughs abroad, but also on the ability of the U.S. economy to remain resilient amid trade tensions.
The critical question is whether American businesses can absorb the short-term pressures before new agreements are secured — or if those pressures will continue to build until we see a red, white and blue explosion.
SOURCES
Y-Charts Nov 2016 through Nov 2020 – S&P 500
US Treasury Yield Curve, Retrieved July 2025.
The Wall Street Journal – Bond Market Sends Warning to Trump and Republicans on Tax Plans
Seeking Alpha – The Impact of the Tax Cut on the Bond Market
Tax Foundation – Trump Tariffs: Tracking the Economic Impact of the Trump Trade War
The White House – America First Trade Policy
The Wall Street Journal, July 2025 – Where Things Stand with Trump’s Tariffs
The White House, July 7, 2025 – Fact Sheet: President Donal J. Trump Continues Enforcement of Reciprocal Tariffs and Ann ounces New Tariff Rates.
AP News, June 3, 2025 – Trump’s Tariffs Have Launched Global Trade Wars. A Timeline of How We Got Here.
Reuters – Exclusive-Chinese Sellers on Amazon to Hike Prices or Exit U.S. as Tariffs Soar Time, April 29, 2025 – In Fight with Bezos, White House Calls Amazon Showing Tariff Costs a ‘Hostile’ Act
Investopedia – Who Is Paying for Trump’s Tariffs?
CBS News – The Trump Tariffs Aren’t Causing U.S. Prices to Spike. Here’s Why.
Reuters – Fed’s Barkin Says Tariffs Will Start Pushing Up Inflation Bureau of Economic Analysis: Personal Consumption Expenditures Price Index
Reuters – June 24, 2025 – Powell Repeats Rate Cuts Can Wait as Fed Studies Tariff Impacts
United States Census Bureau June 17, 2025 – Advance Monthly Sales for Retail and Food Services.
The Guardian, May 8, 2025 – UK Politics: Tariffs Cut on UK Cars, Steel and Aluminum in US Trade Deal
PBS News May 12, 2025 – Dow Leaps 1,100 Points Following a 90-Day Truce in the U.S.-China Trade War
PBS News, April 6, 2025 – Trump Advisers Say More than 50 Countries Have Reached Out for Tariff Talks with White House
Y-Charts 2025 – S&P 500
The Wall Street Journal July 8, 2025 – Treasury Yields Keep Rising Amid Tariffs Concerns
EY, April 3, 2025 – What Are the Implications of US President Trump’s Reciprocal Tariffs on Global Trade
SECOND QUARTER EQUITIES
Have you ever heard the investing adage that "the stock market climbs a wall of worry?" Well that certainly held true in the 2nd quarter of 2025.
David McGrath, CFA
The performance of the stock market in Q2 is even more impressive given the environment and backdrop at the end of Q1. On February 19, 2025, the S&P 500 made a new all-time high.1 But momentum quickly faded. The health of the U.S. consumer came into question following a weak earnings report from Walmart, and in March—the final month of the first quarter—the S&P 500 declined 5.7%, falling 10% from its February peak. Additional signs of consumer softness quickly followed, further clouding the outlook. 2
Liberation Day
The reciprocal tariffs announced on April 2 sent the stock market into an even deeper spiral.3 How would a fatigued U.S. consumer handle massive tariff-related price hikes? Many economists soon started calling for a recession —and the market took notice. Just 5 trading days after the Liberation Day announcement, the S&P 500 found itself down over 15% year to date.4
Relief came on April 10, when the White House announced a 90-day pause on reciprocal tariffs, easing pressure on the markets.5 From there, the stock market handled what seemed to be a barrage of headlines regarding the off-again, on-again status of multiple trade deals. And as if the tariff uncertainty were not enough to rattle the markets, rising problems in the Middle East — specifically between Israel and Iran — likely added fuel to the fire. Yet 12 straight days of rockets and bombs did not seem to have any negative effect on equity prices. In my opinion, the climbing of the “wall of worry” was underway.
The S&P 500 ended the quarter with a 10.9% gain.4 The risk-on feeling from investors propelled the tech-heavy NASDAQ to a return of 18%. Mid-cap (6.3%) and small-cap (4.4%) indices delivered sound returns but underperformed their large-cap peers. 4 Recession fears, sparked by tariff-related price increases, seemed to prompt investors to lower their exposure to those smaller stocks that typically underperform during downturns.
International equities held up relatively well. The EAFE index showed another solid return in the 2nd quarter, returning 10.6%. 6 After significant outperformance in the 1st quarter compared to all domestic stock indices,4 international markets continued to shine in 2 nd quarter.
The S&P 500 performance was led by the Technology sector, up 23.5% return.4 Strong rebounds by NVIDIA, Microsoft and Broadcom led the move in tech. Other stand-out sectors included Communication Services (18.2%), Industrials (12.6%) and Consumer Discretion (11.3%). 4
The tensions between Israel and Iran helped to briefly push oil prices higher, but by quarter’s end, crude had retreated from its highs.7 Oil prices spent the majority of the past three months between the upper $50s and lower $60s per barrel, well below Q1 levels.7 That drop seemed to weigh heavily on energy stocks. After having the strongest return of any economic sector in Q1, Energy finished Q2 at the bottom, posting a -9.4% return. 8
Healthcare was the other sector that seemed to struggle in Q2. While the weakness was broad — standouts like Eli Lilly and Johnson & Johnson both posted negative returns — it was the performance of UnitedHealth that appeared to put the most downward pressure on the sector .9,10,11 UNH, one of the largest stocks in the S&P 500, declined by just over 40% during the quarter.11 That performance made an already weak stretch for Healthcare into a seemingly miserable one, with a loss of 7.6% over the past three months.12
Source: Bloomberg, July 2025
The 1st quarter earnings season — ultimately much stronger than most analysts predicted — was consumed with concerns around the new tariff policy, and how companies and consumers might react. In many cases, a very solid earnings report was coupled with a downward revision to future earnings expectations. The large cloud of uncertainty that set over the economy seemed to give companies cover to bring down full-year earnings expectations.13
And they did.
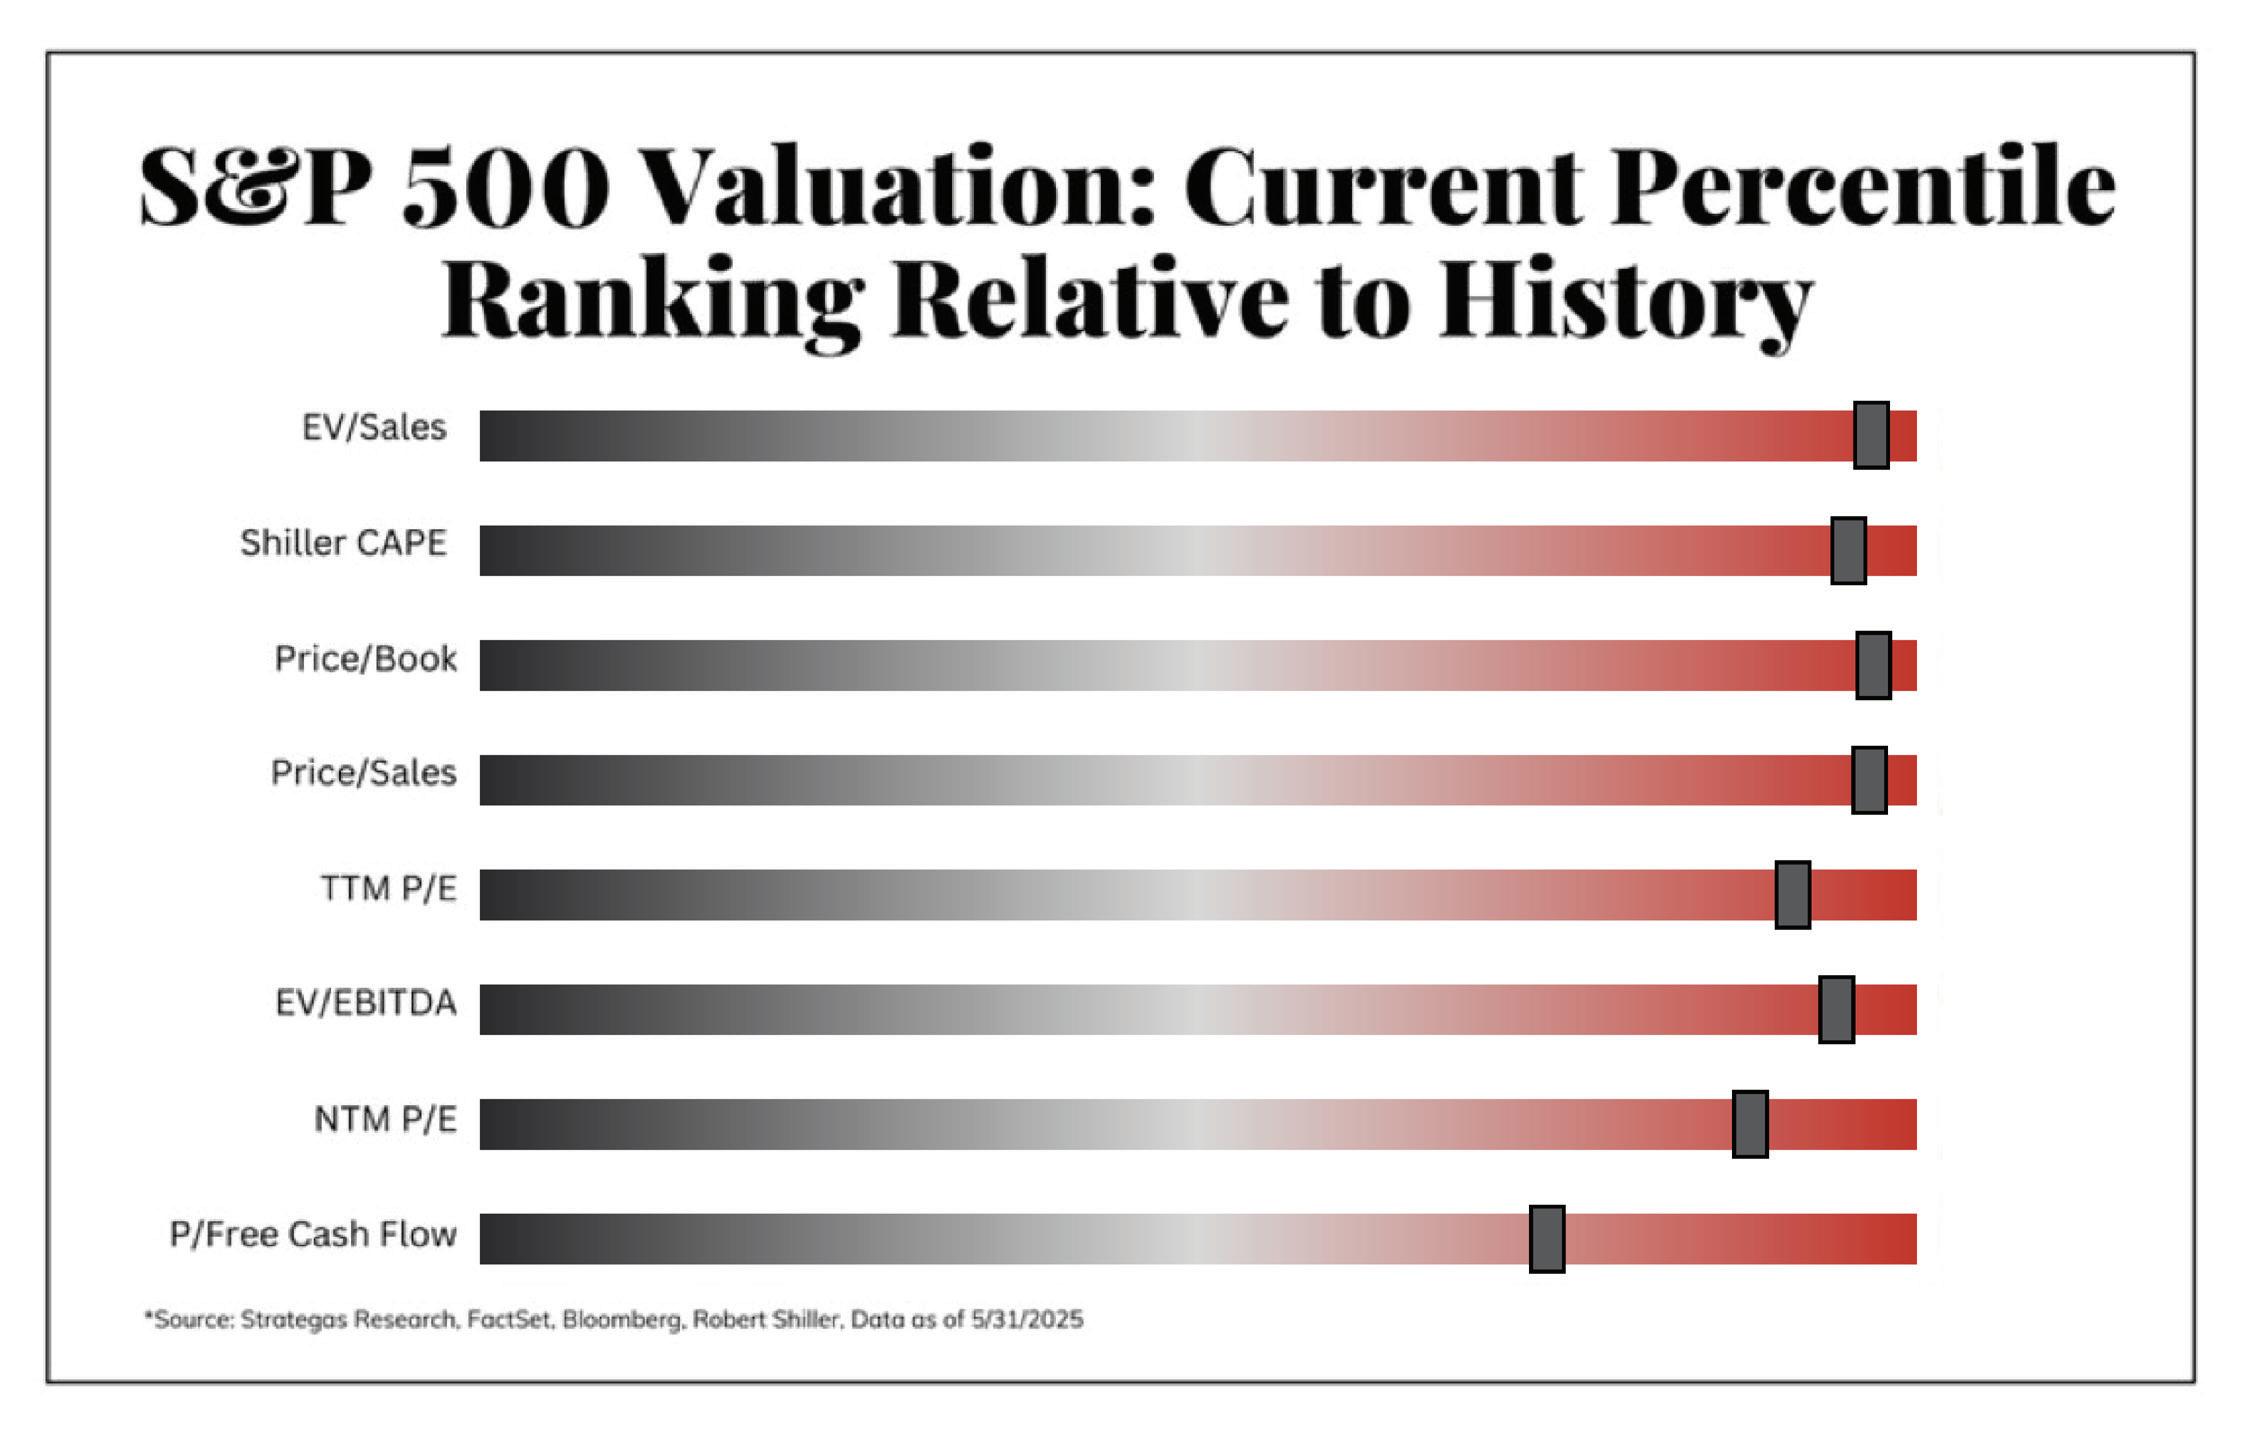
As the 2 nd quarter began, analysts expected the S&P 500 to record $270 in earnings for 2025.14 But even after 1st quarter earnings came in at $63.07 —well above the $60 estimate — full-year earnings expectations now sit at $263. At a closing price of 6,204.95, the S&P 500 is now trading at a P/E ratio of 23.6 times this year’s expected earnings.14 By almost any valuation measure, it appears that the S&P 500 is starting to look expensive.
S&P 500 VALUATION: CURRENT PERCENTILE RANKING RELATIVE TO HISTORY
Keep in mind, valuation is not always a great predictor of short-term market moves. As John Maynard Keys famously said: “The market can remain irrational longer than you can remain solvent.” The stock market is a leading economic indicator, meaning it will move higher before you will likely start to see improvement in the actual economy, and before earnings estimates catch up.
It is important, however, to understand current valuations in order to better appreciate potential downside risk. A recession that strikes with a market trading at 18 times earnings will react very differently from a market trading at 30 times earnings.
With the fear of tariff-related price increases in the pipeline, the 2nd quarter saw surprisingly strong economic activity. The high-end consumer, who now appears to control more and more discretionary income, acted before price increases could be implemented, making large purchases in the 2 nd quarter. Auto sales, for example, were as strong as when COVID supply chain issues and low interest rates created a car buying flurry back in 2021.14
That strong economic activity appears to have helped support the labor market as well. The tariff “nightmare scenarios” that were all over the news in early April included fears of a spike in unemployment numbers. That, thankfully, did not occur in the 2nd quarter. With an unemployment rate of 4.2% and wages increasing by 4.72% annually, the economy hardly looked miserable.15 We expected to see solid spending by the consumer, and that seemed to be the case over the past three months.
LOOKING FORWARD
Expectations for 2nd quarter S&P 500 earnings have fallen to $62.64 —a relatively low bar for the market to clear.14 What may be more interesting is the outlook for the second half of the year. Do companies see the consumer remaining strong in the last 6 months of 2025, or was some of the Q2 strength just sales that were “borrowed” from the 3rd and 4th quarters? Those 2 nd quarter earnings announcements may give us some clues.
Another key development in the 3rd quarter is that Liberation Day 90-day delay on reciprocal tariffs is set to expire.5 Will we see new long-term trade deals announced, another extension or an escalation of tariff rates?
The Federal Reserve will be watching closely. With core inflation numbers cooling down the past few months, it is my opinion that the potential inflationary effects of the new tariff policy is the main reason the Fed has not cut interest rates this year. If we get more clarity on the tariff picture moving forward, the Fed could have the ability to lower interest rates in the 3rd quarter.
Finally, can the labor market remain unbelievably resilient? There seem to be small signs of cooling, but that does not necessarily mean we are on the verge of a spike in unemployment rates. I think it is fair to say both the labor market and economy are slowing, but with some potential help from the Fed in the form of anticipated falling interest rates. In other words, things are seemingly good, just not necessarily great.
For investors, the greater concern may be where the earnings growth will come from. The stock market can move higher when either earnings increase or stocks trade at a higher multiple. So far in 2025, the market’s gains have all come from multiple expansion. In my opinion, it would be nice to see earnings’ momentum come in to support the impressive rally we’ve seen over the past 10 weeks. We seem to have climbed the wall of worry, now it is time to see improving fundamentals support that view from the top.
SOURCES
Reuters February 2025 – S&P 500 Ekes Out All-Time Closing High as Fed Minutes Eyed
CNBC April 2025 – Dow Nosedives 1,600 Points, S&P 500 and Nasdaq Drop the Most Since 202 after Trump’s Tariff Onslaught
NPR April 2025 – Markets Plunge After ‘Liberation Day’ Tariffs
Y-Charts 2025 – S&P 500
CNBC April 2025 – Global Markets Soar on Trump Tariff Pause
Y-Charts July 2025 – MSCI EAFE
CNBC April 2025 – Oil Prices and News
Y-Charts July 2025 – S&P 500 Energy (Sector)
YCharts. “Eli Lilly (LLY) – Price & Performance.
YCharts. “Johnson & Johnson (JNJ) – Price & Performance.
YCharts. “UnitedHealth Group (UNH) – Price & Performance.
Y-Charts July 2025 – S&P 500 Health Care (Sector)
Yardeni Research April 2025 – S&P Earnings & The Economy
Yardeni Research April 2025 – YRI Earnings Outlook
YCharts. US Total Vehicle Sales
YCharts. US Unemployment Rate
SPECIAL REPORT: IRAN’S ROLE IN THE GLOBAL ENERGY MARKET
Resource-rich but revenue-poor, Iran still holds sway over global energy markets—and the power to rattle them.
Chris Cooper
IRAN’S OIL GRIP: UNDER THE RADAR, OVER THE BARREL
If you’re only looking at production numbers, Iran might be dismissed as a second-string energy player – outpaced by Saudi Arabia, sidelined by sanctions and mostly boxed out of global markets. However, there may be more than what meets the eye at first glance.
• By the numbers, Iran owns the fourth-largest proven crude oil reserves on Earth – 157 billion barrels – and it’s only behind Russia when it comes to natural gas.1
• Around 4% of global oil output and a staggering 18% of global gas reserves belongs to Iran. Quantity may not be the problem. 2
• In 2024, Iran pumped out roughly 3.3 million barrels per day (bpd) – short of the 4 million+ bpd it is capable of. 3
It’s geopolitics that seem to be getting in the way of Iran unleashing its liquid gold onto the market. Since 2010, U.S.-led sanctions aimed at damaging Iran’s nuclear advancements have
seemingly crippled the country’s economic potential, blocked access to Western tech and prevented Iran from playing in the big leagues of global exports.
In my view, Iran was never going to retreat quietly from the global energy game. Iran still moves more than 1.4 million bpd through the so-called “gray markets,” i.e., ship-to-ship transfers, reflagged tankers and backdoor deals with countries like China. It operates like an underground oil economy, and it brought in an estimated $50 billion in 2023. 4 Less than what the country is fully capable of, and still a shadow of what Iran could rake in on the open market.
U.S. INSULATED – BUT NOT IMMUNE
Location, location, location. Iran’s geographical advantages may extend beyond the fact that it is sitting atop one of the world’s most resource-rich geographies. Situated alongside the Strait of Hormuz, Iran hugs one of the world’s most important oil bottlenecks. Roughly 20% of the planet’s petroleum and a large chunk of Liquefied Natural Gas (LNG) flows through this narrow passage every day.5 It’s seemingly the financial artery for oil exporters such as Saudi Arabia, UAE, Iraq, Kuwait and Qatar. Iran can likely control the flow and has recently threatened to close the access point if geopolitical tensions rise. 6
Just the threat of disruption can send global markets into a frenzy. This past month, tensions flared after an Israeli-Iranian escalation — oil prices jumped to nearly $78 per barrel, up from the mid-$60s just weeks earlier. 7 Analysts estimate that even a limited disruption in Hormuz could tack on $8 to $30 per barrel. A full shutdown could send crude skyrocketing to $130, depending on the length and severity. In this case, anyone who purchases crude oil on the open market may be punished with higher prices… so everyone could be at risk of higher prices. 8
Would Iran truly benefit from aggravating the entire world with higher energy prices? Consider the fact that China — one of Iran’s allies — receives nearly 45% of its oil through the Strait of Hormuz, compared to only 8% for the U.S.9 So, everyone likely pays higher prices and an ally’s supply is drastically reduced,
potentially causing a short-term supply shock. A severe enough price shock for the Chinese Communist Party doesn’t just mean potentially pricier fuel — it could derail China’s already fragile post-COVID economic recovery. Yes, Iran could introduce havoc into global oil markets, but what does Iran stand to gain?
Europe could also be in trouble. Following the Russia/Ukraine war, many EU nations reduced their dependency on Russian energy and shifted to Middle Eastern suppliers. If Hormuz becomes a chokepoint, Europe’s manufacturing, transport and inflation outlook could take a direct hit. The European Central Bank, already juggling inflation and recovery, may have to pivot once again toward tighter monetary policy if energy prices surge and inflation reaccelerates.
So where does that leave the U.S.? Believe it or not, it is now the world’s top oil producer.10 The shale boom helped make the U.S. more insulated from foreign supply shocks — although oil remains a global commodity. Even with U.S. output rivaling that of the second through fourth largest producers in the Middle East combined (excluding top producer Saudi Arabia), the region still plays a major role in controlling oil prices — impacting the entire world. If tensions rise in the Middle East, you’re still likely going to pay more at the pump in Kansas.11
THE DOMINO EFFECT: INFLATION, GROWTH AND DEBT
A global oil price spike doesn’t just hit gas stations. It fuels inflation, forces central banks to consider interest rate hikes and slows down economic growth. For developing nations, the impact may be even worse. These countries often import most of their oil, and when prices soar, they’re stuck between cutting subsidies or blowing up their budgets. Some may face balanceof-payments crises, debt distress or even civil unrest.
To be sure, oil exporters such as Saudi Arabia, UAE and Iraq should love the extra revenue when prices spike. Even Iran, sanctions and all, may benefit from higher prices. But if tensions
spiral into widespread military conflict and economic sanctions, exporters will likely suffer from logistical breakdowns and market instability. Petrostates, in my opinion, need stable markets and societies to enjoy the benefits of their profits.
Uncertainty may also play a role in increasing investor anxiety, which can have a quick effect on the markets. When energy
headlines heat up, oil and gas stocks usually rally, and the rest of the equity market usually declines. Investors tend to shift into safe-haven assets like U.S. Treasuries, the U.S. dollar and gold. Central banks may be forced into uncomfortable decisions, especially in emerging markets, where global liquidity acts as a lifeline.
THE IRANIAN PARADOX
Even though there is ample risk, Iran, for all its resource wealth, remains boxed in. It hasn’t broken into the LNG game, it can’t secure foreign capital at scale, and even its Chinese and Russian friends tread carefully to avoid tripping over secondary U.S.led sanctions. Iran recently considered these challenges and
decided not to close or even reduce traffic in the strait. 6 Instead, the Islamic Republic of Iran may seek diplomatic deescalation efforts, which could benefit their economy. If sanctions were to be lifted, Iran could swiftly ramp up output, upgrade its infrastructure, and — given its vast natural gas reserves —
position itself as a formidable contender in the global LNG market, potentially rivaling Russia in the space. Obviously, the state of the Middle East remains fluid and, as of the time of this writing, no peace or economic deals have been set in stone.
For now, Iran seems to sit in a strange situation: resource-rich but revenue-poor, constrained in exports but commanding opportunities.
In my view, the real story isn’t just about energy production — it’s about how much tension a single chokepoint can create. Iran still seems to have the ability to rattle markets with a headline and may remain one of the most underappreciated forces in global finance. As we’ve seen time and time again with energy prices, you don’t always need to swing for the fences — sometimes just a threat can create market volatility and shake investors.
BP Statistical Review of World Energy (2023)
U.S. Energy Information Administration (EIA)
OPEC Monthly Oil Market Report – May 2025
Reuters – Iran’s “gray market” oil sales to China in 2023
U.S. EIA - Strait of Hurmuz Chokepoint Analysis (updated 2023)
Reuters – Iran’s options include closing Strait of Hormuz (June 2025)
Wall Street Journal – Middle East conflict pushes oil prices higher (June 2025)
Investors Business Daily – Strait of Hormuz crisis analysis
China’s Dependency on Strait of Hormuz:
US top producer of oil
Inflationary pressure from oil price spikes
ASSET ALLOCATION
Volatility returned in the second quarter, and with it… opportunity.
Sam Clement
I wish I could say, “What a great quarter to unplug from the markets.” But the 2 nd quarter of 2025 seemed to be one of the more exhausting in recent memories — at least dating back to the mini banking crisis of 2023, or even the onset of COVID. However, given the nature of what we do, unplugging simply is not an option!
The 2 nd quarter, while exhausting, was ripe with opportunities. Volatility is a gift to long-term focused investors and that is exactly what we are. The quarter essentially kicked off with the
“Liberation Day” tariff announcement from the president and wrapped up with a full-on war between Israel and Iran (with the help of the United States).
POSITIONING & REBALANCING
In looking back on our allocations for the 2 nd quarter, I would be remiss if I didn’t recap the moves our Investment Committee made in the 1st quarter. The theme to start the new year was flexibility. For us, that meant minimizing portfolio volatility without fully exiting the equity markets. This included
reducing our tech allocations and, more notably, small-cap stocks selections. As the volatility around Liberation Day unfolded, countless times I found myself saying, “We expected volatility to pick up — just not to this extent.” However, in my opinion, it matters less in the markets that you are right for the right reasons, and more just that you are right. And in this case, our expectations were accurate and volatility did pick up.
We entered the second quarter with a more defensive posture than in recent years — reducing equity exposure and exiting some of the more volatile positions in order to lower overall portfolio risk. When markets fall under pressure, smallcap equities may tend to amplify negative headlines with heightened volatility.
The pullback following the tariff announcement was swift — followed closely by an equally fast market rebound. This activity gave us an extremely narrow window to act. The drop created a unique opportunity to act on the dry powder and flexibility we had created in the 1st quarter by adding to
domestic large-cap equities. While the metaphorical baby was being thrown out with the bath water, the sharp reduction in multiples almost overnight seemed to be too good for us to pass up and as a result, we got to work buying.
EQUITIES AND FIXED INCOME
As a result, we decreased our short-term fixed income weighting (which had been added to in the 1st quarter) and brought our equity weighting back up close to neutral from a slight underweight. Even with the market’s recent bounce back, there may still be some real concerns hanging over the market. We don’t feel the economy is falling off a cliff, but in our opinion, it’s clearly not hitting on all cylinders. This puts a high bar on where earnings need to go from here to justify current valuations.
While the pullback gave us a chance to get in at better prices, the road ahead still seems uncertain. It has typically been a market that has rewarded patience, solid fundamentals and maybe a bit of caution, too.
There is an old saying that markets tend to take the elevator down and the stairs up. But in recent years, we have seen evidence that the market can take the elevator both ways: the sharp decline in the markets unfolded over just a few days, with the rebound coming just as quickly.
INTERNATIONAL POSITIONING
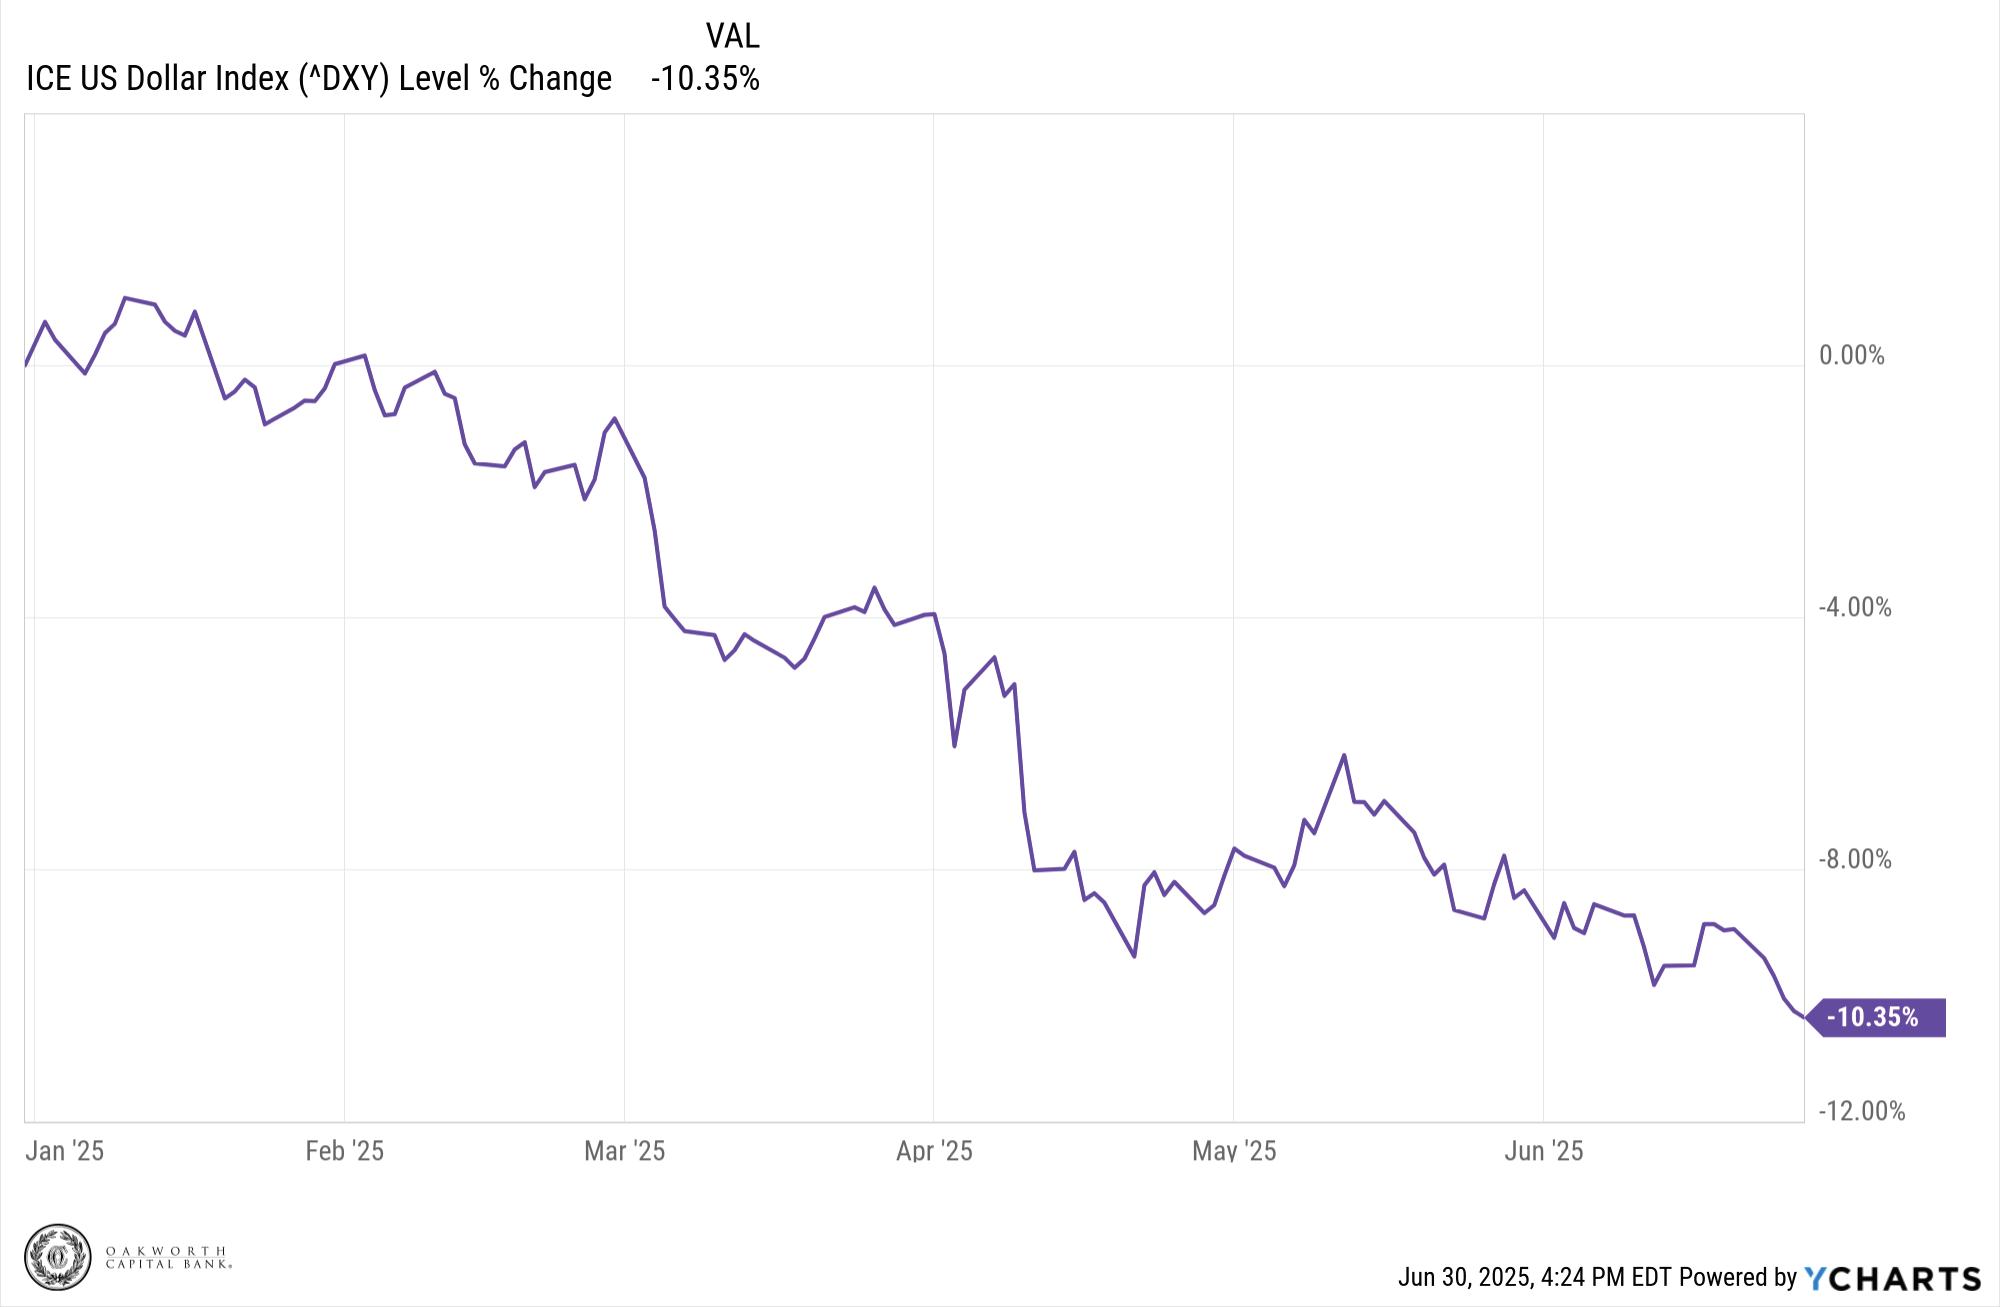
Another subtle theme of the 2 nd quarter was continued weakness in the U.S. dollar, beginning in Q1 and ending the halfway mark down roughly 10%. International equities, which outperformed in Q1, continued to benefit throughout the 2 nd quarter. In response, we reduced our underweight to international exposure – though carefully.
We continue to maintain our opinion that domestic markets offer more long-term potential, but in the short term, international equities have outperformed — supported by a weaker dollar and increased stimulus, largely in western Europe.
THE DOLLAR CONTINUES TO DIP
Source: YCharts
FIXED INCOME
Fixed income continues to be the ballast of our portfolios. We don’t like to expose ourselves to risk in this space so we have continued to maintain a high-quality, short-duration portfolio that continues to benefit from elevated yields as the Federal Reserve continues to hold off on rate cuts.
LOOKING AHEAD
While we are biased toward equities in the long run, the short-term outlook is more complex. Headwinds such as a softening economy and elevated earnings expectations have created an environment where we still value flexibility and optionality. Our additions to equities in our portfolios in Q2 were thoughtfully made with a long-term view that also understands these headwinds.
We may not have expected the volatility to be as significant as it was in the 1st quarter, but it served as a powerful reminder of the benefit of dry powder. We still have a cautious view of what the remainder of the year is going to look like and will adjust our portfolios in both directions, depending on which way the volatility goes. As always, we will continue to focus on what the future holds and how that forecast may impact our clients’ portfolios. While there seem to be many unknowns this year, there is still plenty to be optimistic about. Our team will stay laser focused on capturing opportunities as they present themselves.
THIRD QUARTER PREDICTIONS
Border crossings, tariff trade-offs, easing home prices, expected rate cuts, geopolitical tensions and brewing pressure in the beer industry top our Investment Committee’s list of predictions for the remainder of 2025.
• With illegal border crossings decreasing and self-deportation on the rise, the U.S. economy could eventually see an overall decrease in consumer demand — either from fewer people consuming goods or lower-than-expected population growth. Obviously, this could have a negative impact on the Gross Domestic Product (GDP) equation.
• The administration’s tariffs may not be as inflationary as many fear. In a potential worst-case scenario, Americans may spend more on essentials, leaving less money to spend on everything else. As such, unless there is a sudden increase in the money supply, decreased consumer demand for ‘elastic’ goods and services may largely offset any price increases on essentials.
• Due to a variety of factors, the inventory of existing homes for sale may continue to increase. This could cause the supply of homes to potentially increase faster than the demand for them at current levels. As a result, home prices could start to fall by the end of the year. While it might not be a dramatic decrease in prices, any little bit will likely help potential home buyers.
• The Federal Reserve may start to cut the target overnight lending rate during the 3rd quarter. By then, the Fed may have enough economic data to support being more aggressive in cutting the rate — should it so desire. Will it?
• As the New York mayoral campaign heats up, mainstream Democrats may push for a more moderate candidate to run as an independent against Zohran Mamdani. This race is poised to draw national attention and could signal how far left the Democratic Party is willing to go ahead of the 2026 and 2028 elections.
• Although the U.S. administration has declared an end to the 12-Day War between Israel and Iran, the two warring sides might not completely get the message. As long as Iran remains a theocracy, the risk of renewed escalation may be far greater than the prospect of a lasting peace.
• Anti-ICE protests may likely continue, but with decreasing frequency and severity. The reason is simple: suburbanites, college students and professional protestors may move onto other issues once it becomes apparent the administration is serious and consistent about enforcing current immigration policy.
• The splash around the DOGE initiative will likely be a distant memory by the end of the year. The politicians in Washington may not have the stomach to make the spending cuts necessary to have a meaningful impact on the budget deficit. Of course, this may mean even more debt, which creates the potential for higher interest rates in the future.
• While it is difficult to predict whether gold will continue its recent surge, the conditions that make precious metals attractive will likely remain. These conditions being: excessive debt, bloated bank balance sheets and declining investor confidence in public institutions.
• Market bears have been waiting for the proverbial shoe to drop for a long time. This go-around, the logical suspect is likely crude oil. Should there be a significant supply shock to push WTI crude oil futures above $80/ barrel, we could see domestic investor psyche change quickly and dramatically.
• Europe may struggle with the tough realization that it lacks the hard and soft power it once believed it had. To regain influence, it may have to dramatically increase its military capabilities or unfetter its private sector — preferably both. Unfortunately, it will likely struggle to do either effectively.
• By the end of 2025, it will become increasingly apparent that China is no longer a one-man show. While Xi Jinping is not likely in danger of losing power, other names in Beijing could start to get far more ink on a global scale, notably Premier Li Qiang.
• In an effort to reverse falling sales, mainline beer producers may do something drastic — slashing prices on weak, mass-market American-style Pilsners. A 12pack of the watery stuff seems too expensive for the target market, and the manufacturers appear to have been slow to realize it.
FIND OAKWORTH ACROSS THE SOUTHEAST
Central Alabama Office
850 Shades Creek Parkway
Birmingham, Alabama 35209
Phone: (205) 263-4700
South Alabama Office
1 St. Louis Street, Suite 3200 Mobile, Alabama 36602
Phone: (251) 375-7800
Central Carolinas Office
6000 Fairview Road, Suite 125
Charlotte, North Carolina 28210
Phone: (704) 901-7250
Middle Tennessee Office
5511 Virginia Way, Suite 110
Brentwood, TN 37027
Phone: (615) 760-1000
Advisory Services, including investment management and financial planning, are offered through Oakworth Asset Management LLC a registered investment advisor and is owned by Oakworth Capital Bank, Member FDIC. Investment products and services offered via Oakworth Asset Management LLC are independent of the products and services offered by Oakworth Capital Bank, and are not FDIC insured, may lose value, have no bank guarantee, and are not insured by any federal or state government agency. Because of the ownership relationship and involvement by Oakworth Asset Management LLC associates with Oakworth Capital Bank, there exists a conflict of interest to the extent that either party recommends the services of the other. Oakworth Asset Management LLC does not provide tax or legal advice. You should consult your tax advisor, accountant, and/or attorney before making any decisions with tax or legal implications. For additional information about Oakworth Asset Management LLC, including its services and fees, send for the firm’s disclosure brochure using the contact information contained herein or visit advisorinfo.sec.gov
This communication contains general information that is not suitable for everyone and was prepared for informational purposes only Nothing contained herein should be construed as a solicitation to buy or sell any security or as an offer to provide investment advice. The information contained herein is based upon certain assumptions, theories and principles that do not completely or accurately reflect any one client situation. This communication contains certain forward-looking statements that indicate future possibilities. Due to known and unknown risks, other uncertainties and factors, actual results may differ. As such, there is no guarantee that any views and opinions expressed herein will come to pass. Investing involves risk of loss including loss of principal. Past investment performance is not a guarantee or predictor of future investment performance.
Any reference to a market index is included for illustrative purposes only as it is not possible to directly invest in an index. The figures for each index reflect the reinvestment of dividends, as applicable, but do not reflect the deduction of any fees or expenses, the incurrence of which would reduce returns. It should not be assumed that your account performance or the volatility of any securities held in your account will correspond directly to any comparative benchmark index. This communication contains information derived from third party sources. Although we believe these sources to be reliable, we make no representations as to their accuracy or completeness.
All opinions and/or views reflect the judgment of the authors as of the publication date and are subject to change without notice.