
Ahmet OKUTAN Architect & Engineer
Profile
In line with my Architectural and Engineering education and experience, among the things I can do are architectural project design, energy modelling, BIM, building systems analysis, advanced facade design, building physics consultancy, material analysis, and be inside of integrated operations
Selected Projects
Ahmet Okutan (13-11-1996)
+39 331 344 3733 - ahmetnoyanokutan@gmail.com
Viale Zara 126 – Milan, Italy
Profession: Architect, Engineer, and BIM Specialist
Current position: BIM Specialist in 3-im Virtual Projects Education
Ozyegin University–Bachelor (2014-19)

Architecture (3.36/4.0 GPa)
Politecnico di Milano–Master (2020-23)

Building and Architectural Engineering
Nationality: Turkish

Language Knowledge
Turkish (Mother Tongue)
English, Professional Knowledge
Certification
BIM Specialist - Istanbul Technical University (94/100)

Driving License: B
IT and Software Skills Microsoft Office 365
Autodesk AutoCAD
IESVE Virtual Environment


Autodesk Revit
• 3-im Virtual Projects / Zayed National Museum –Abu Dhabi (10-2022/present)
BIM 3D/2D – back-office architectural drafting
• Avalon Company / Pirelli Service & Storage Complex –Istanbul / Gebze (10-2021/…)


Coordination and management of personnel in the field and in the back office - coordination of BIM architectural partsBIM 3D / 2D - back-office and field consultancy for site management, cost / time management.
• Renaissance Construction / Financial Center TowersIstanbul (06-2020/09-2020)
2D - in the field and in the back office – Detail Application Controller on the Site, 3D – Technical Modeler on back office
• Suryapi Construction / Lavender –Istanbul (06-2017/08- 2017)
2D - back office and field architect for the site after and safety management operations, cost / time management.
• Directorate General of Foundations of Turkiye / Kaptan Pasha Complex – Istanbul - (06-2016/08-2016)
Restoration of Ottoman Palaces. Creating technical drawings of the building, Material and Damage analysis on the building, providing solution offers and applying the approved ones on the site. Coordinating the application process.
Contents confidential, not for distribution
Lumion
McNeel Rhinoceros
Grasshopper for Rhino3D
Adobe Master Collection
References
Ozyegin University - Faculty of Architecture & Design Dean
Prof.Dr.Orhan Hacıhasanoğlu (Dean)
Istanbul Technical Uni. Construction & Geomatics Engineering
Prof.Dr.Tahsin Yomralıoğlu
Politecnico di Milano Building & Architectural Engineering
Prof.Dr.Pierpaolo Ruttico
Prof.Dr.Andrea Vanossi


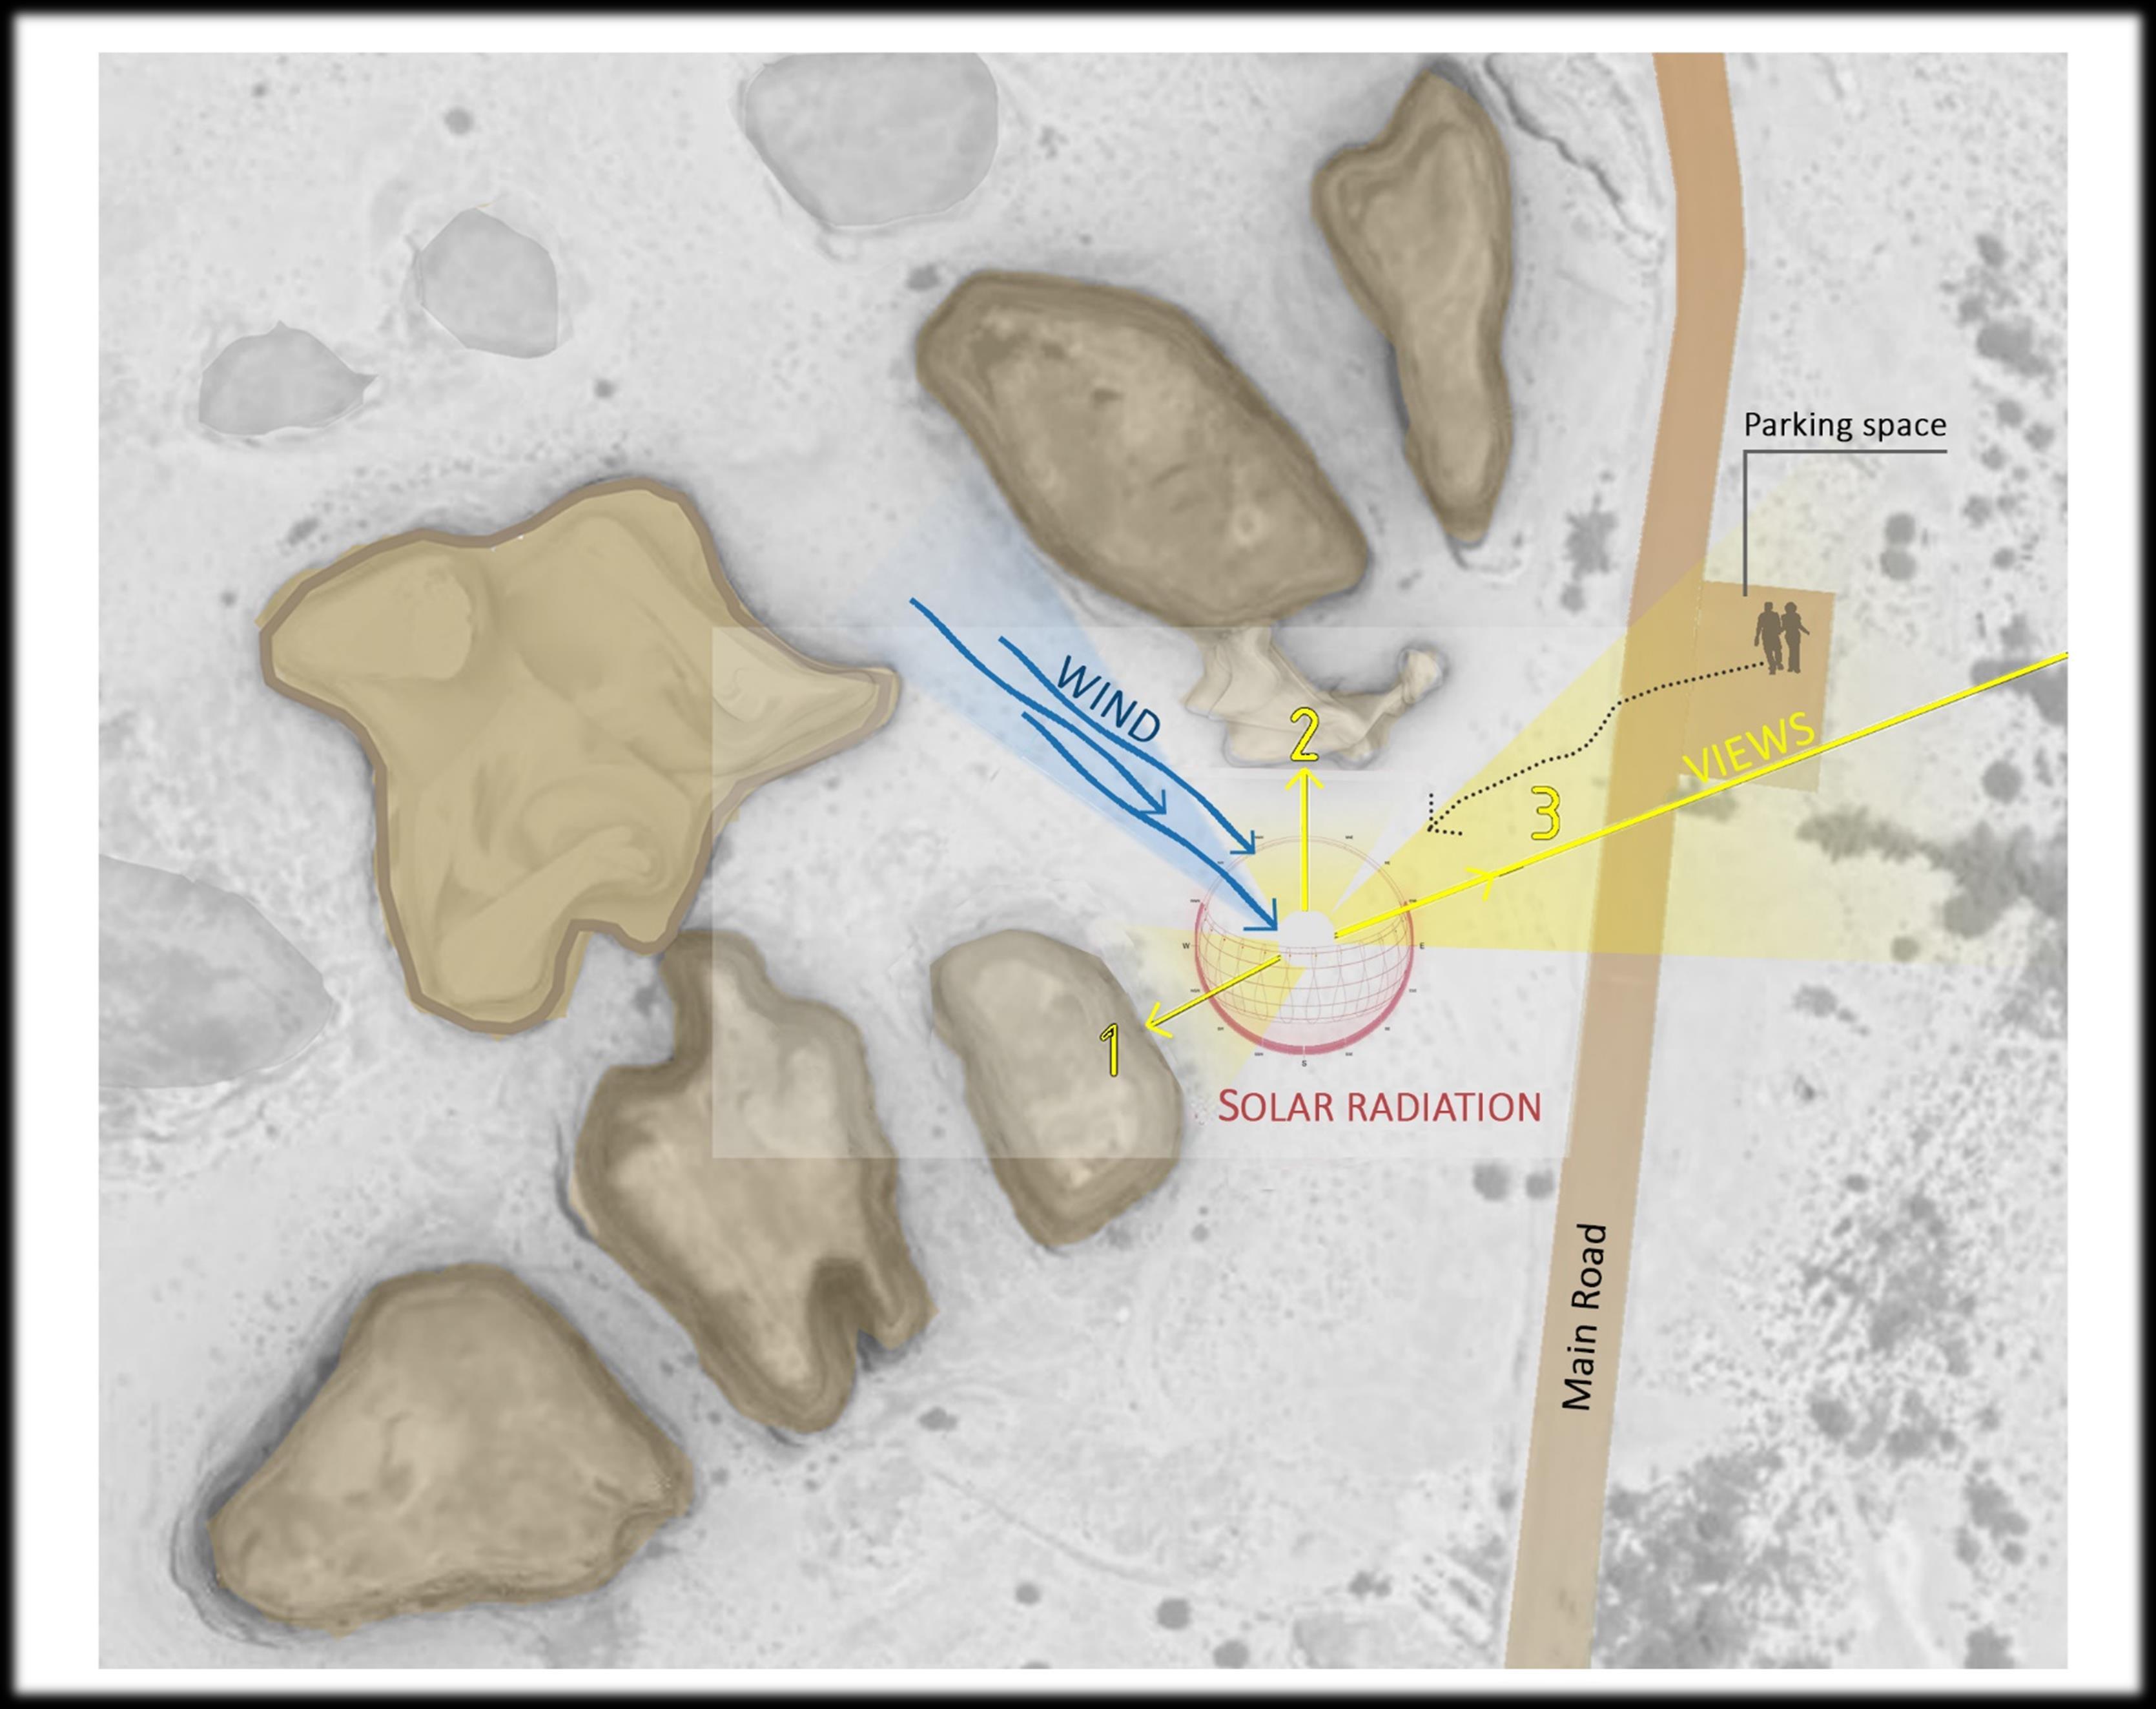
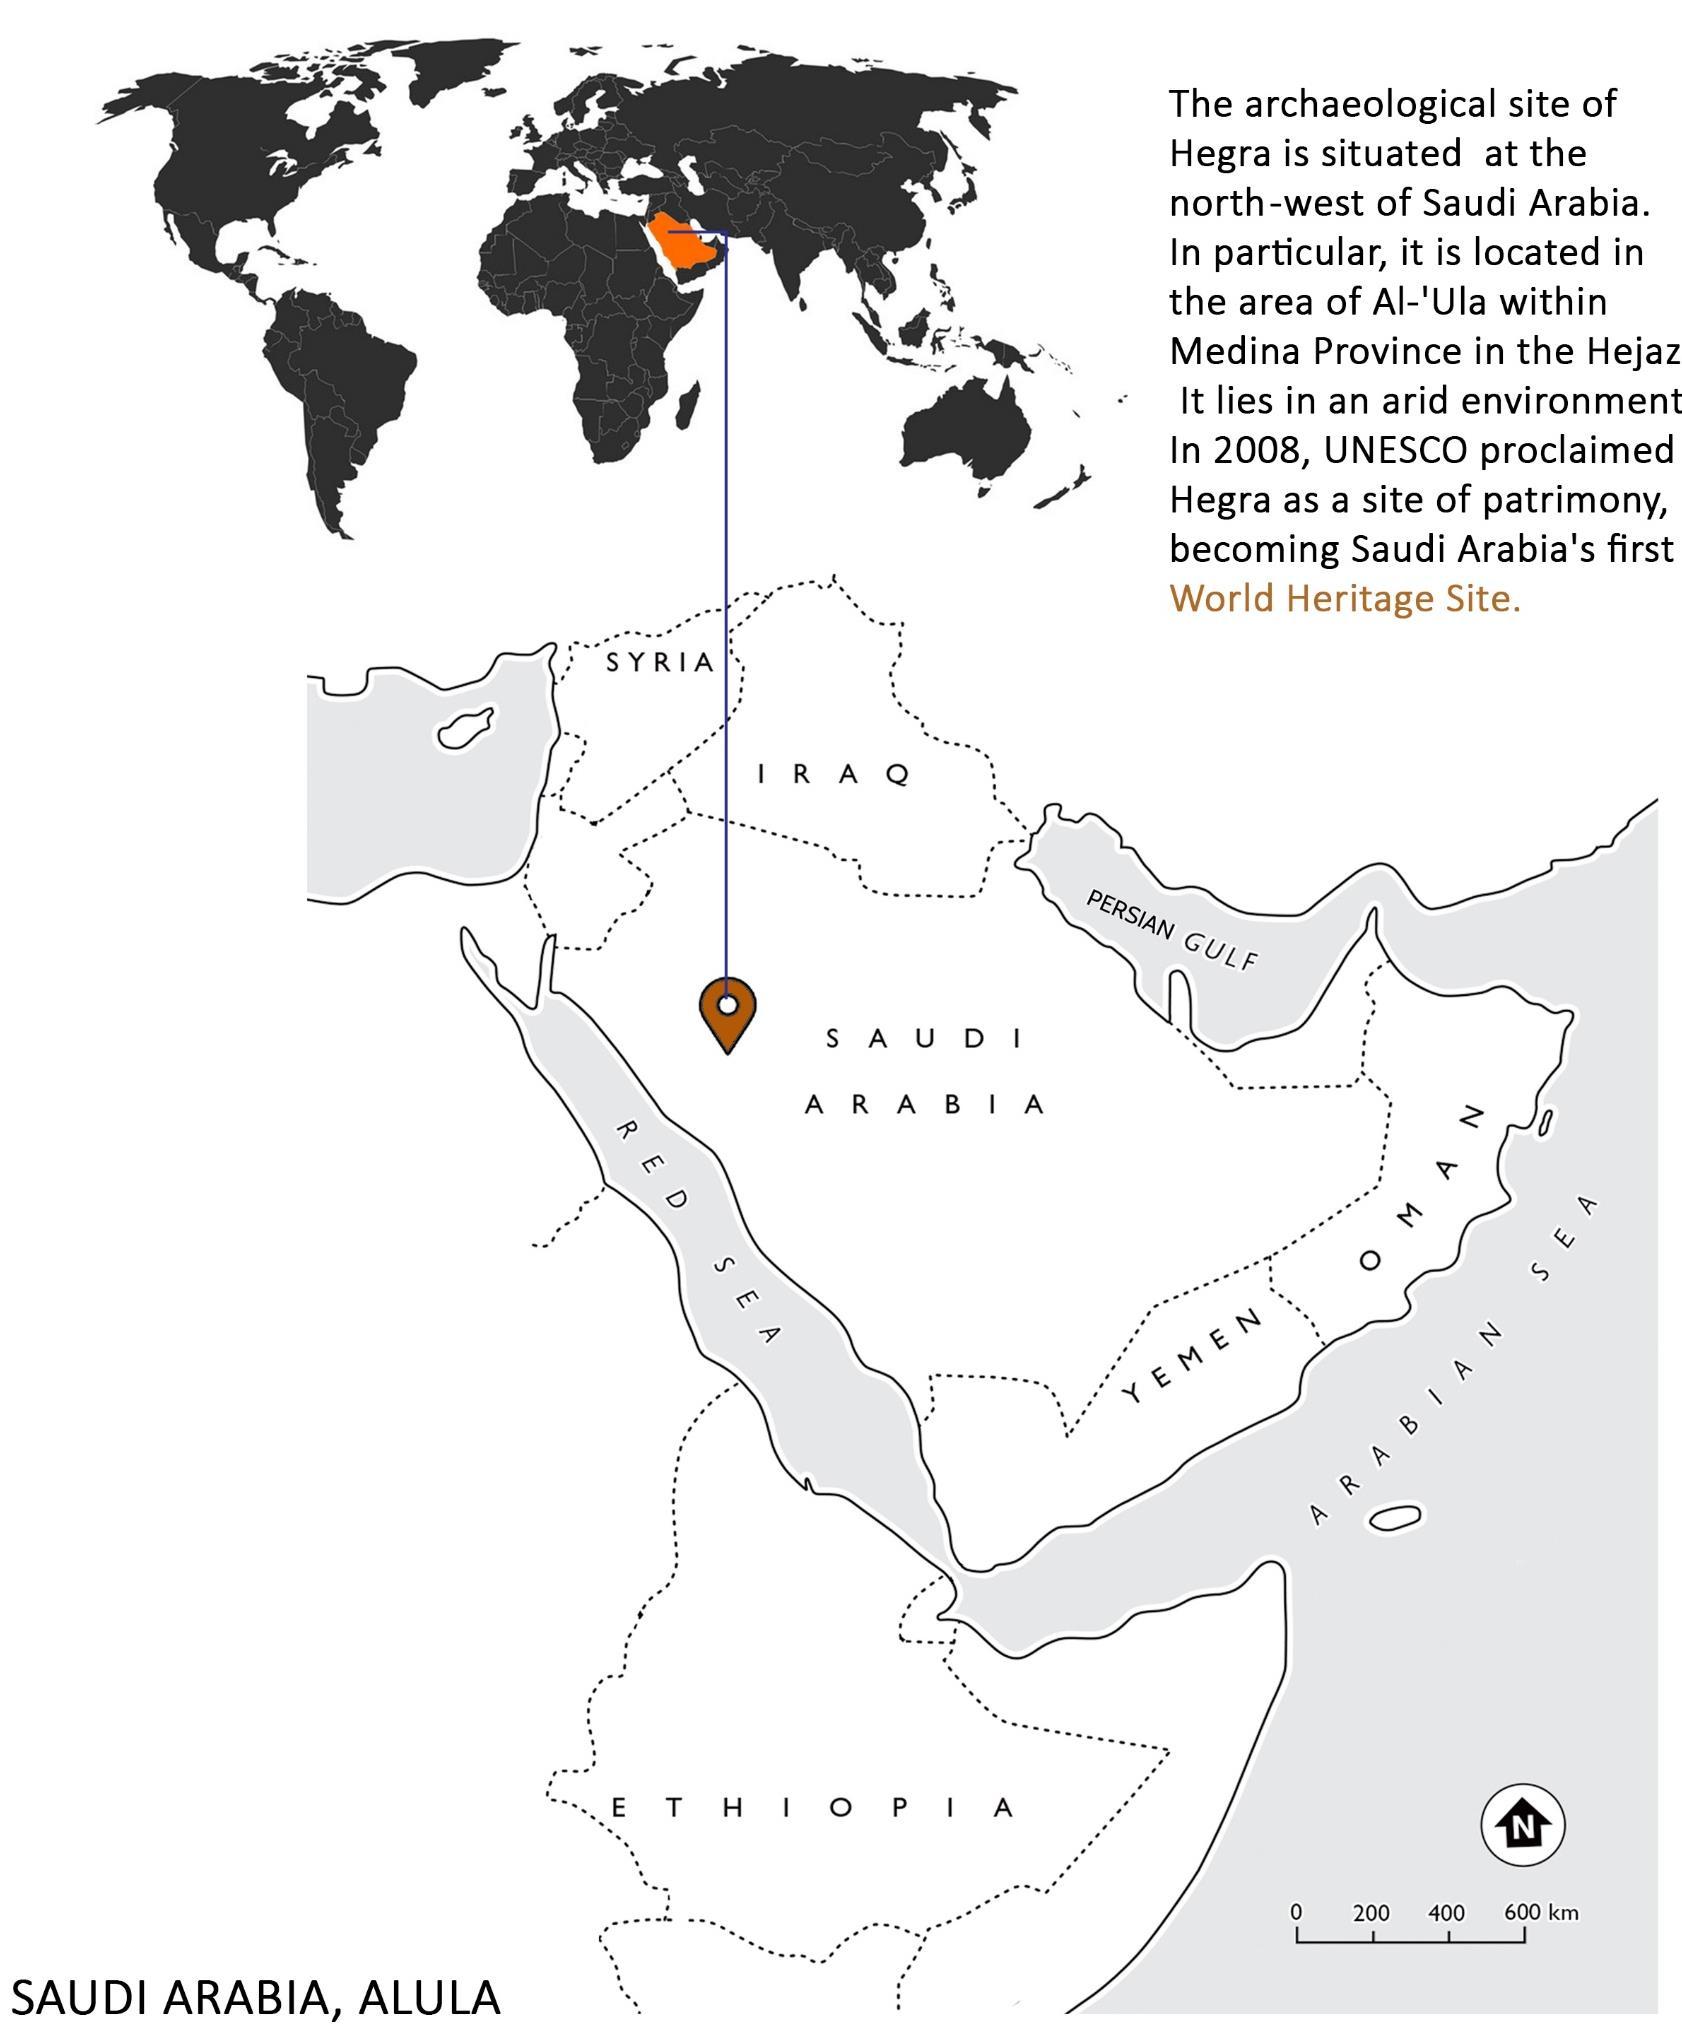
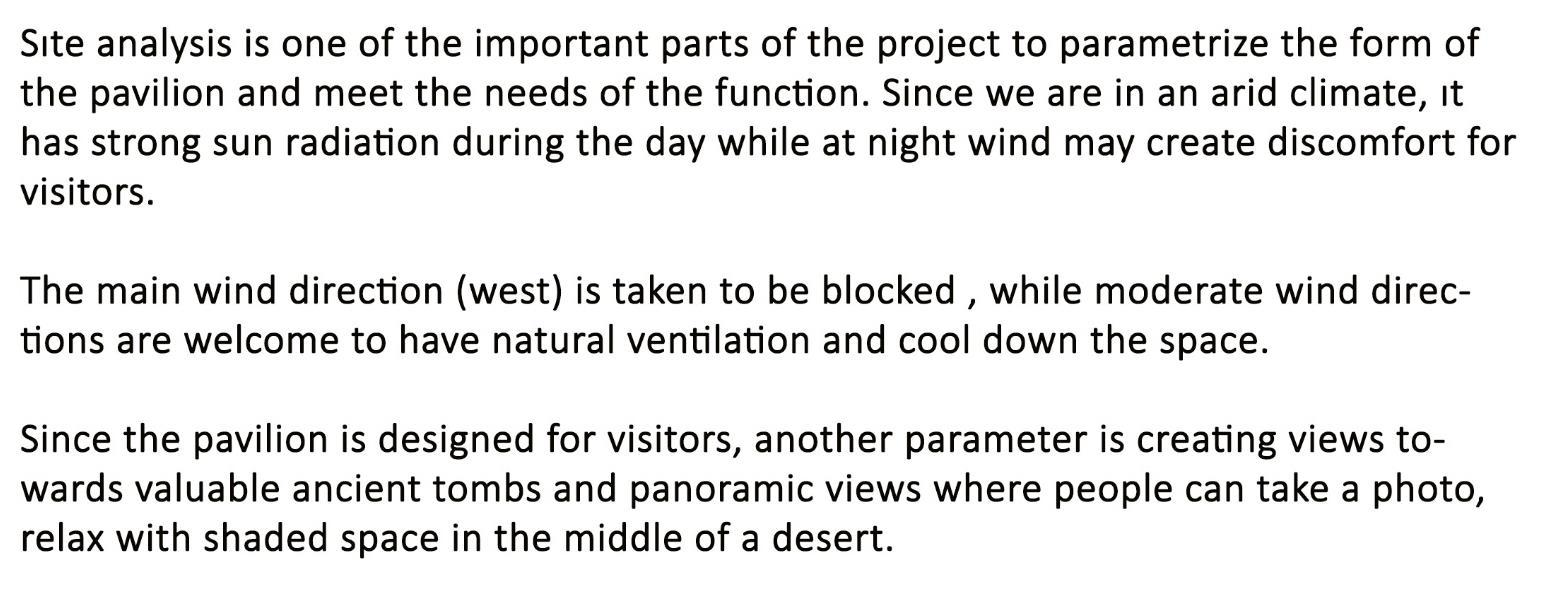
SITE
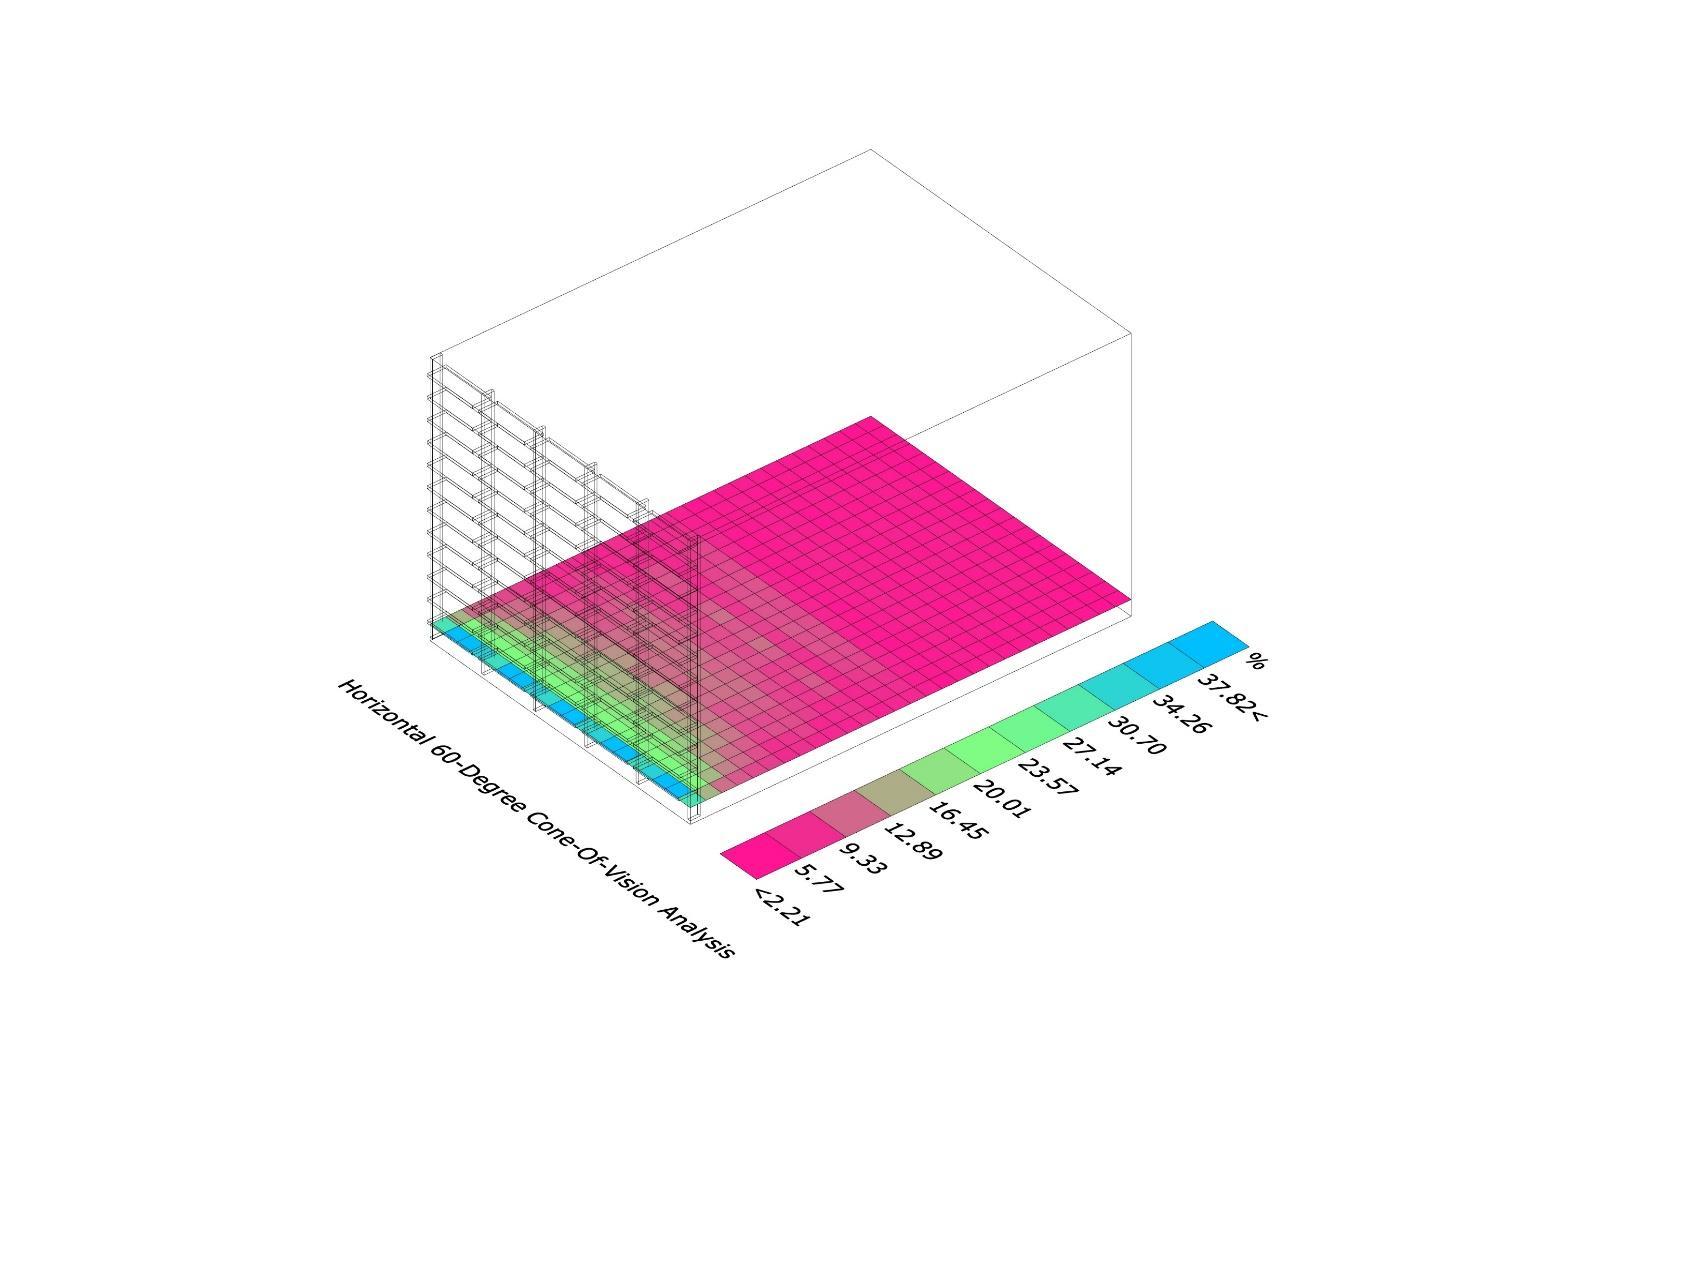
ANALYSIS
GEOGRAPHICAL INFORMATION SUN PATH & WIND ROSE
SKETCHES
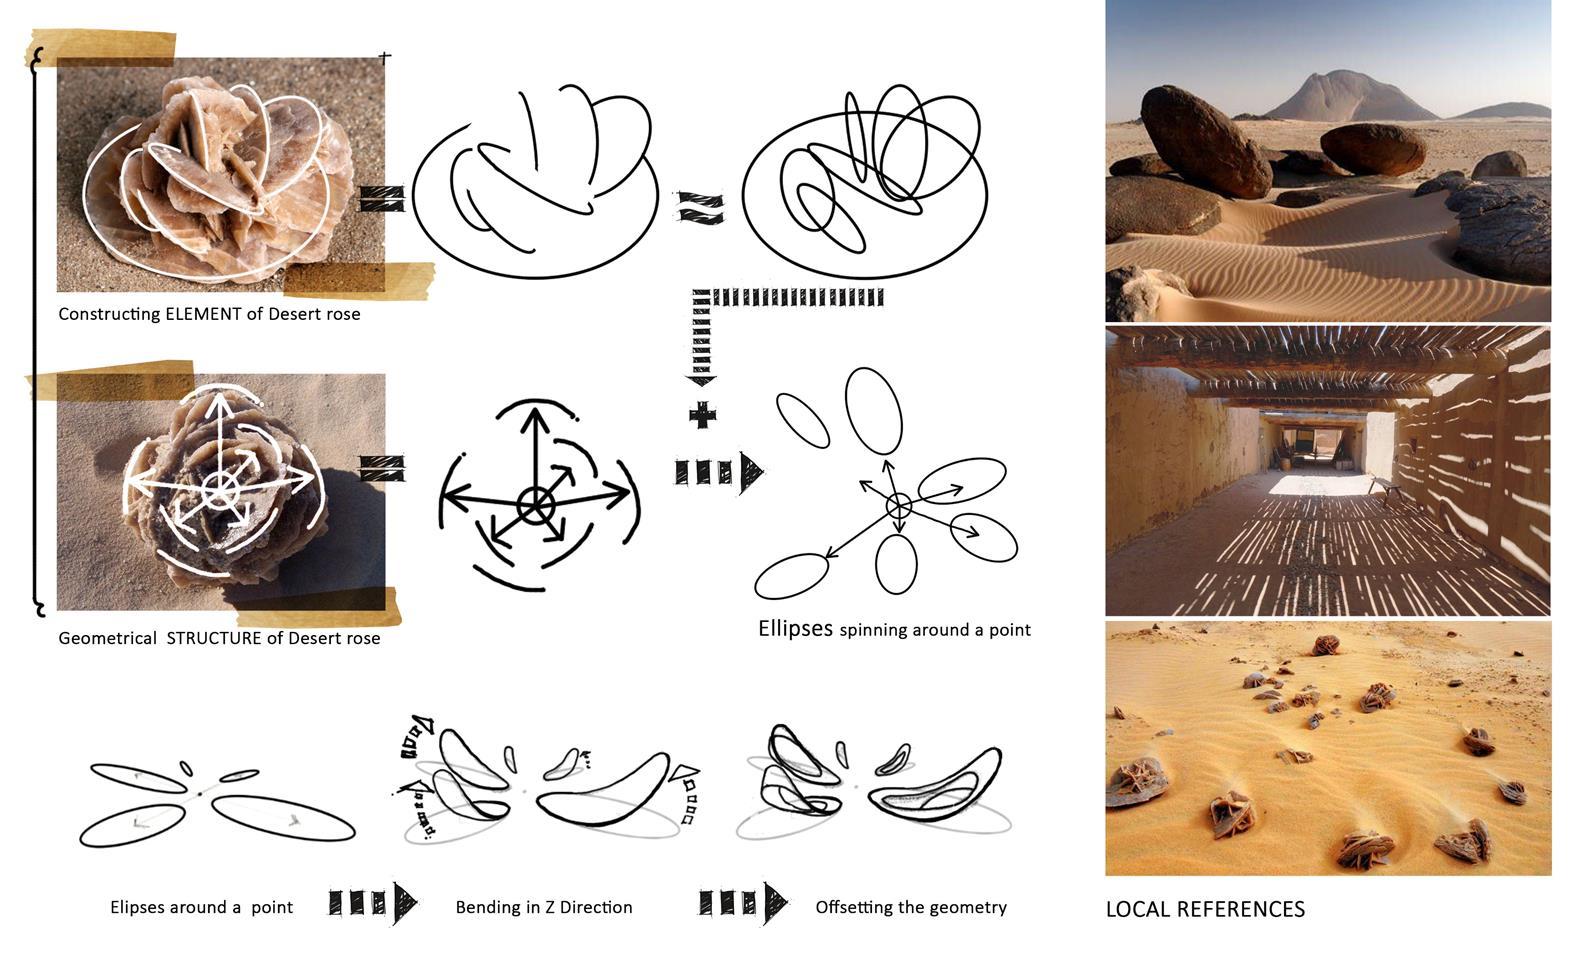
CONCEPT
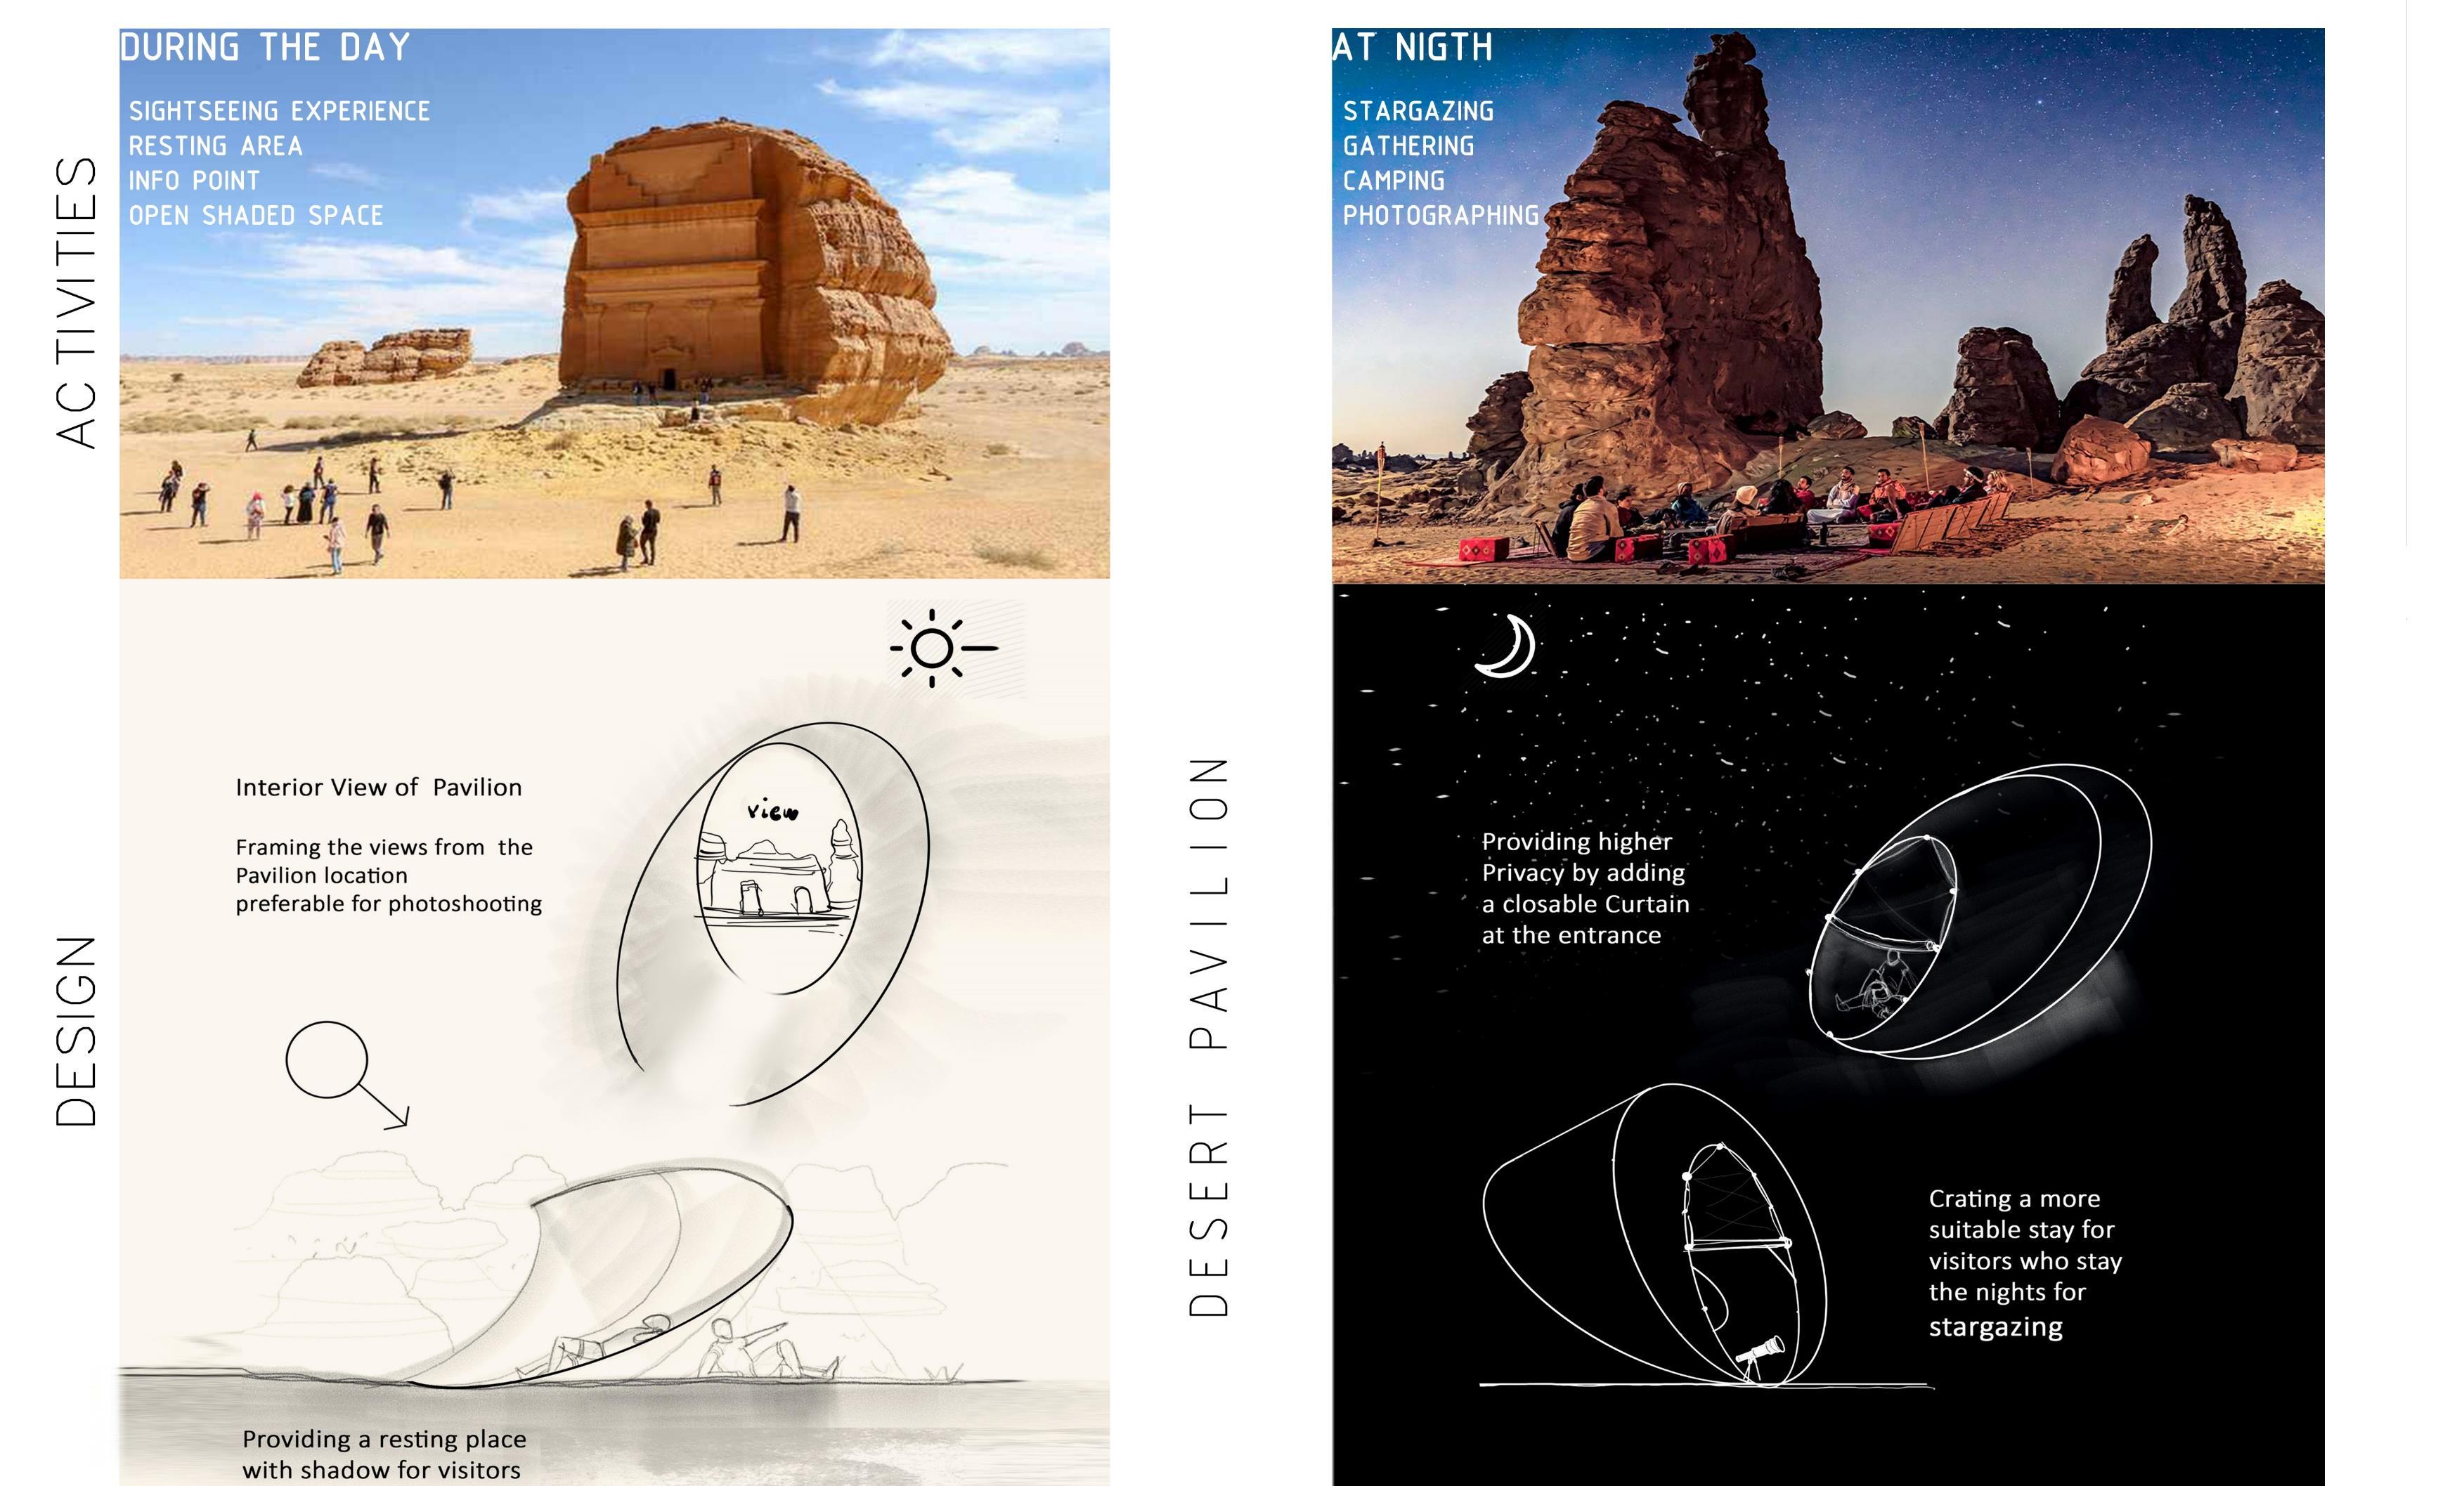
FUNCTIONS
DURING DAY & NIGHT
GALAPAGOS OPTIMIZATION FOR THE SHAPE
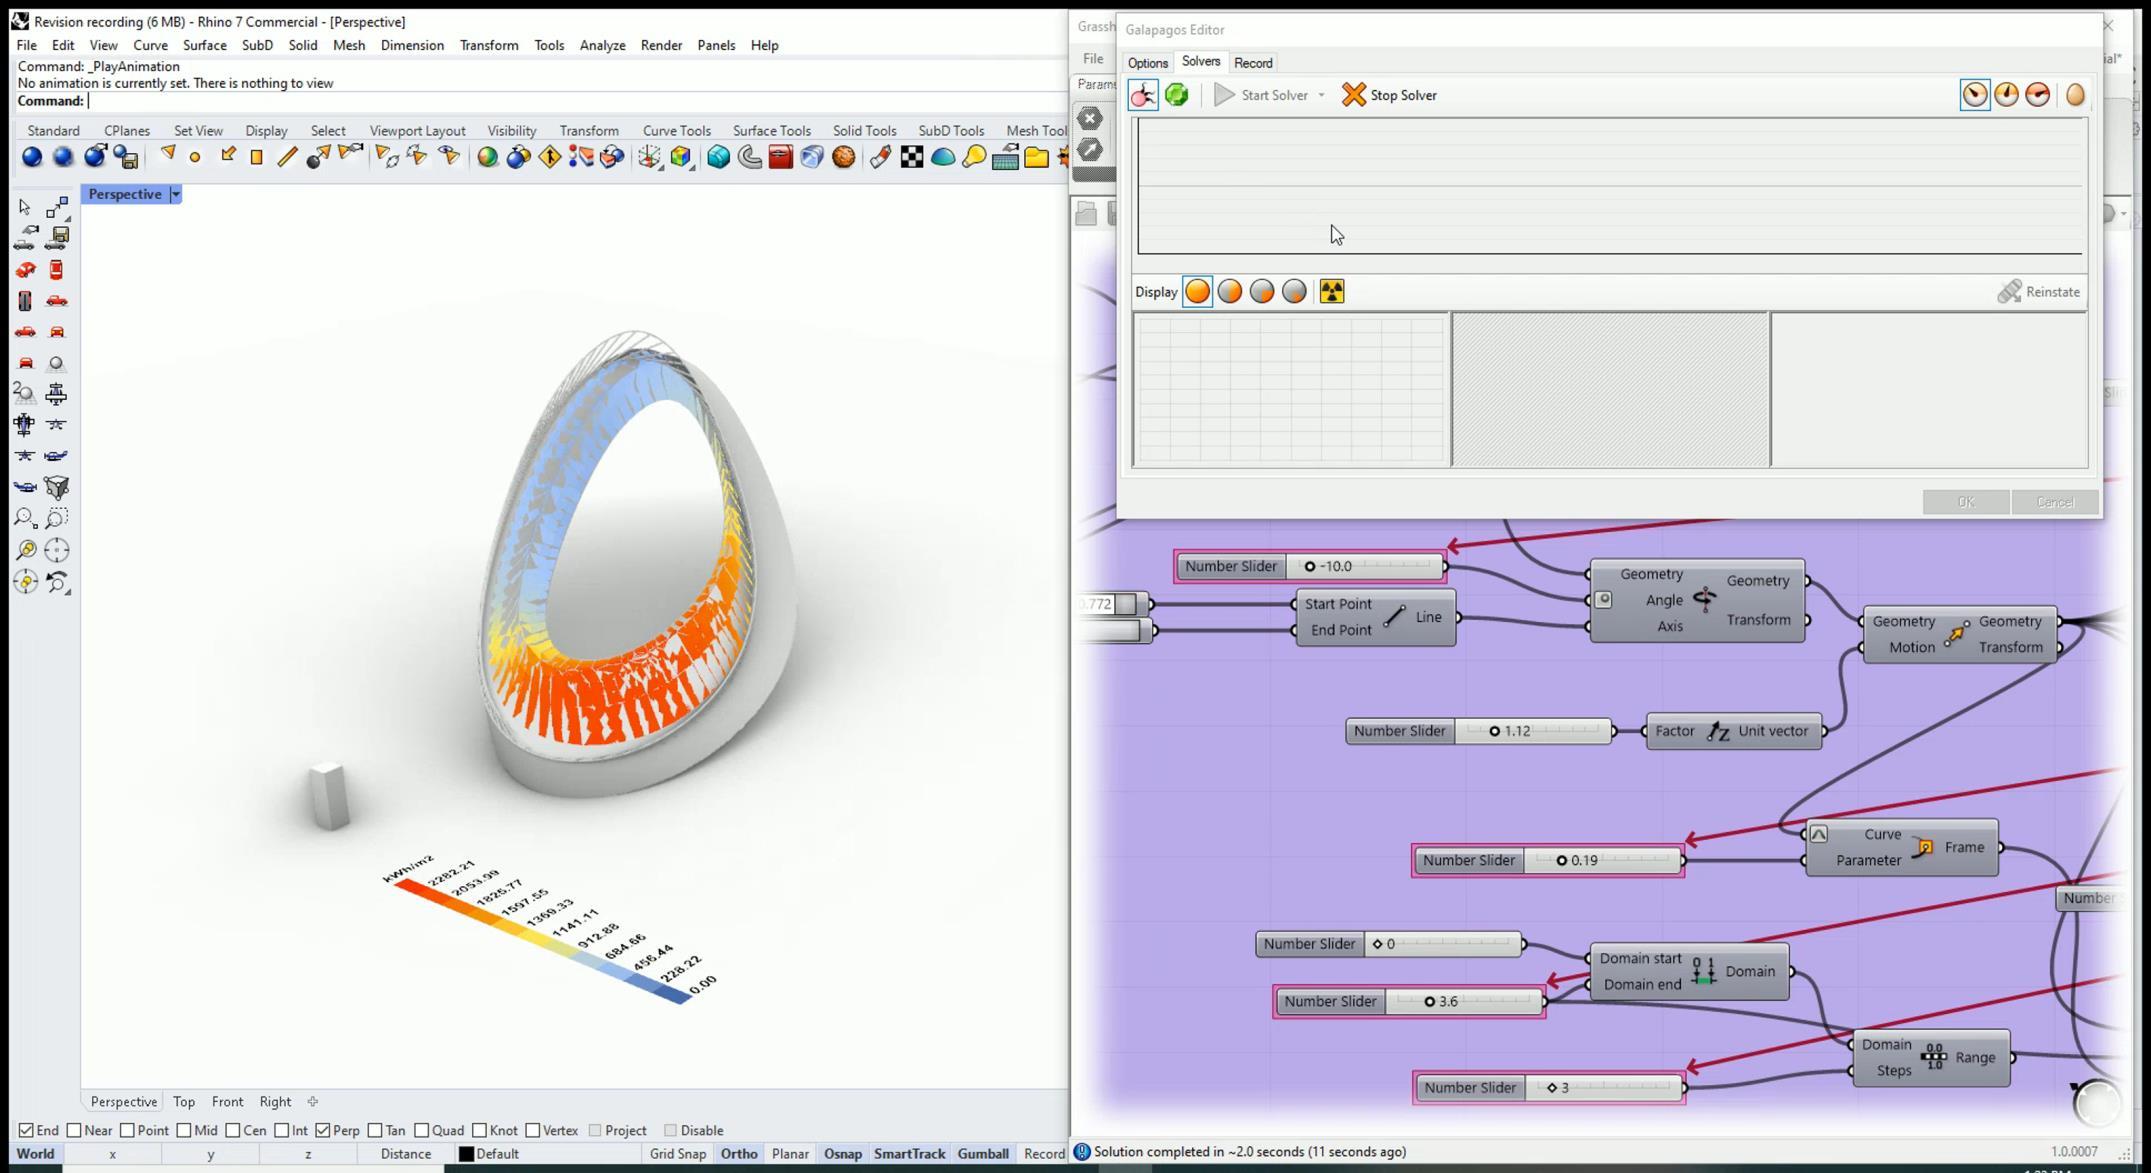
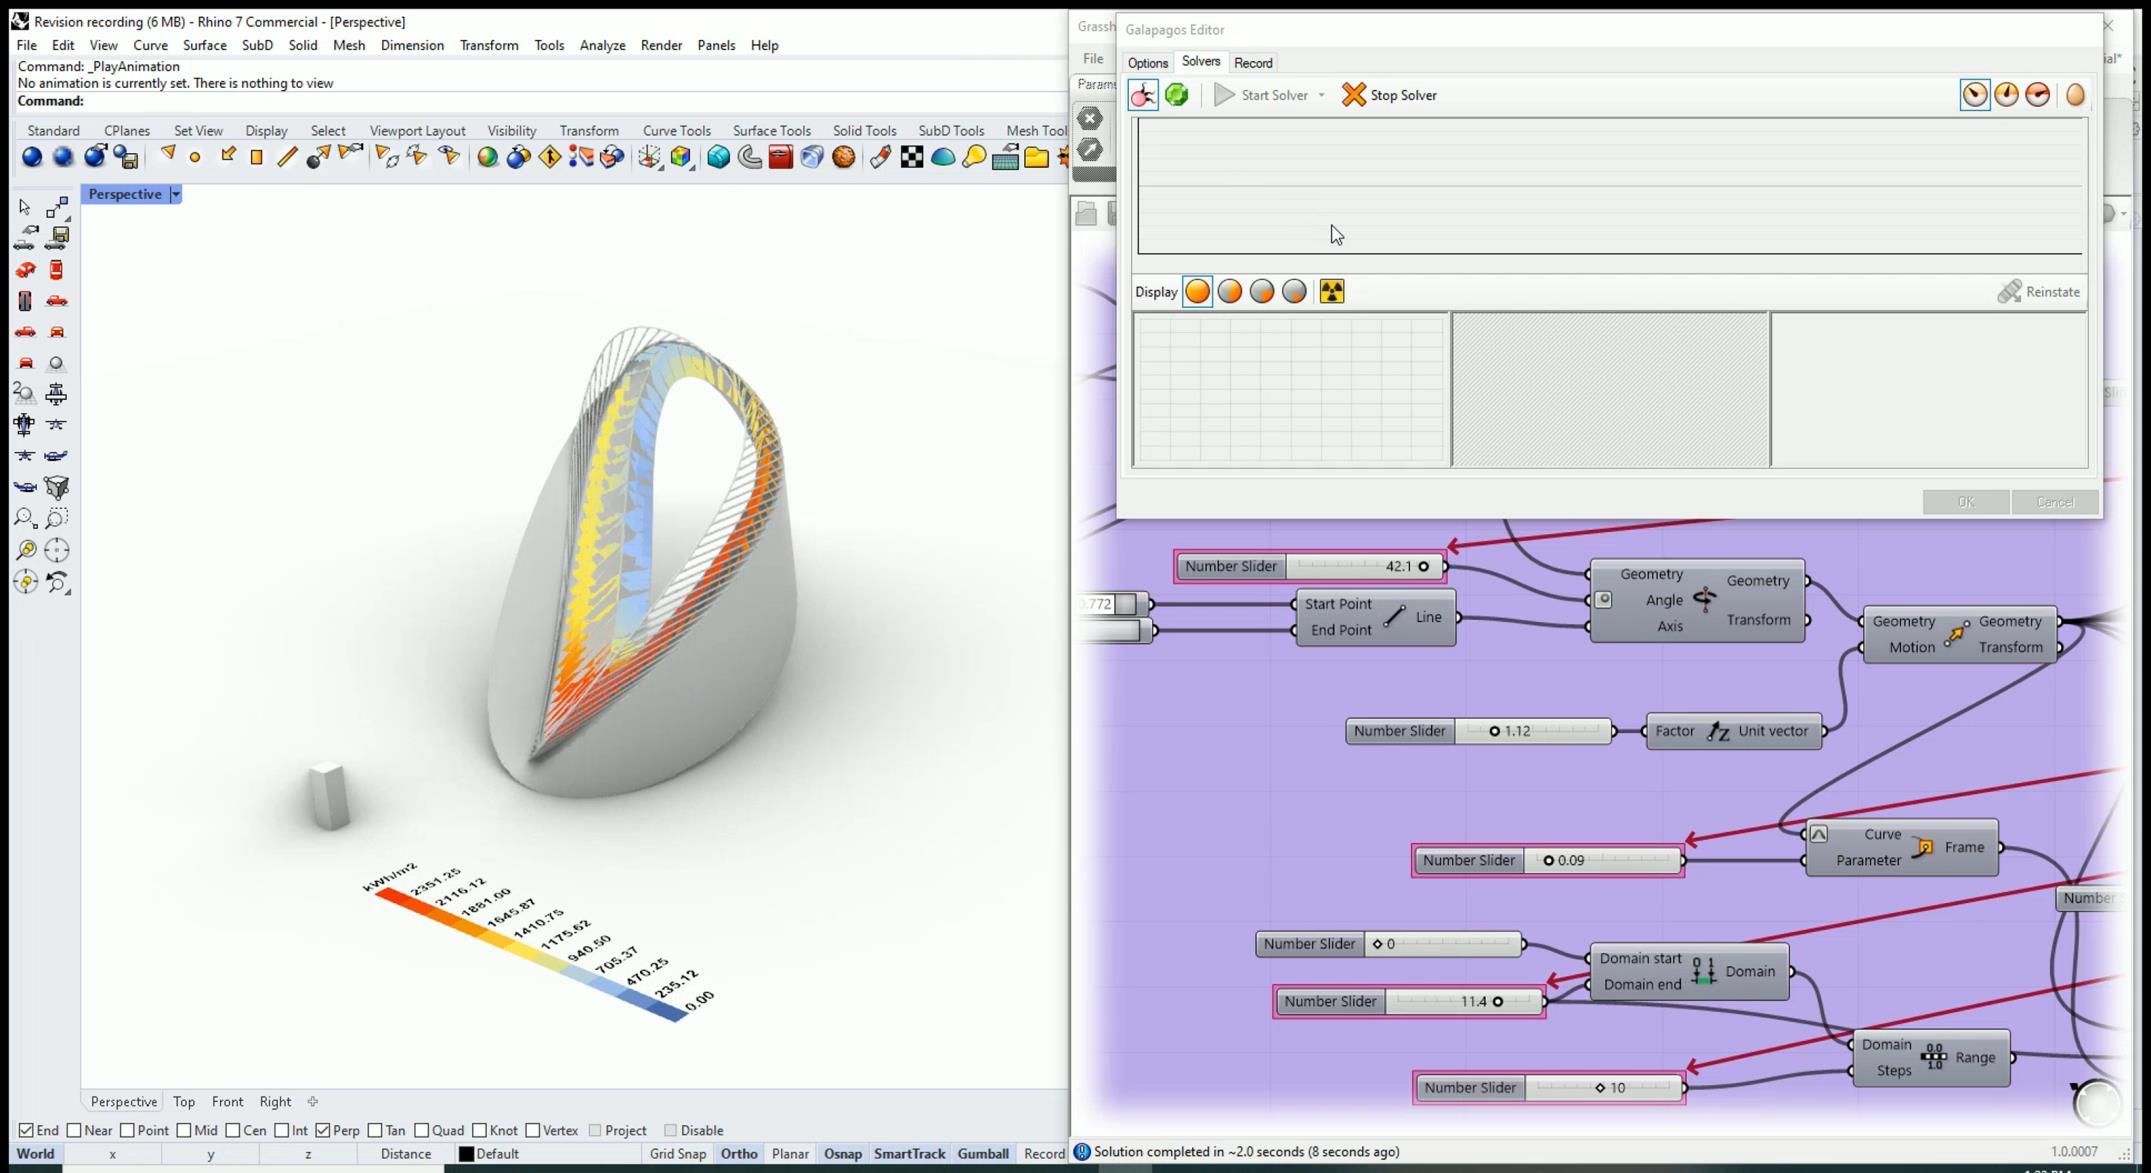

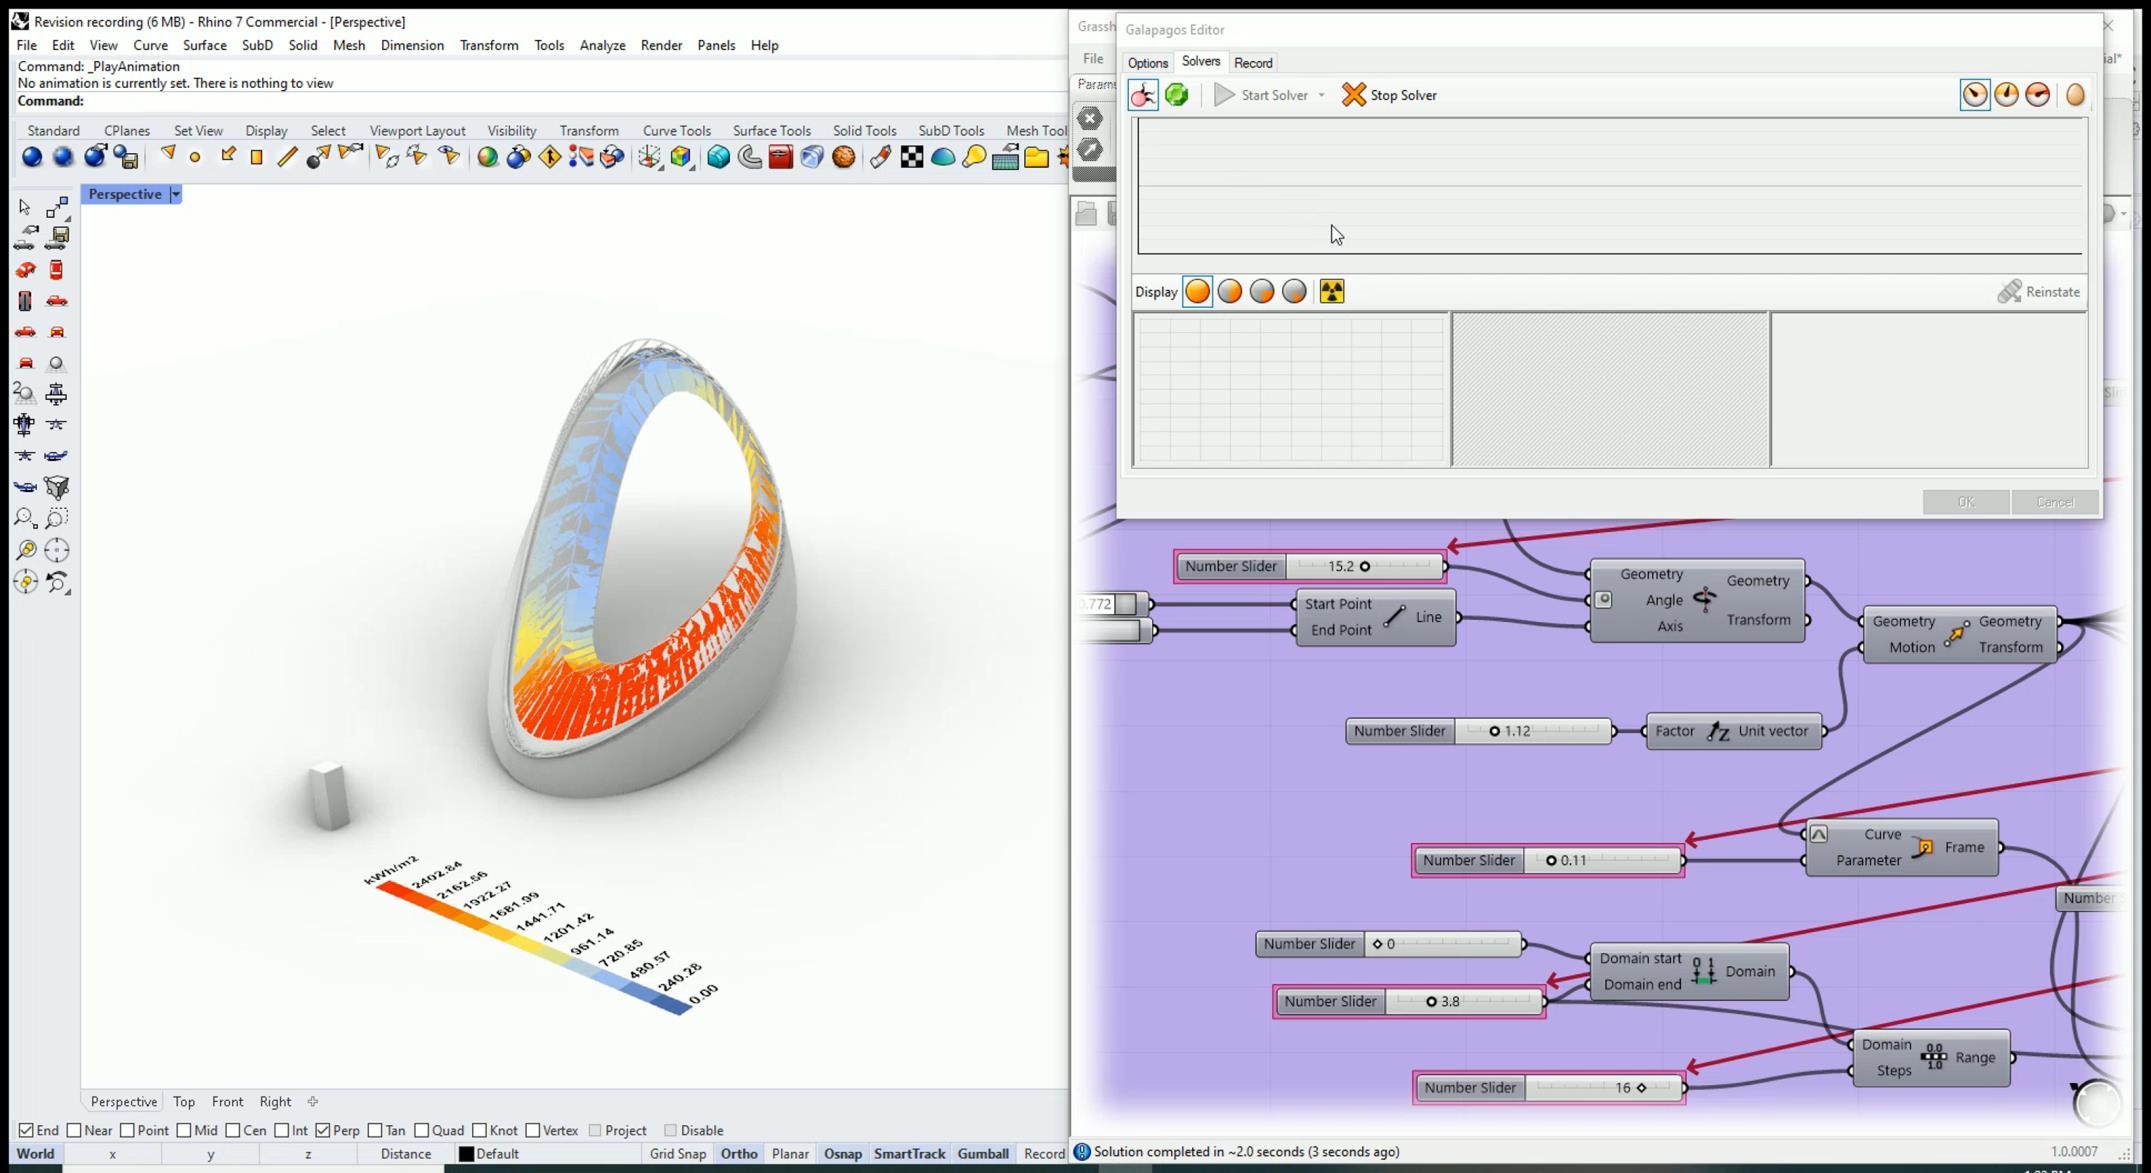
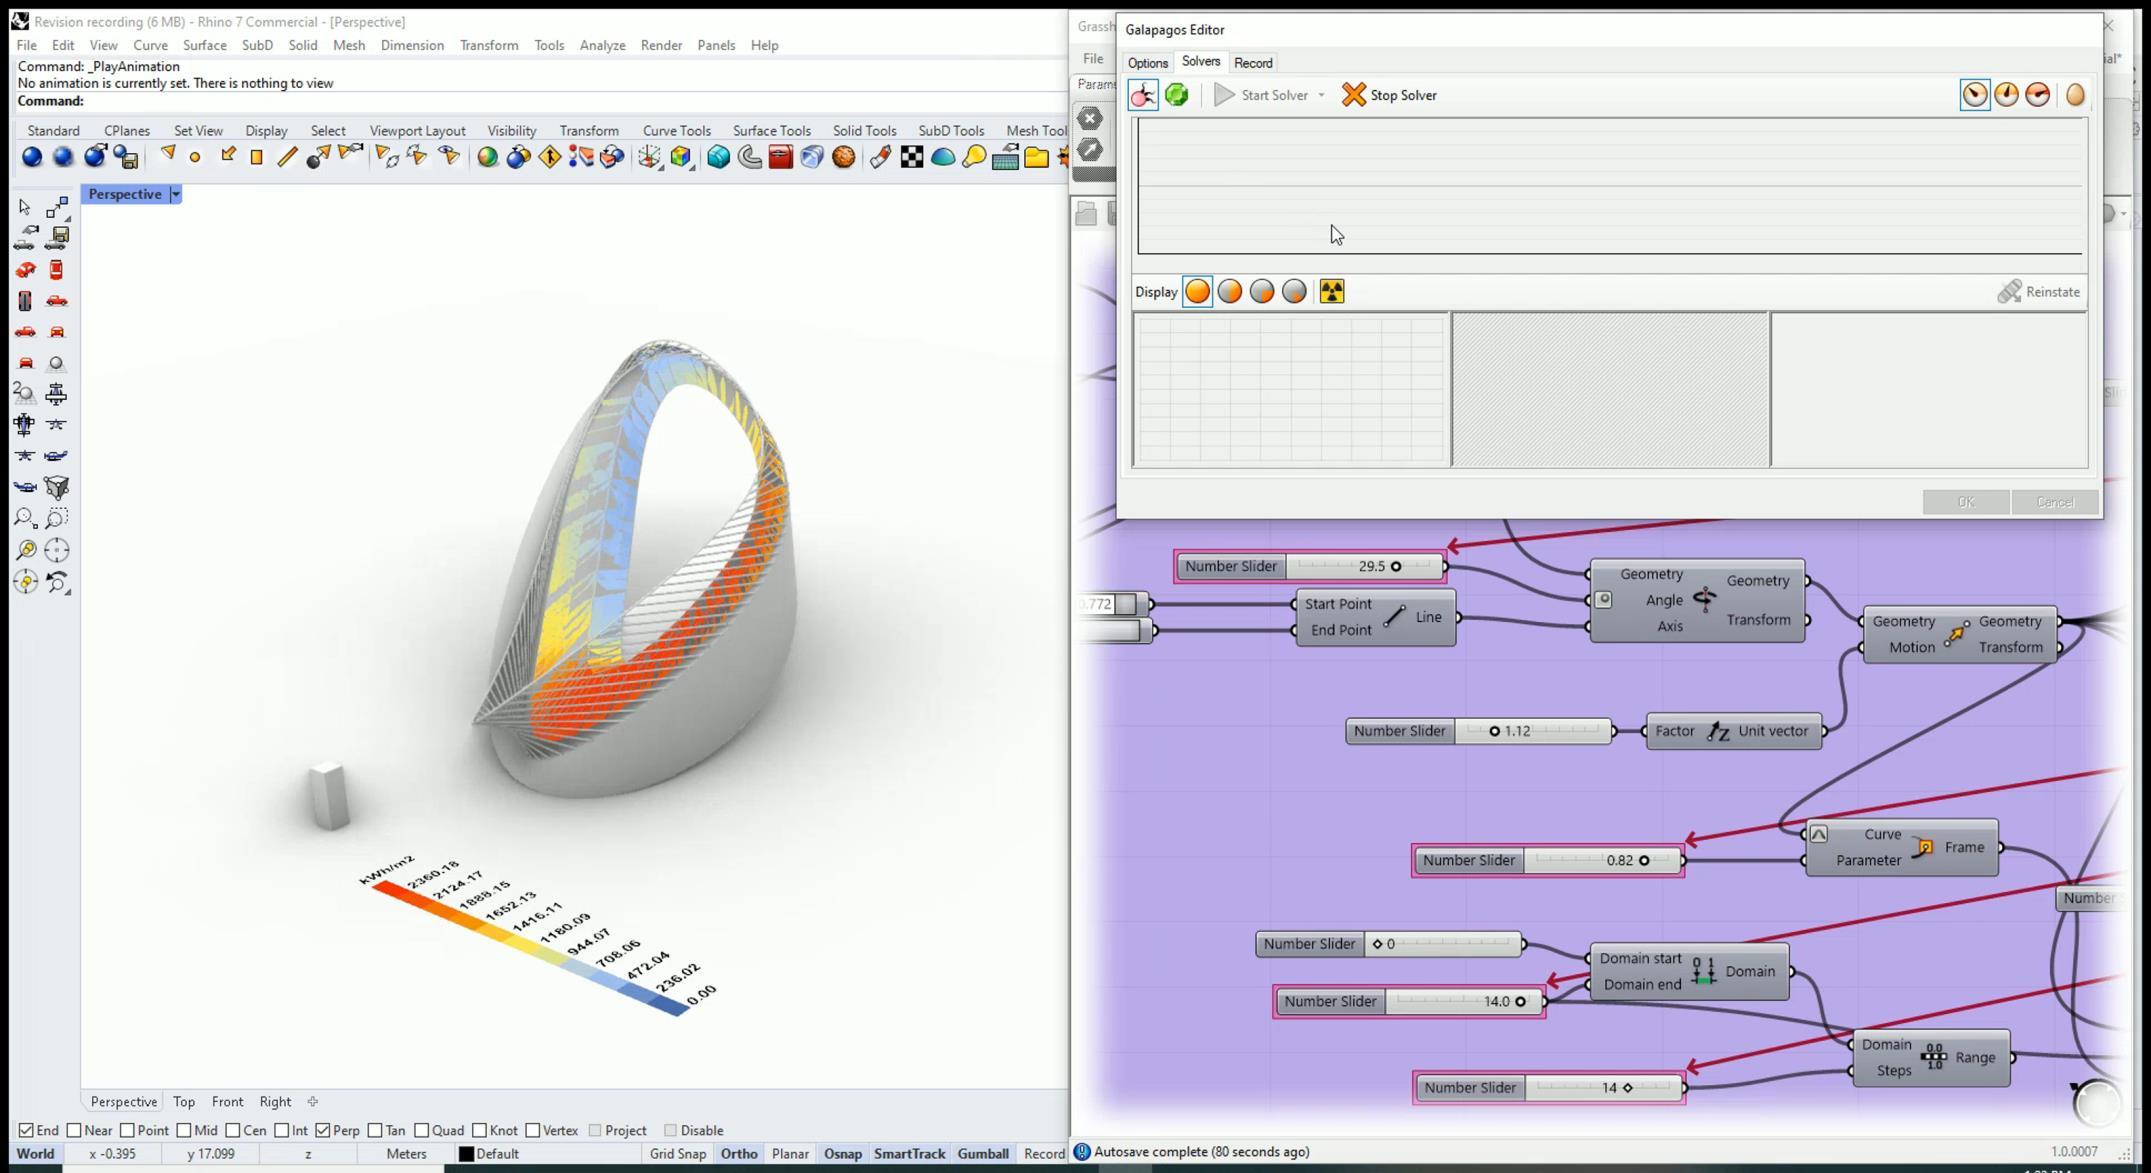

BEFORE & AFTER GALAPAGOS

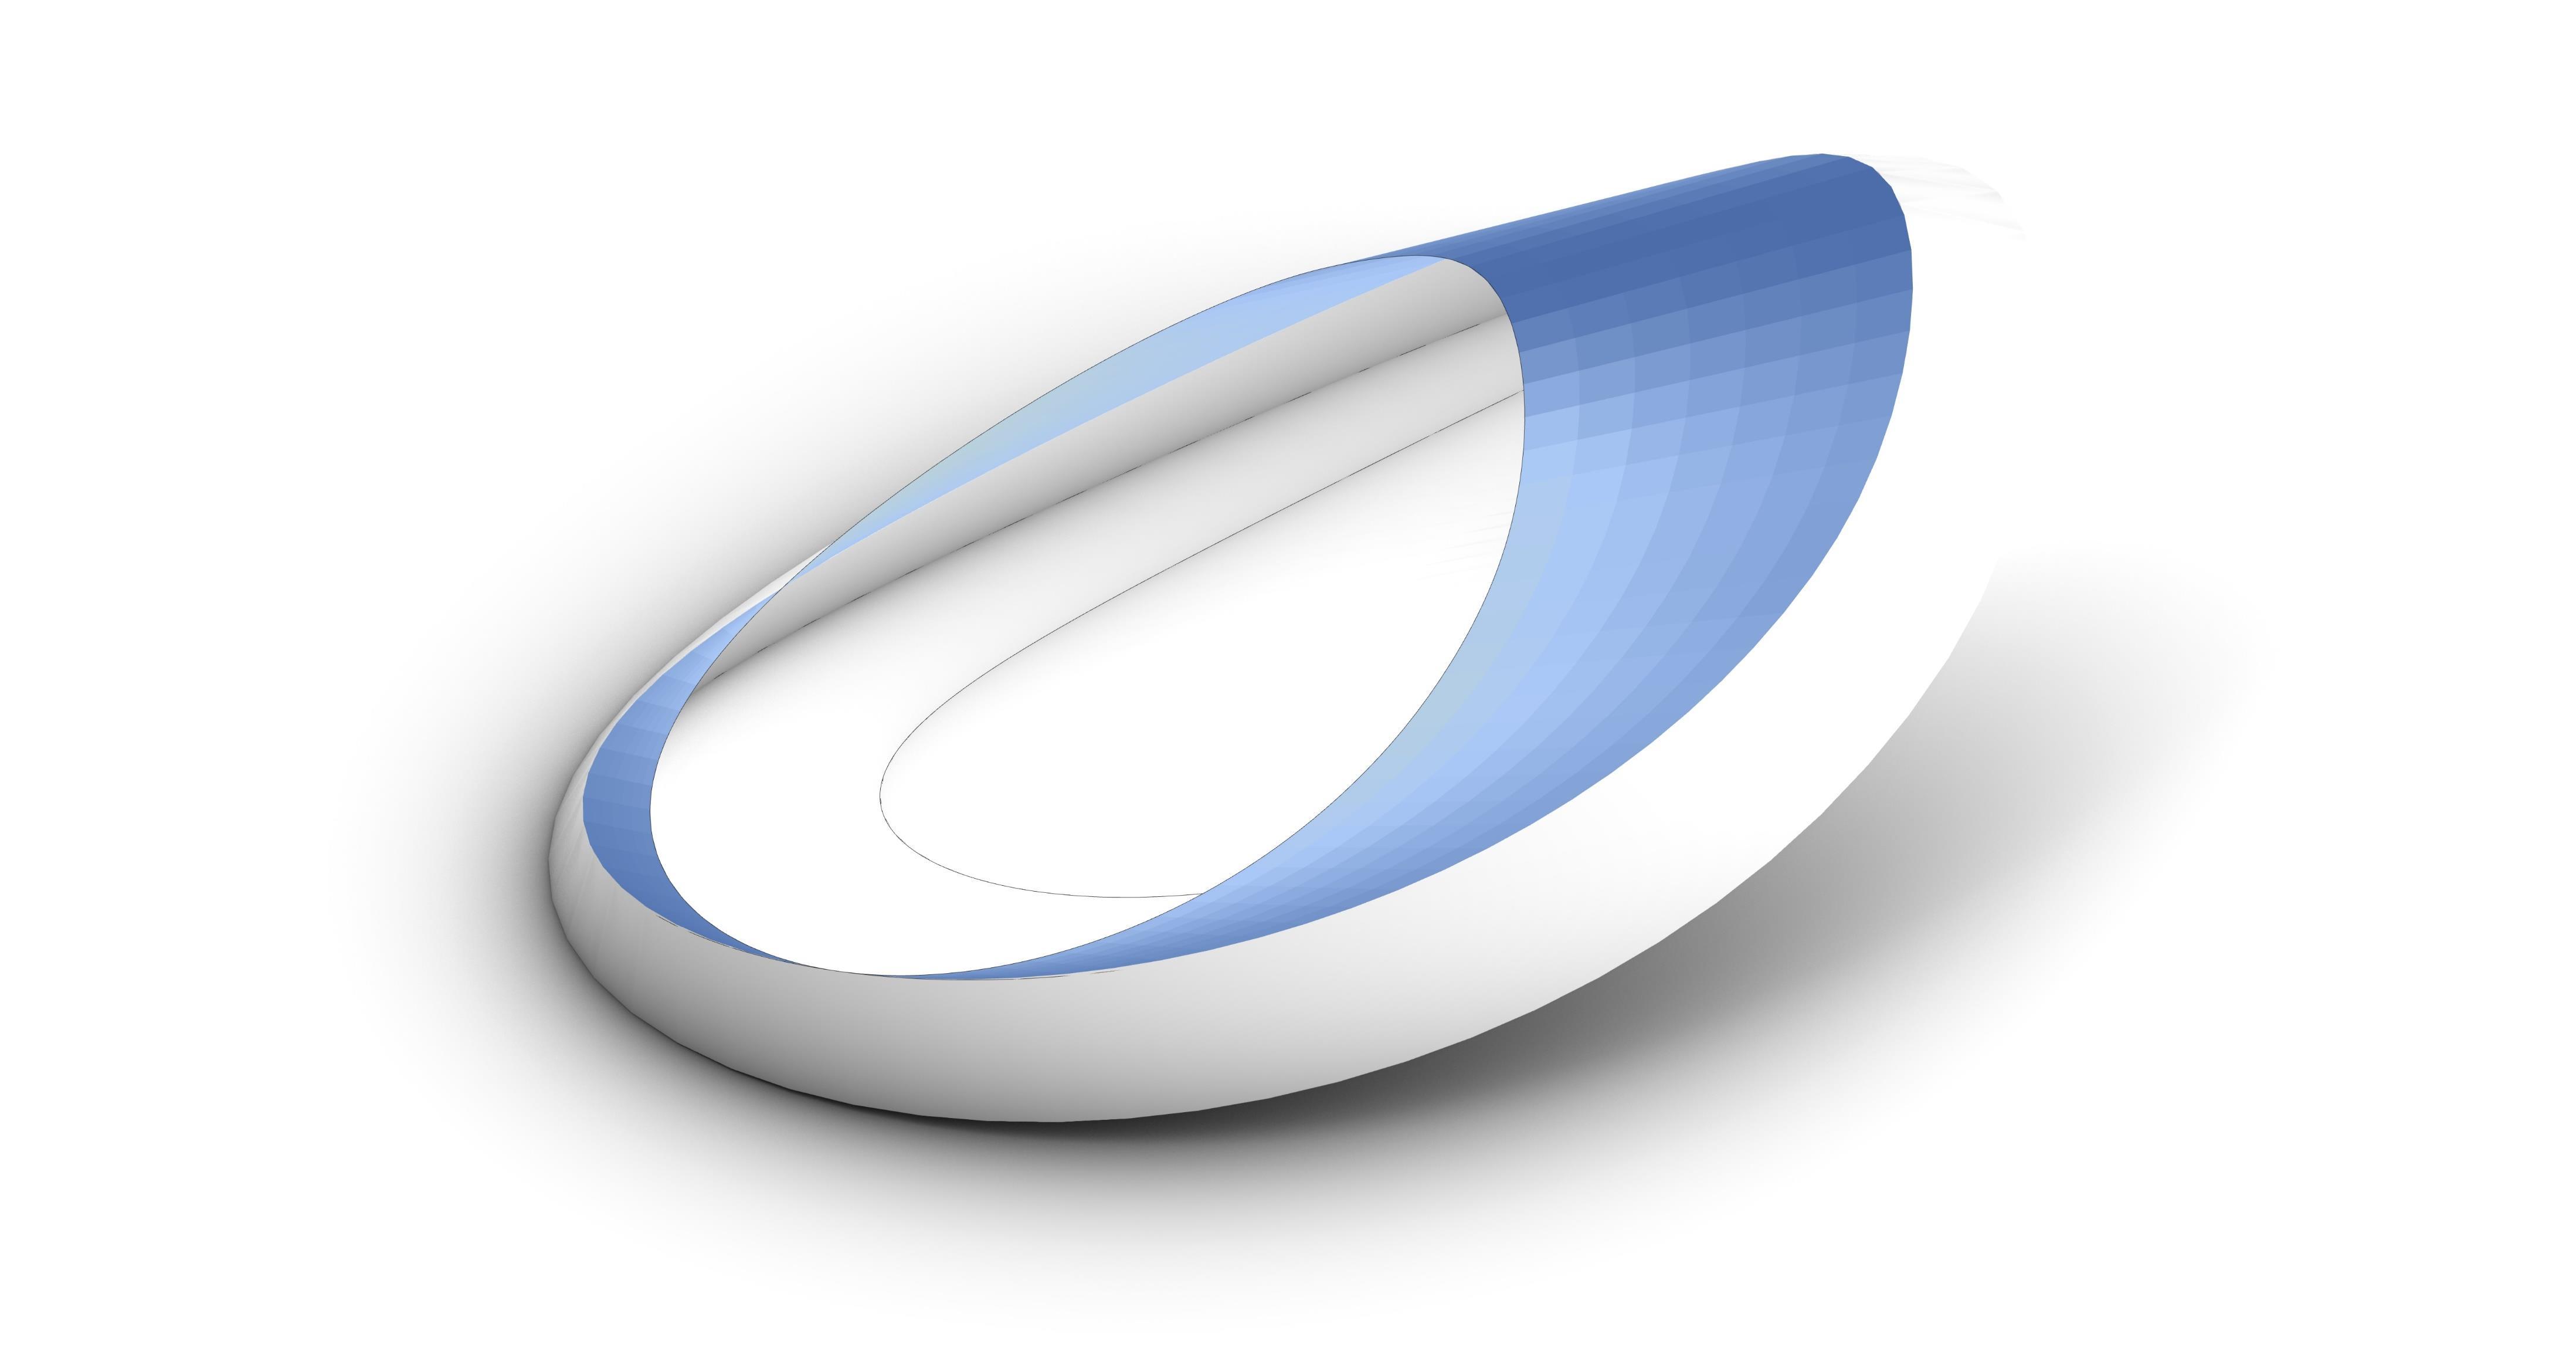
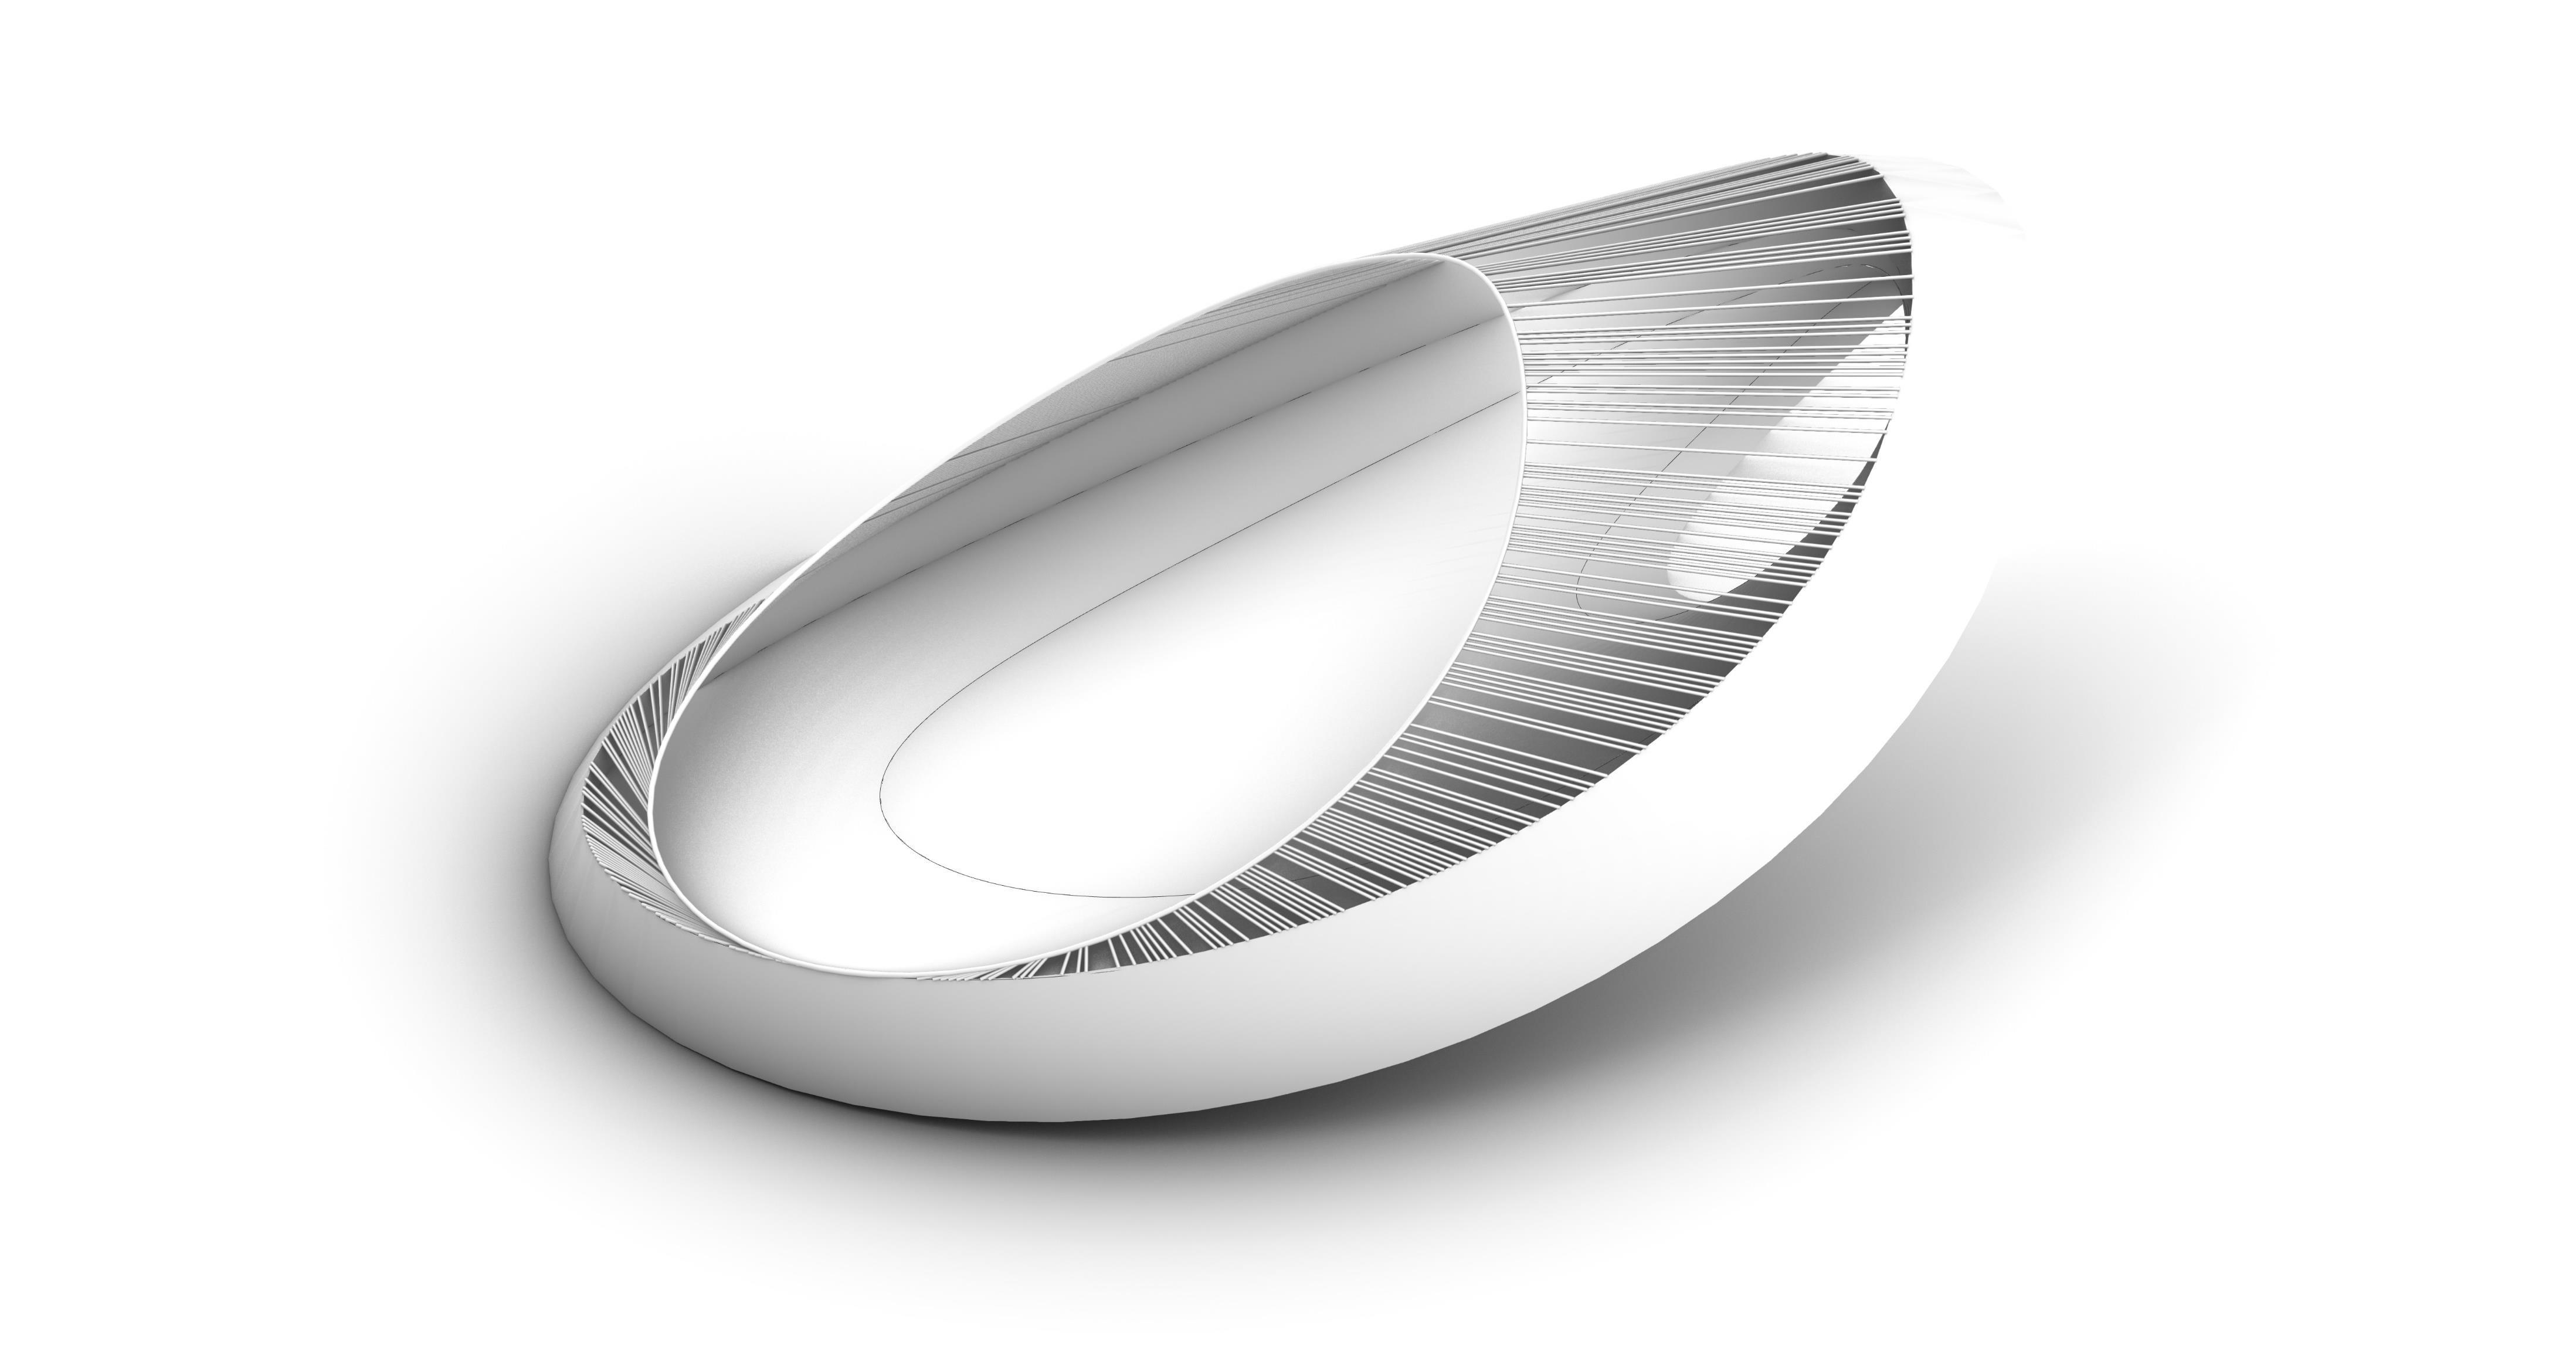
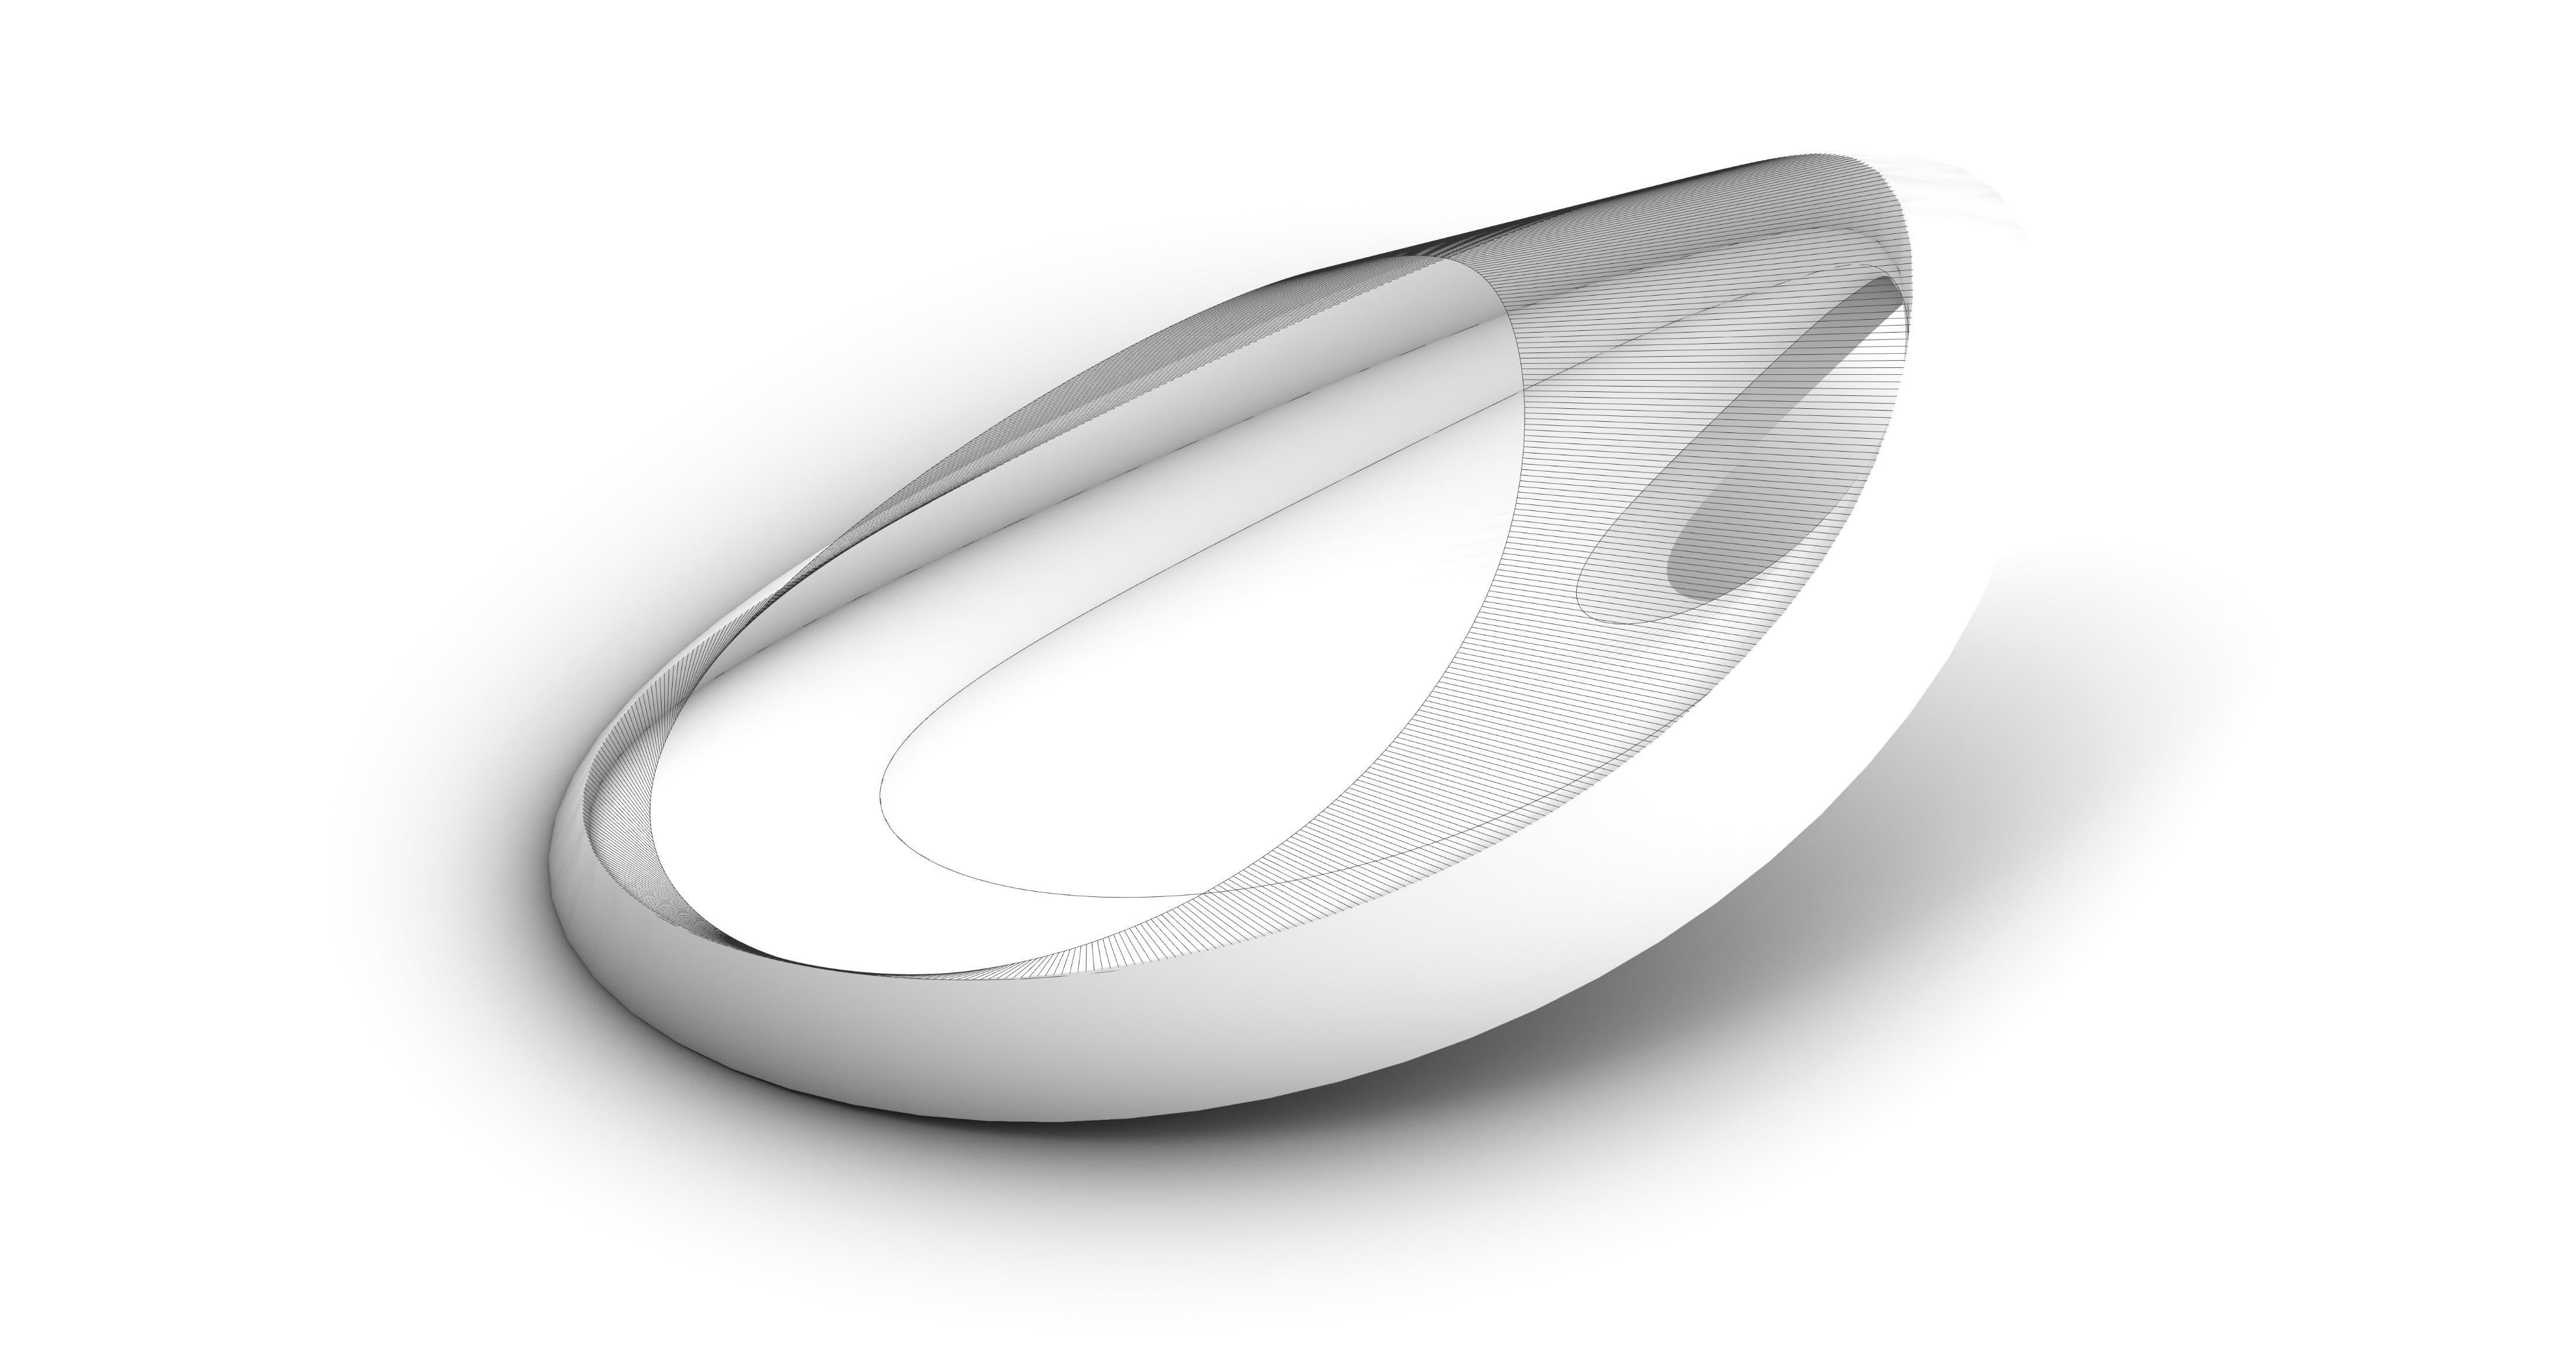
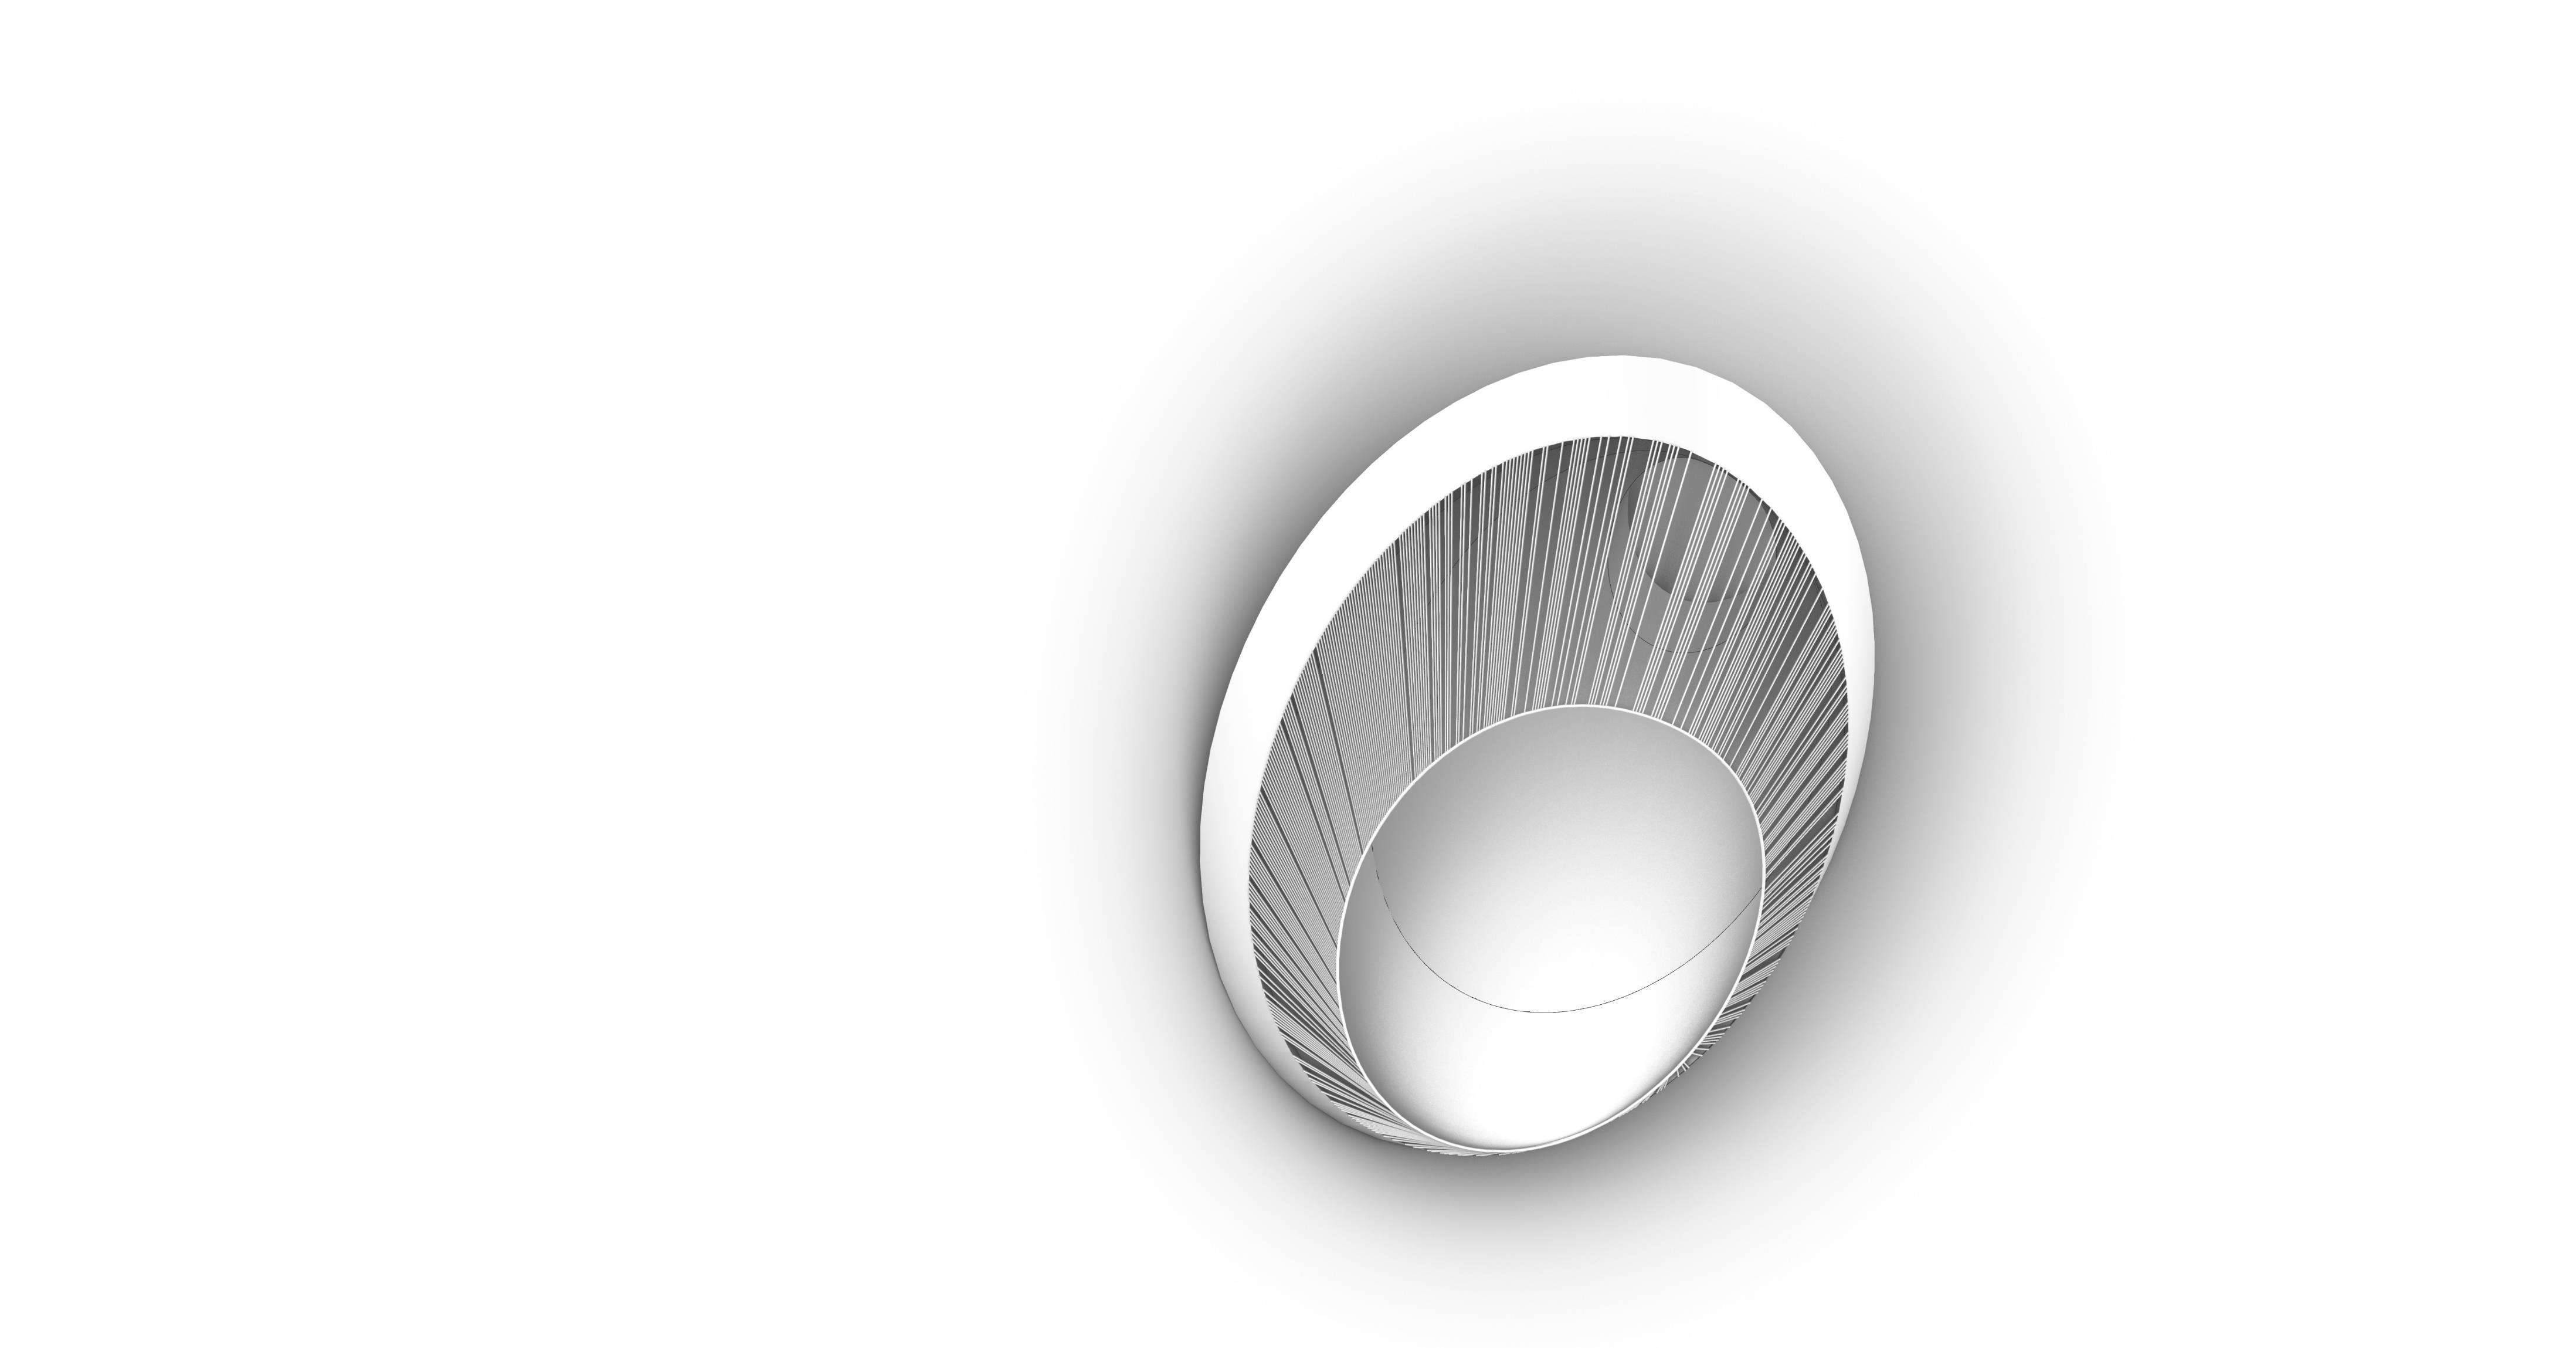
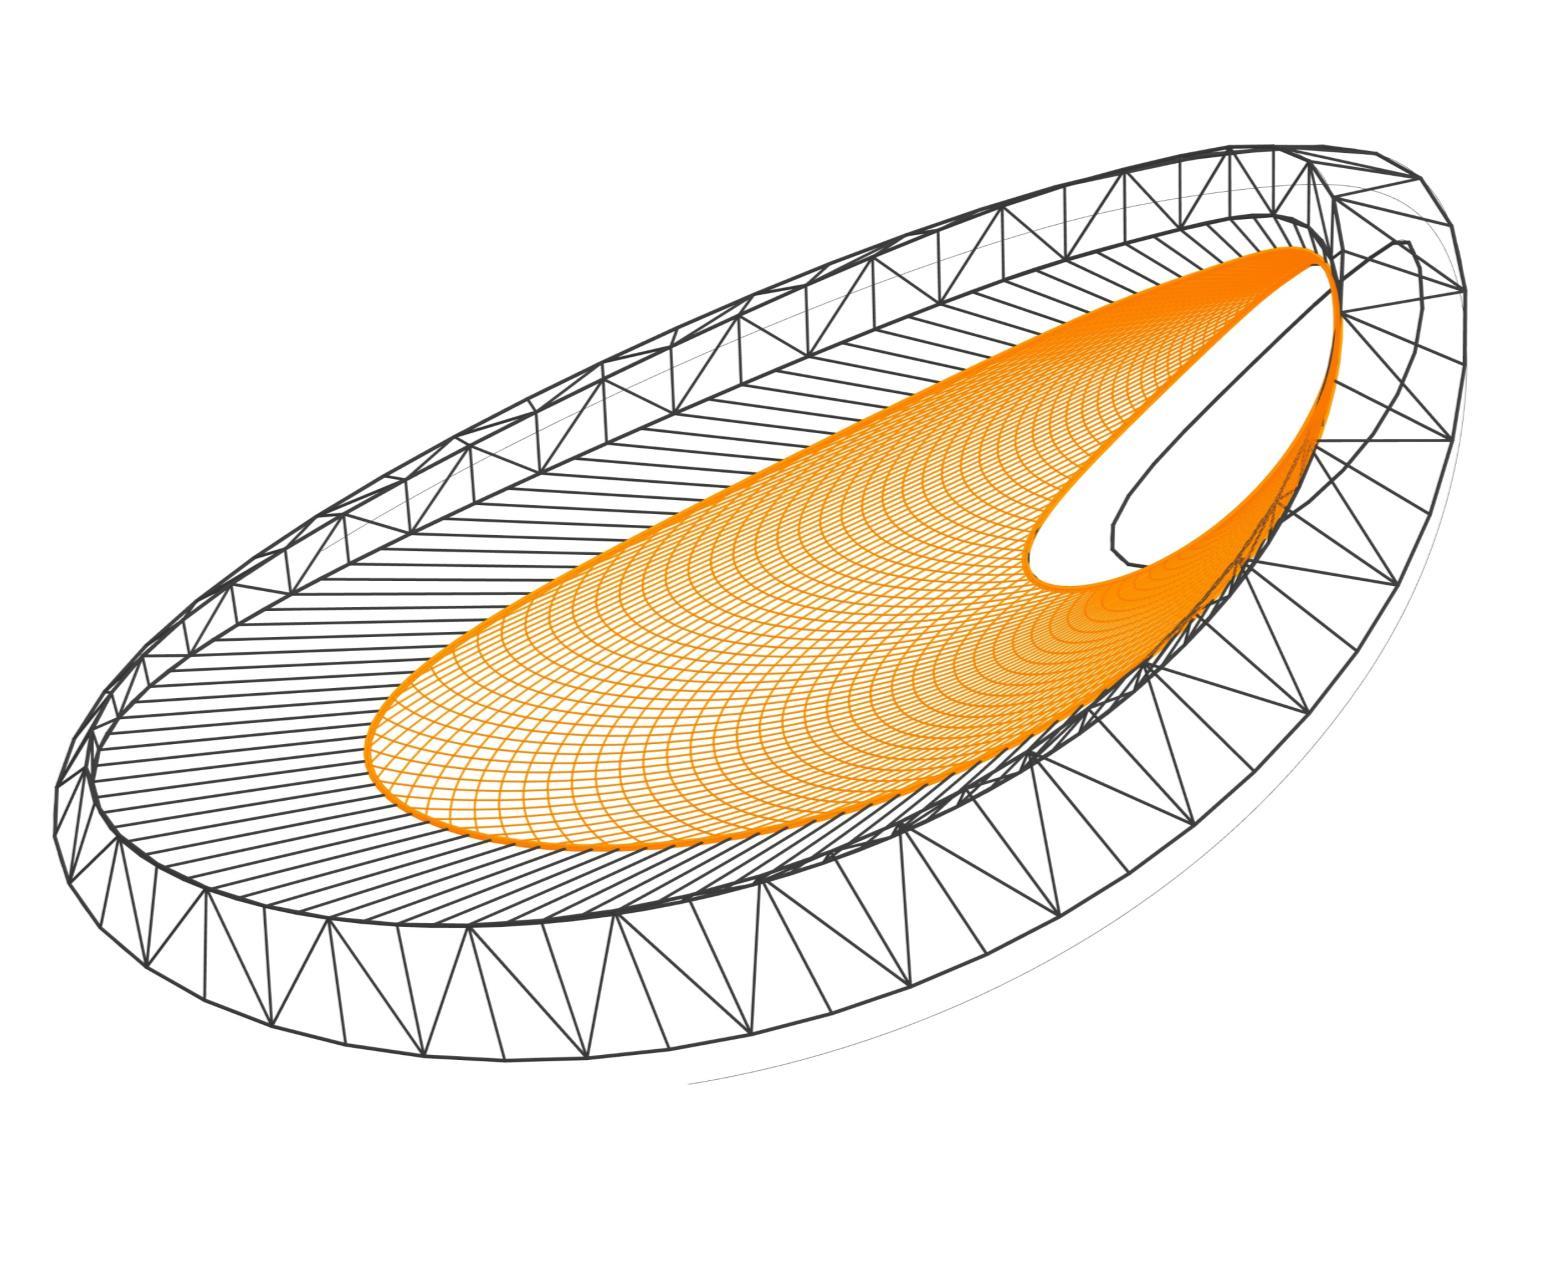
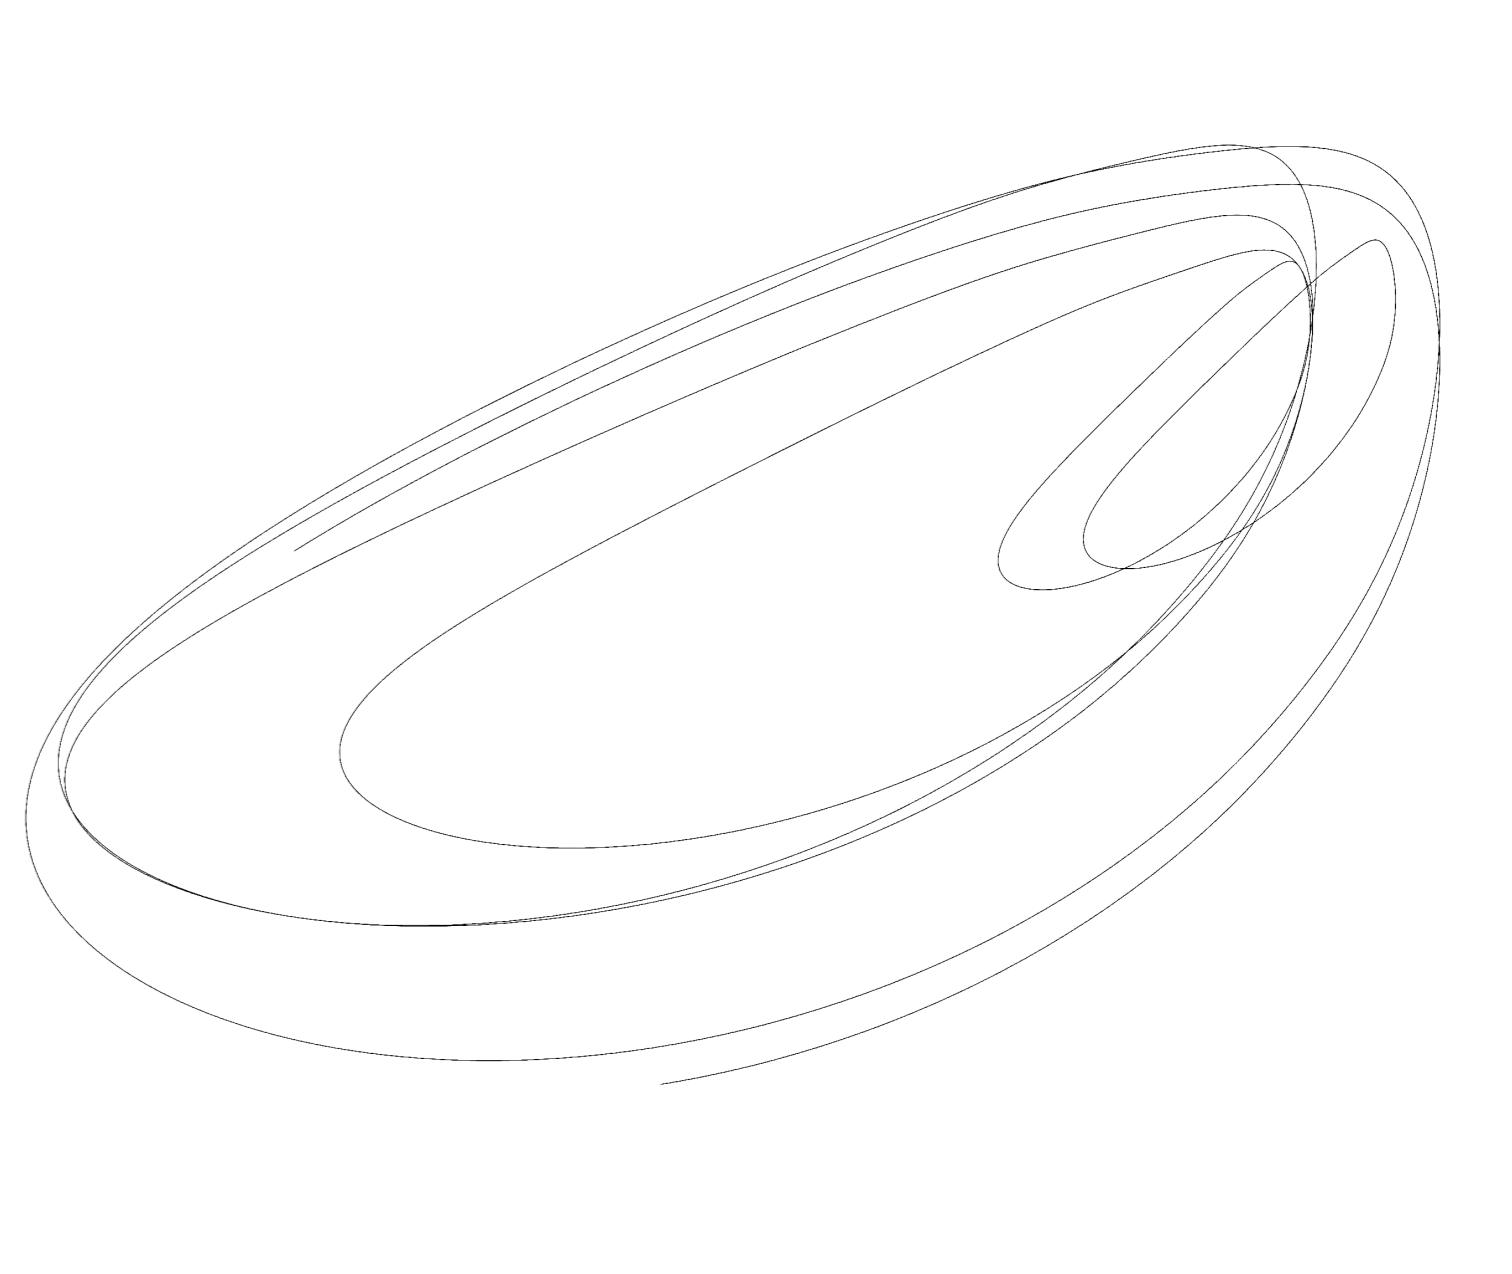
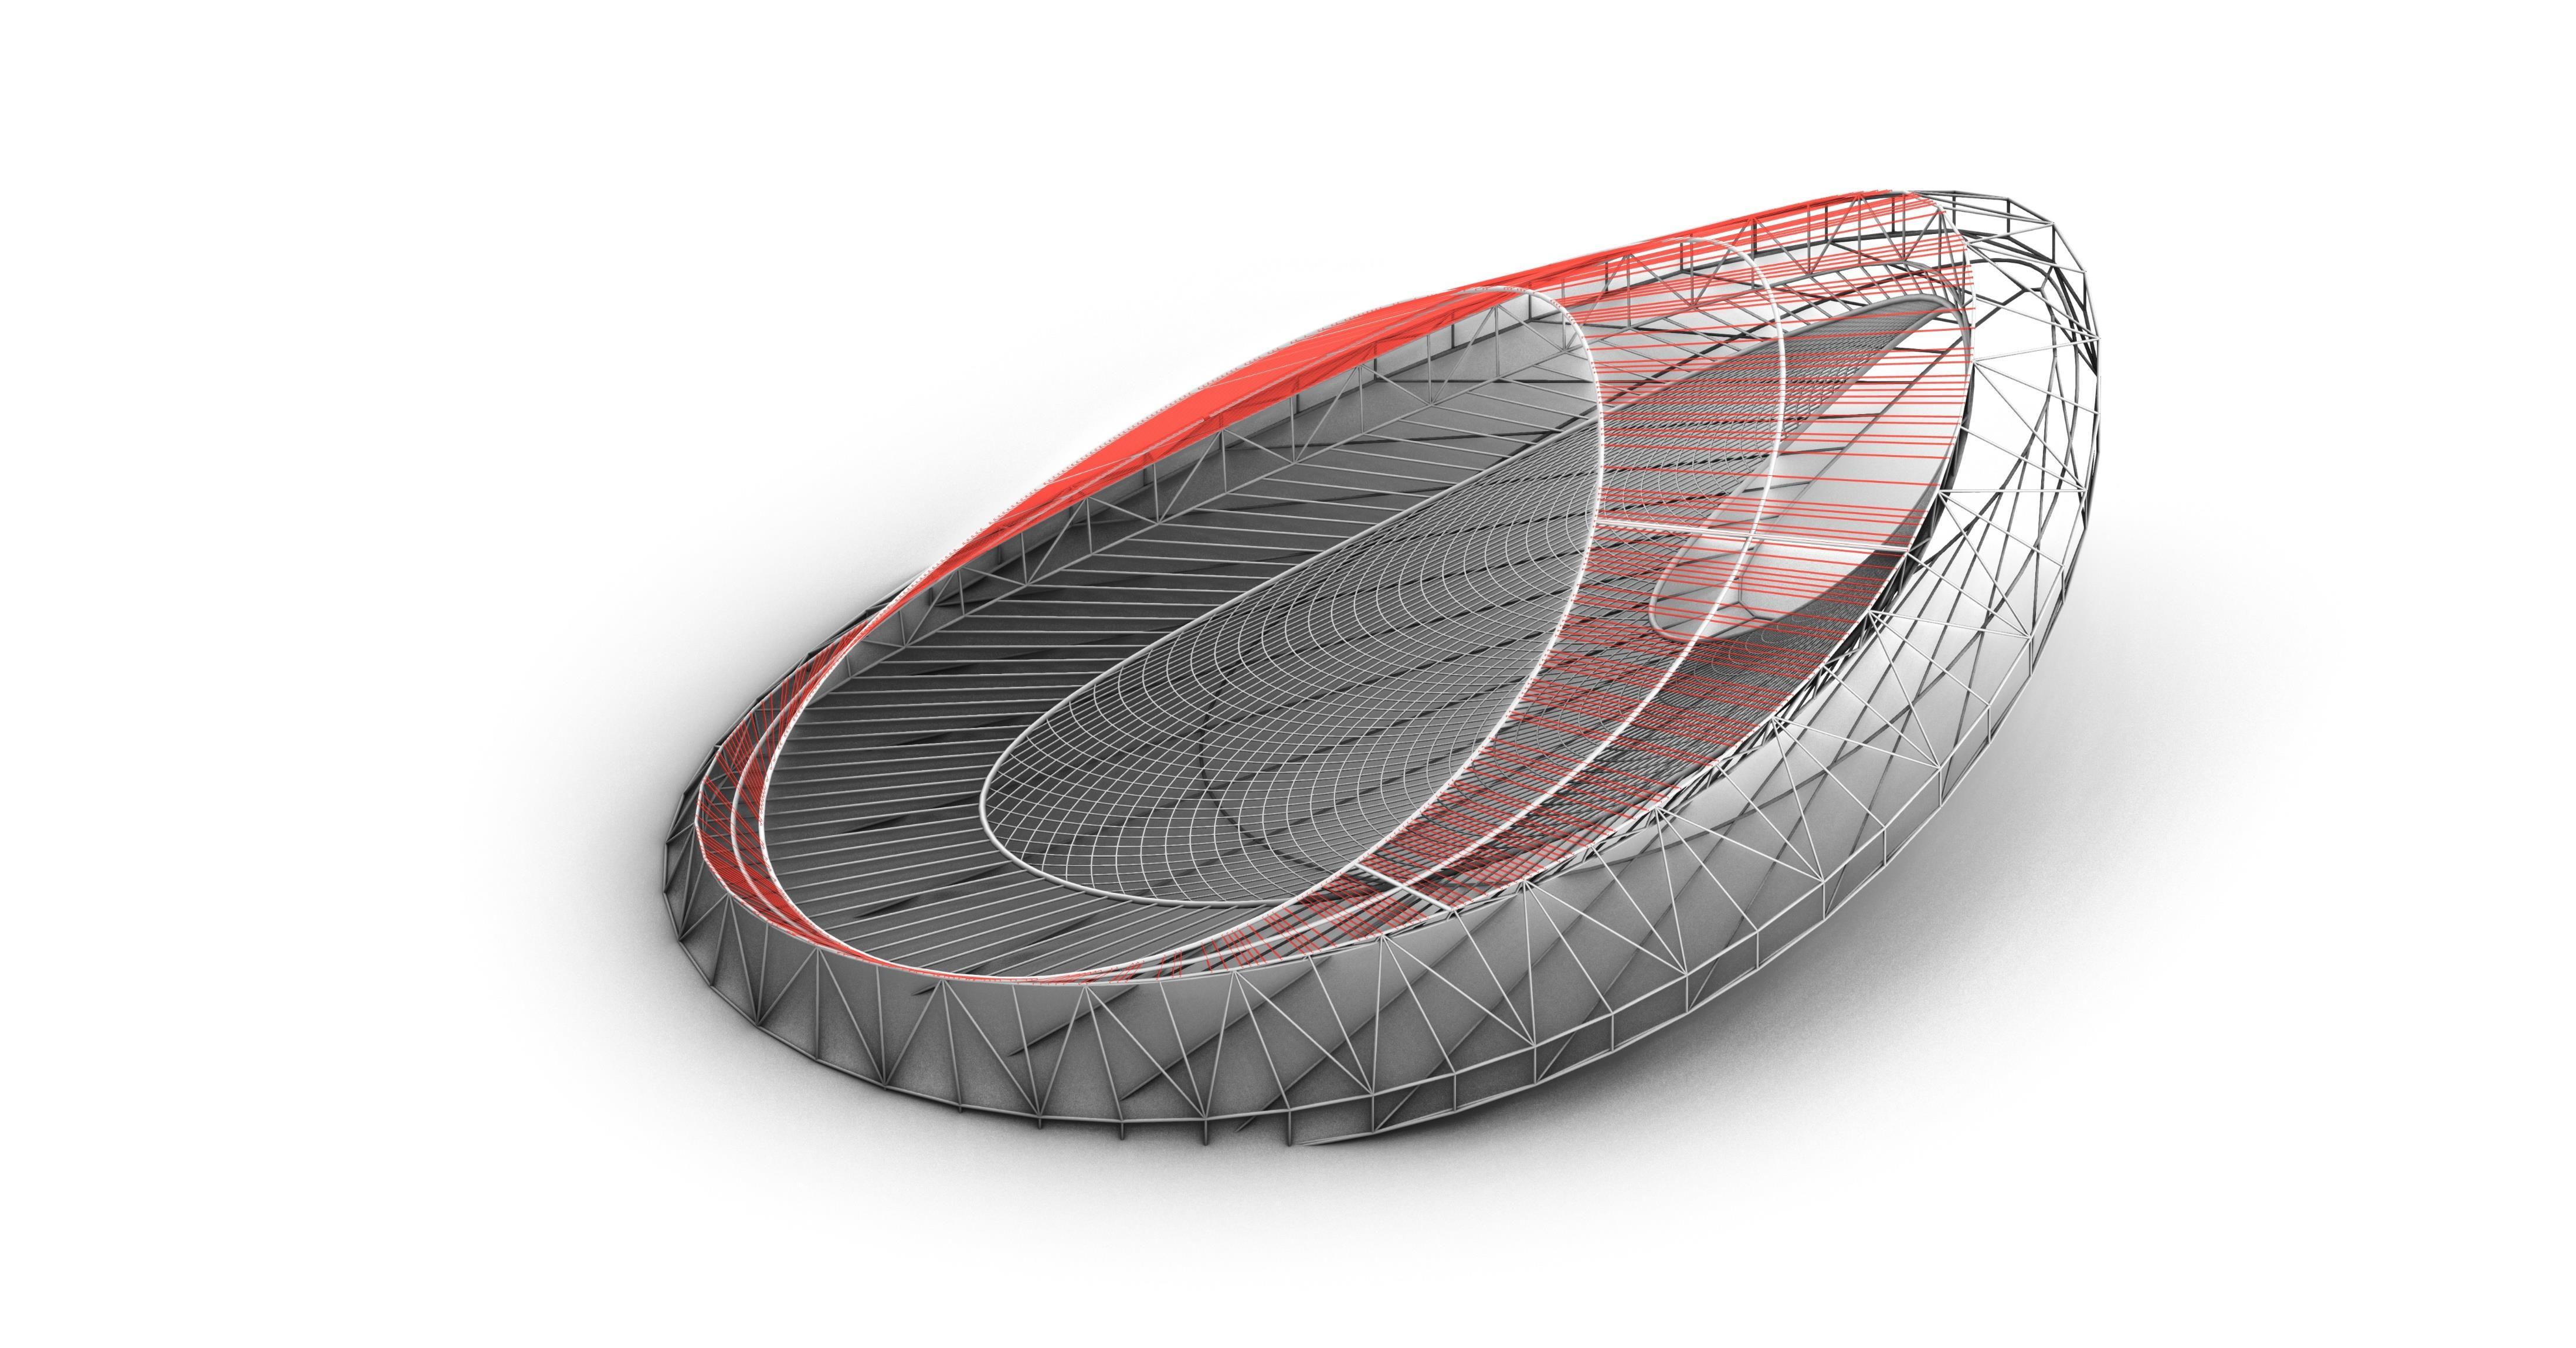
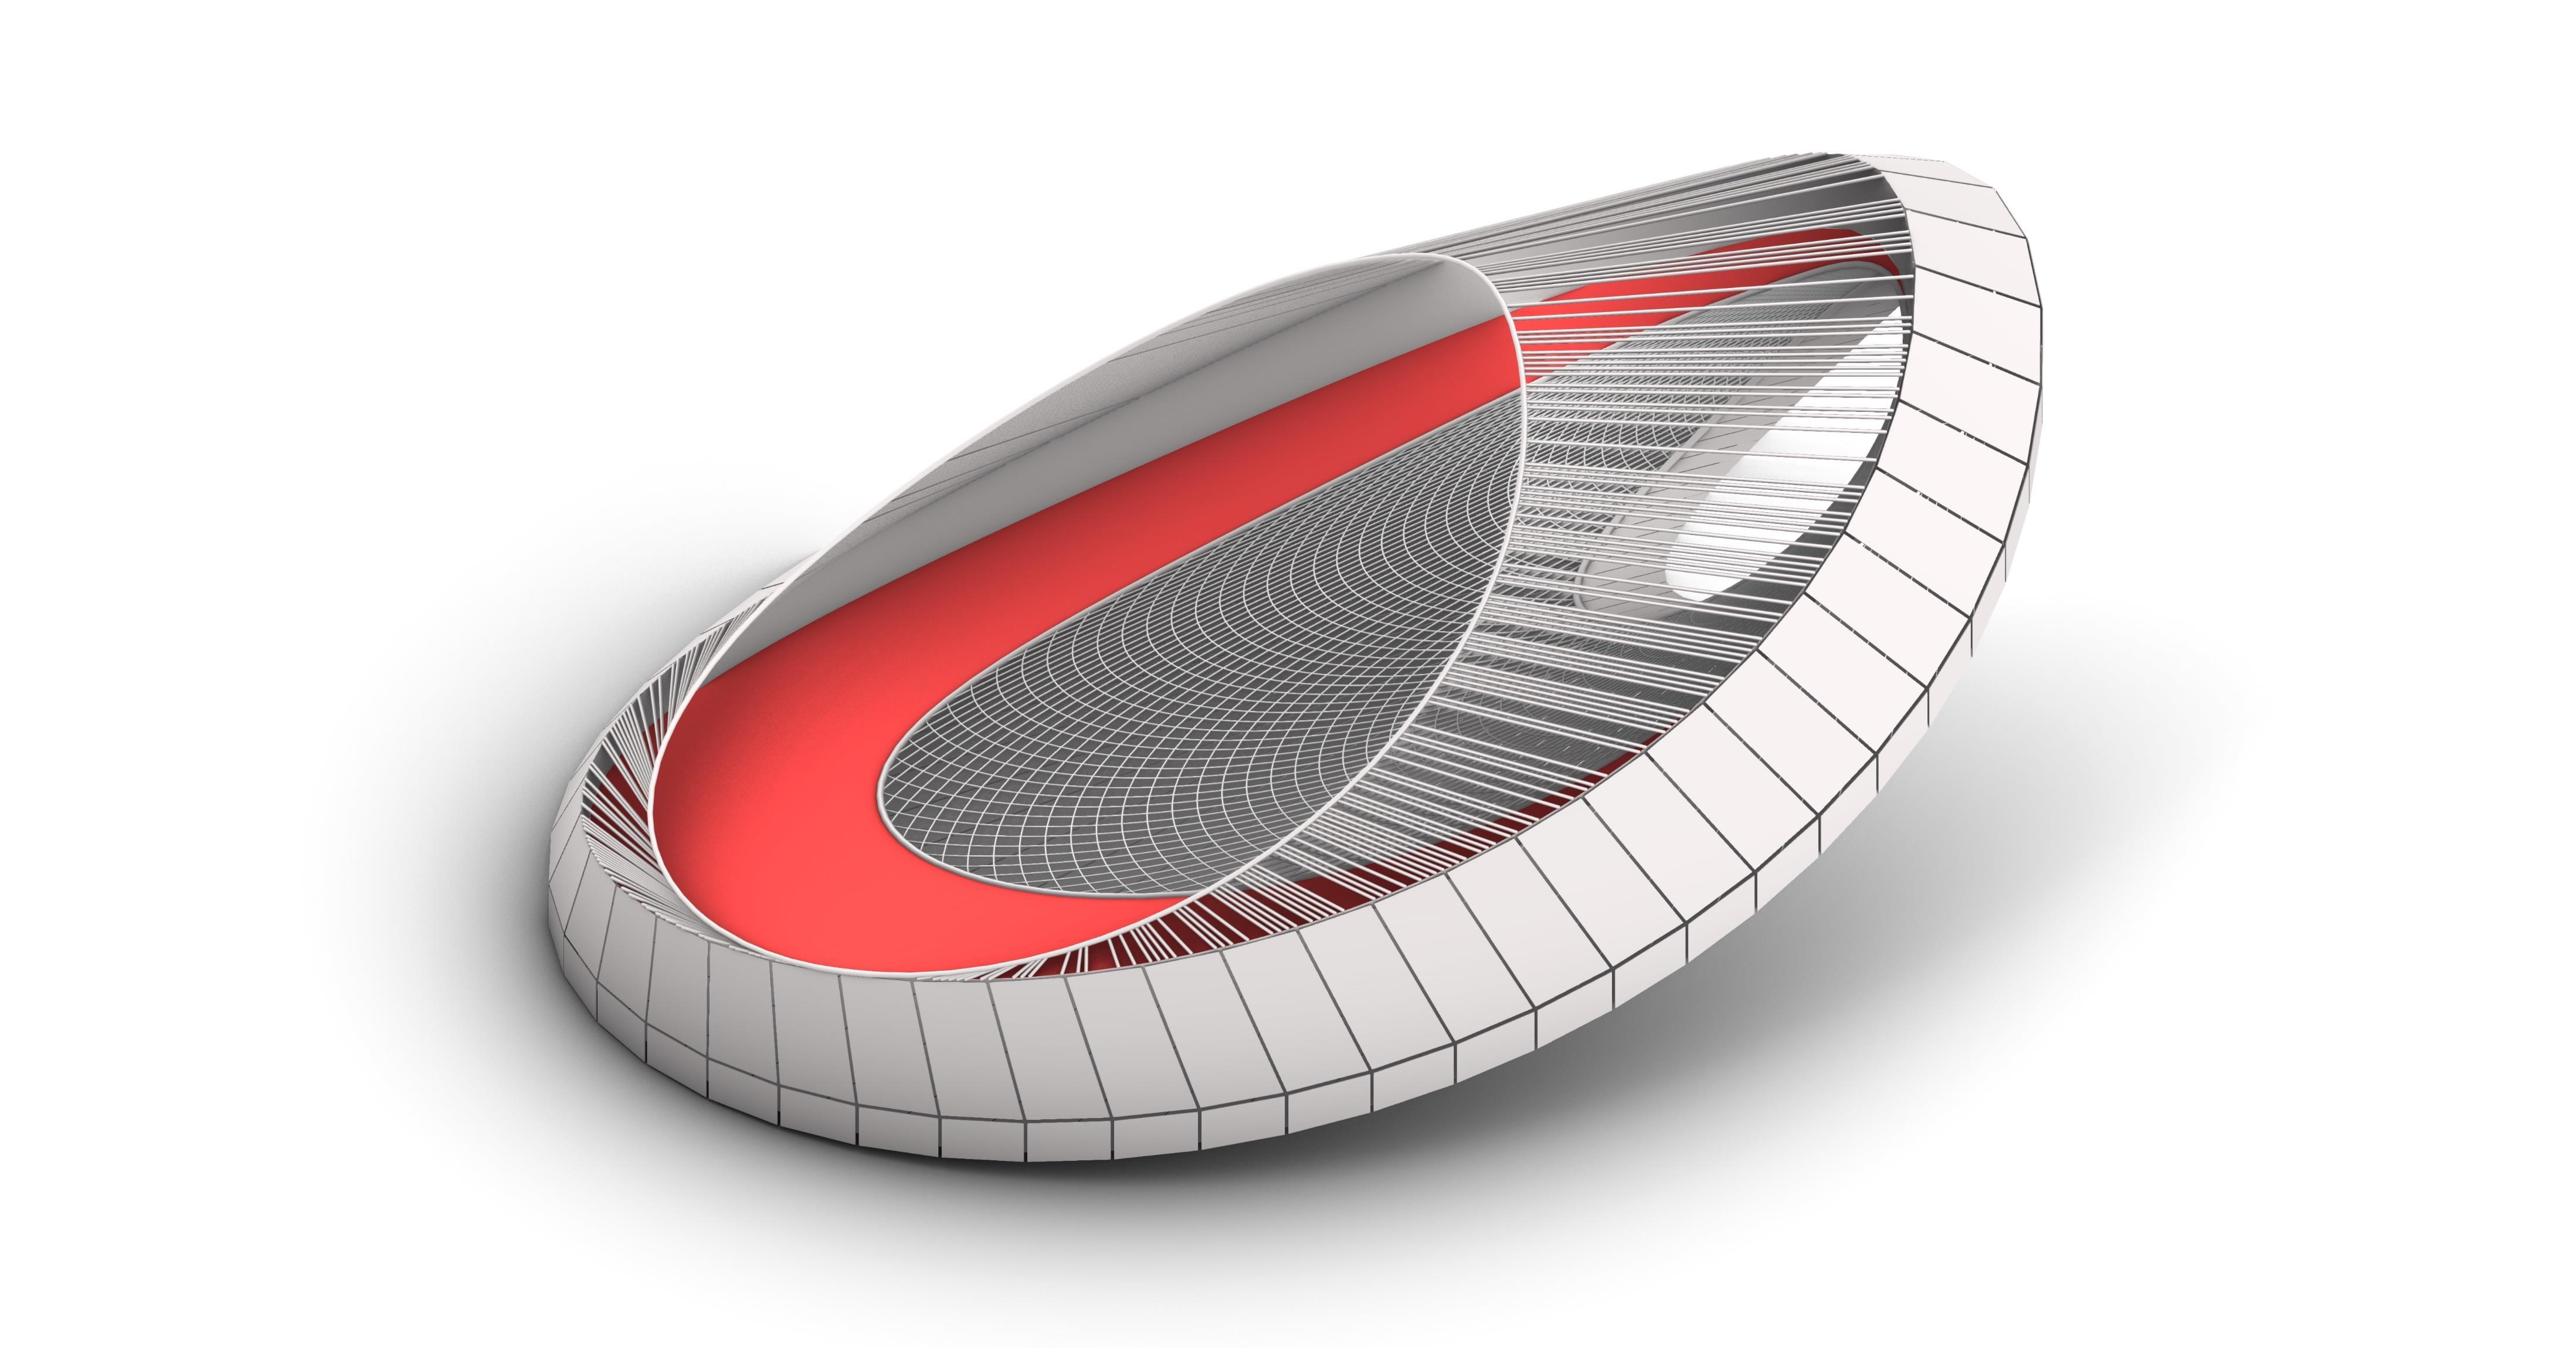
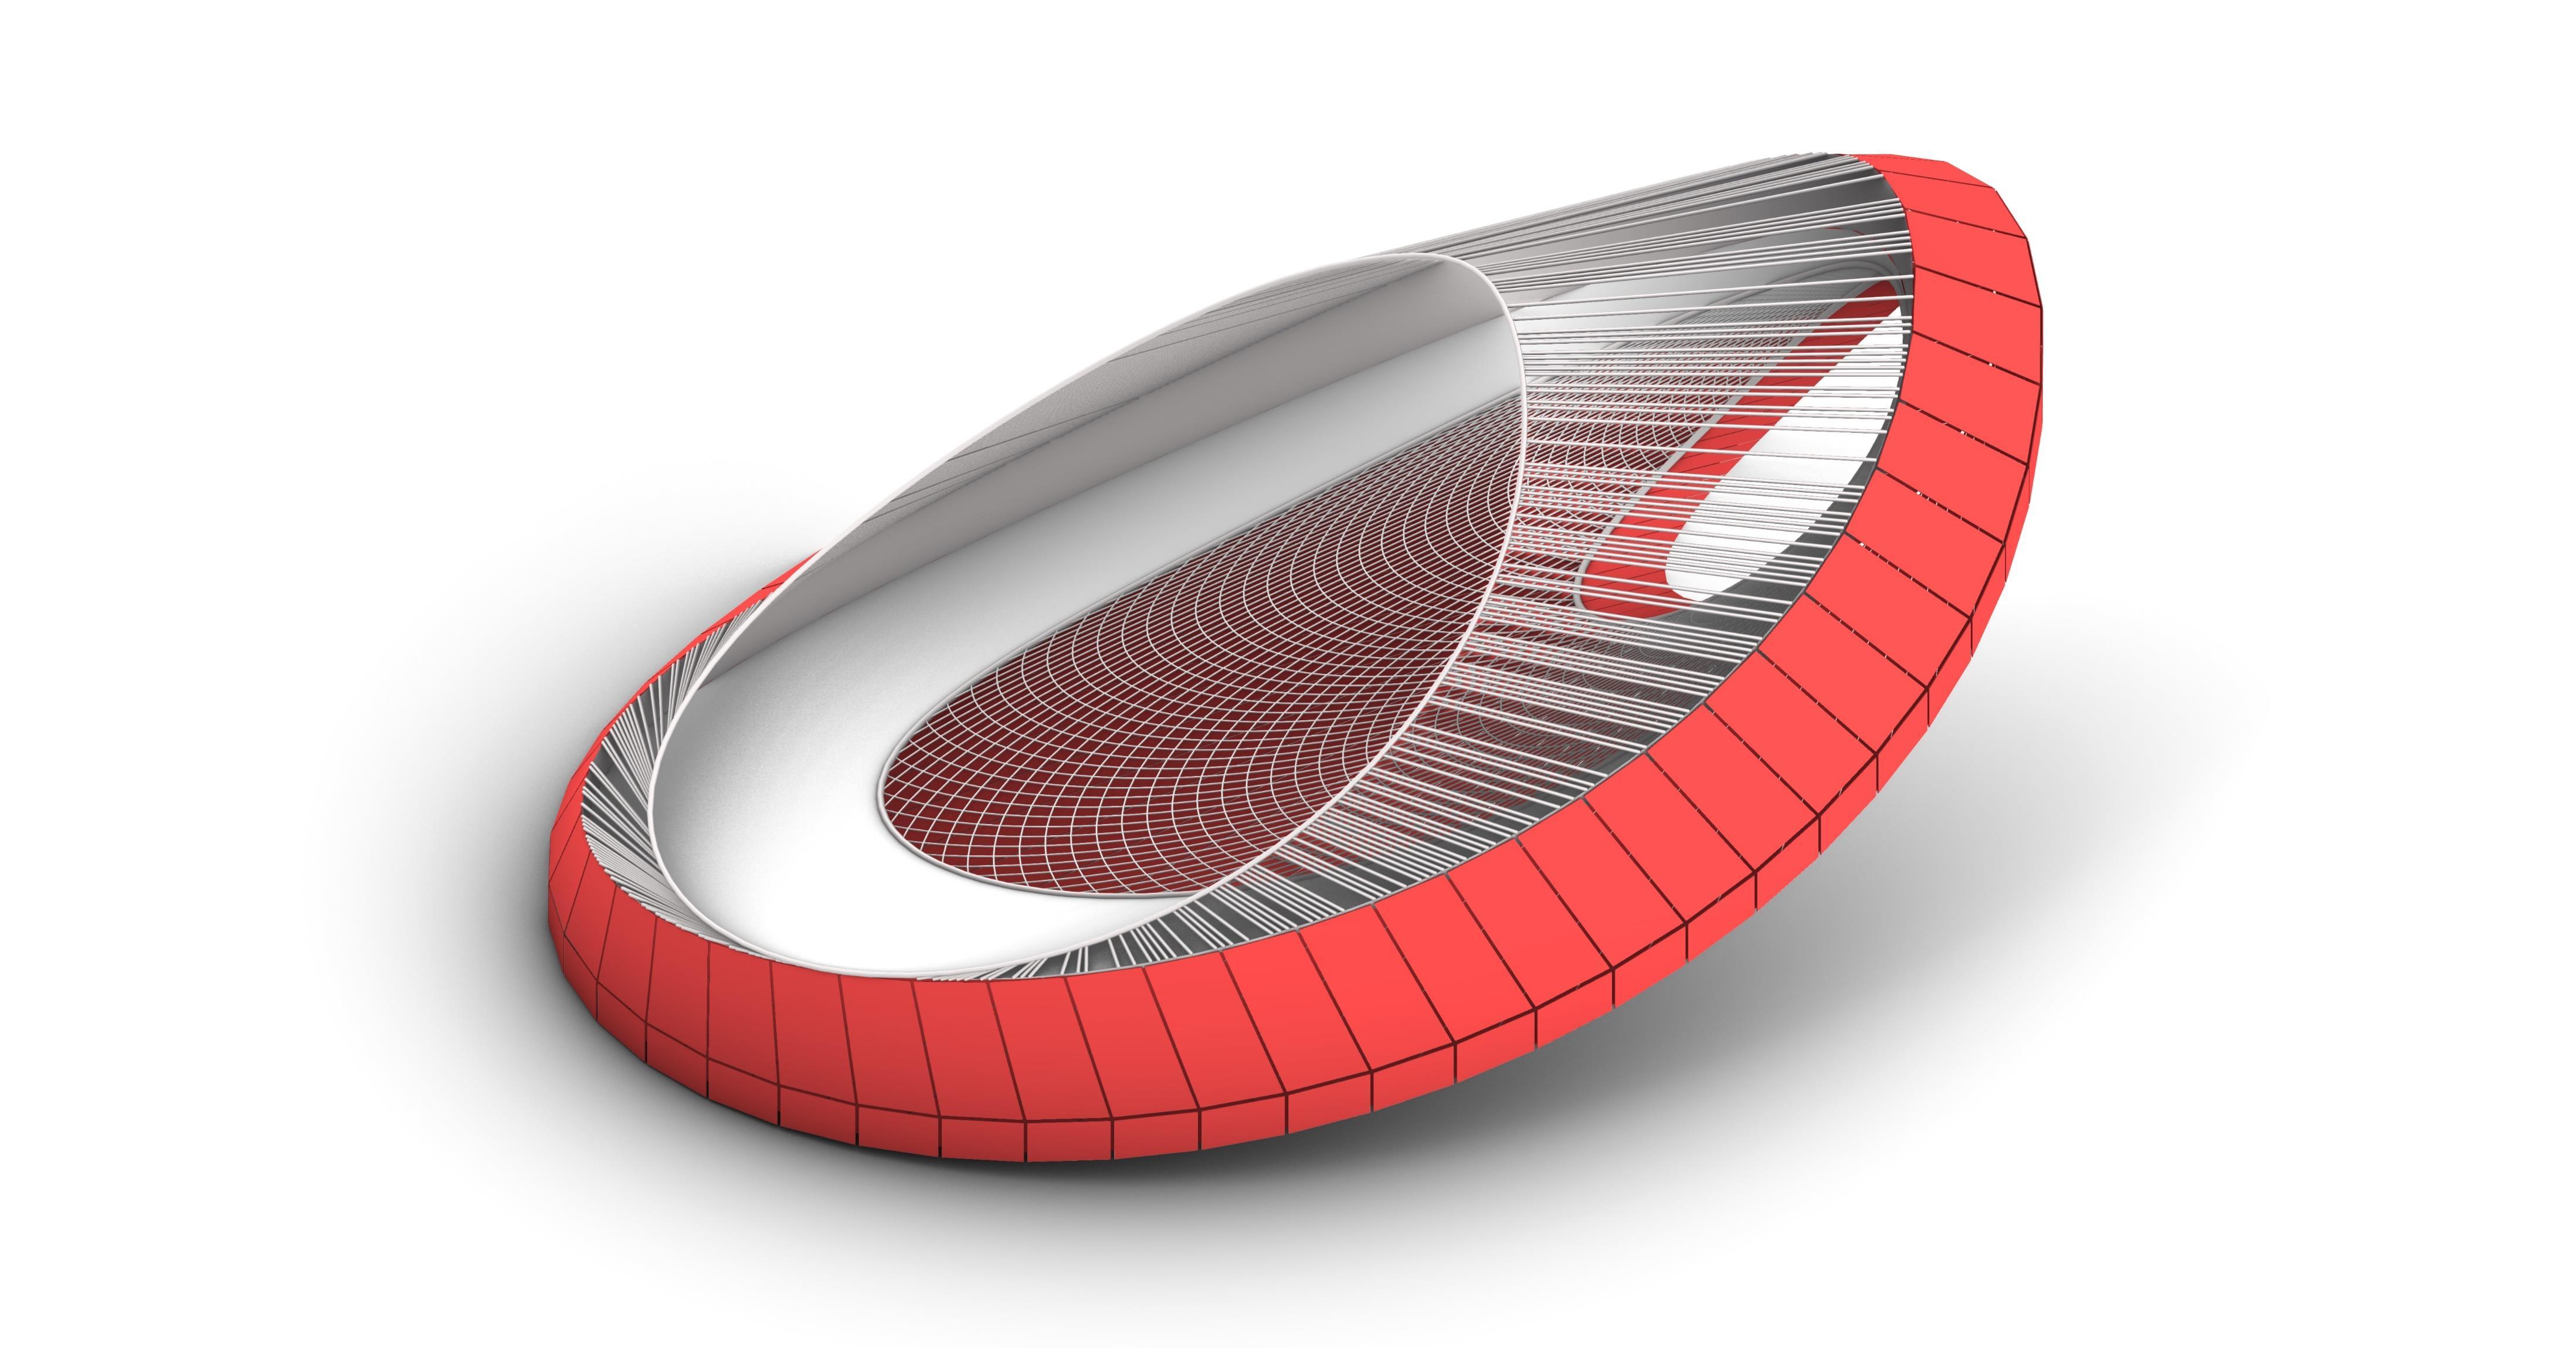
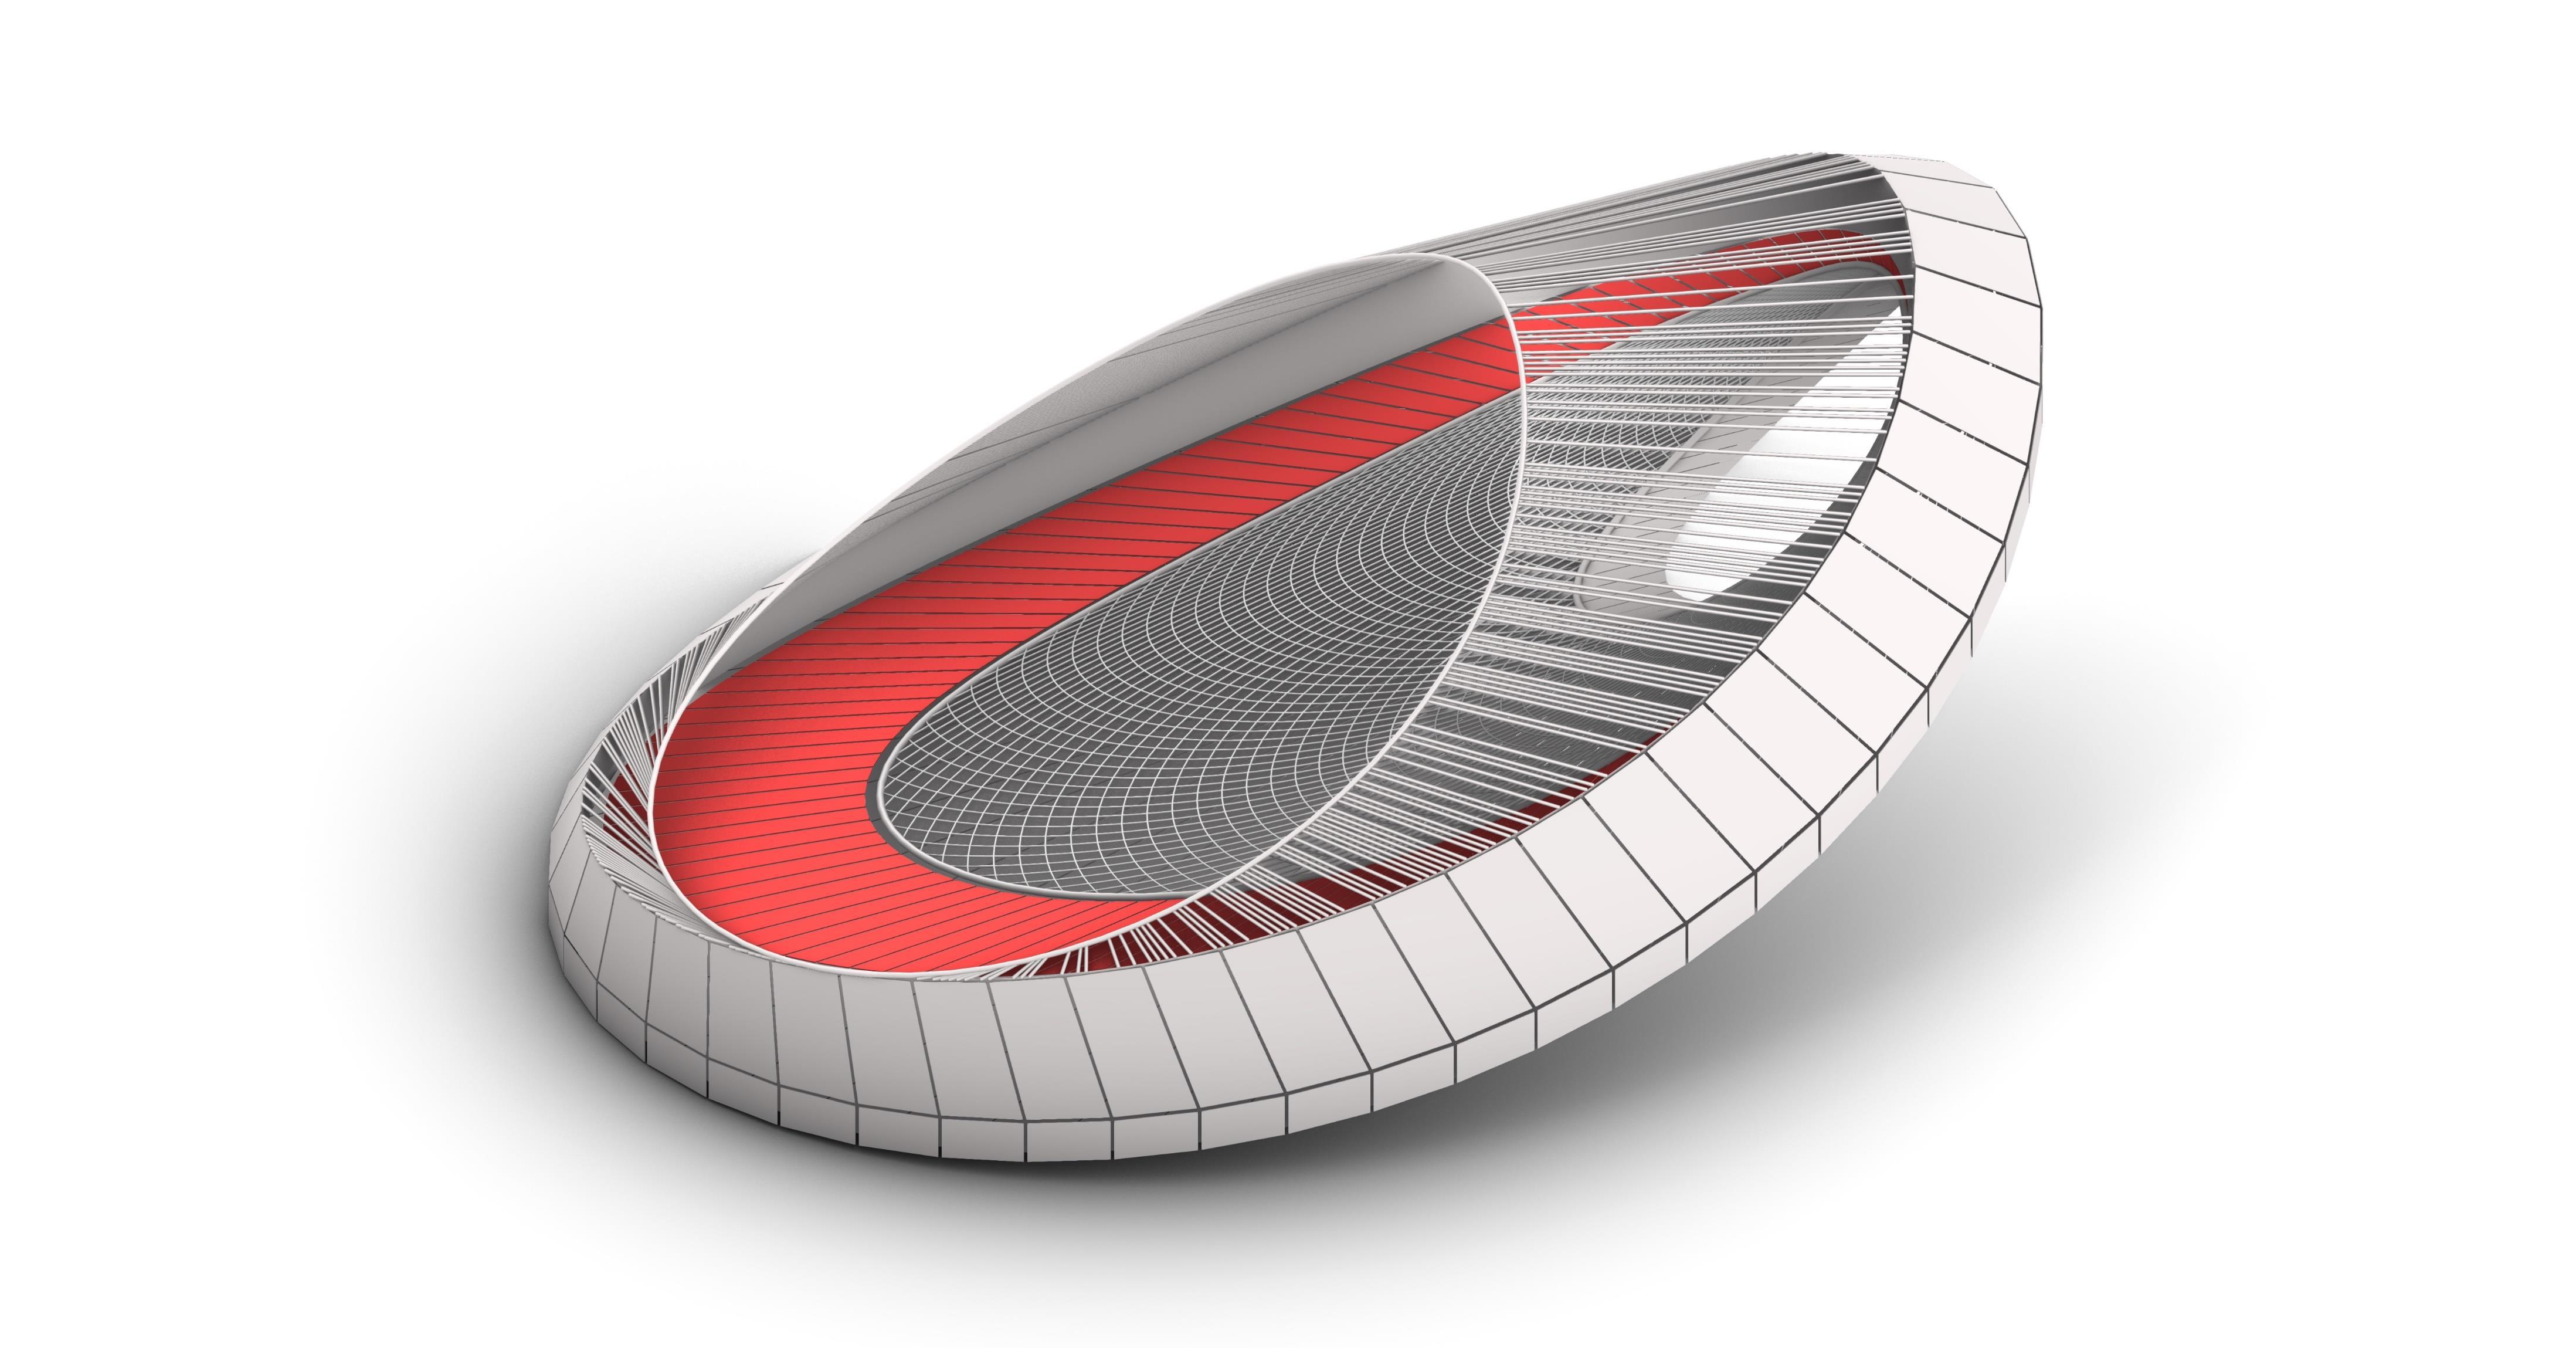
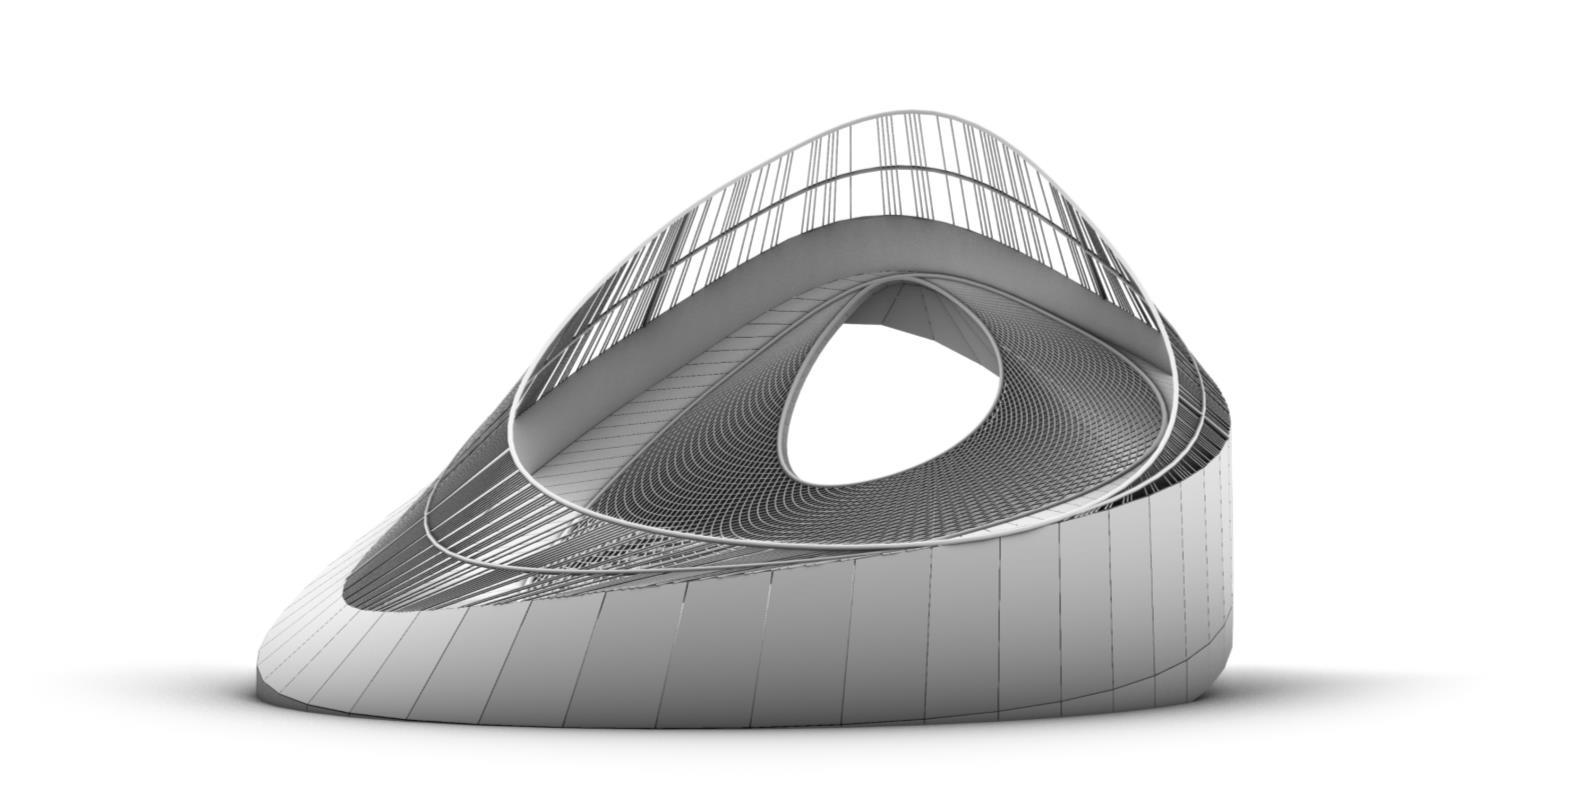
FORM
FINDING
FORM FINDING
FORMING STEPS [LADYBUG]

Start optimizing shading Generating radiation analysis
Reducing mesh where radiation is low to optimize the view outside
Top view of the element showing dense membrane on the left and lighter on the right
STRUCTURAL MODELLING
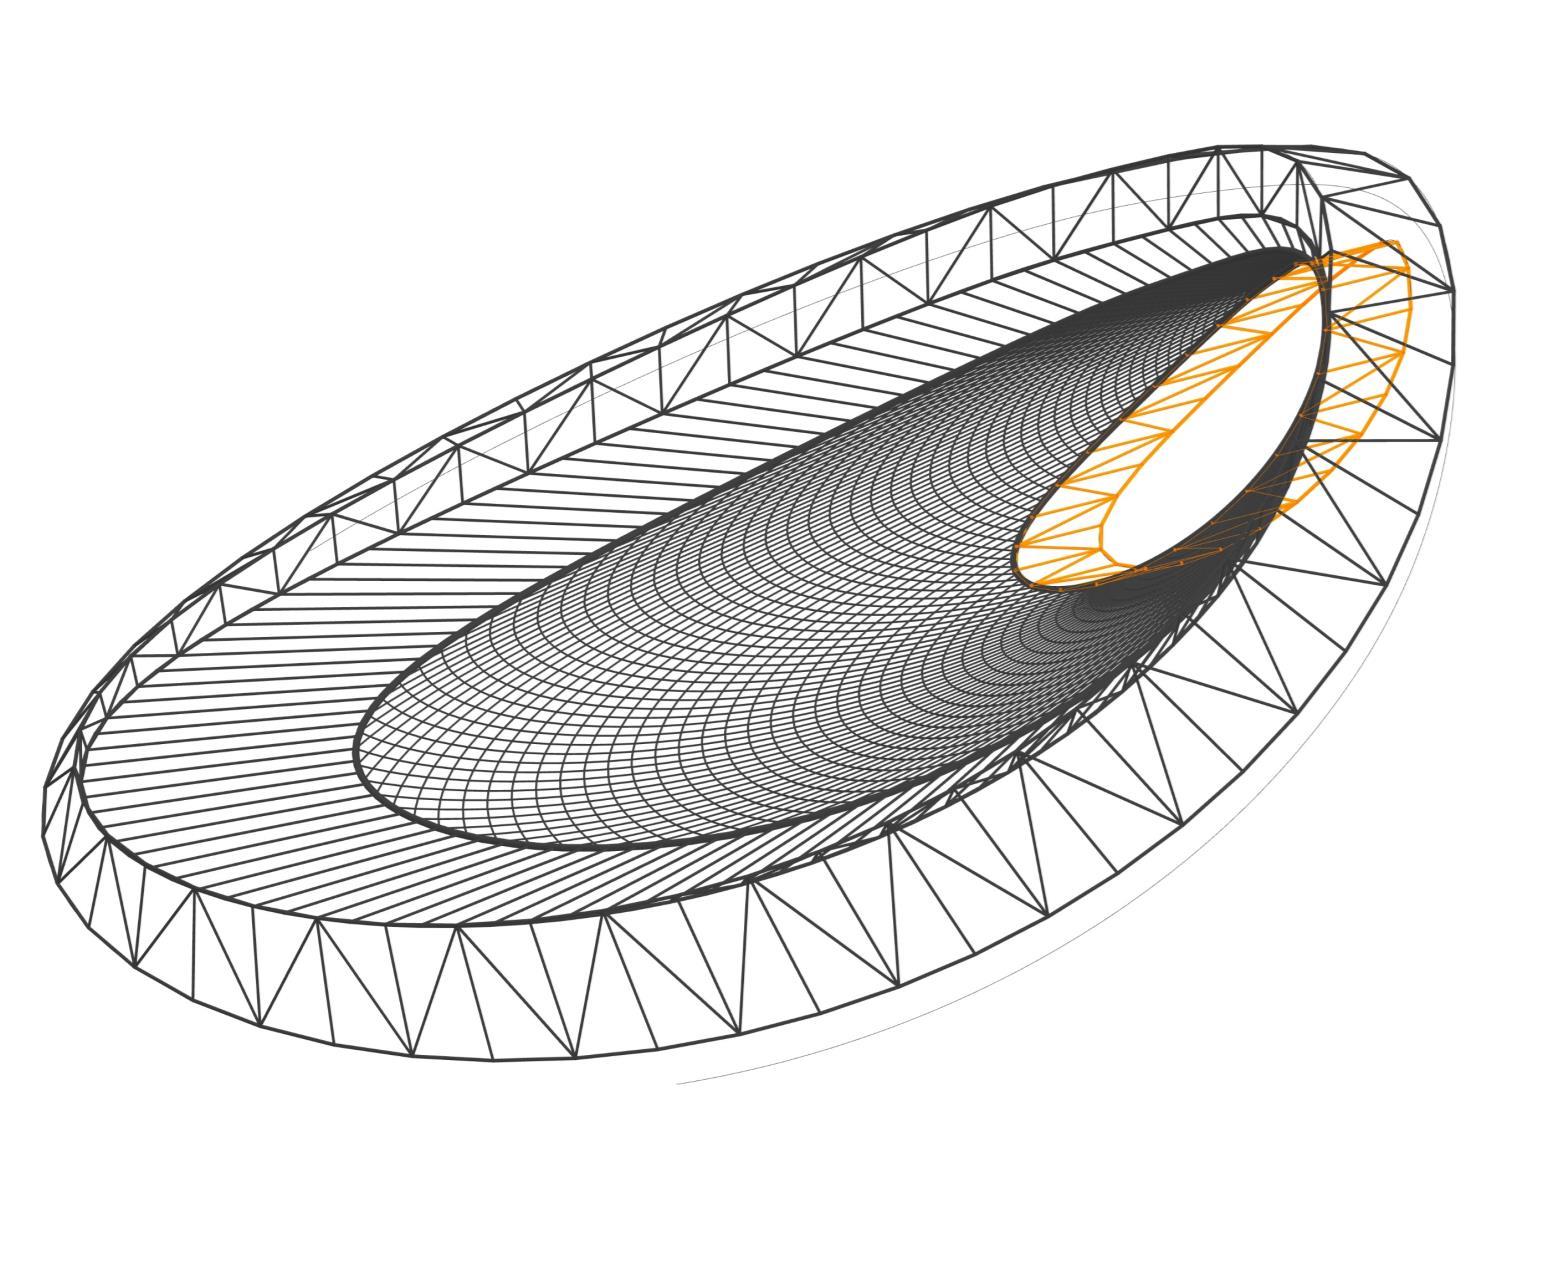
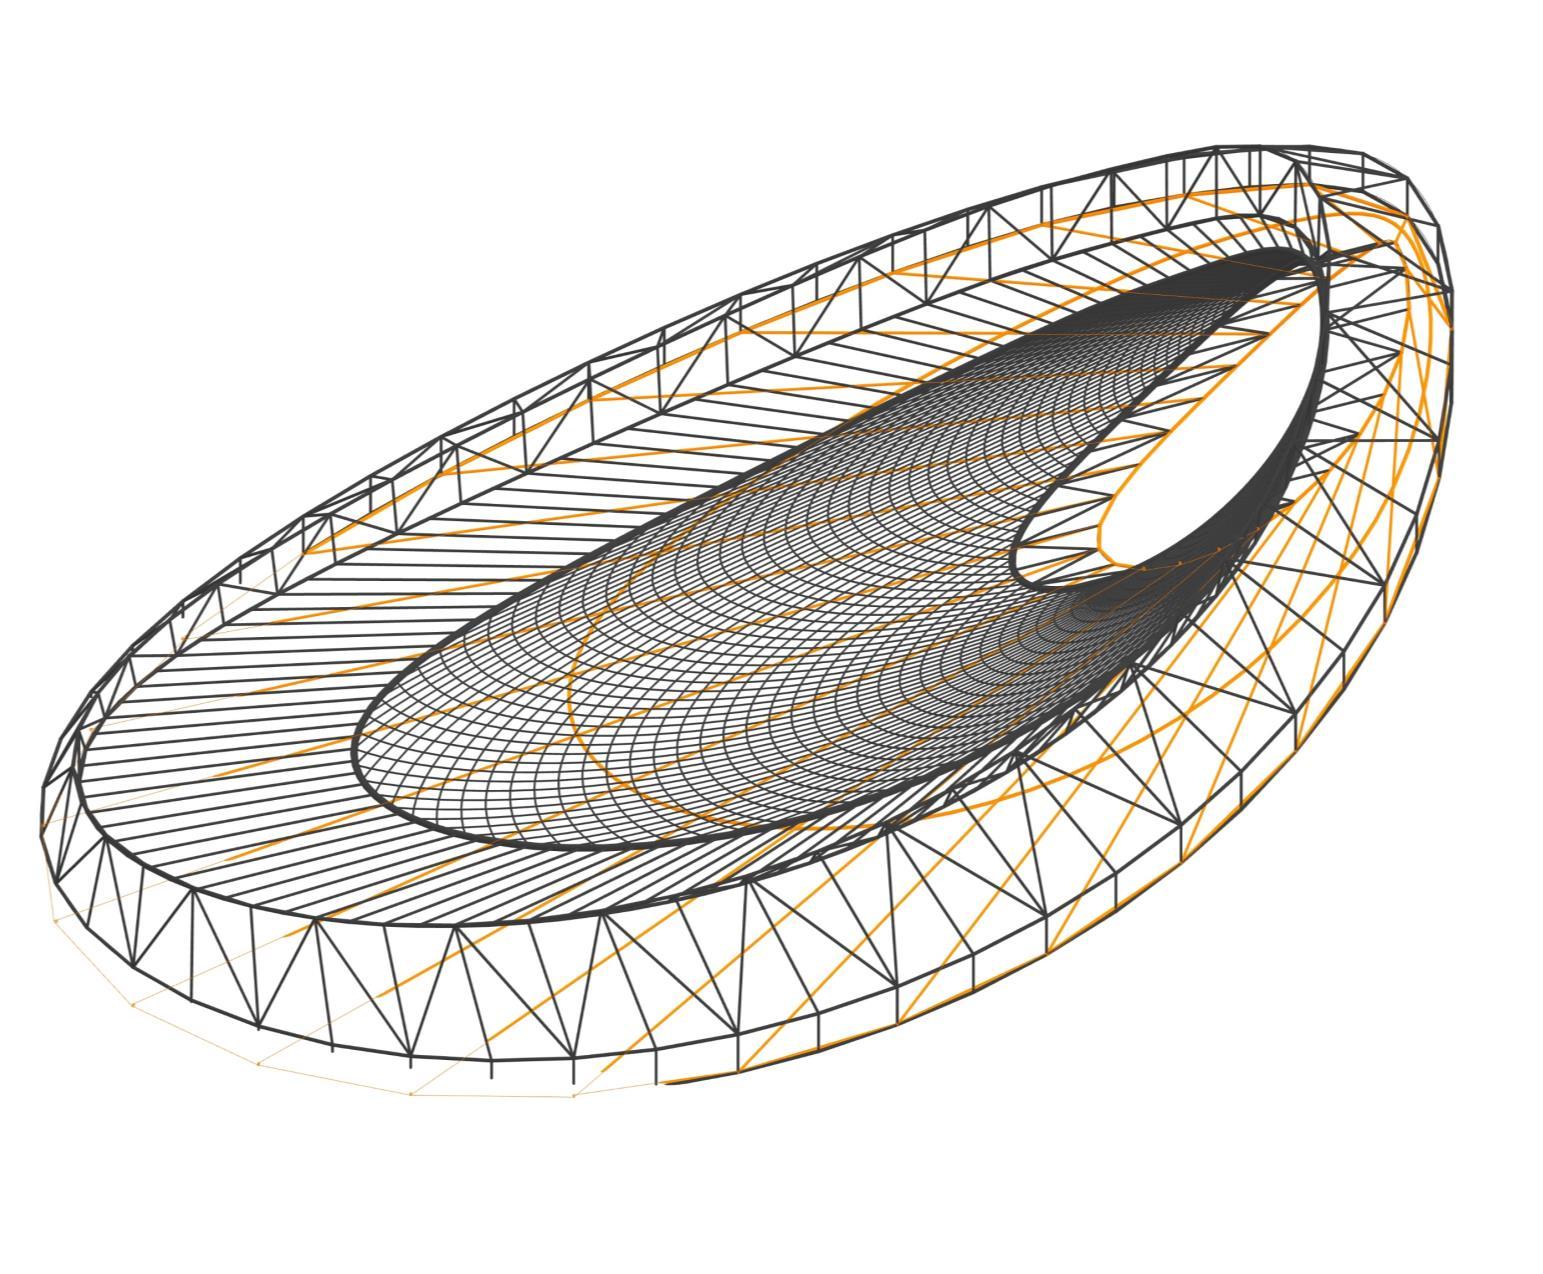
DESIGNING STRUCTURE
[LUNCHBOX]

Start designing the structure Main outside truss structure
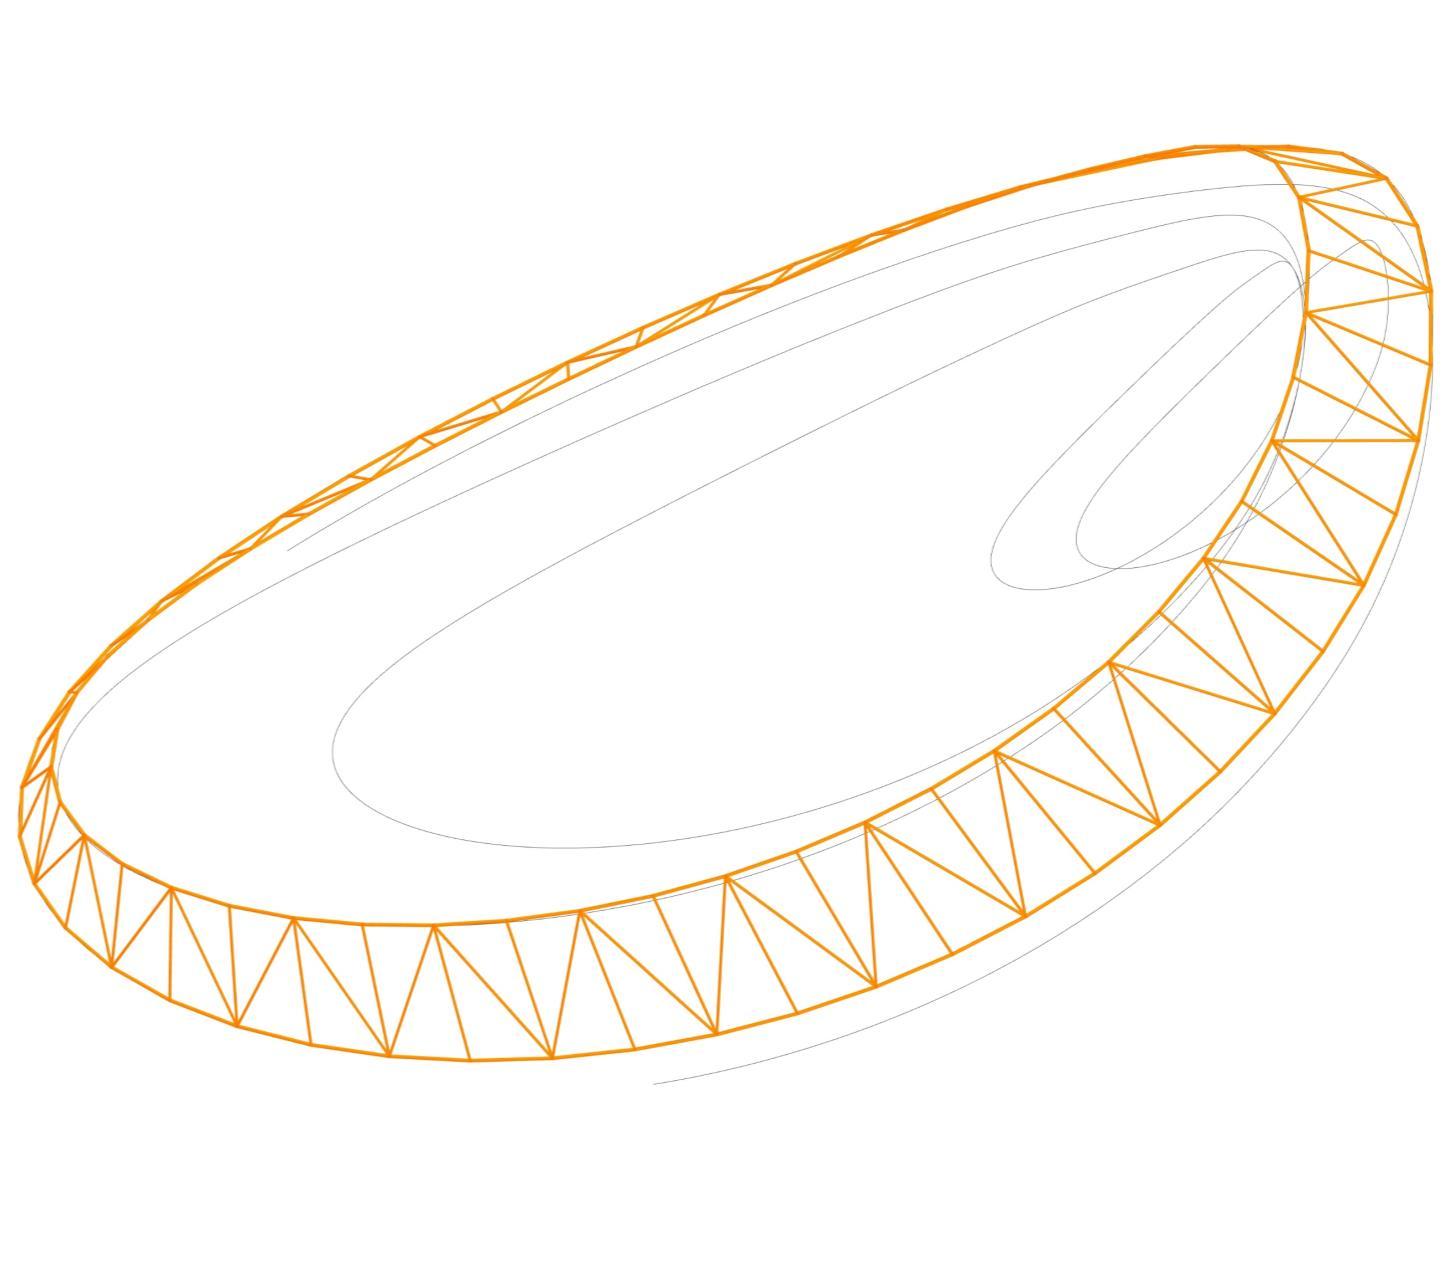
Main inside truss structure
Main inside beam connection
Design Elastic net for seating Design intermediate truss structure
Design main beam in touch with the ground
Design structure for back face of the pavilion
STRUCTURAL MODELLING
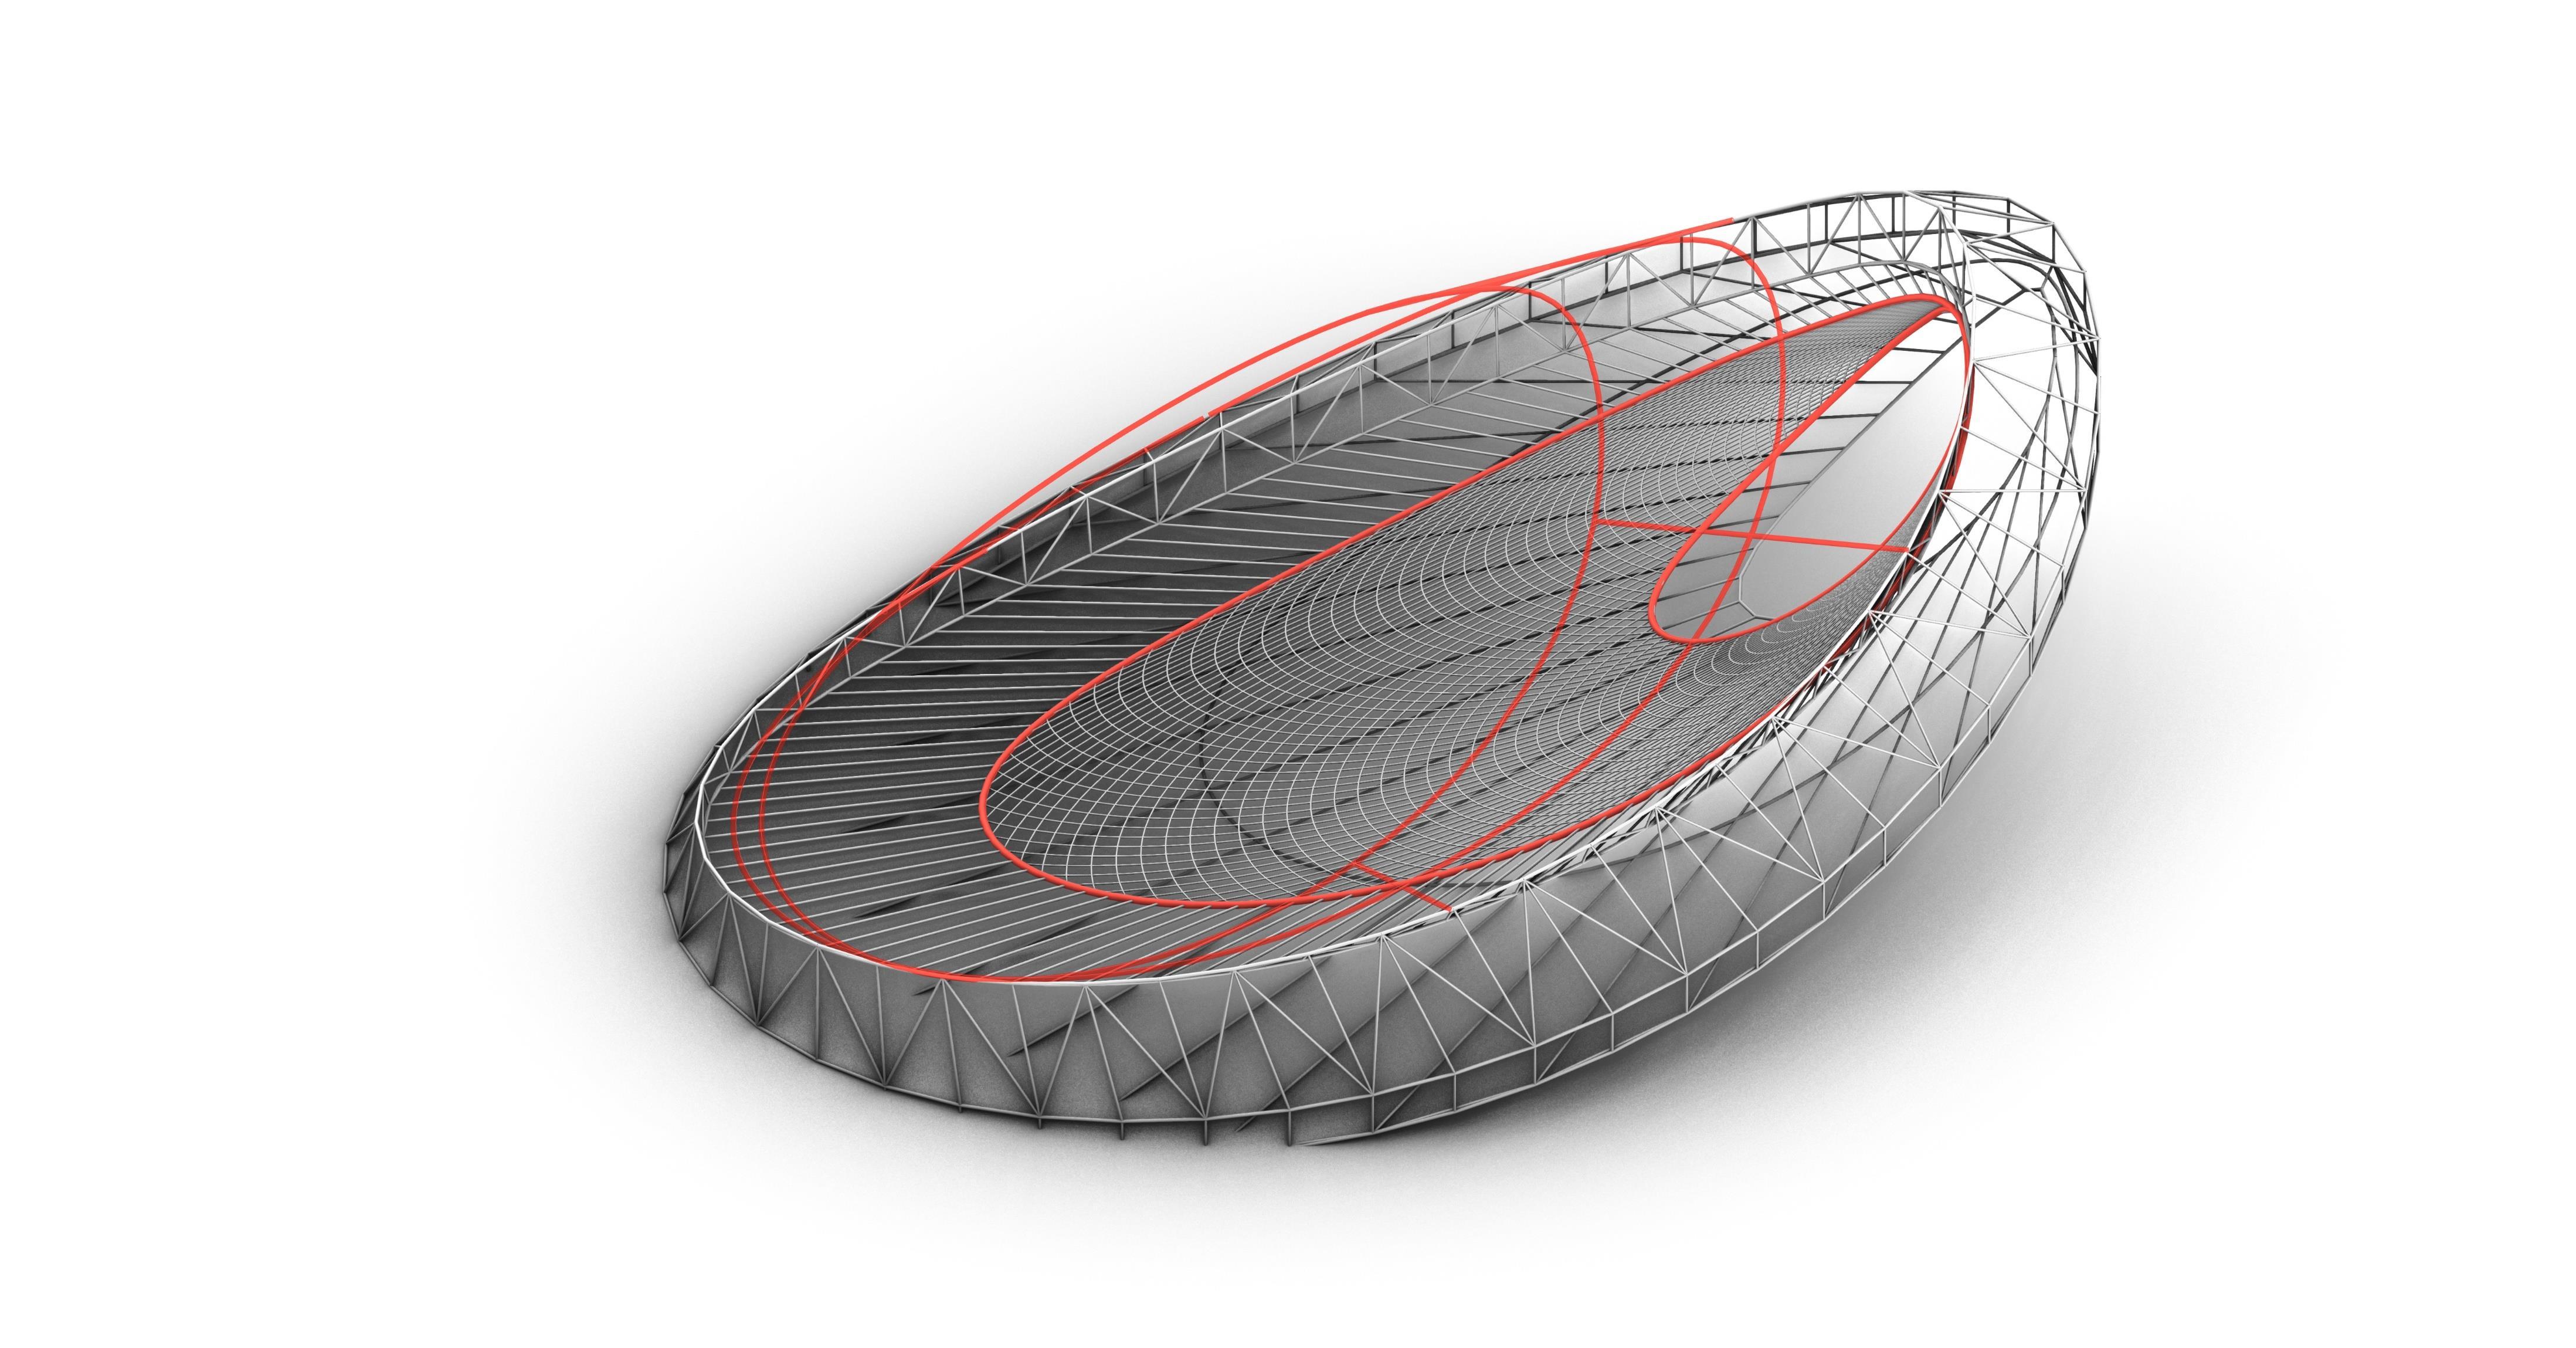
FINALIZING STRUCTURE
Start designing the shading structure Main beam structure
Secondary elements for shading Final Structure Model
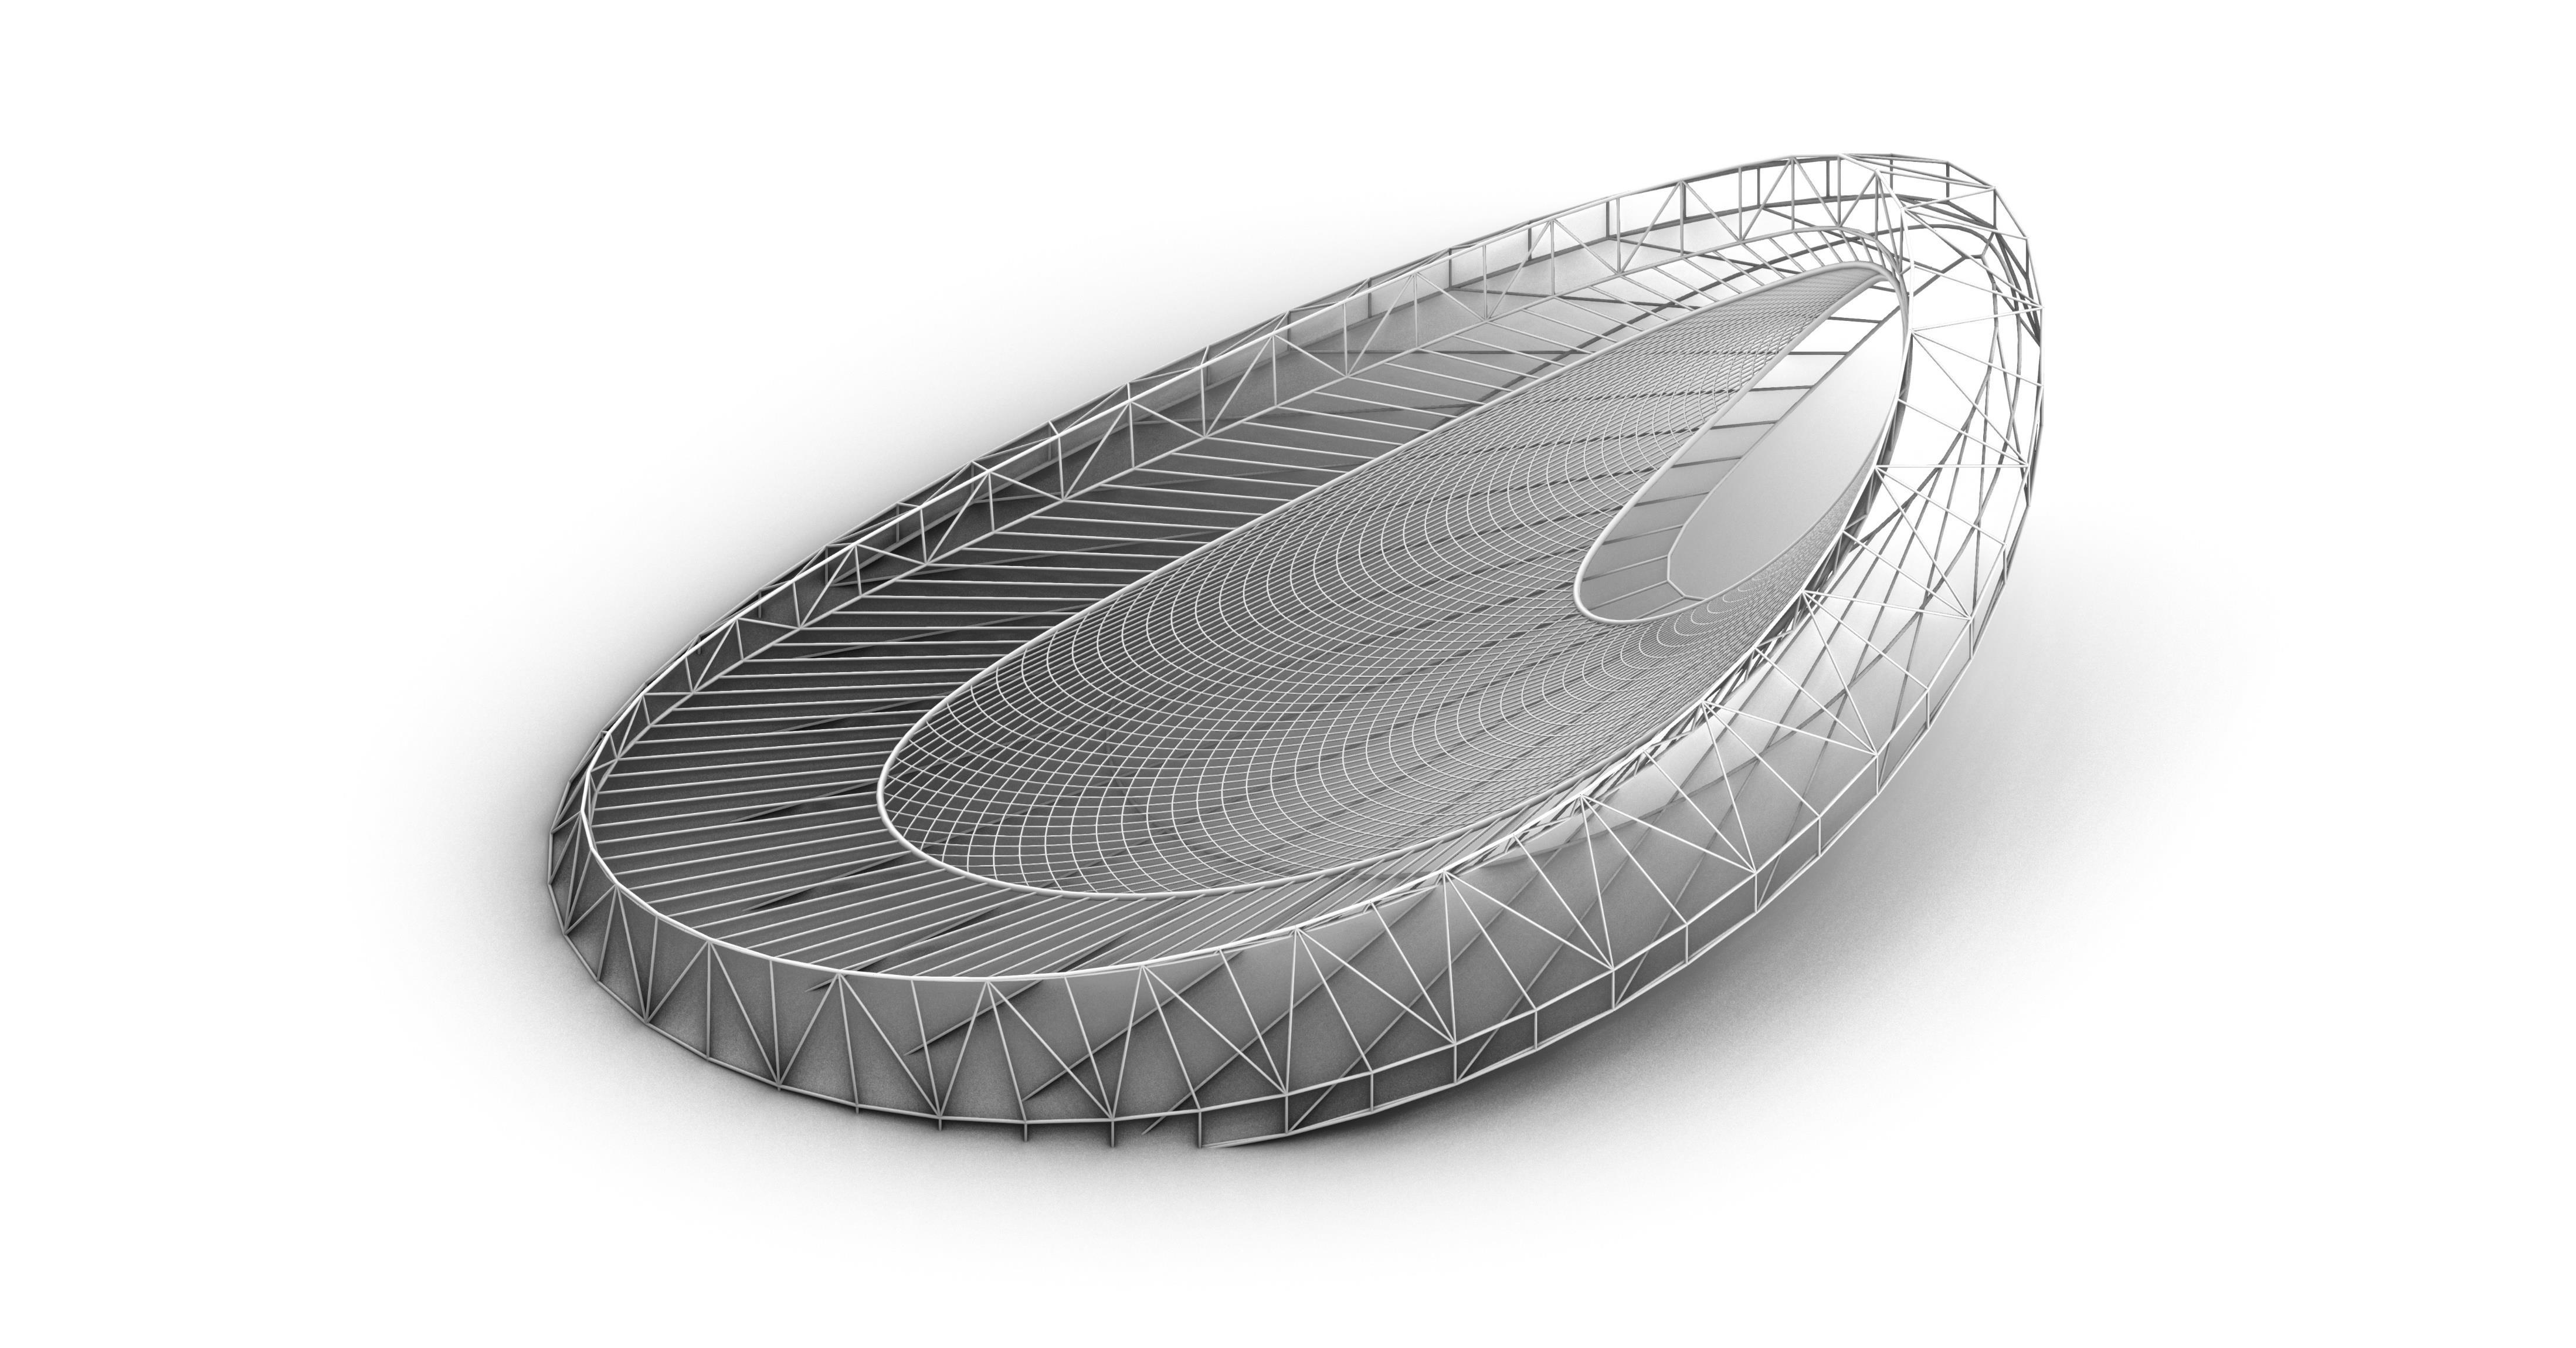
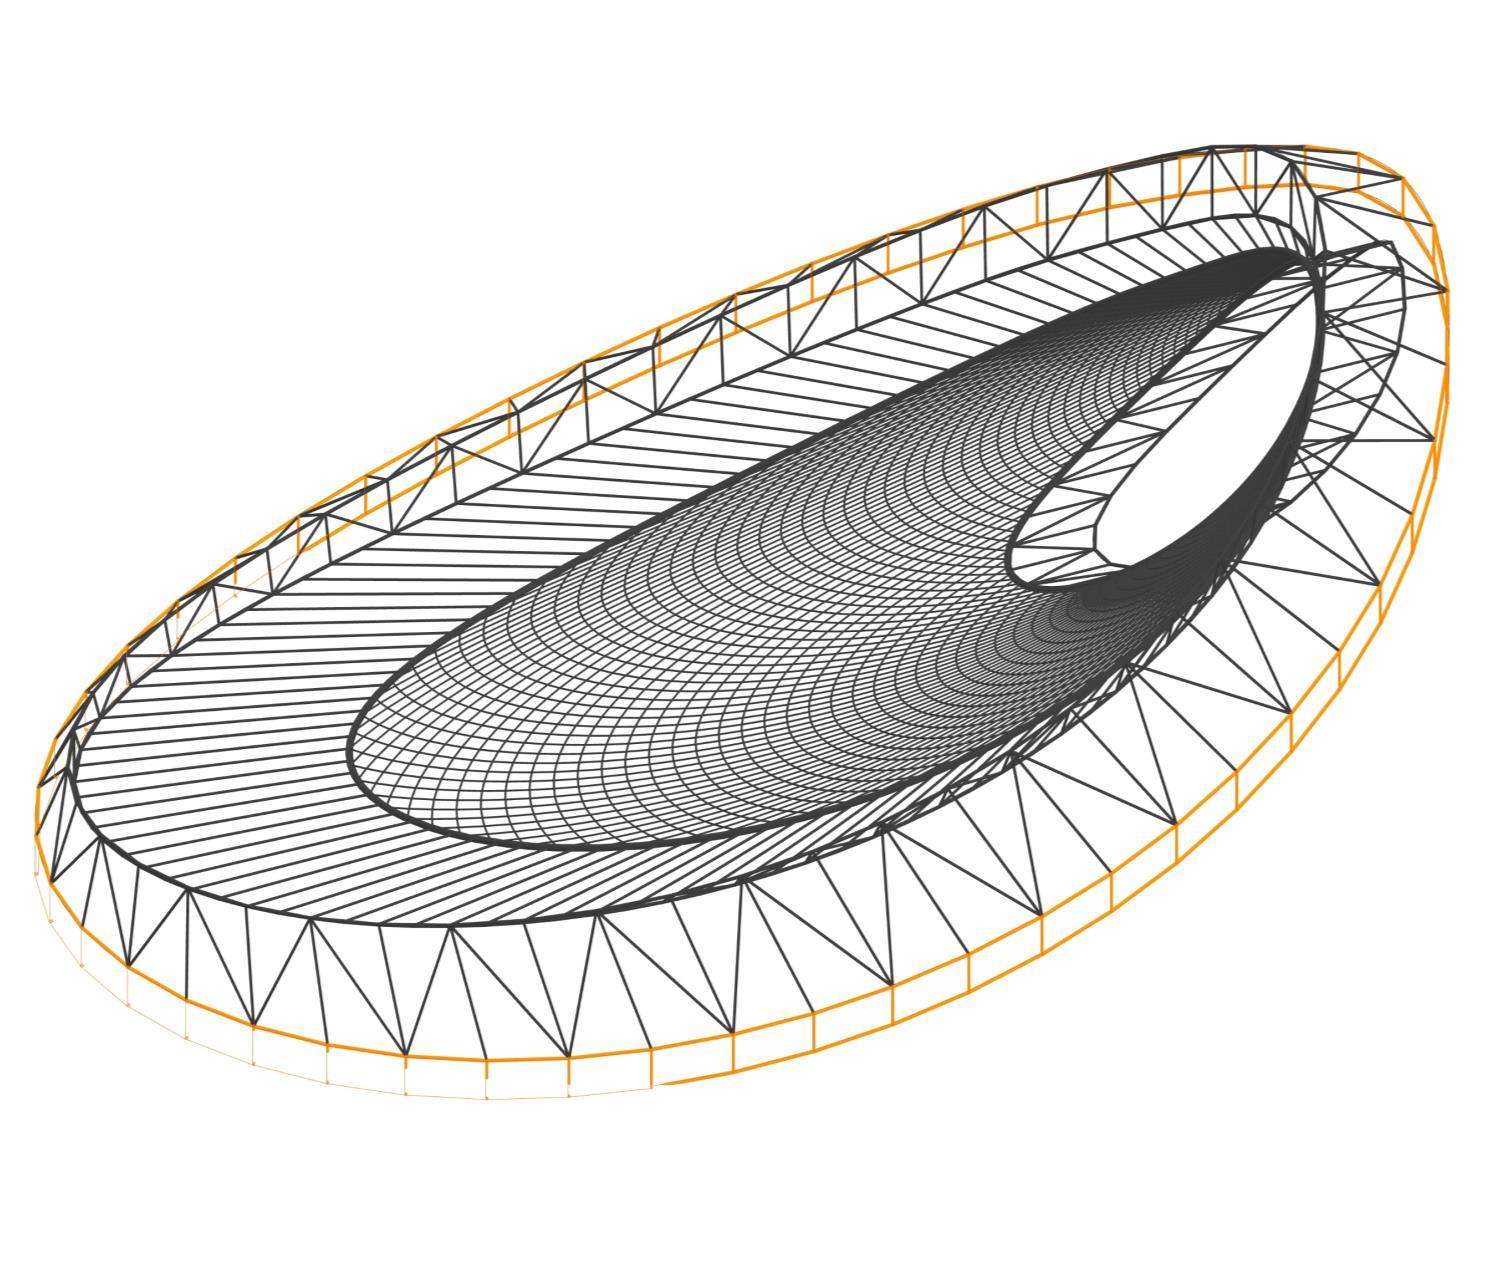
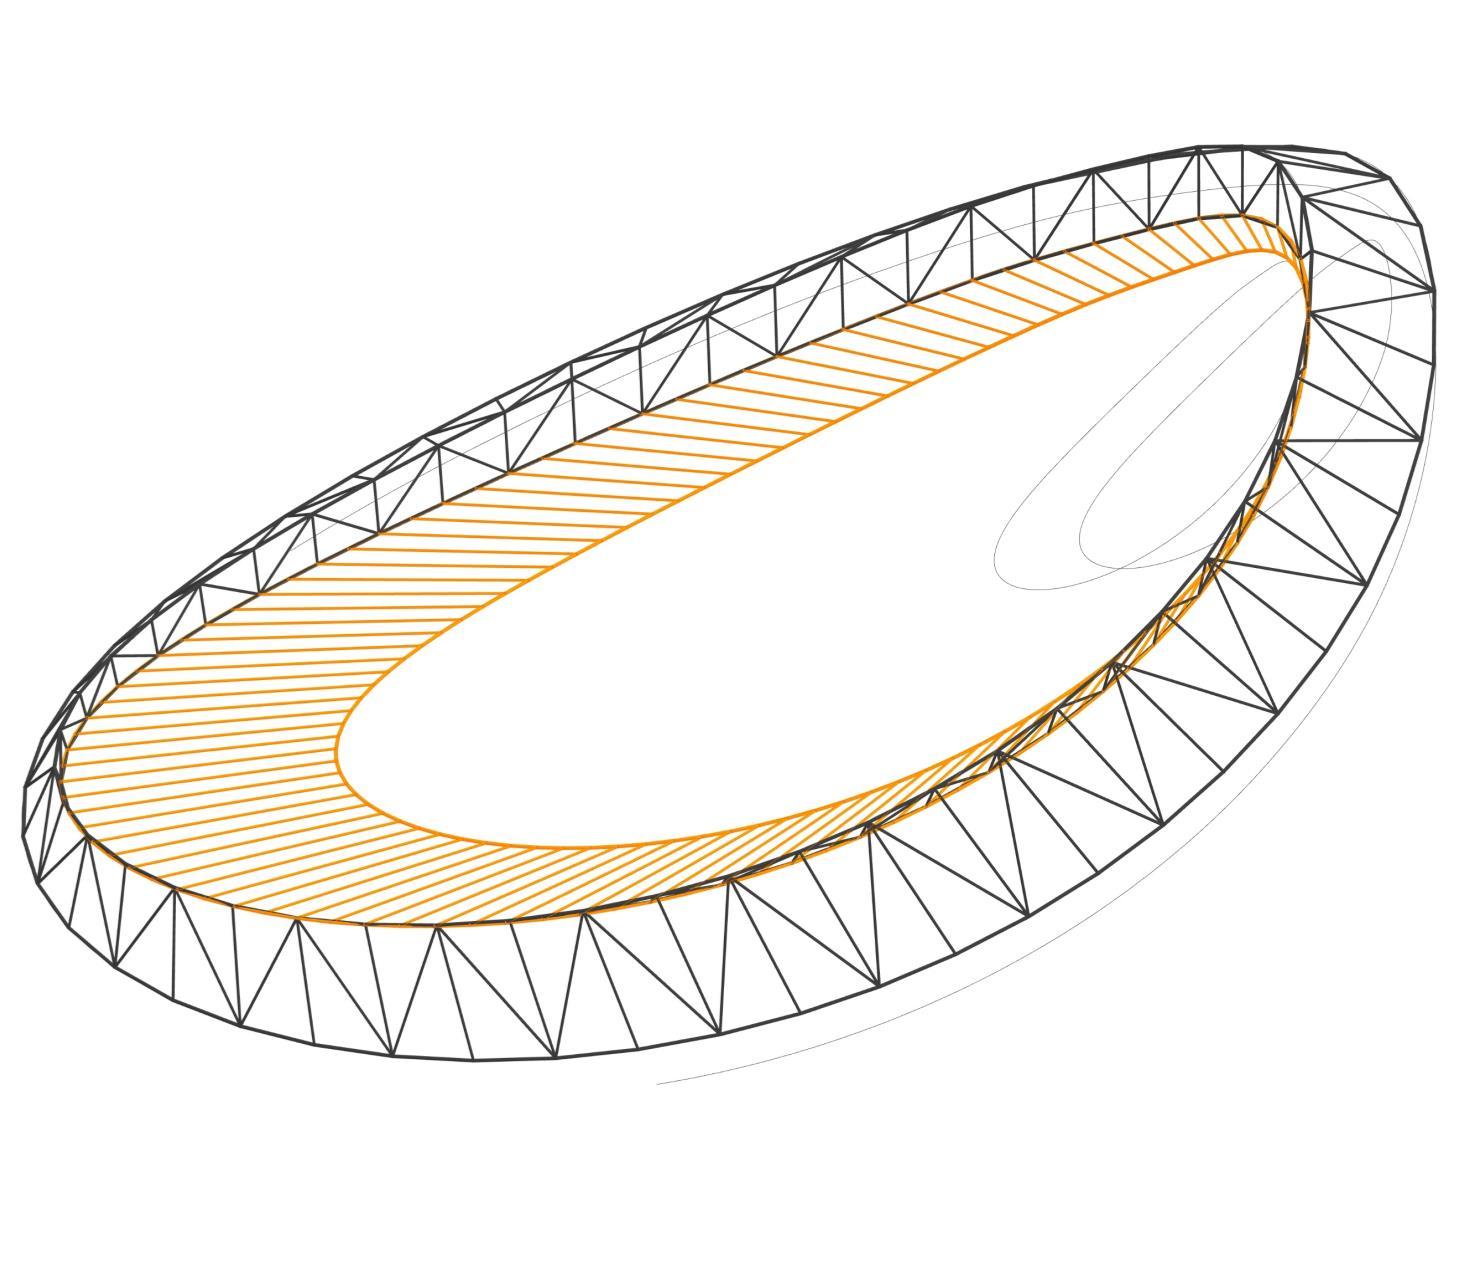
PANELLING
SURFACE PANELLING [PANELINGTOOLS]
Start designing panels for outside surface
Generate panels for outside surface following internal structure division
Start designing panels for inside surface

Generate panels for inside surface following internal structure division
ANALSIS EXTENSION & FINALIZING FORMATION
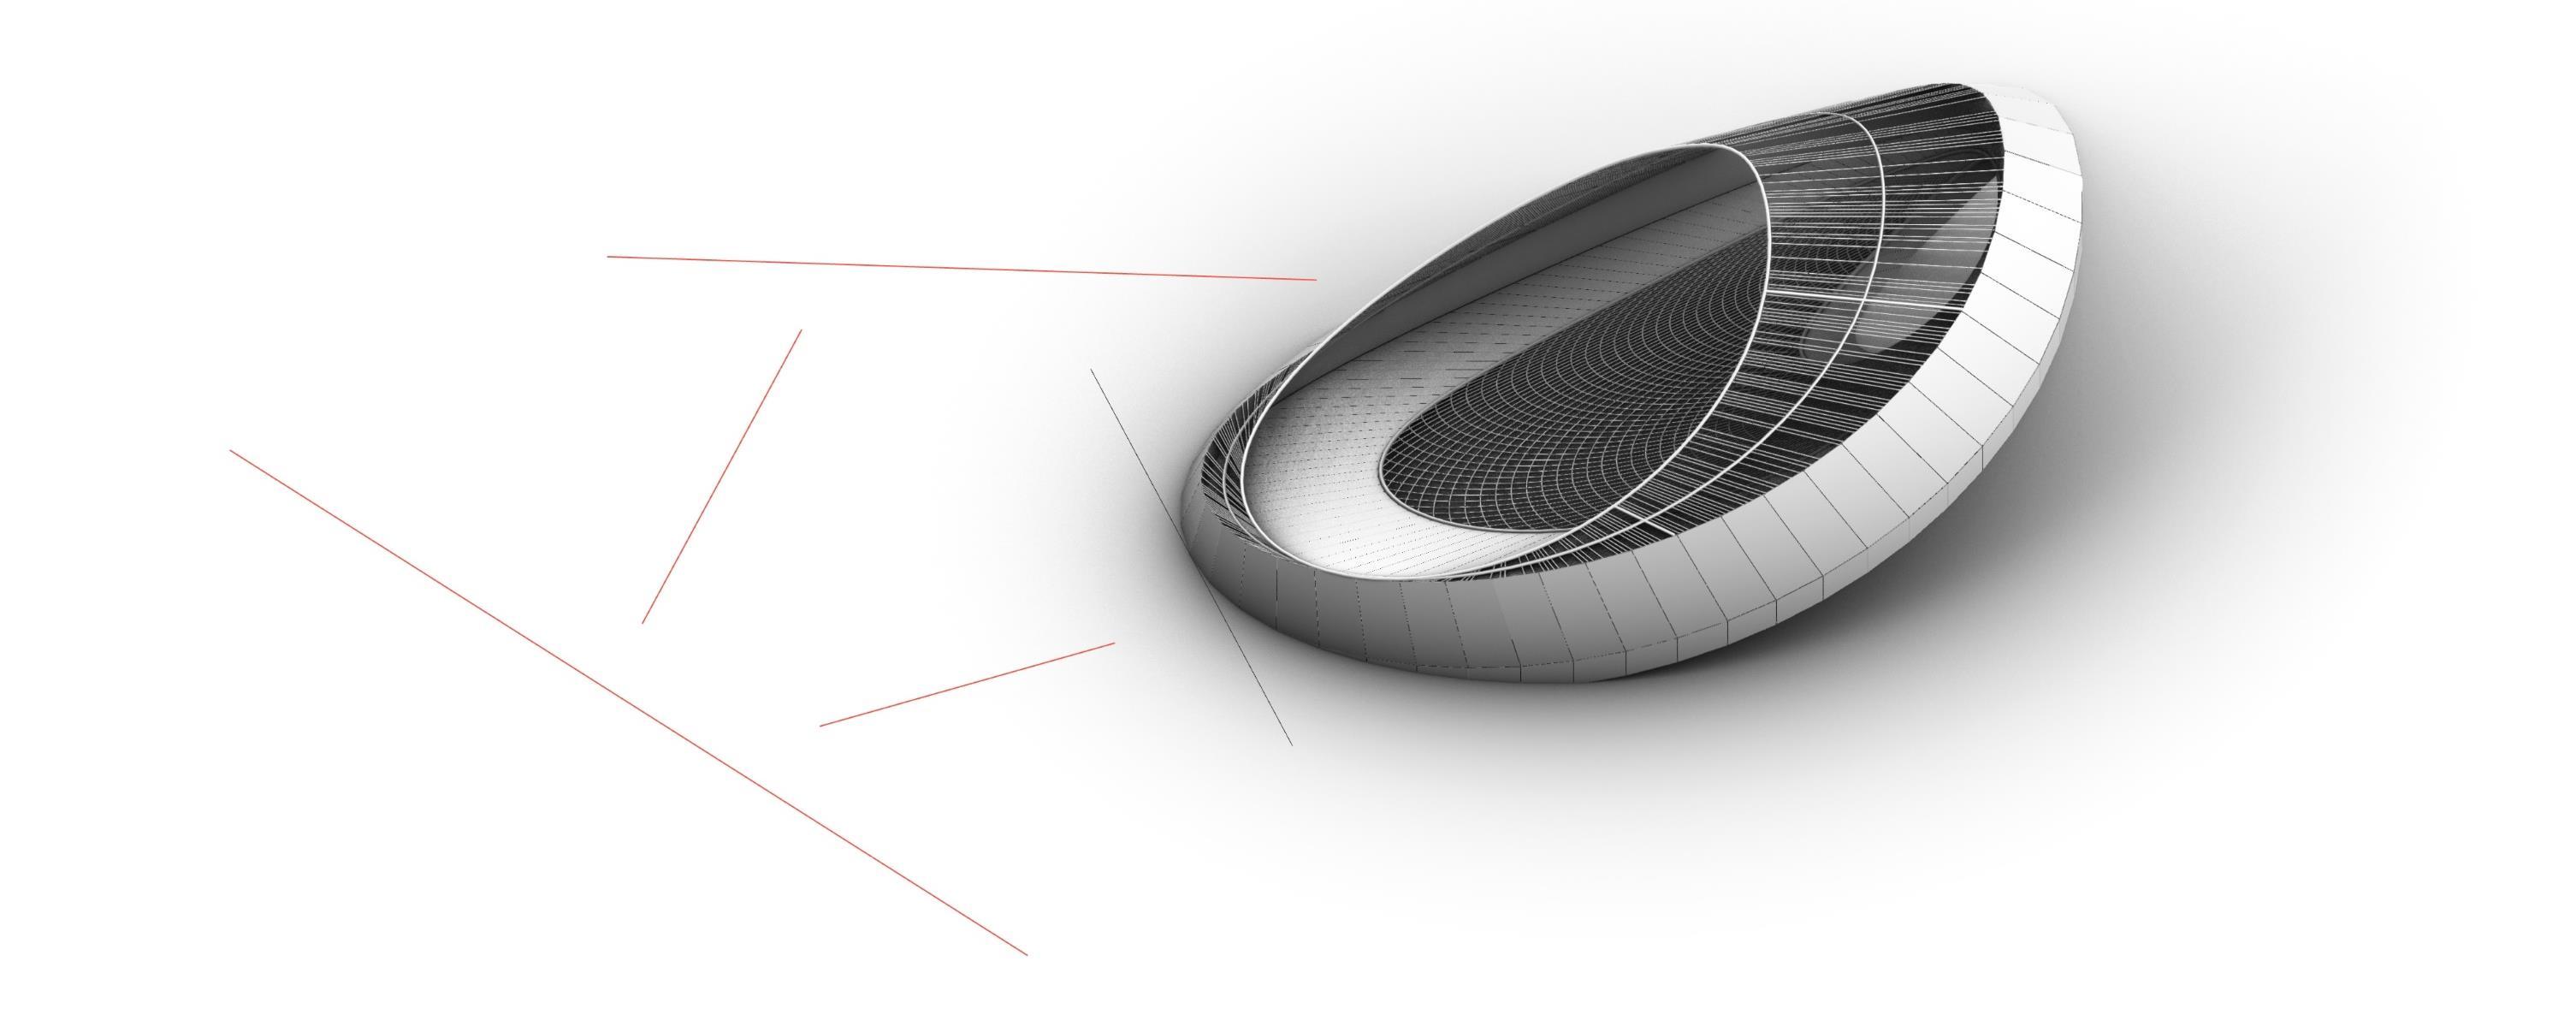
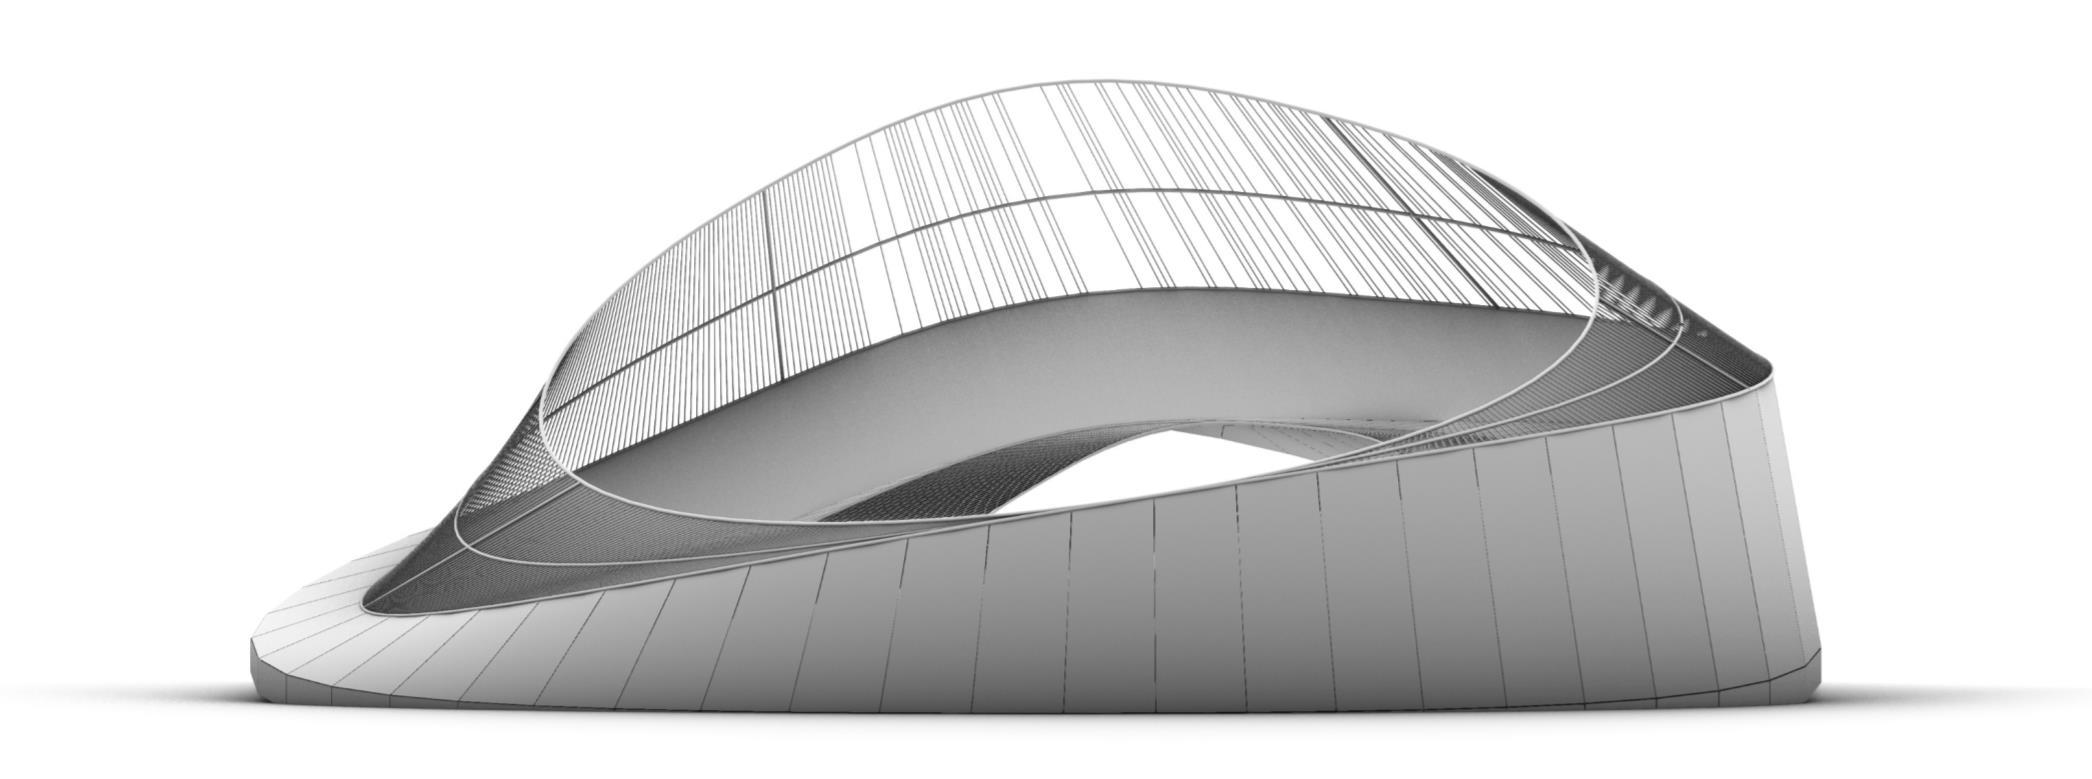
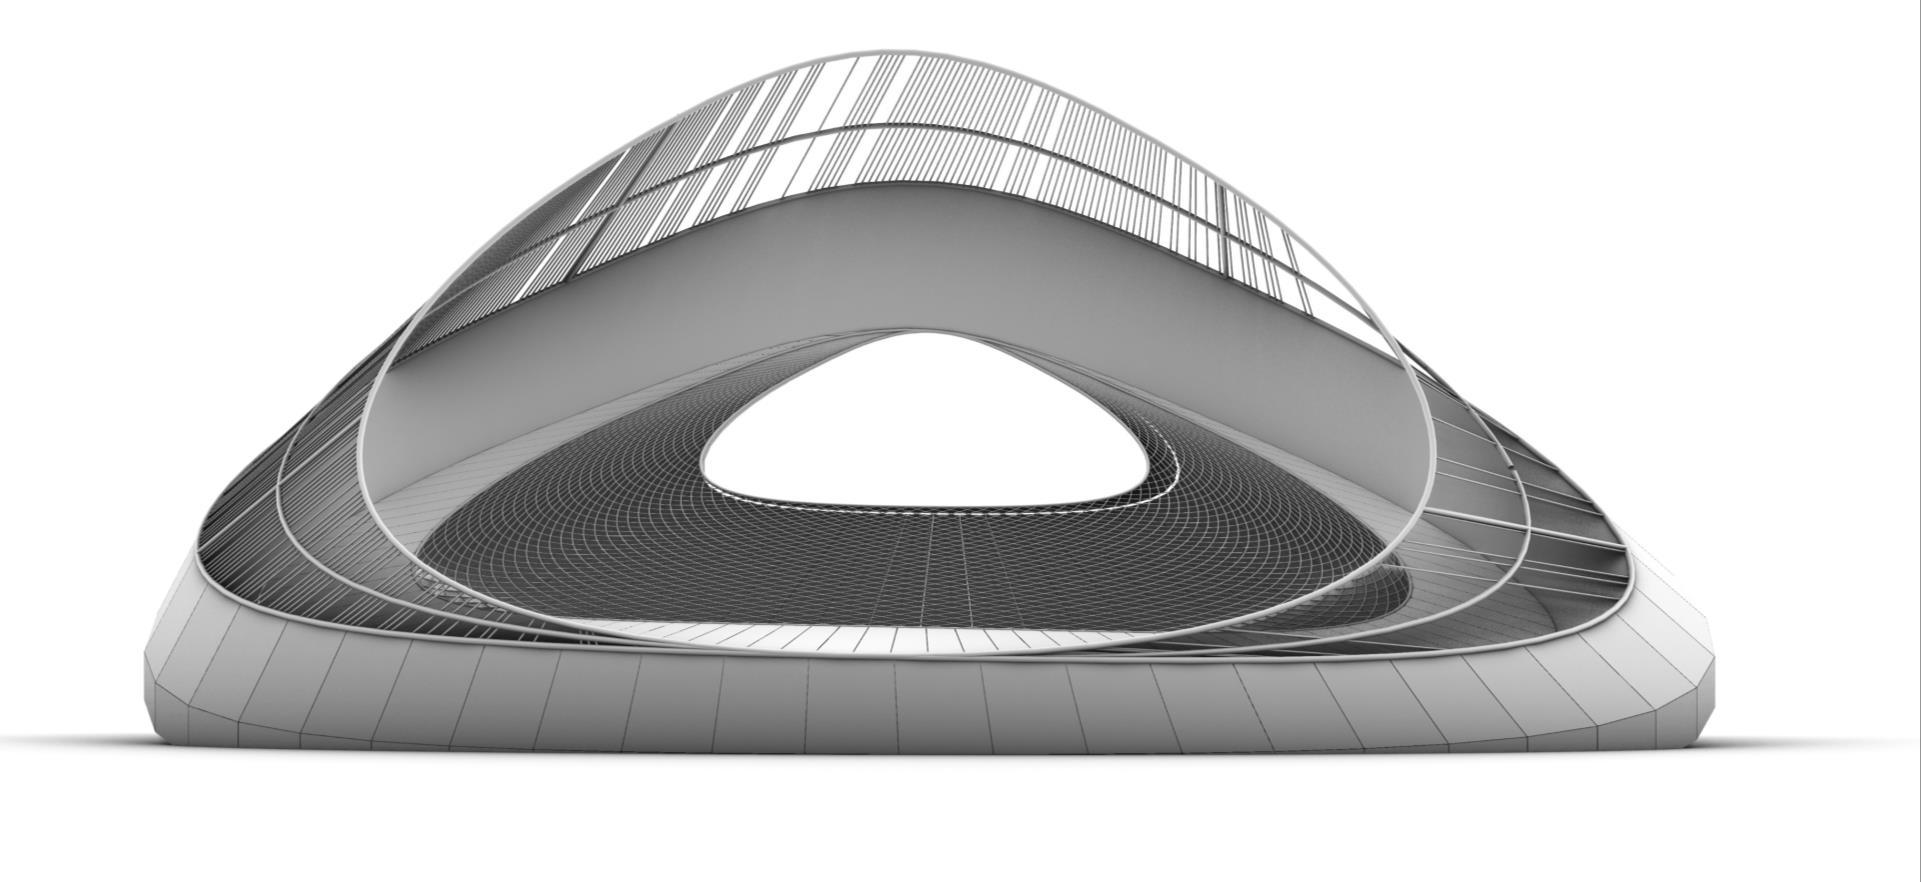
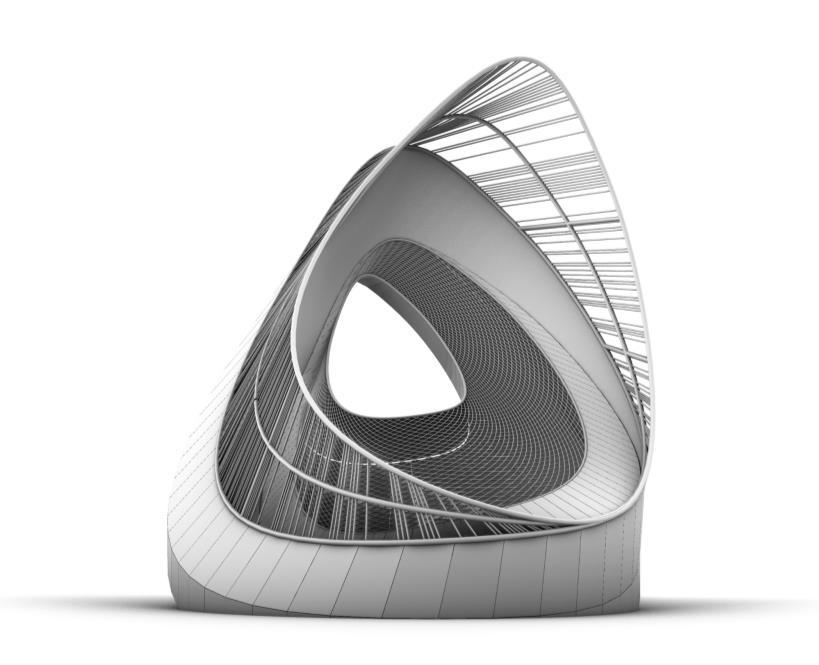
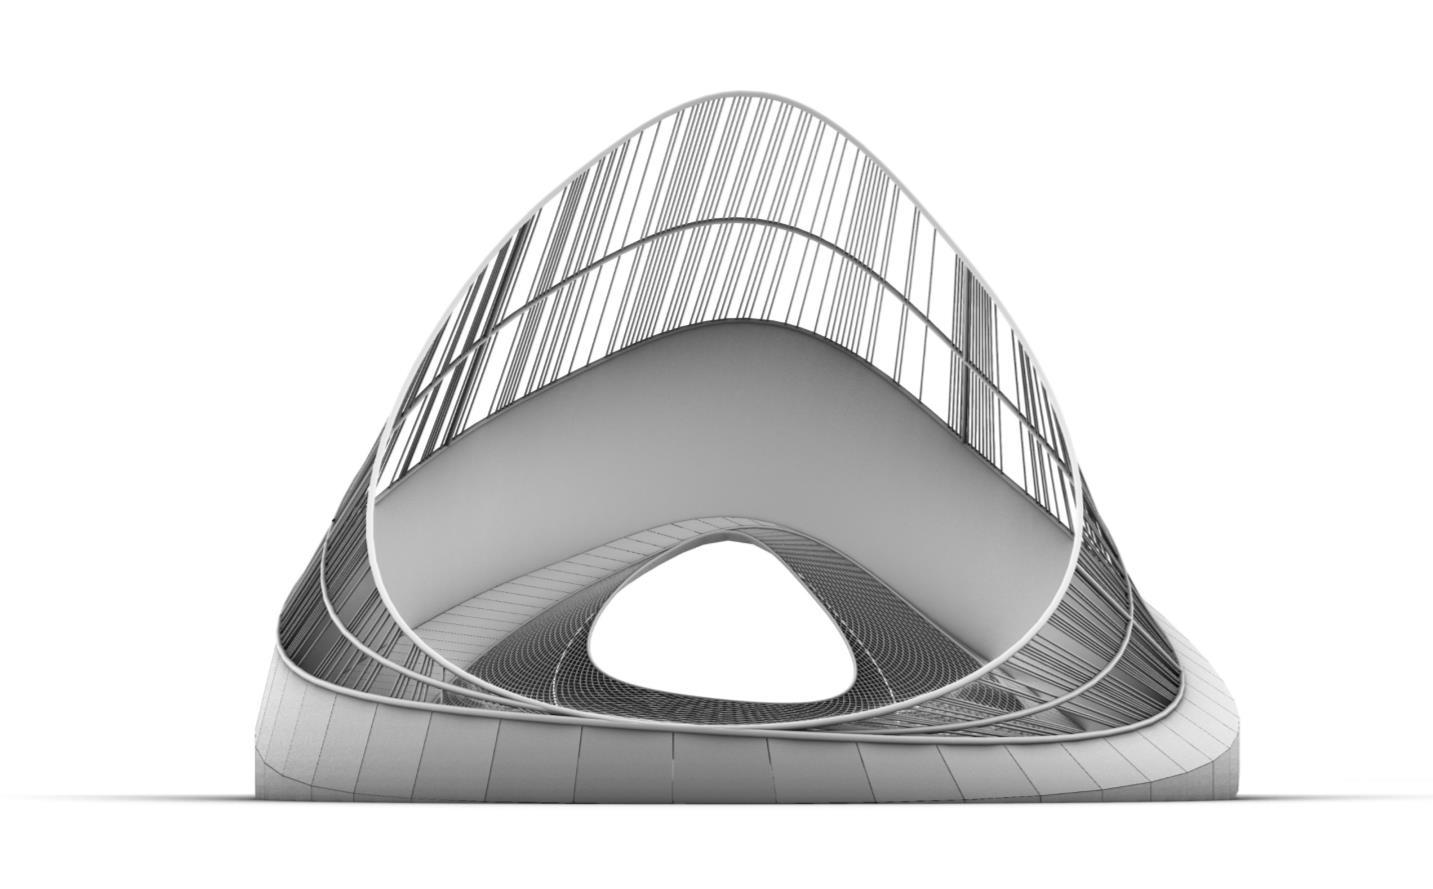
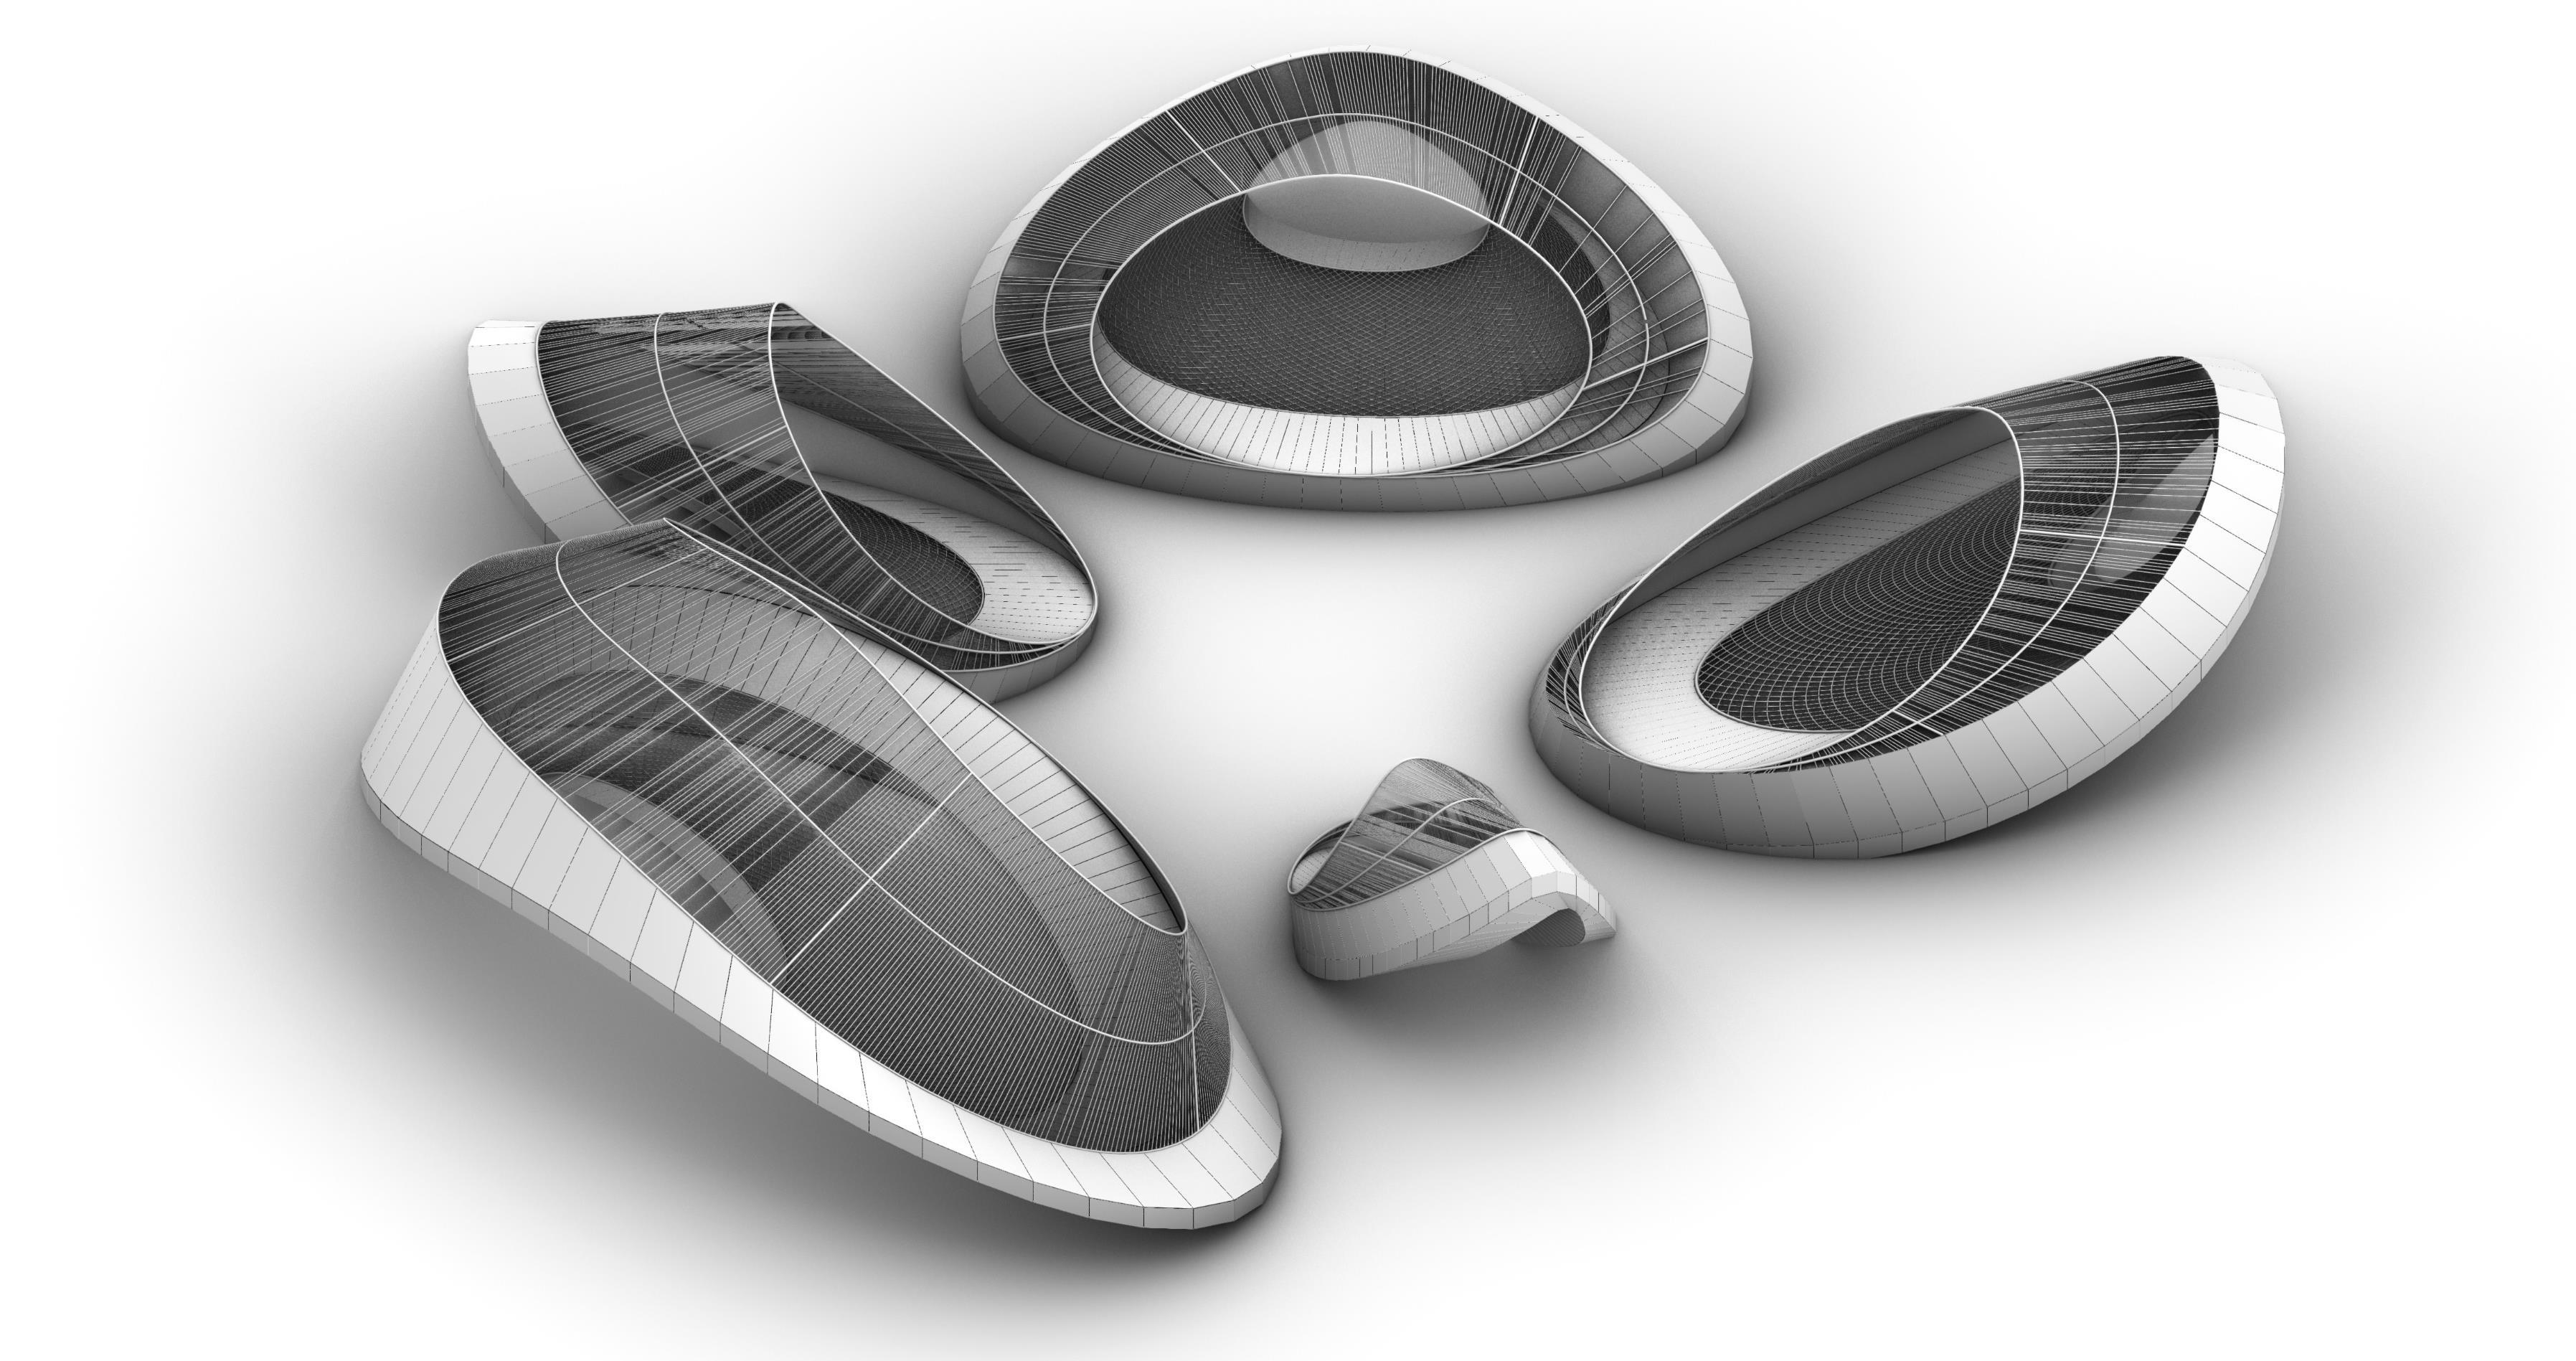
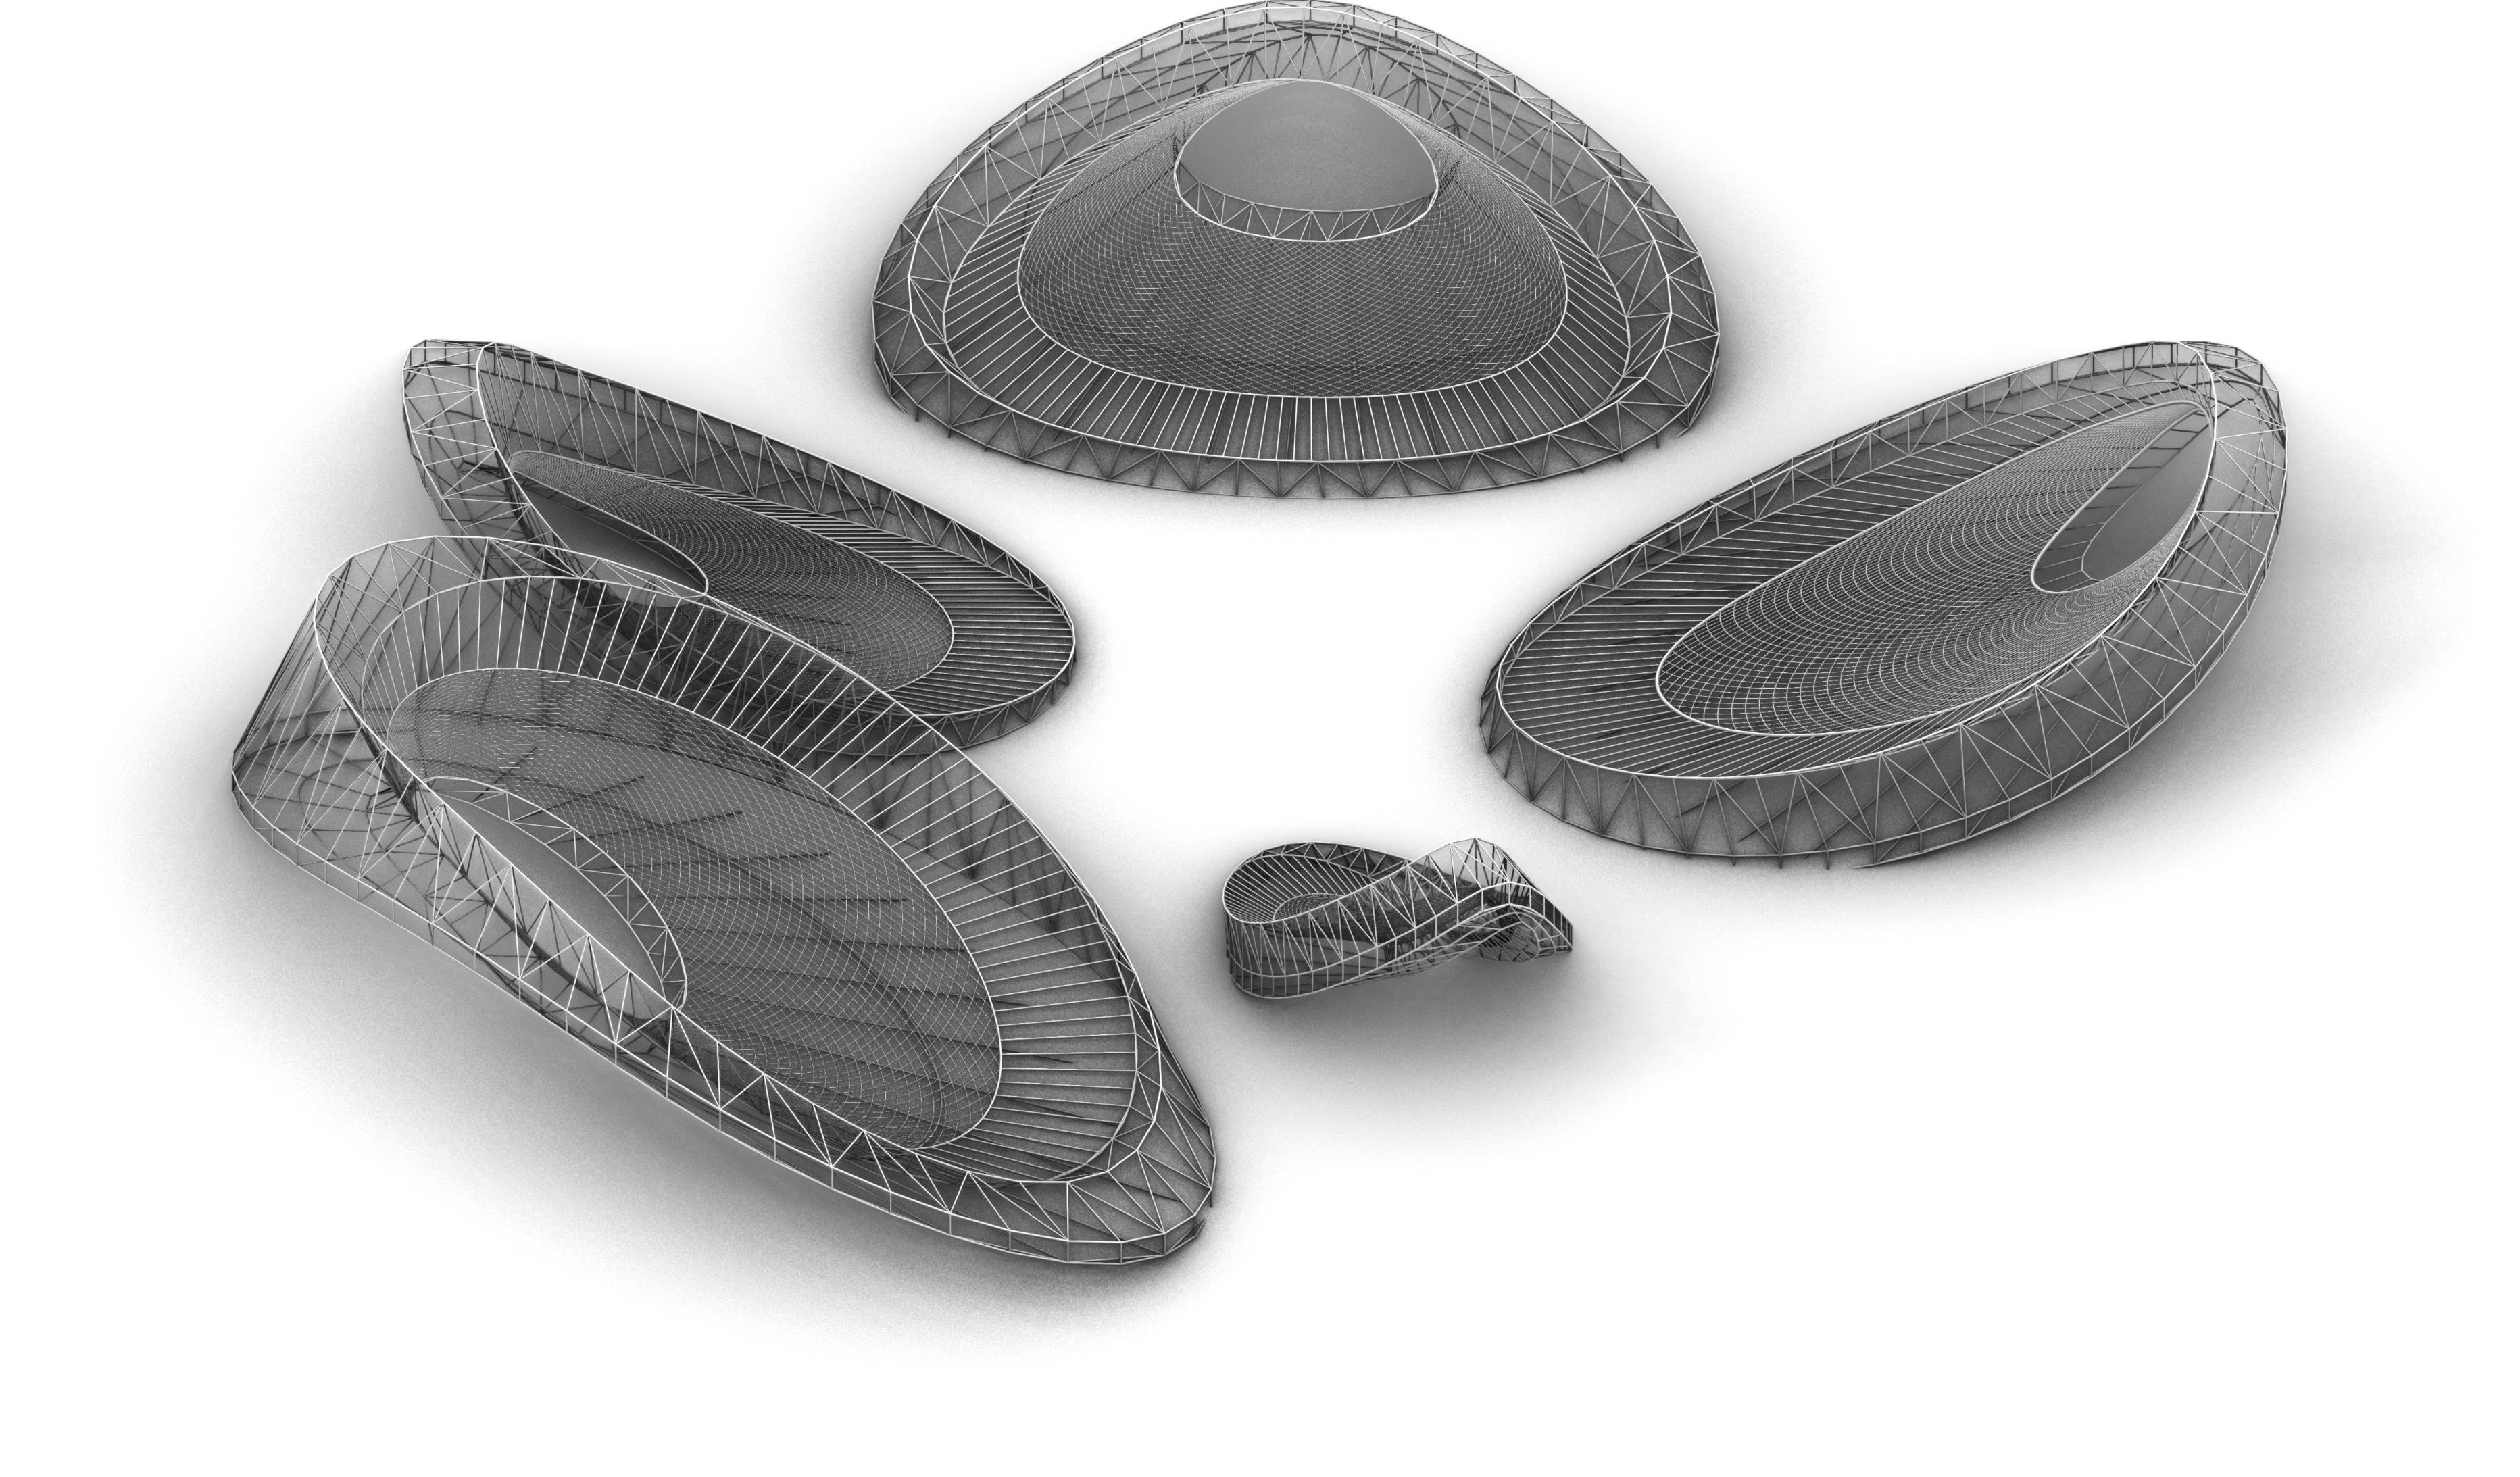
Final Pavilion Shape
Extend analysis for rest of pavilion
Element directed towards first view Element directed towards second view Element directed towards third view Element protecting from sun Element protecting from wind
PAVILION FORMATION ELEMENTS
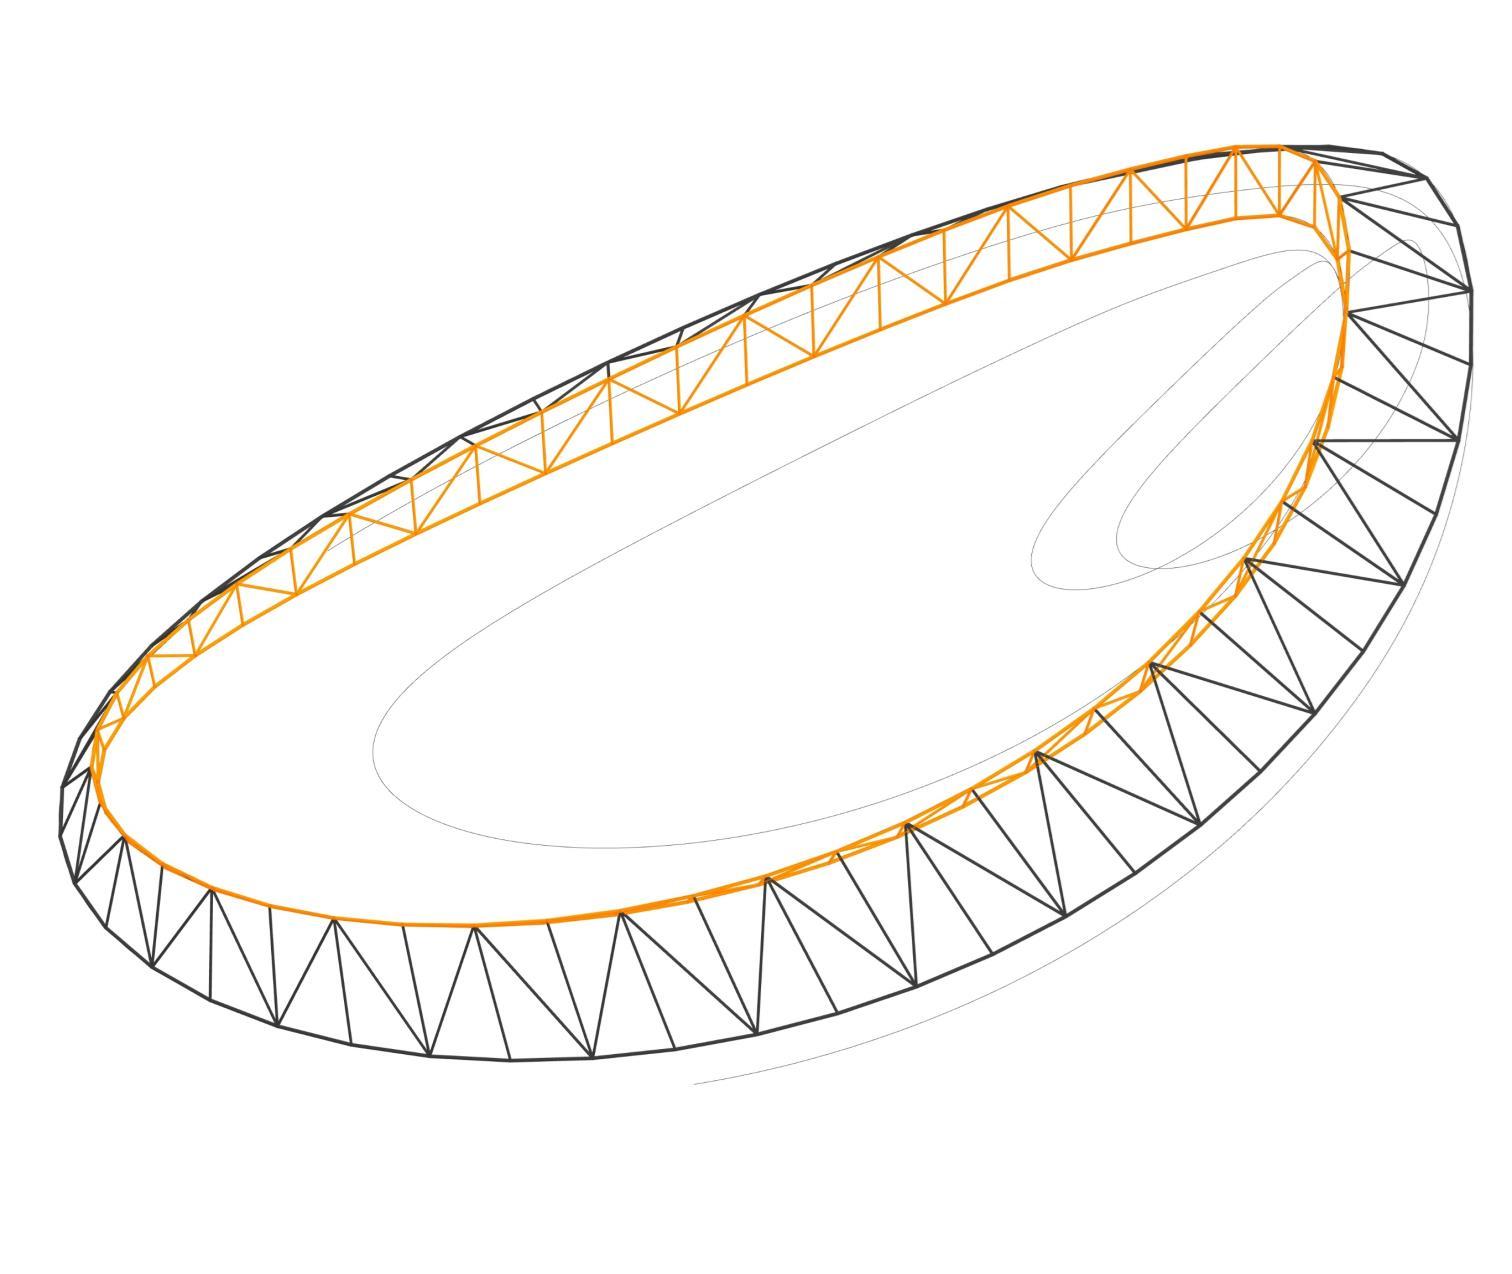
ACCESIBILITY
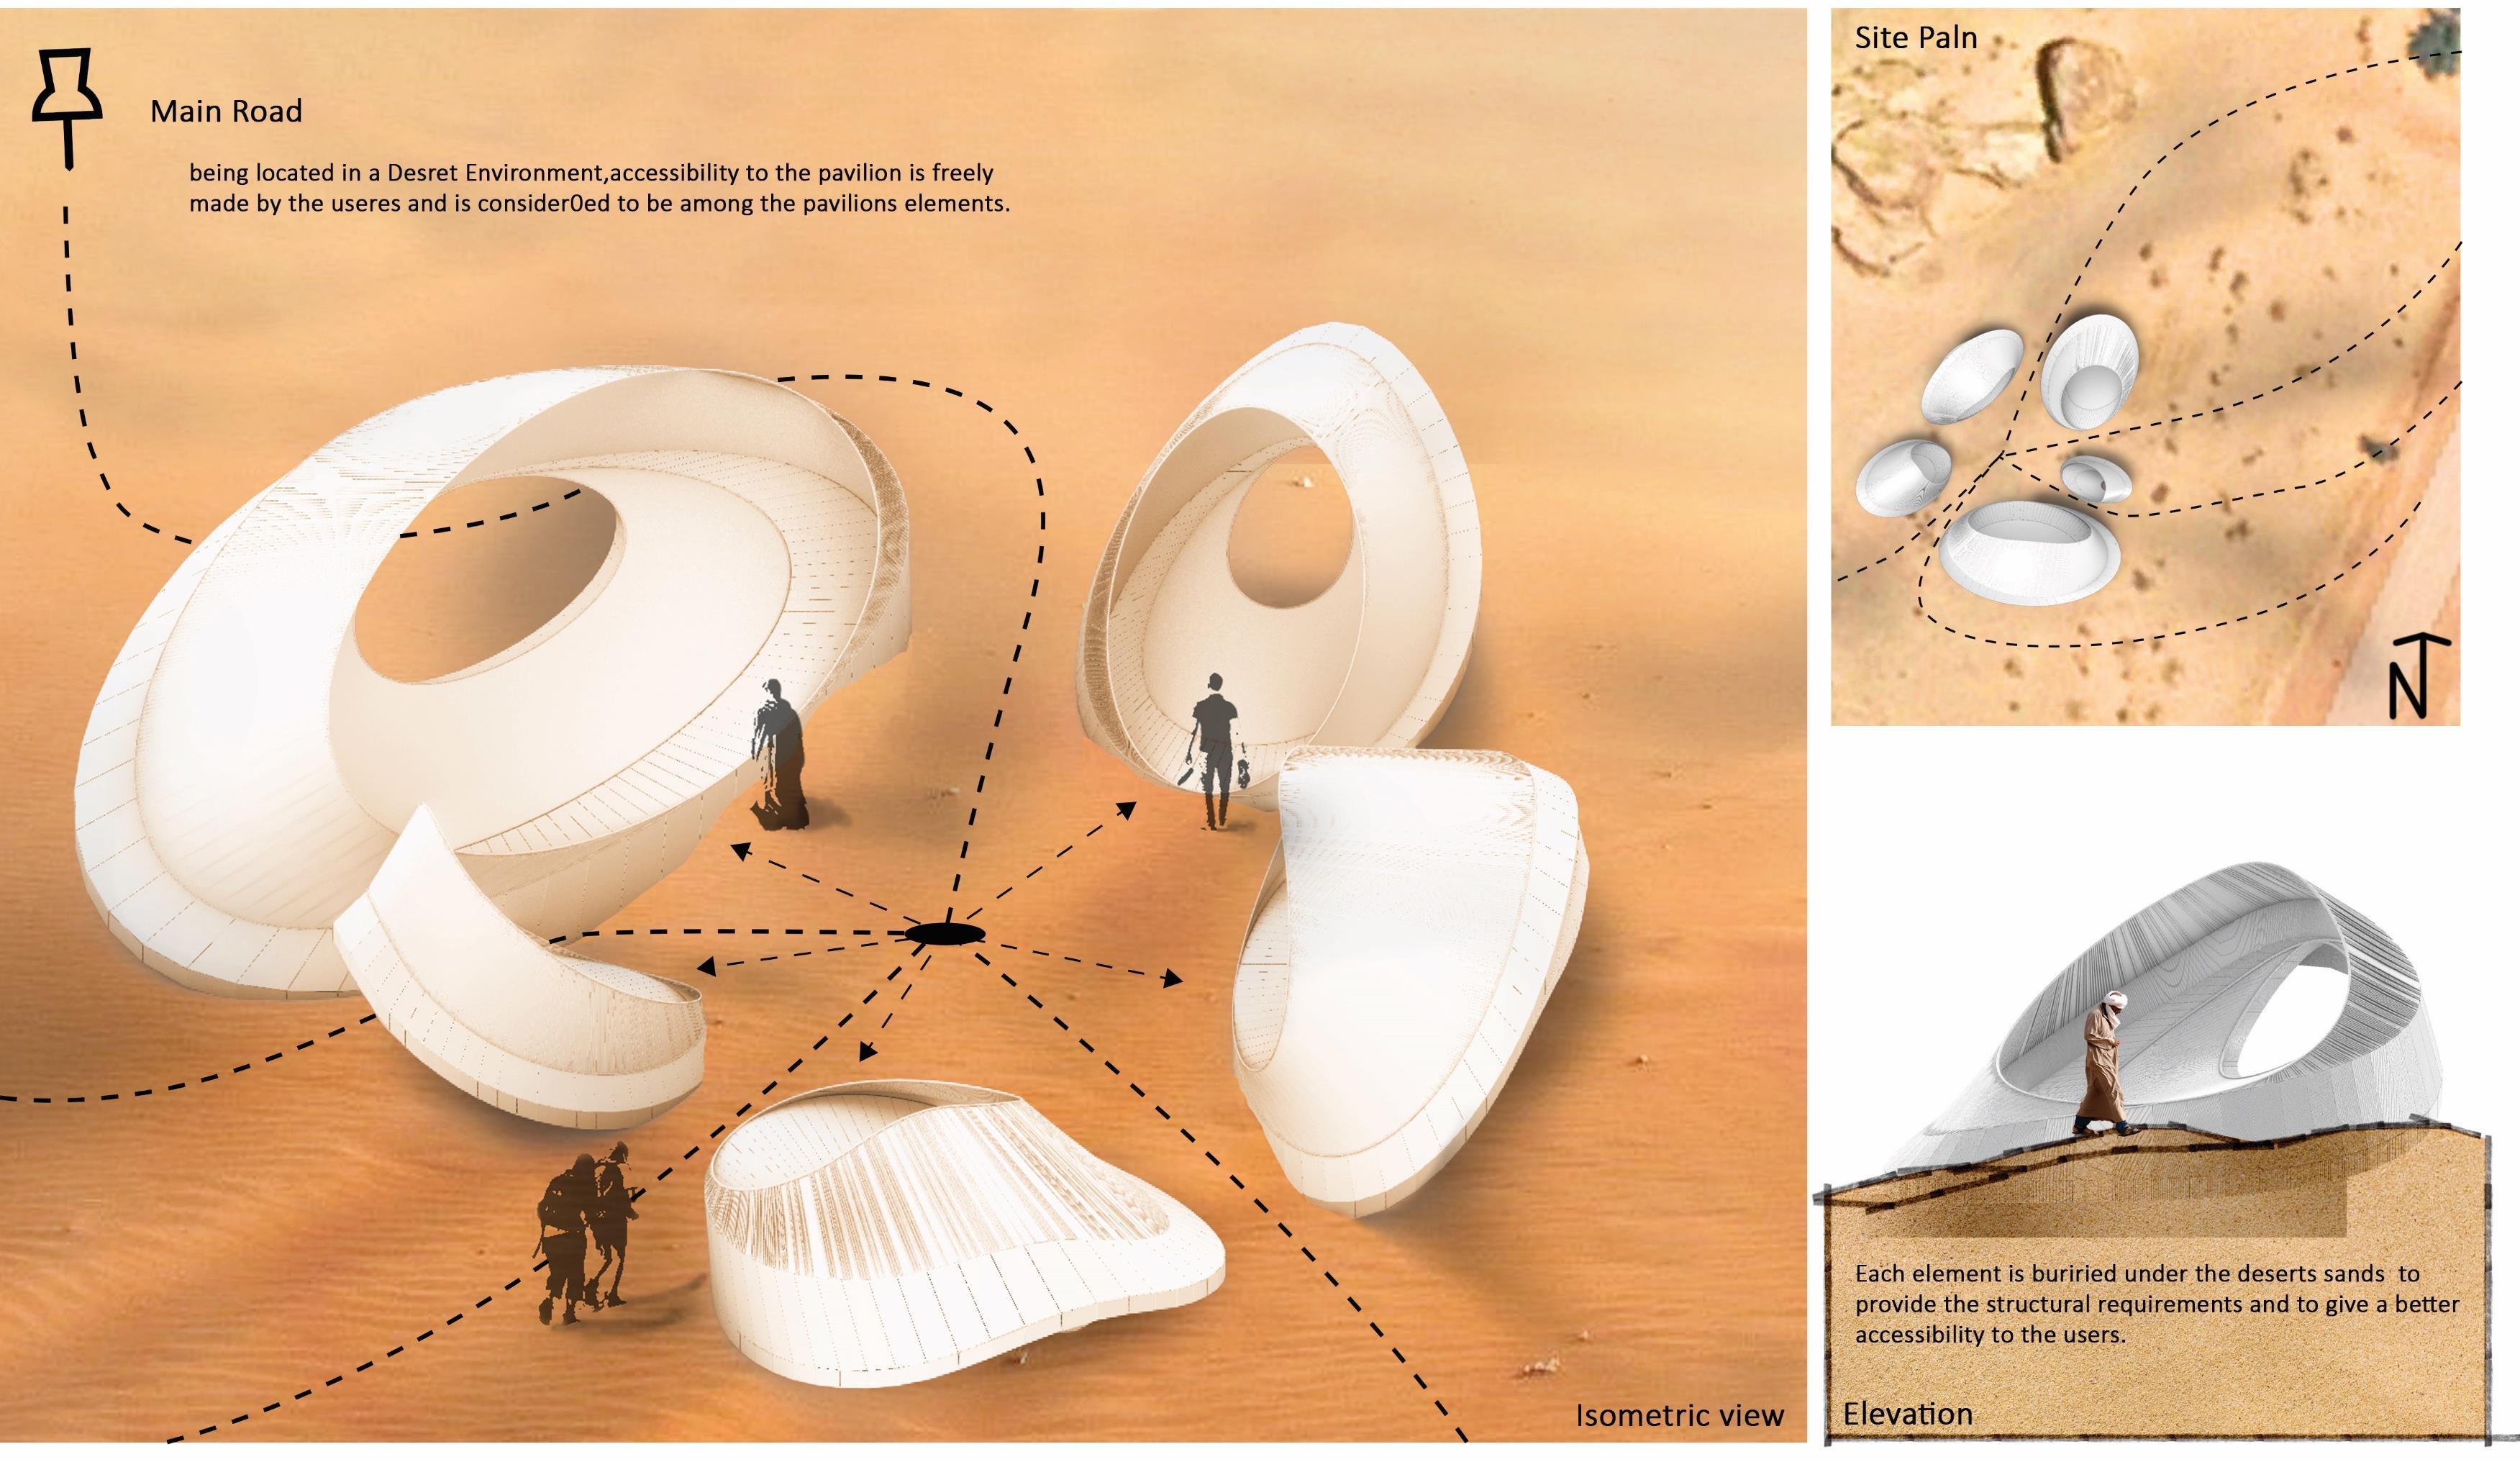
Main Road, Site Plan & Elevation
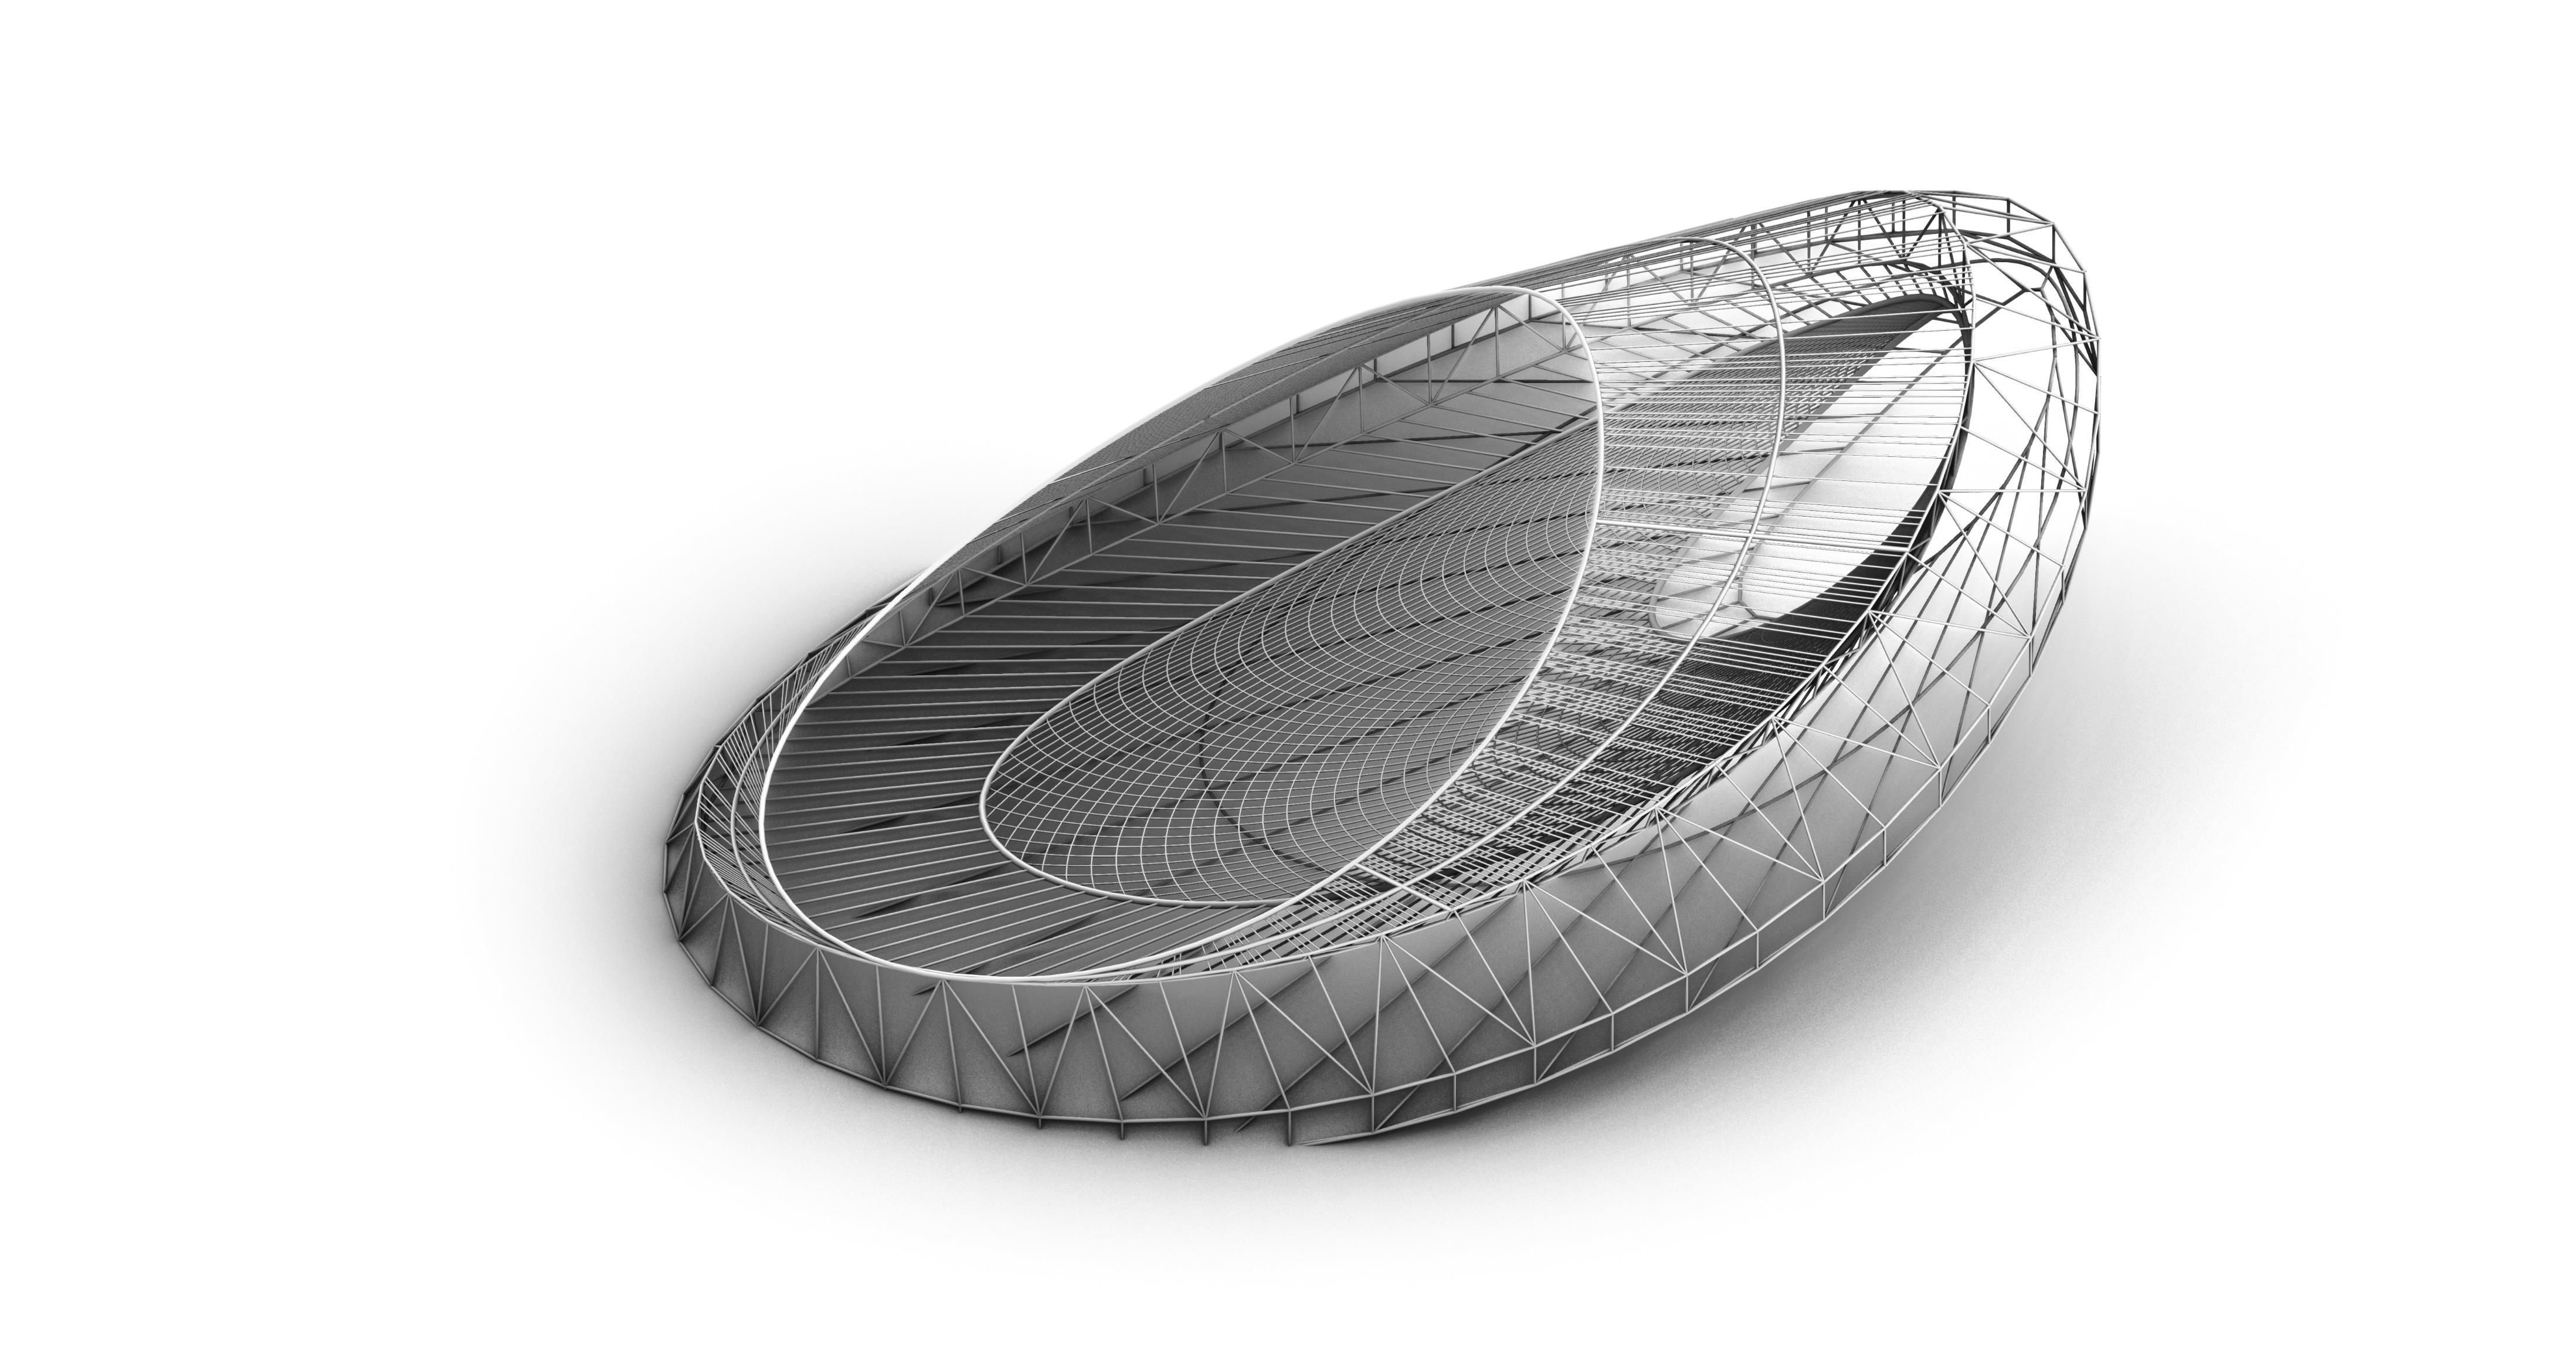
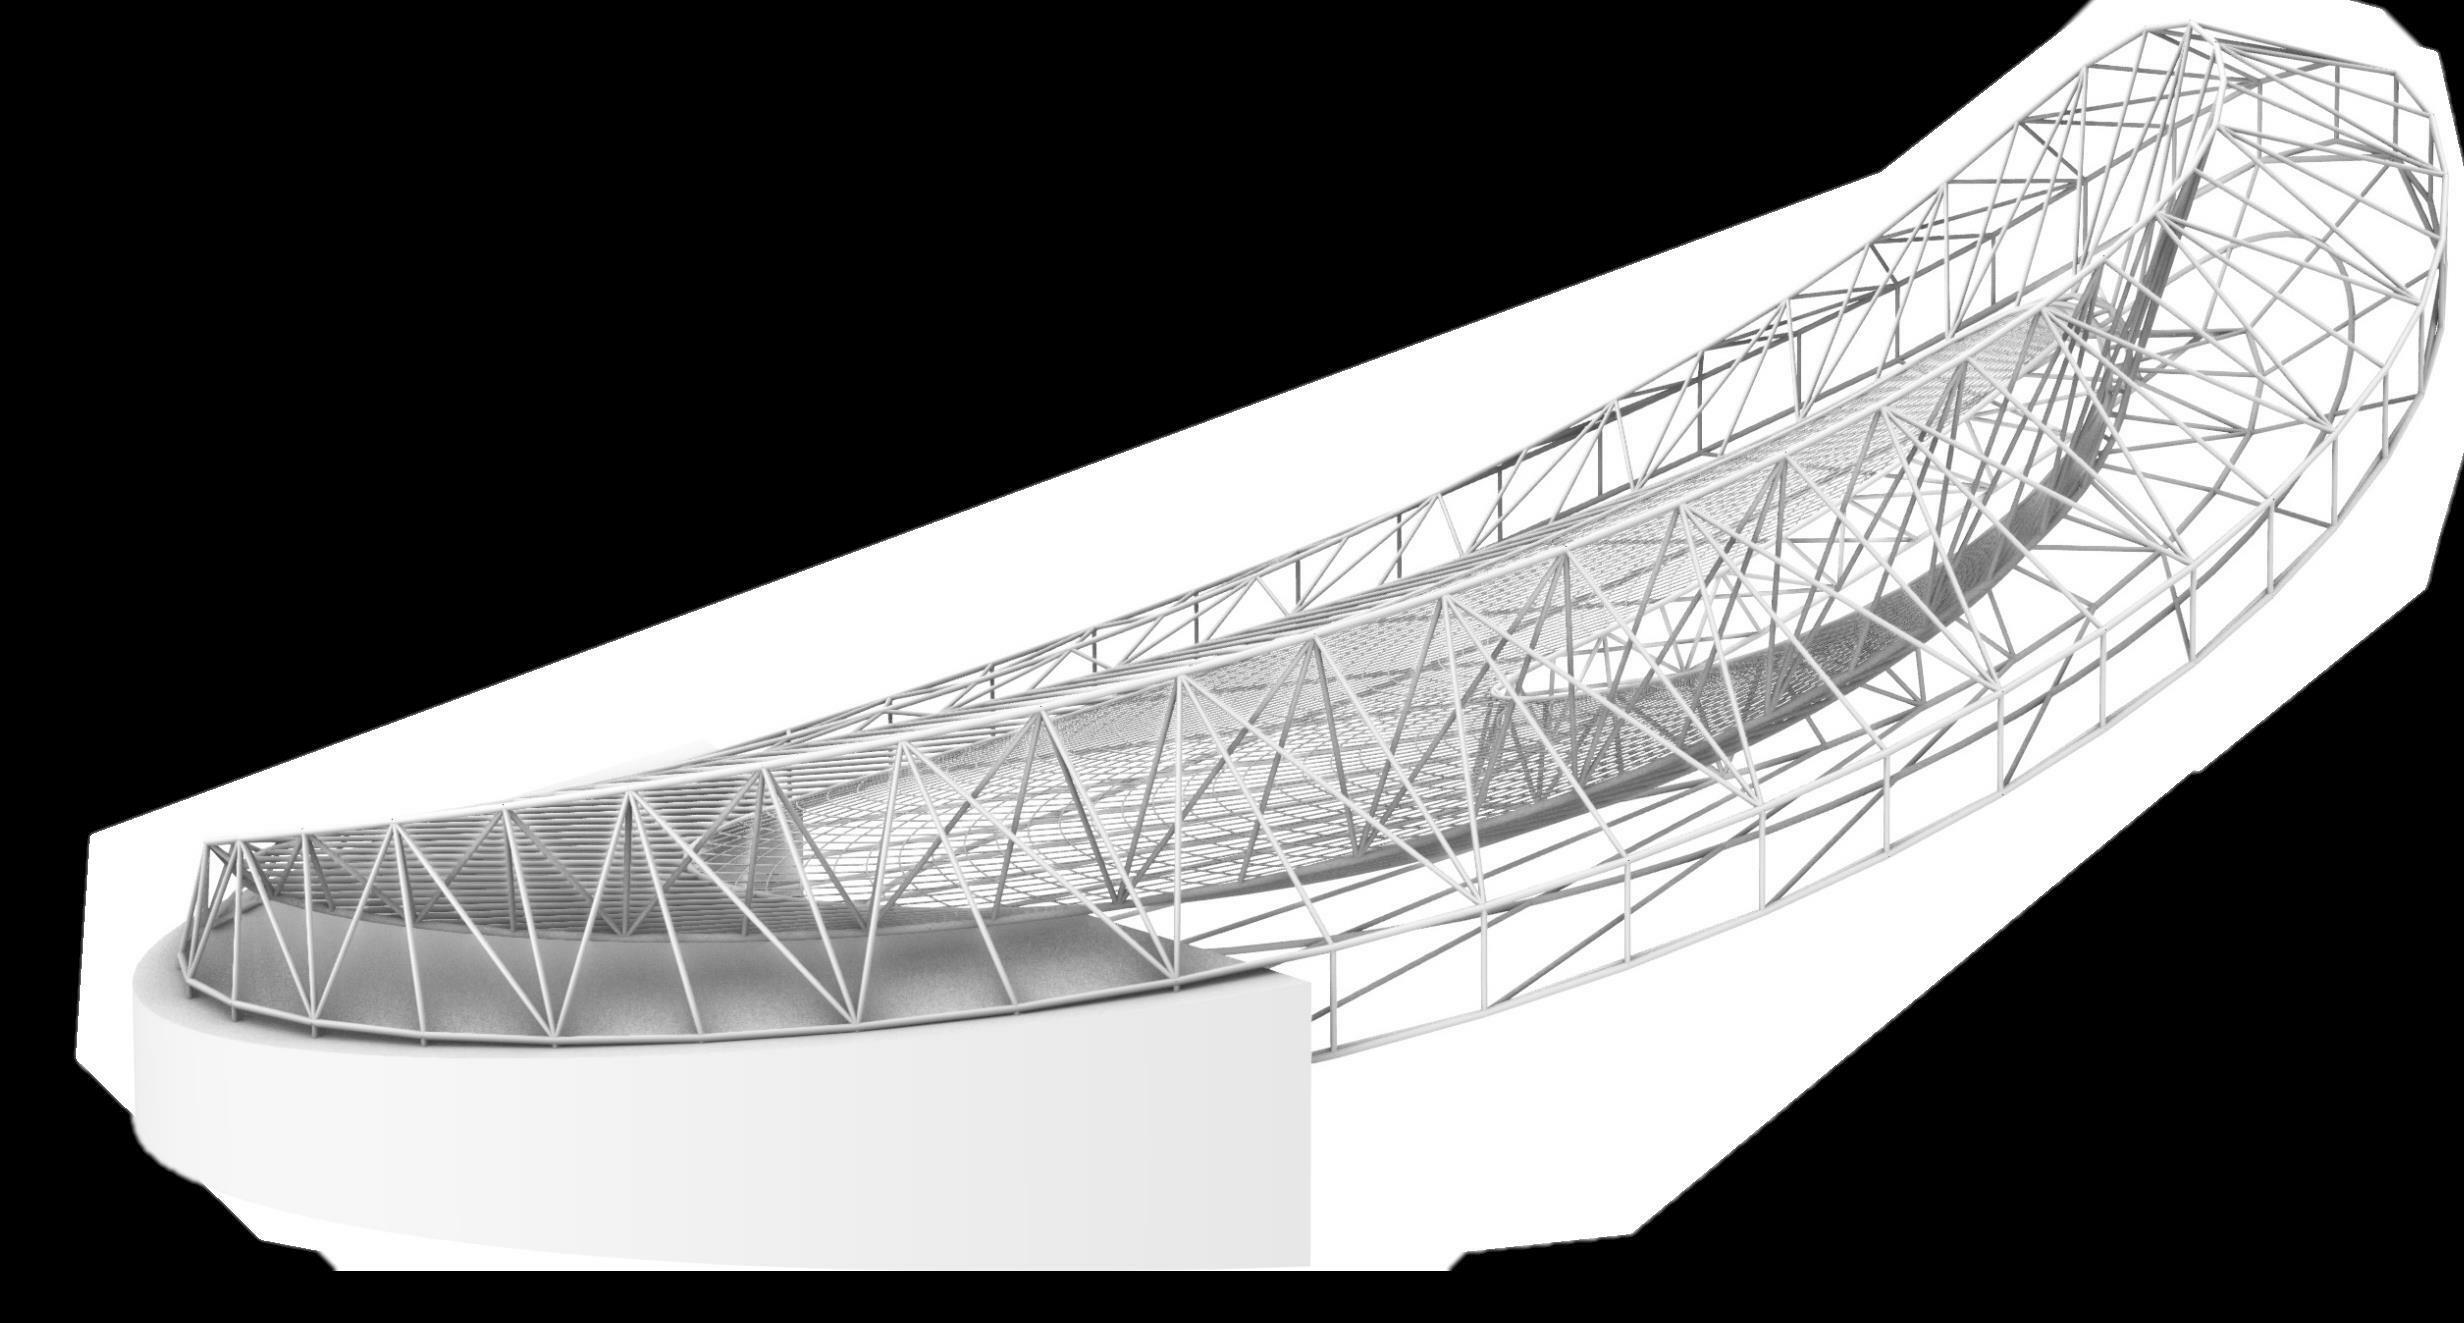
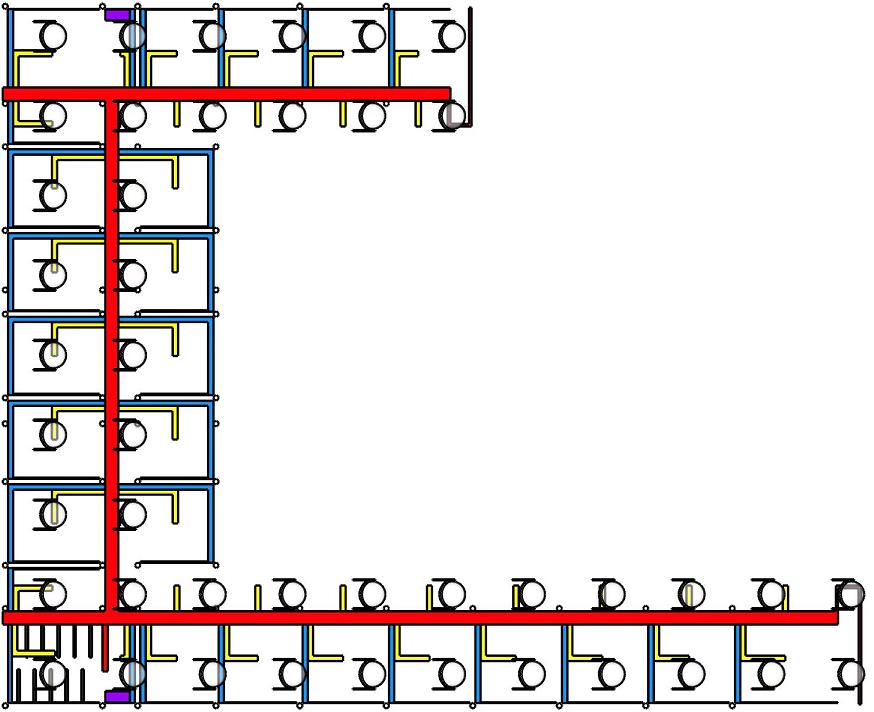
STRUCTURE
KARAMBA ANALYSIS
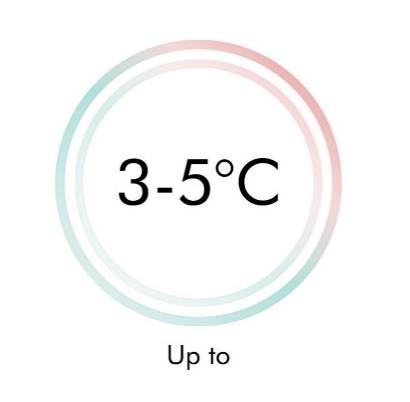
Karamba Analysis with max deformation of 50mm, under the influence of self-weight of the structure and Live Loads.

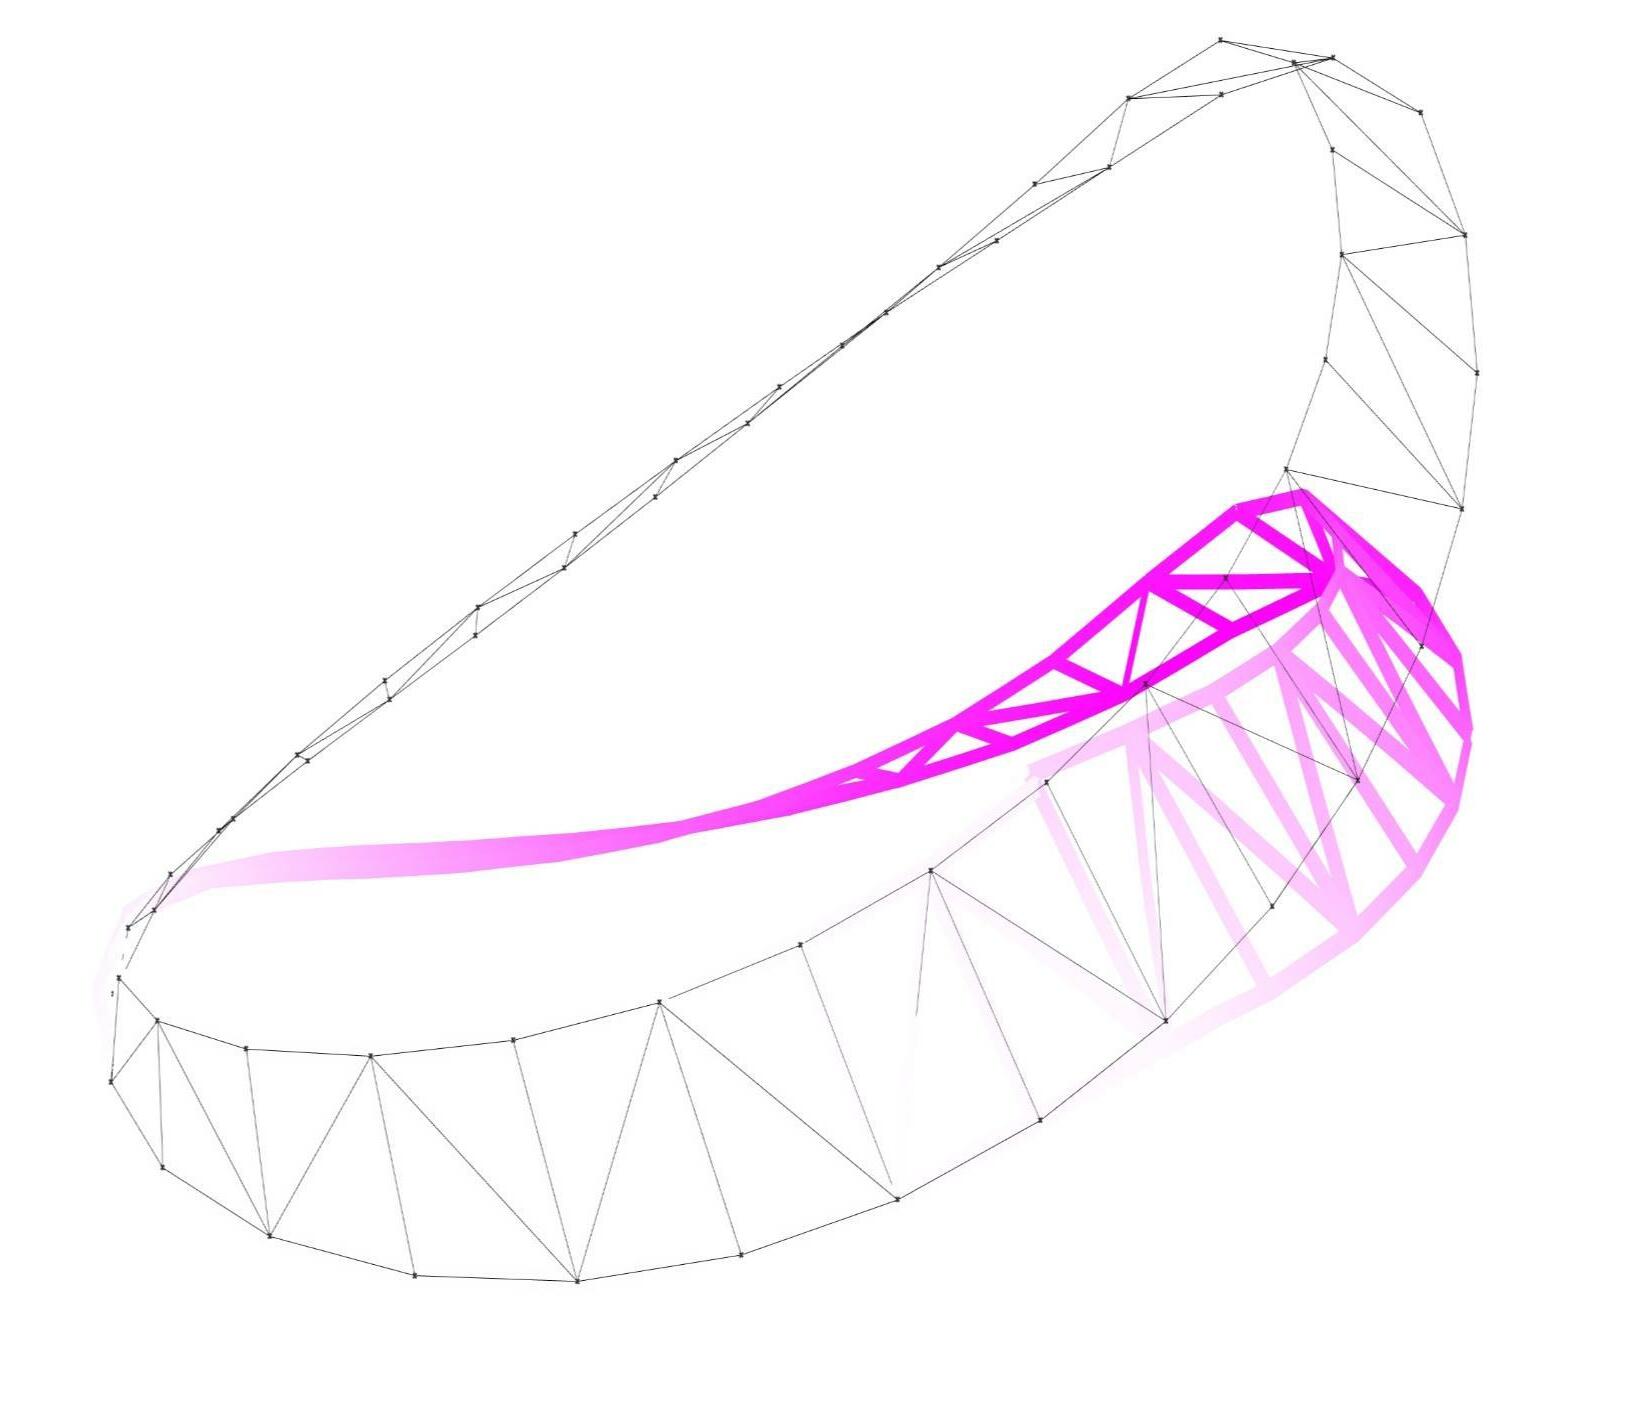
Structural Frame Made of Corten Tubular Steel, Diameter ranging from 42.5mm-48.34 mm and thickness ranging from 2mm-4mm.
Structure of the Pavilion
Concrete Foundation, which is a fixed support, and helps in load transfer to the substructure.
Material Representation
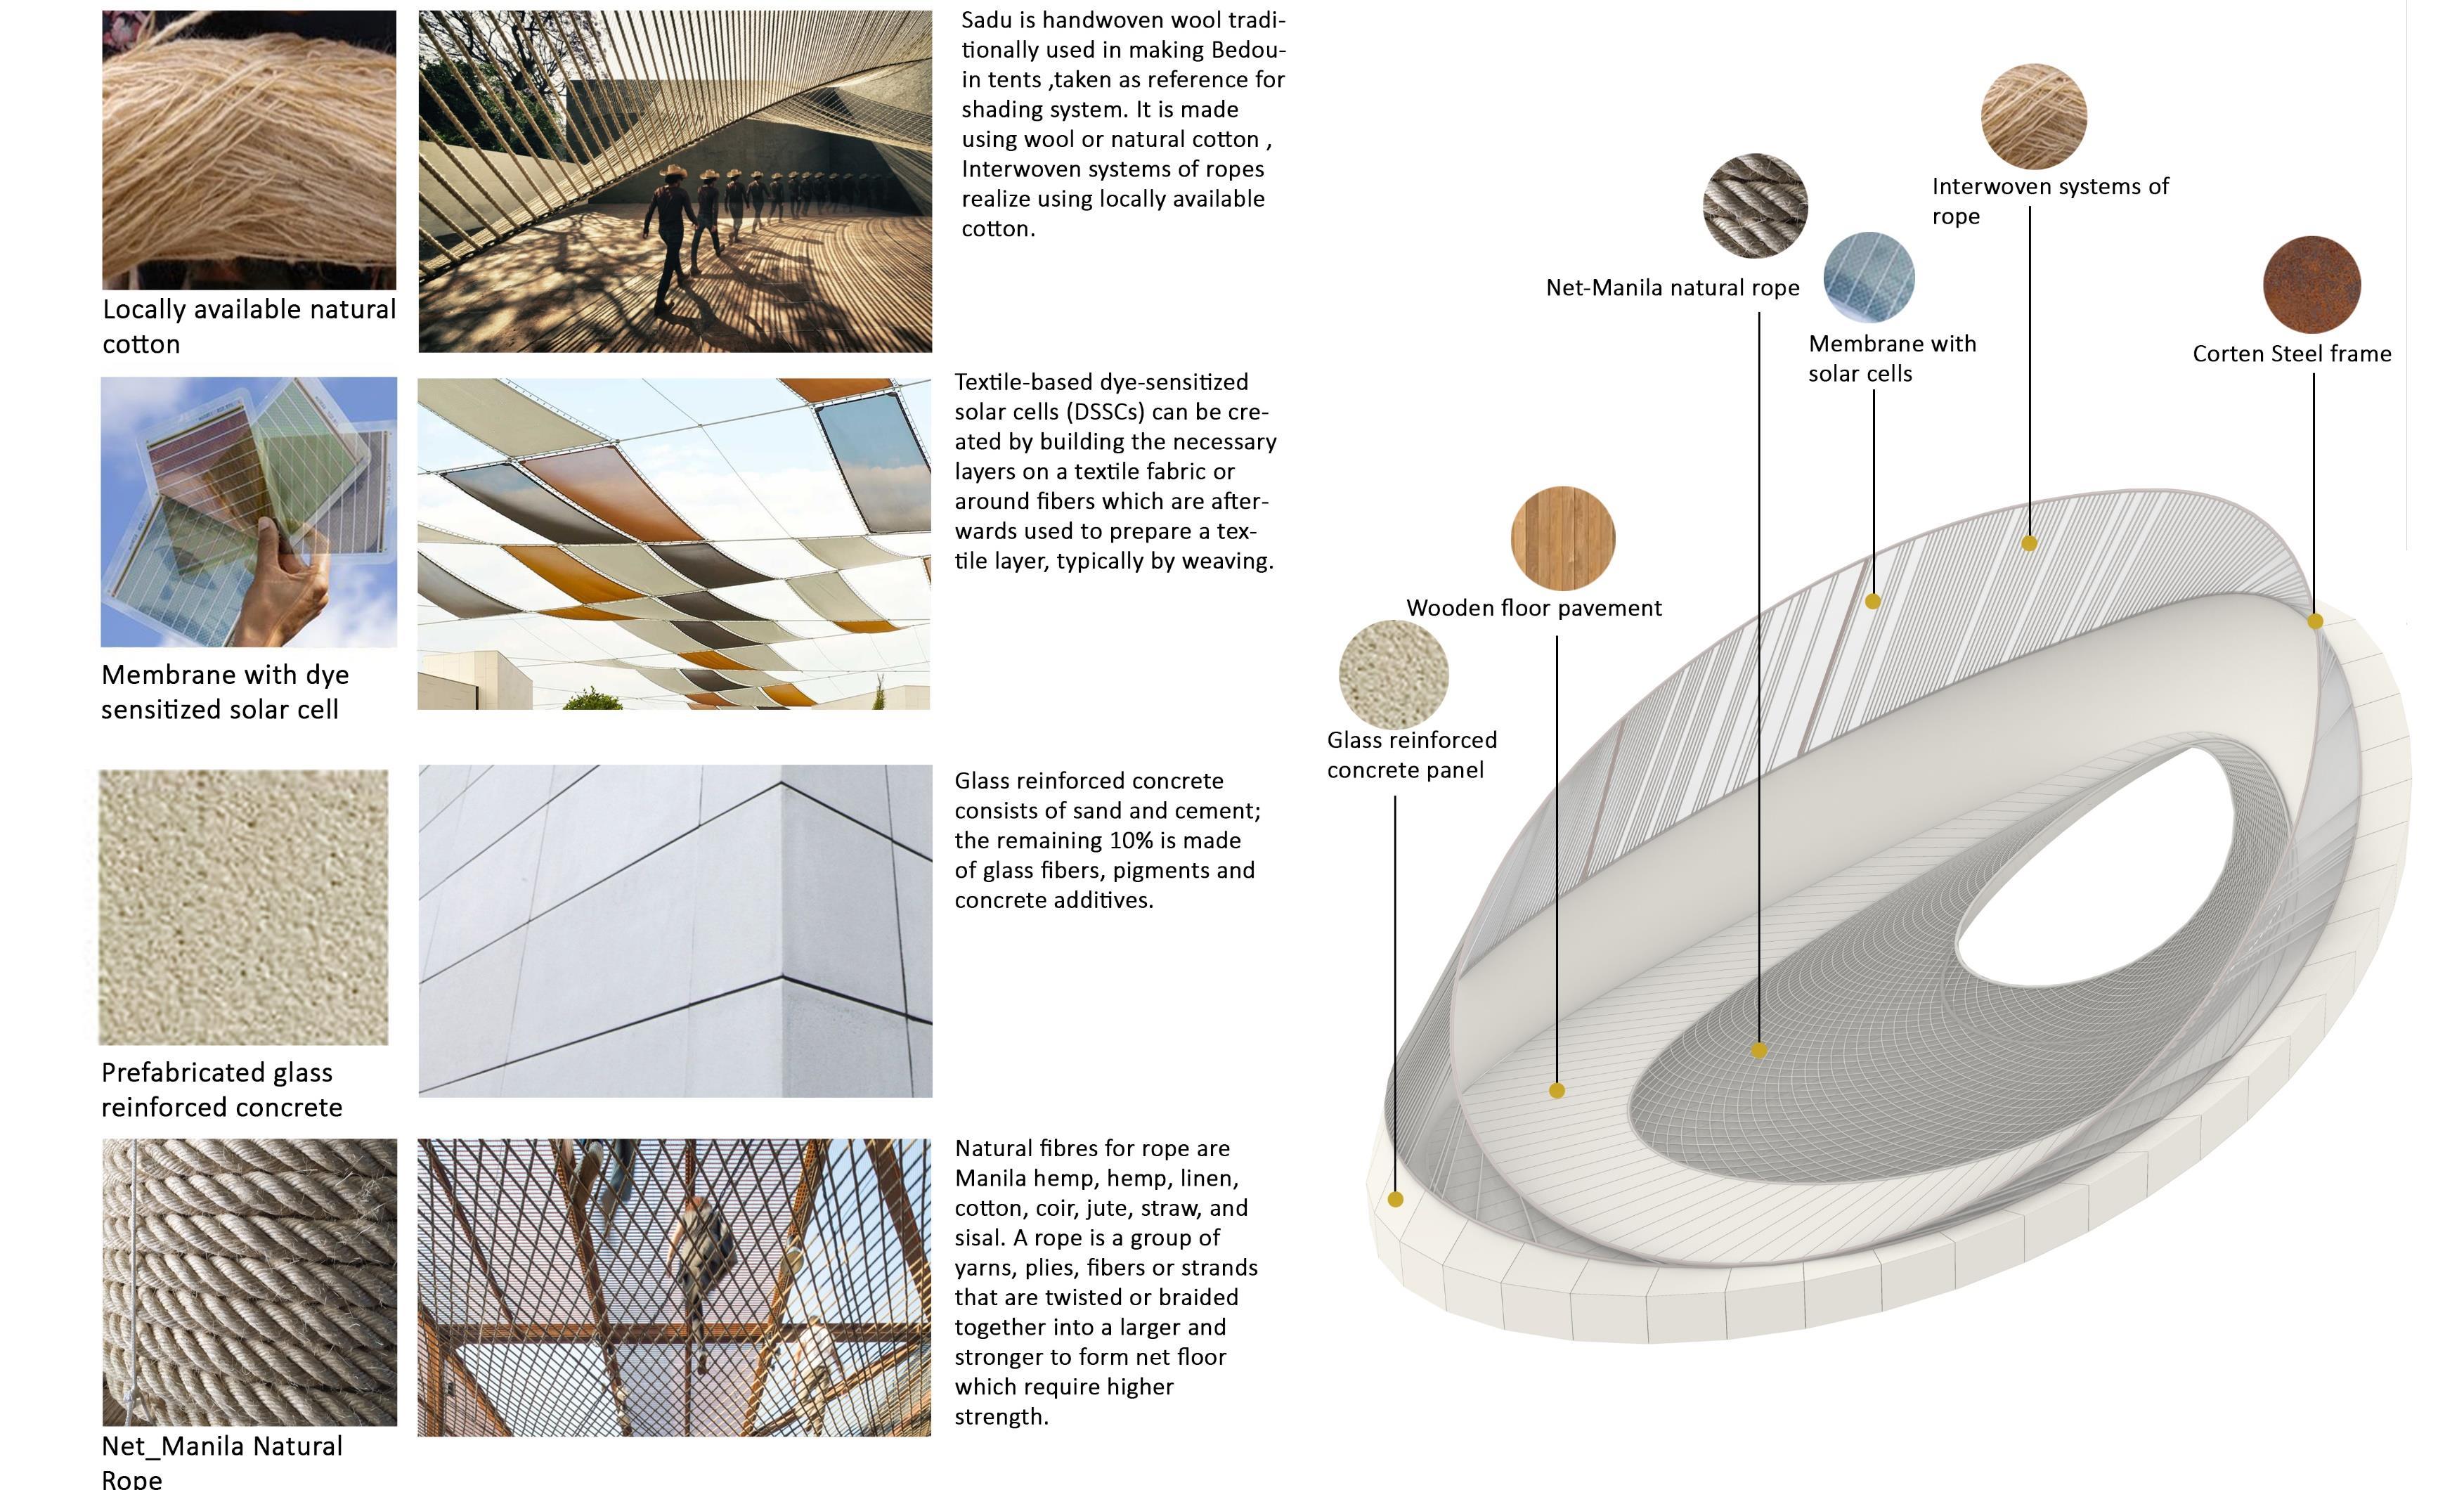
MATERIALS
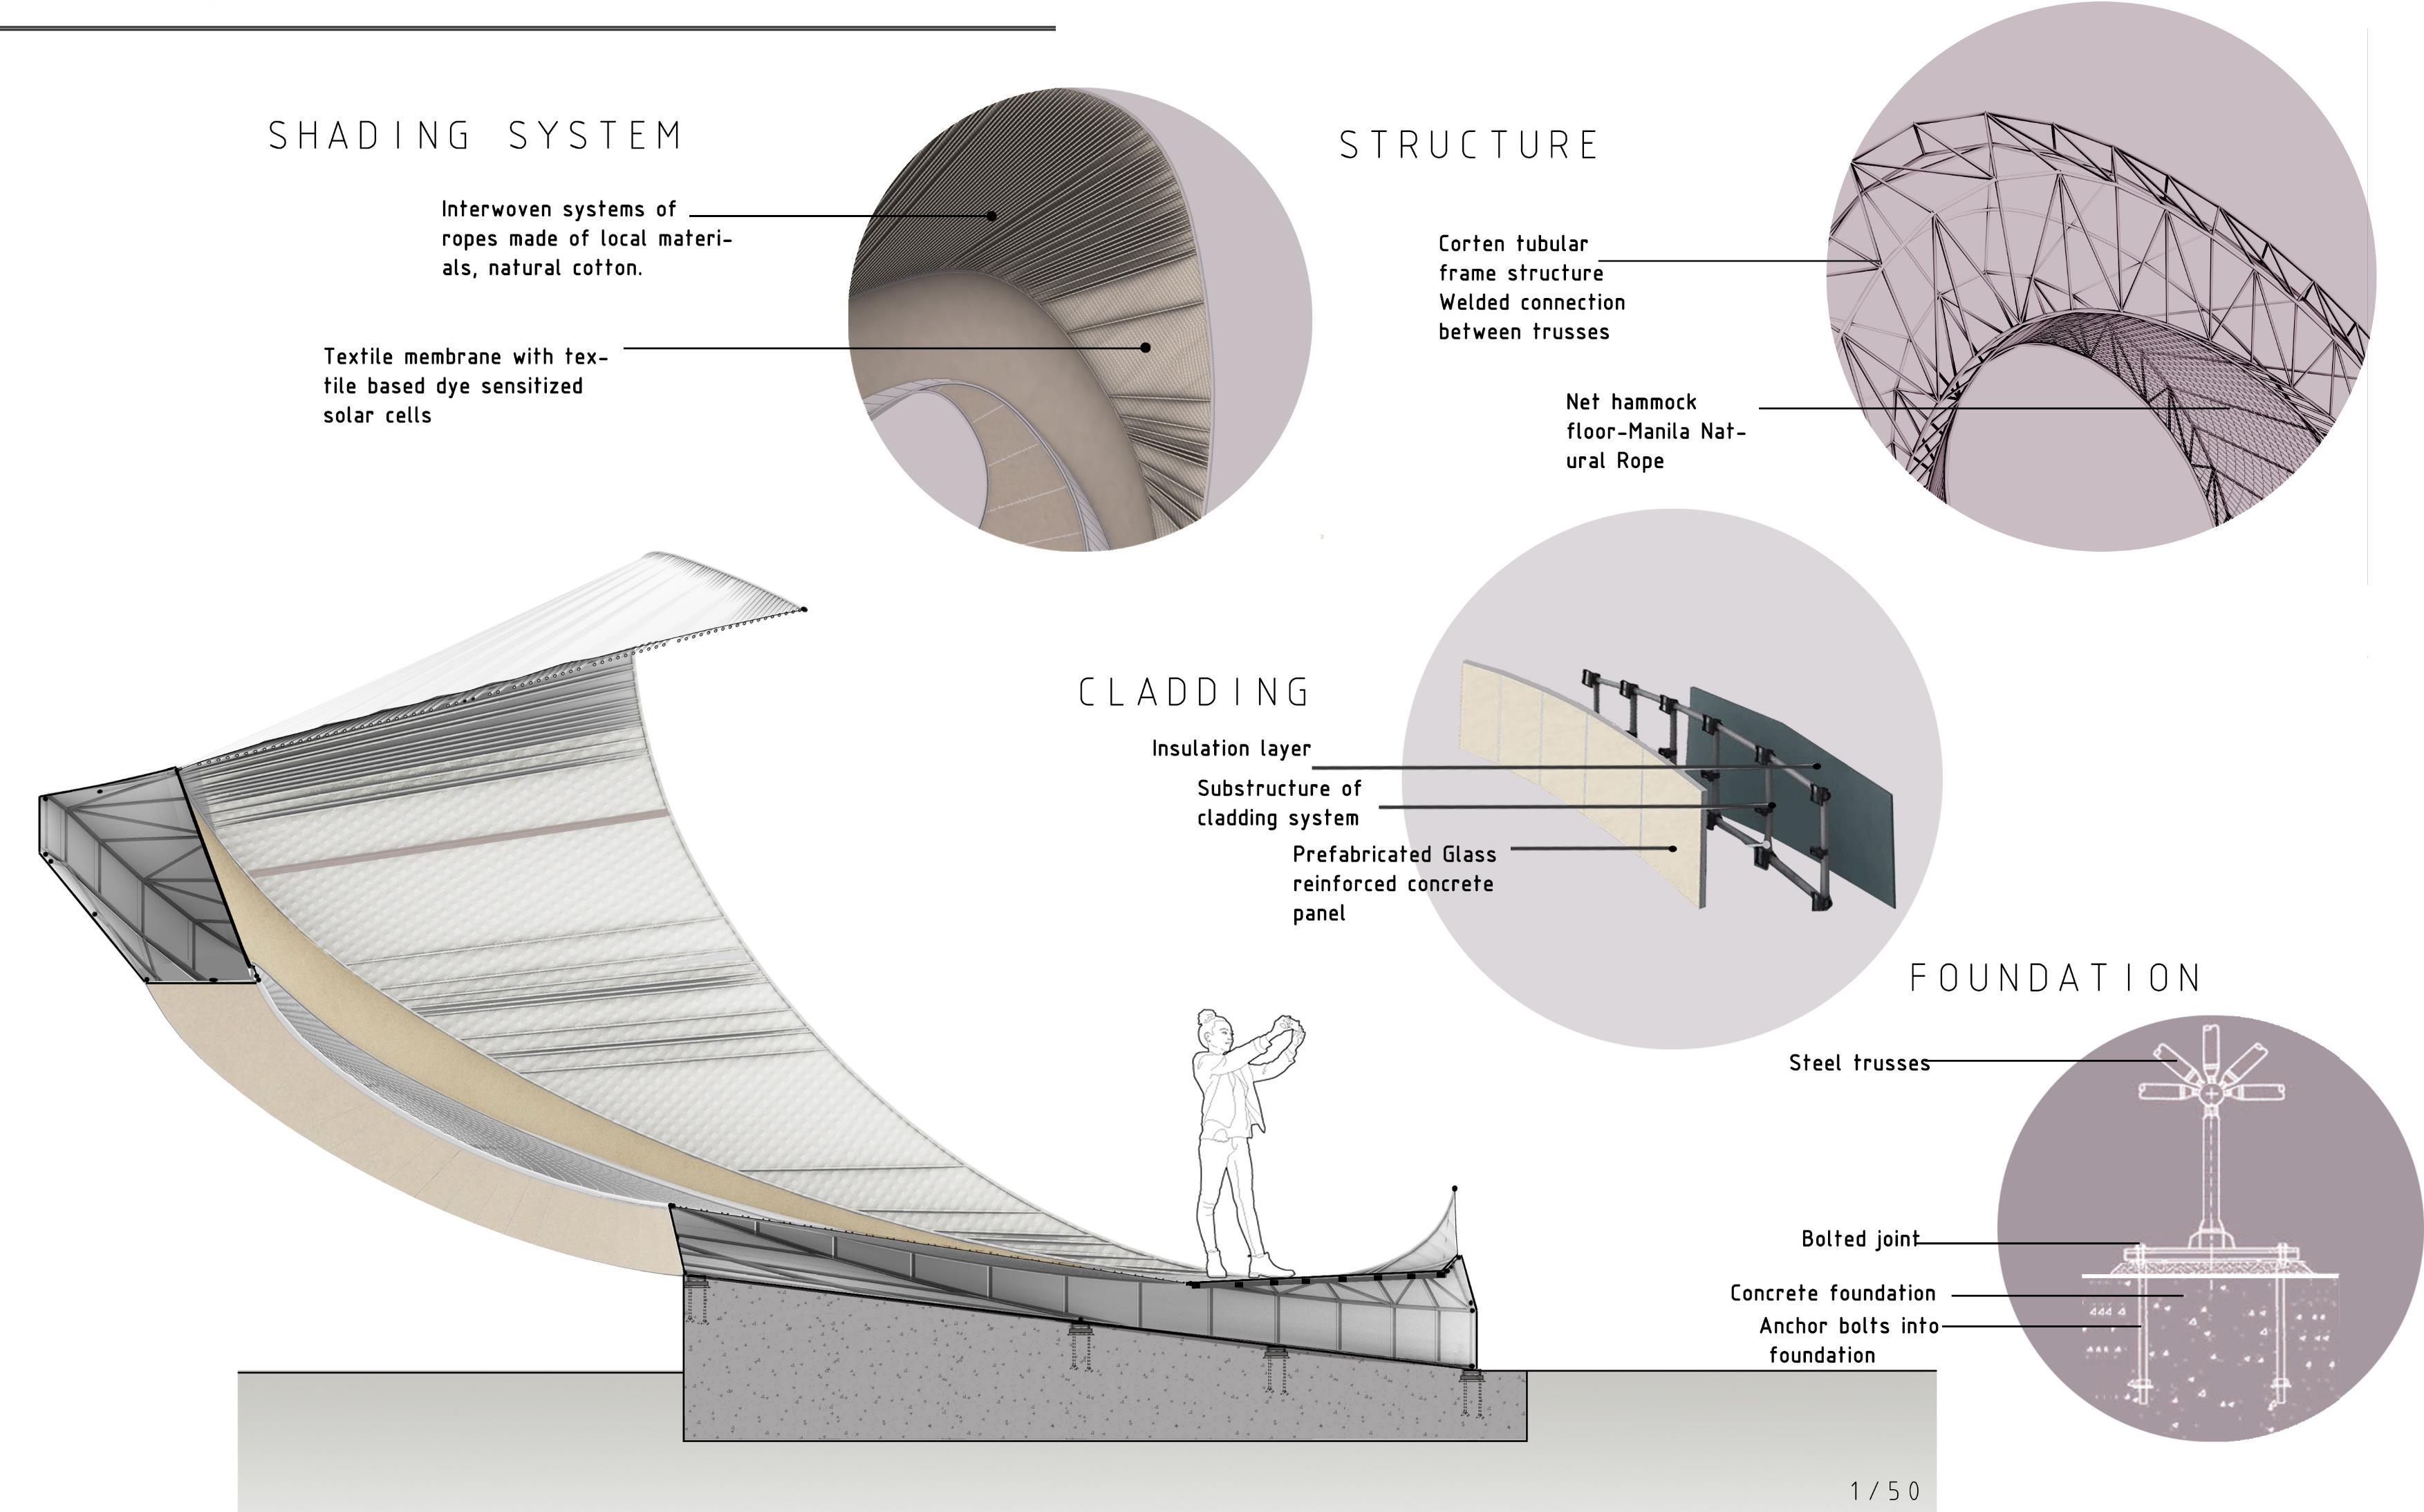
DETAILS
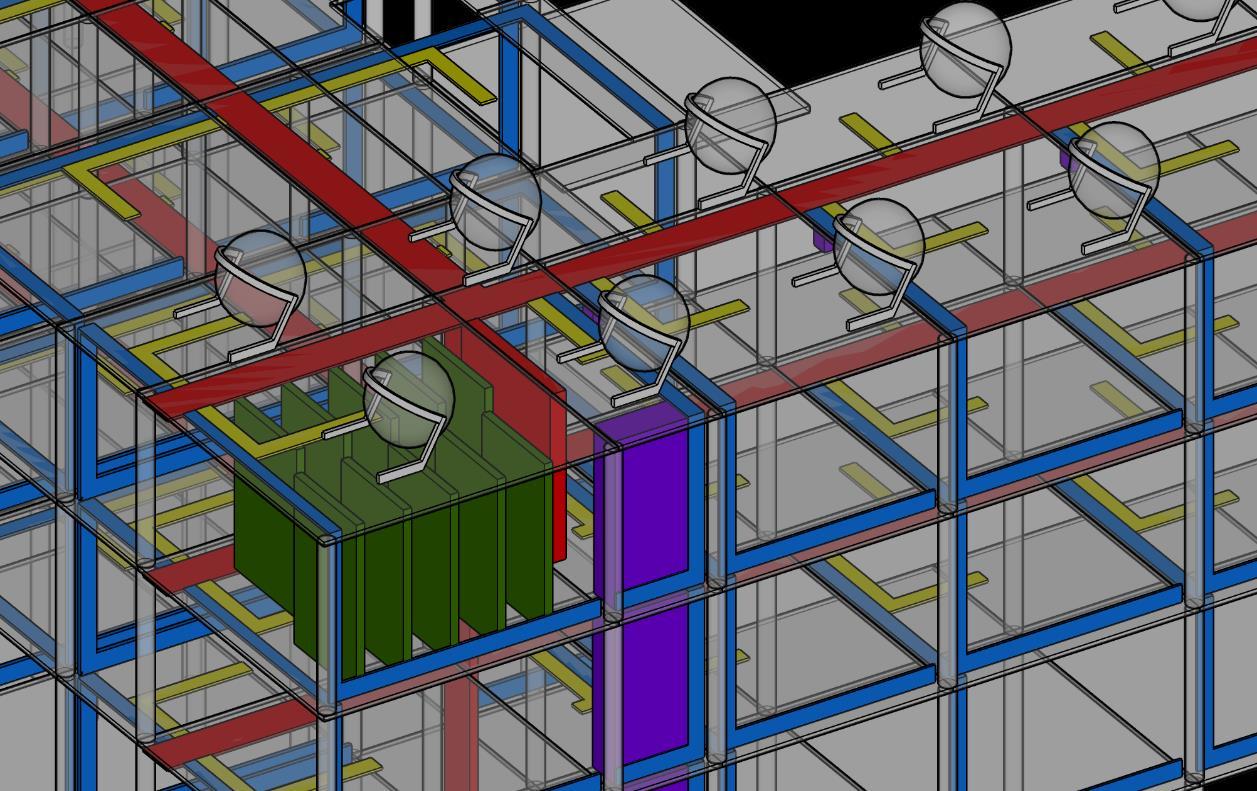
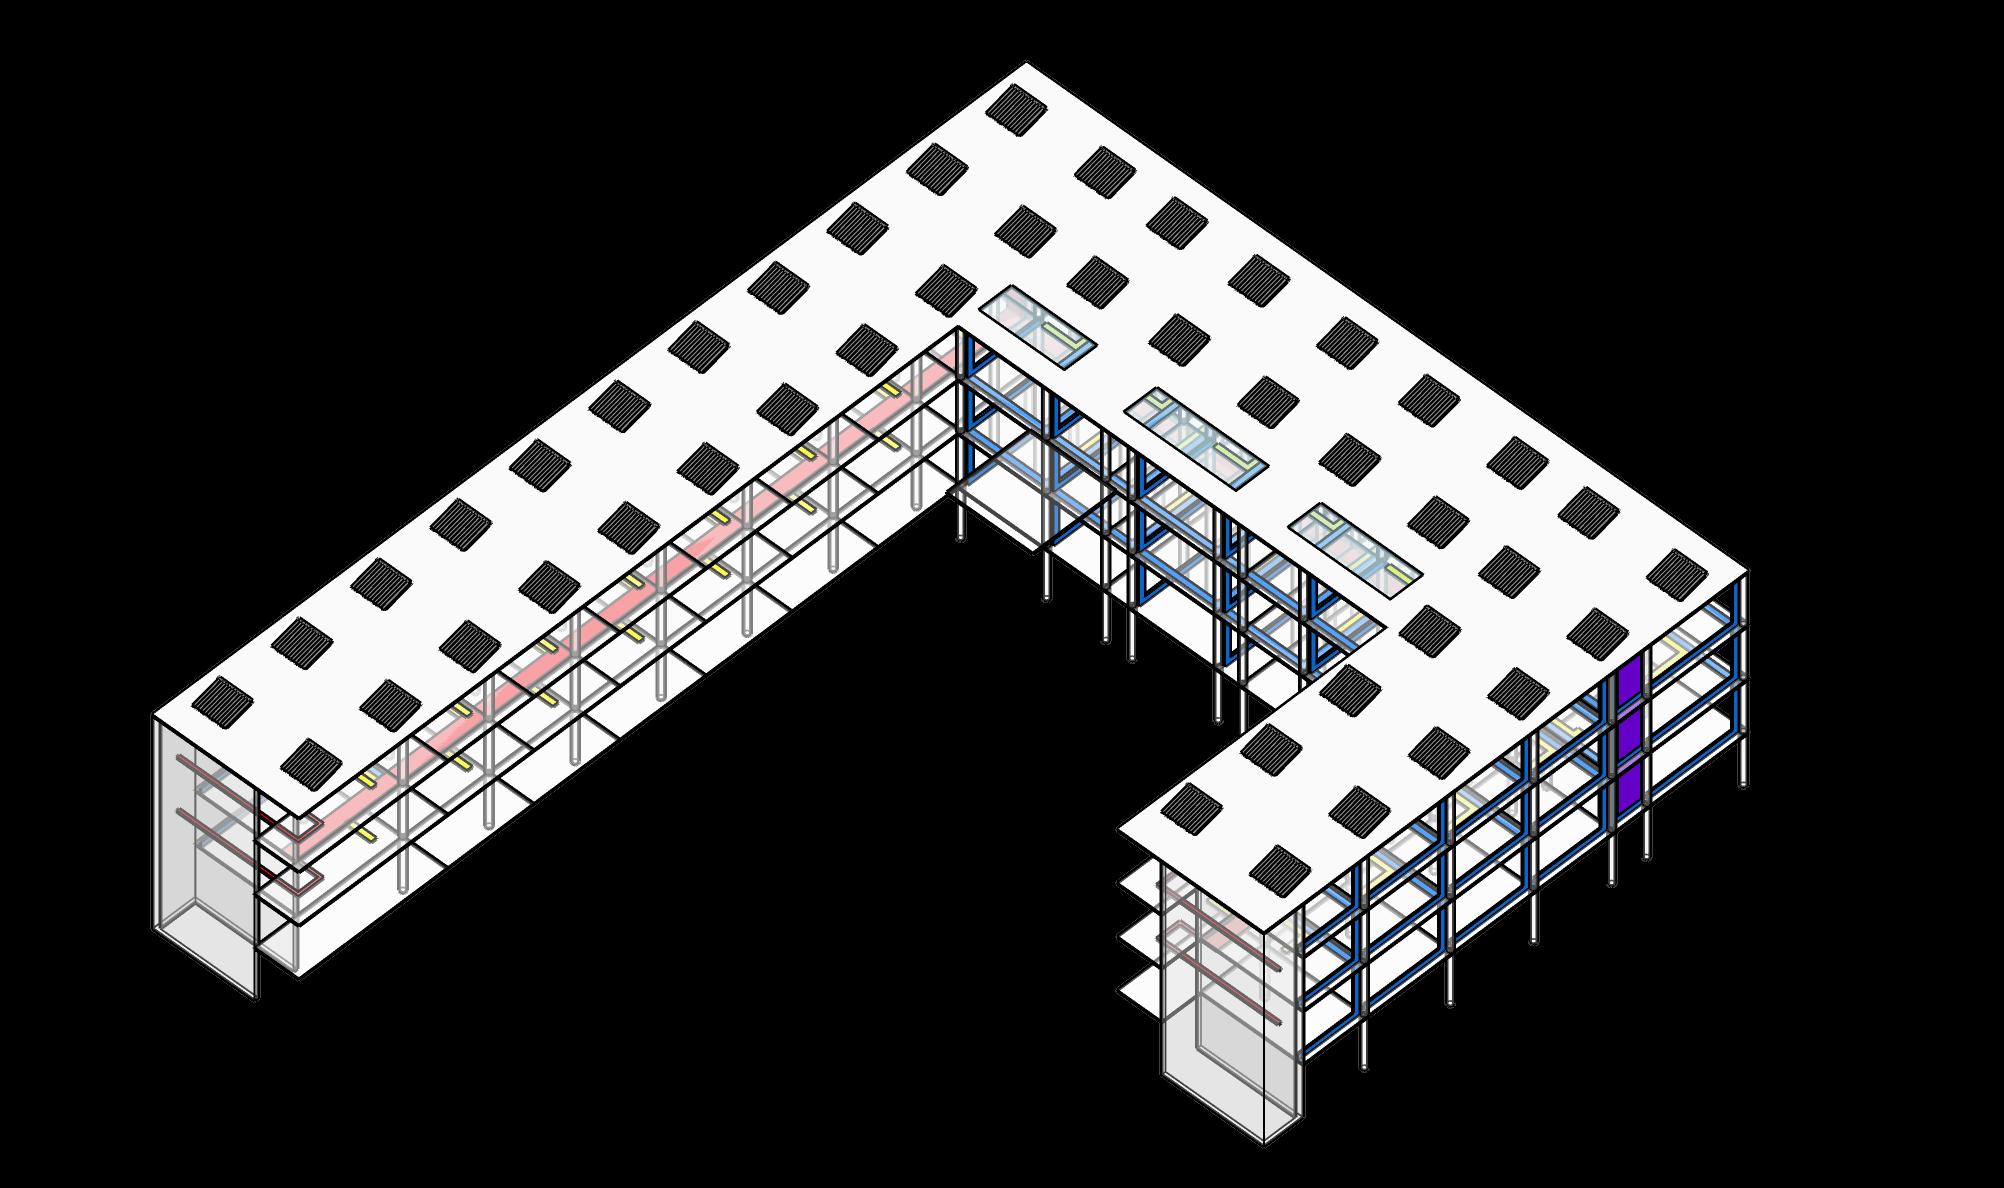
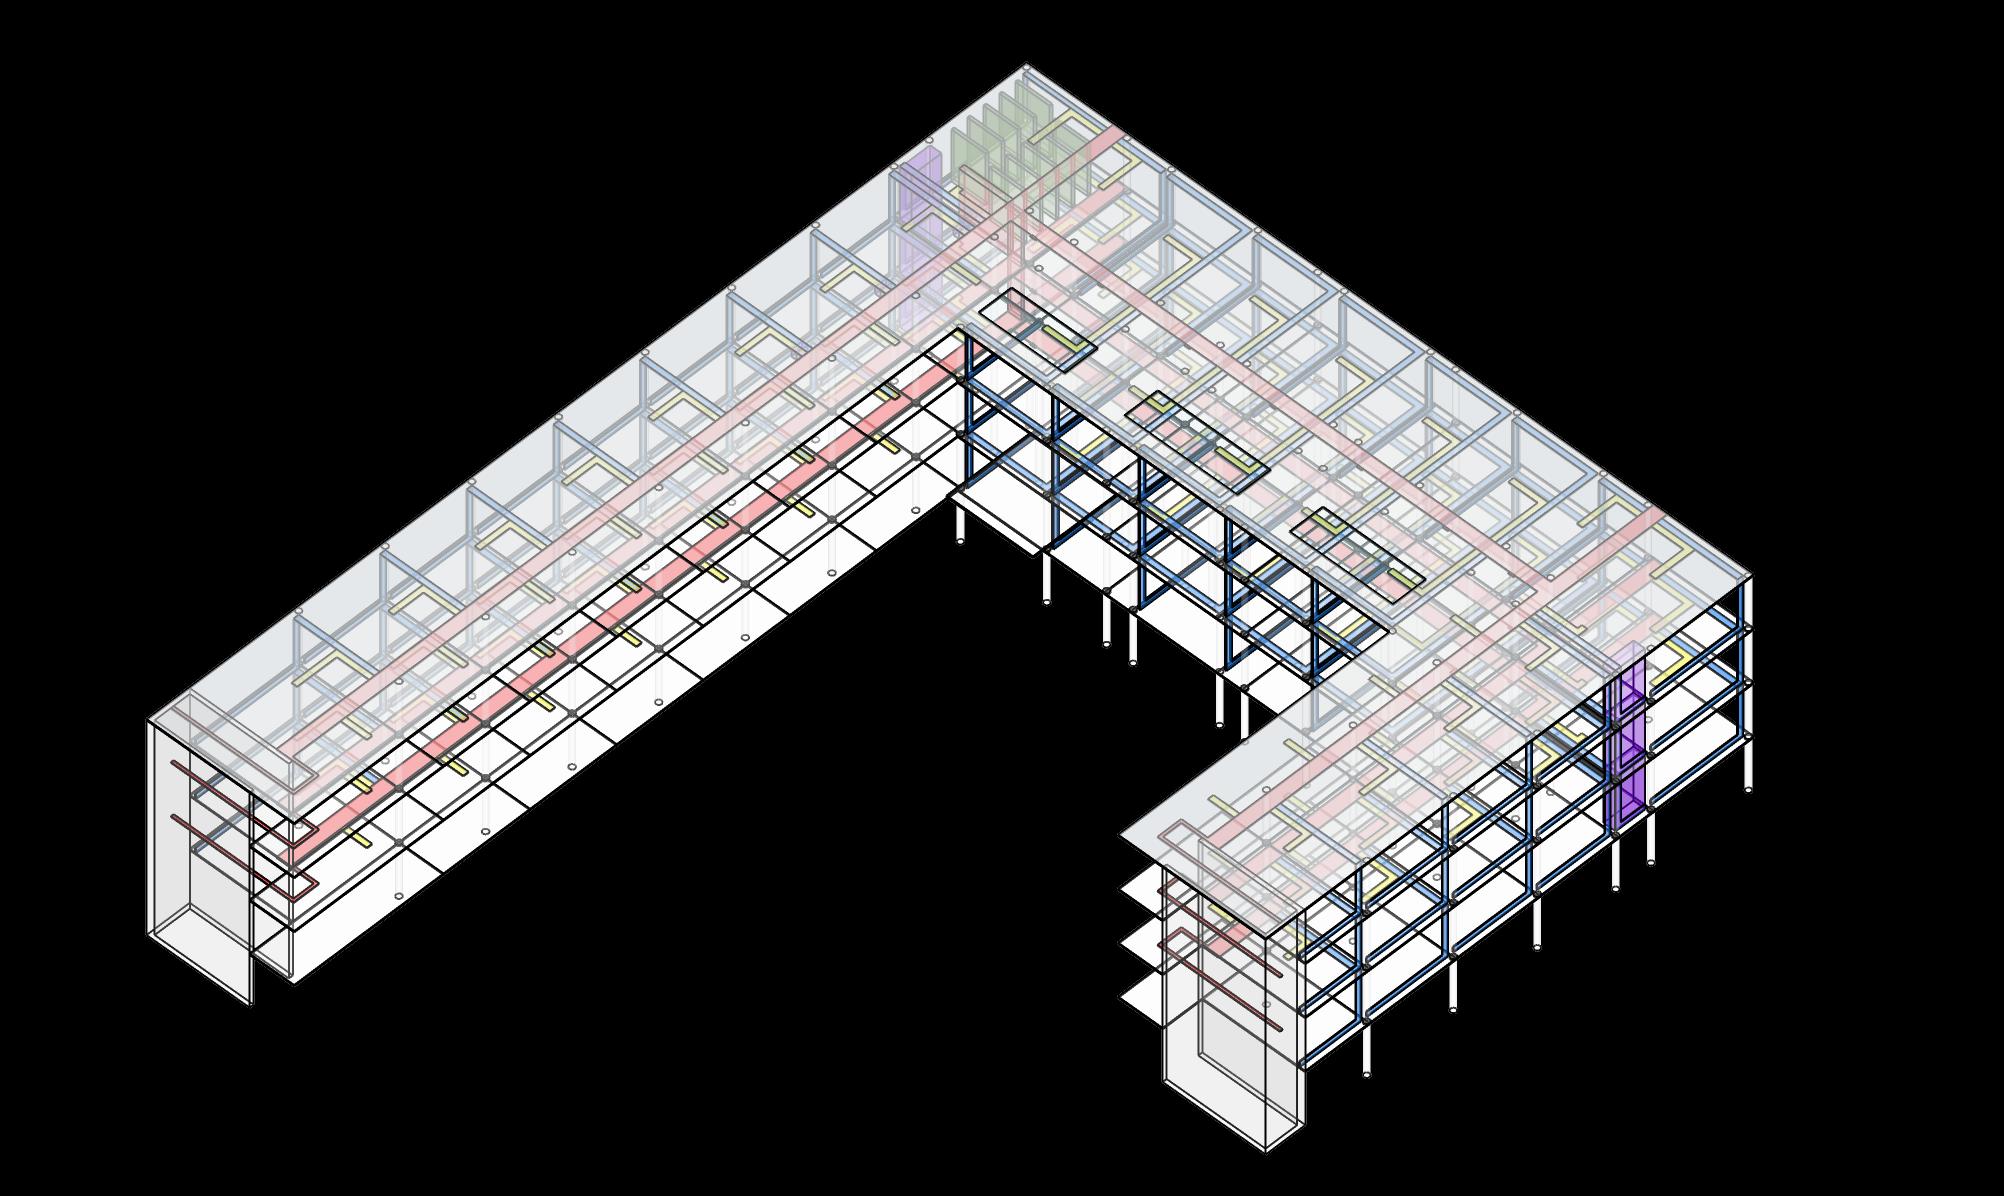
SYSTEM DETAILS
PANELLING, SHADING, MEMBRANE AND STRUCTURE
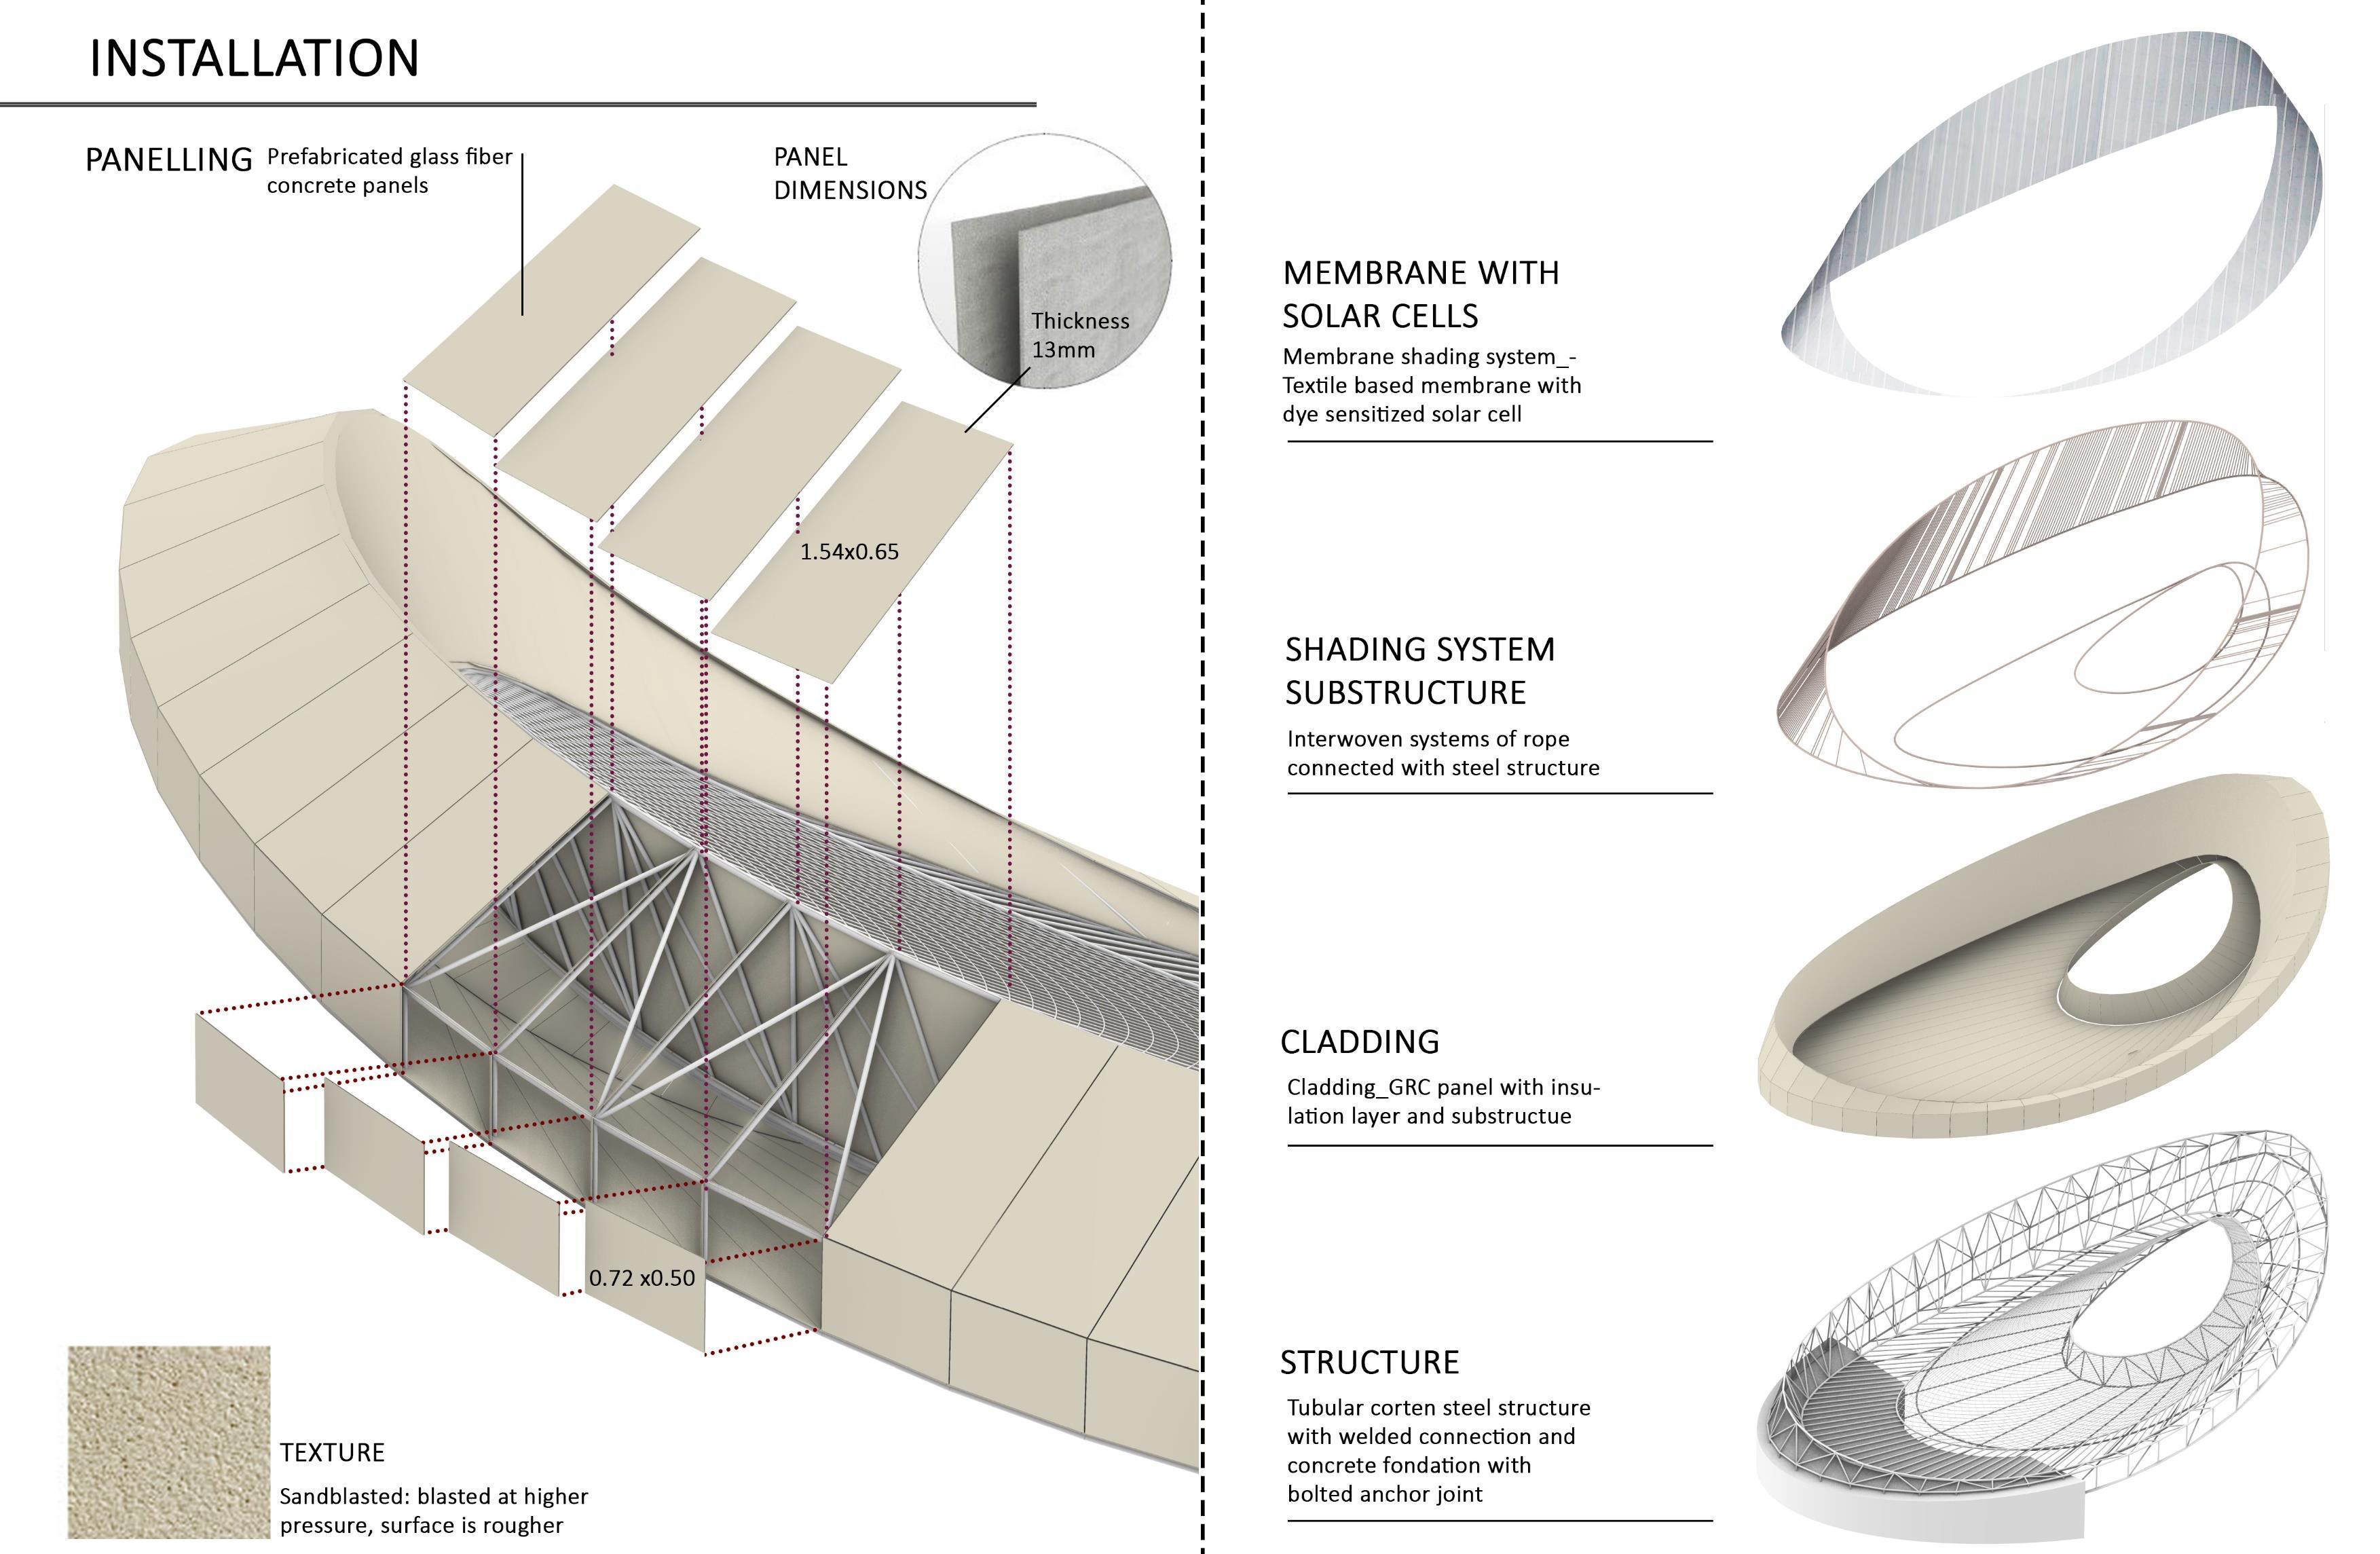
INSTALLATION
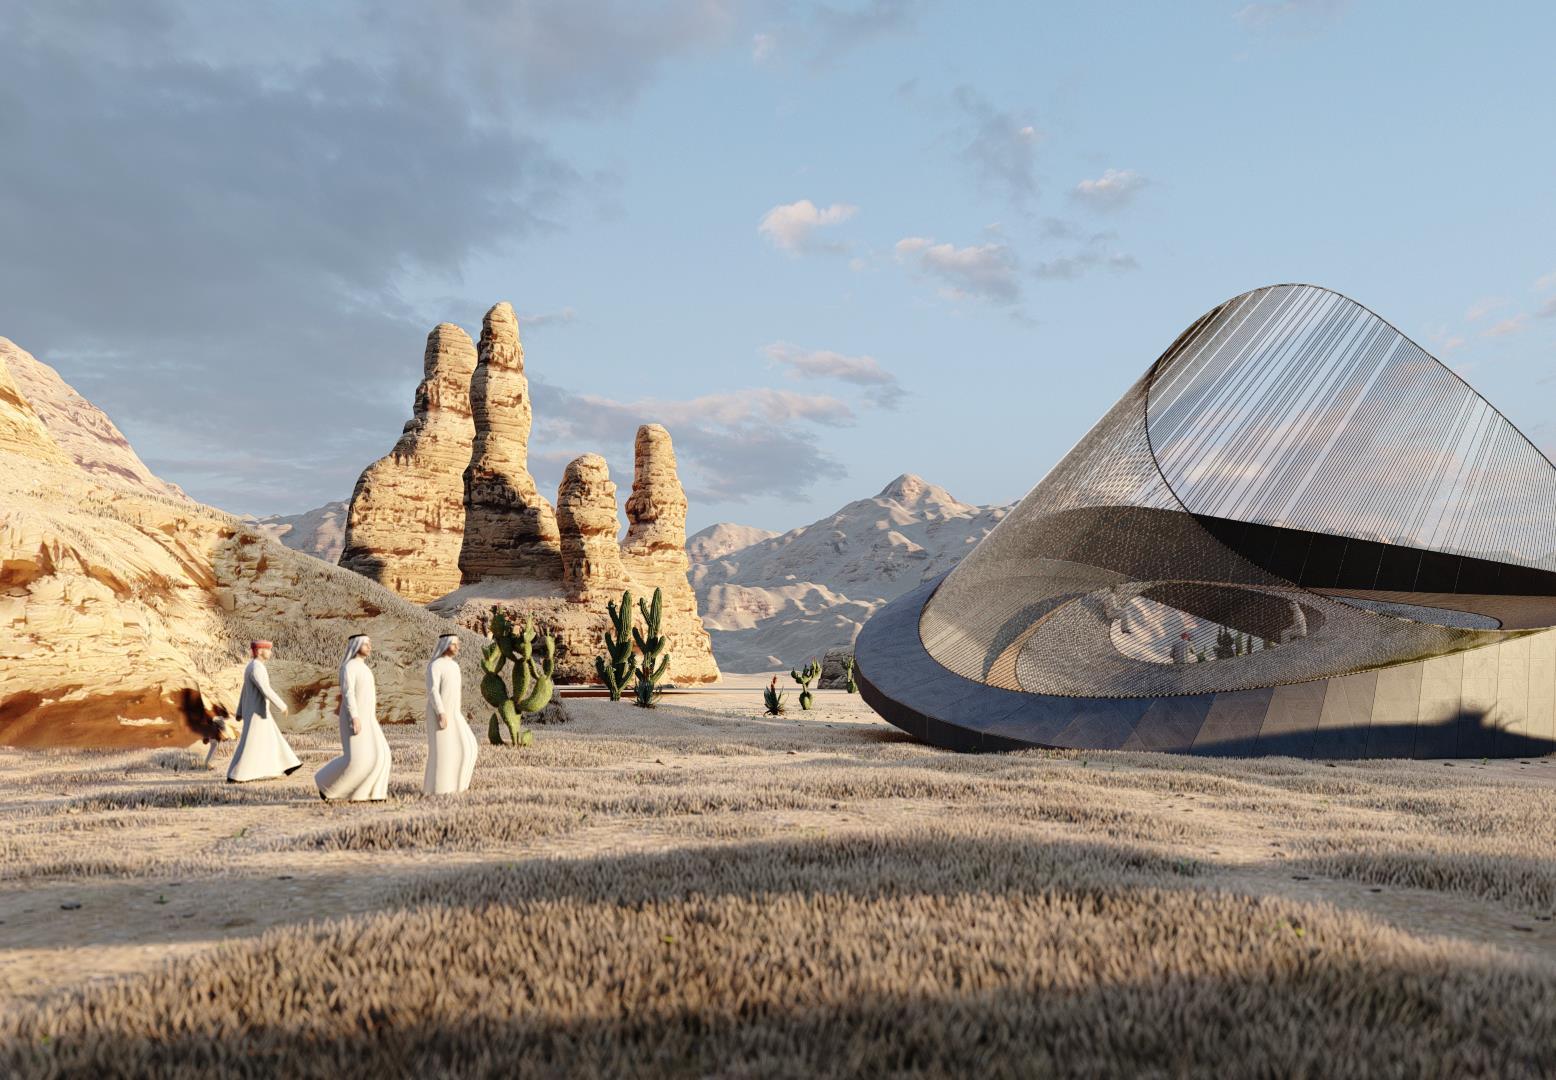
Comparison
Human-Size
INTRODUCTION
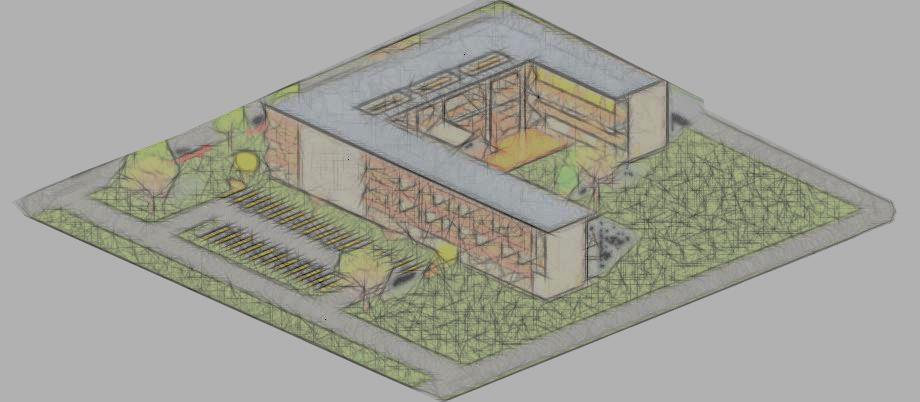
CASE STUDY PROBLEM DEFINITION
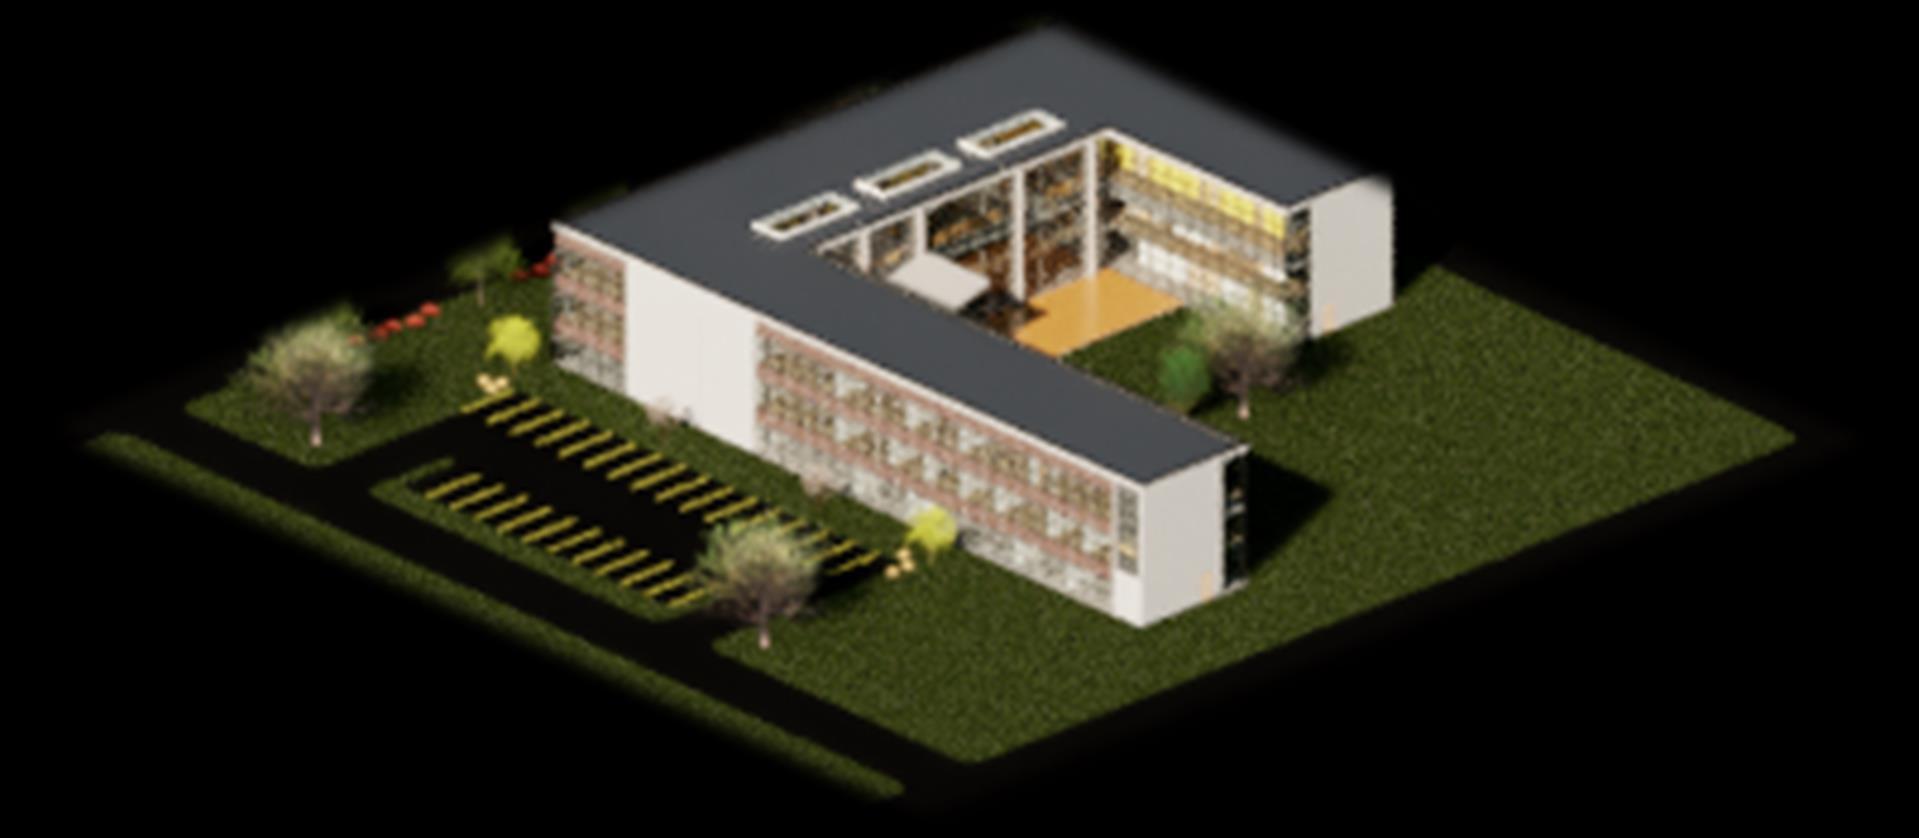
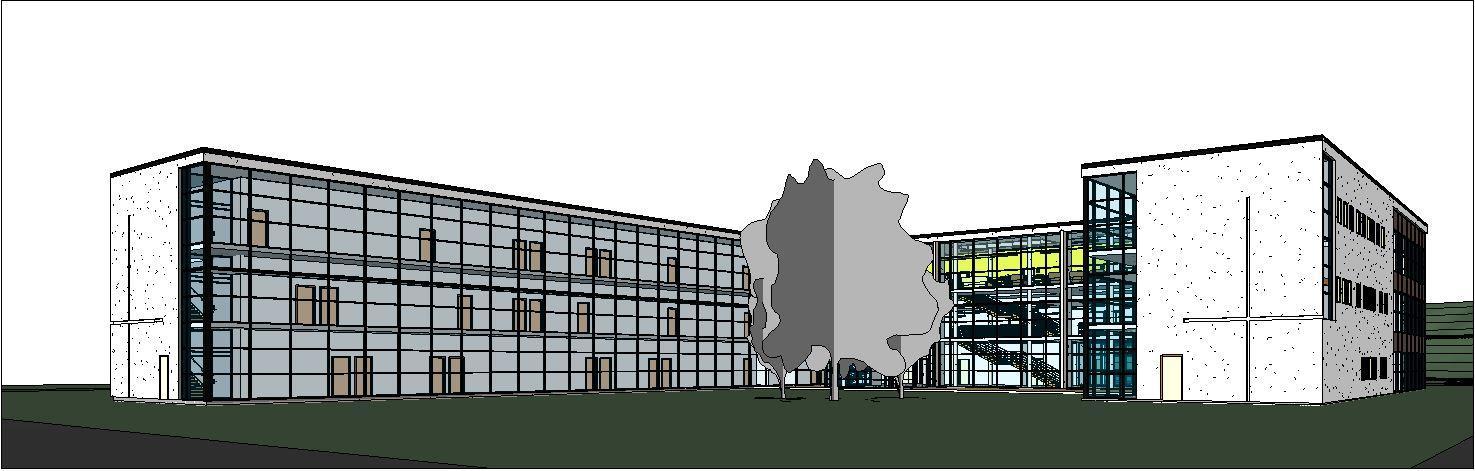
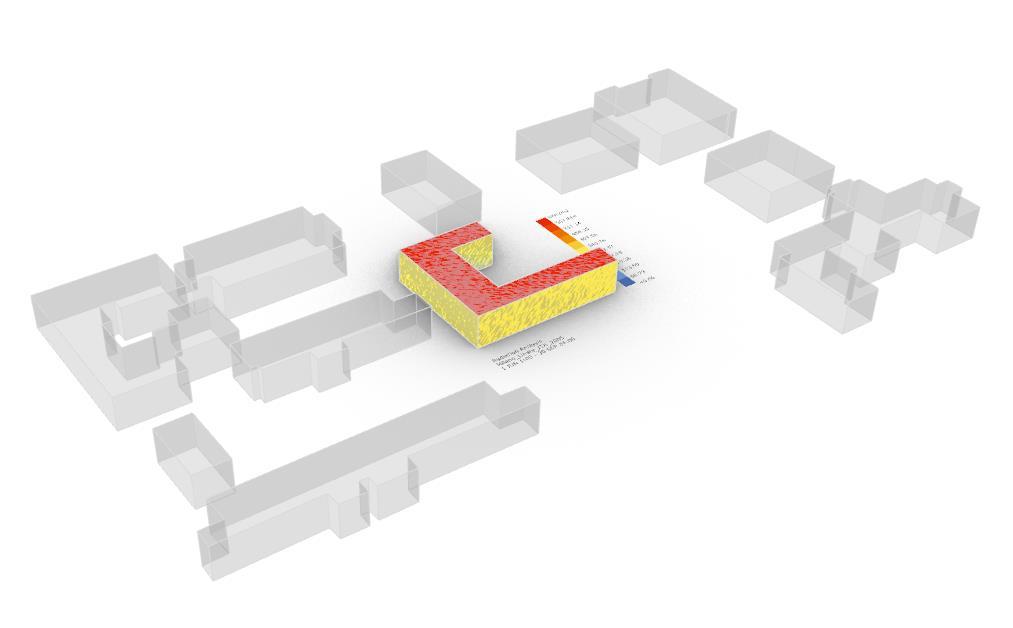
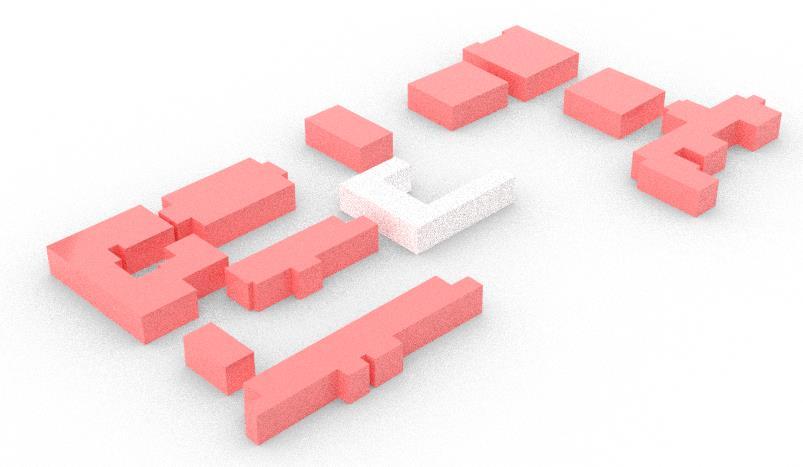
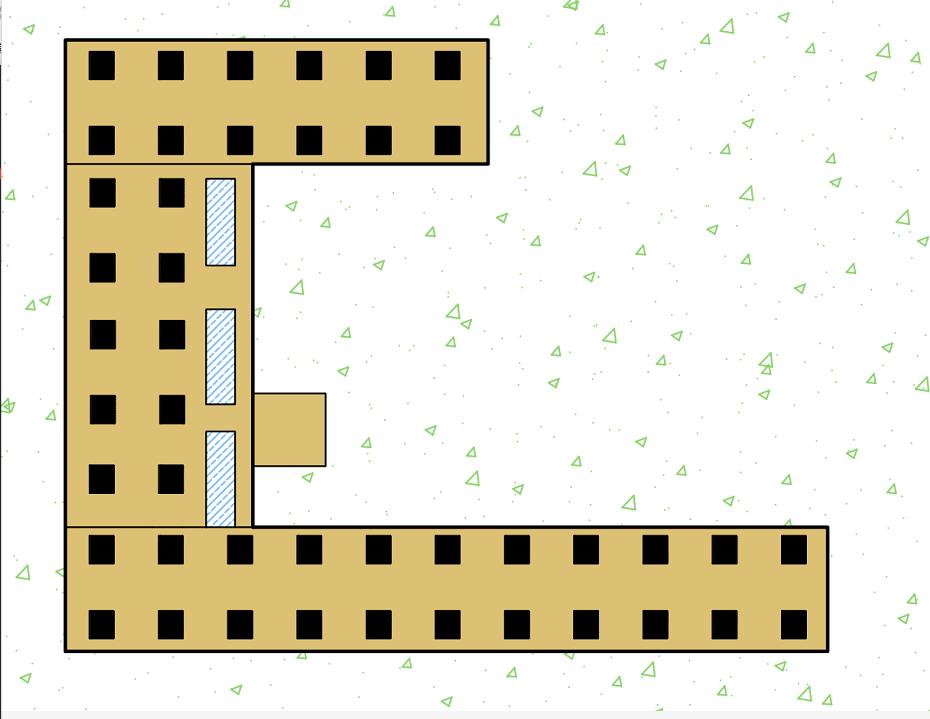
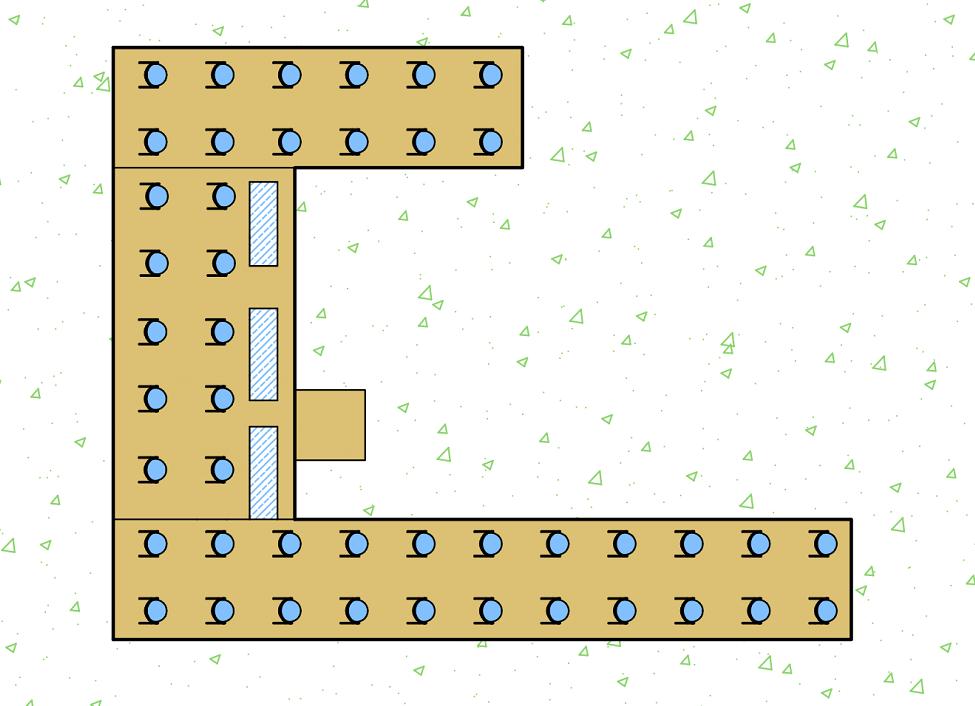
The building is a High School Education building located in Valparaíso, Chile. For this case-study the building´ s envelope respond to the National Thermal Regulation (OGUC 4..1.10):
Thermal Characteristics of the Building (OGUC 4.1.10)
Wall (Building’s wall) 3.0 W/M²k (2.46 W/M²k) Roof (Building’s roof)= 0.6 W/m²K (0.48 W/M²k)
Window – Curtain Wall (Building´ s double glazing) 3.6 - 2.4 W/m²K (2.85 W/m²K)
Basement Building basement Not regulated (2.77 W/m²K)
Valparaíso is 15m above sea level The climate is warm and temperate The rain falls mostly in the winter, with relatively little rain in the summer. The average temperature in Valparaíso is 13.6 °C. About 345 mm of precipitation falls annually.
With an average of 17° C, February is the warmest month The hottest day of the year is February 8, with an average high of 20°C and low of 12°C.
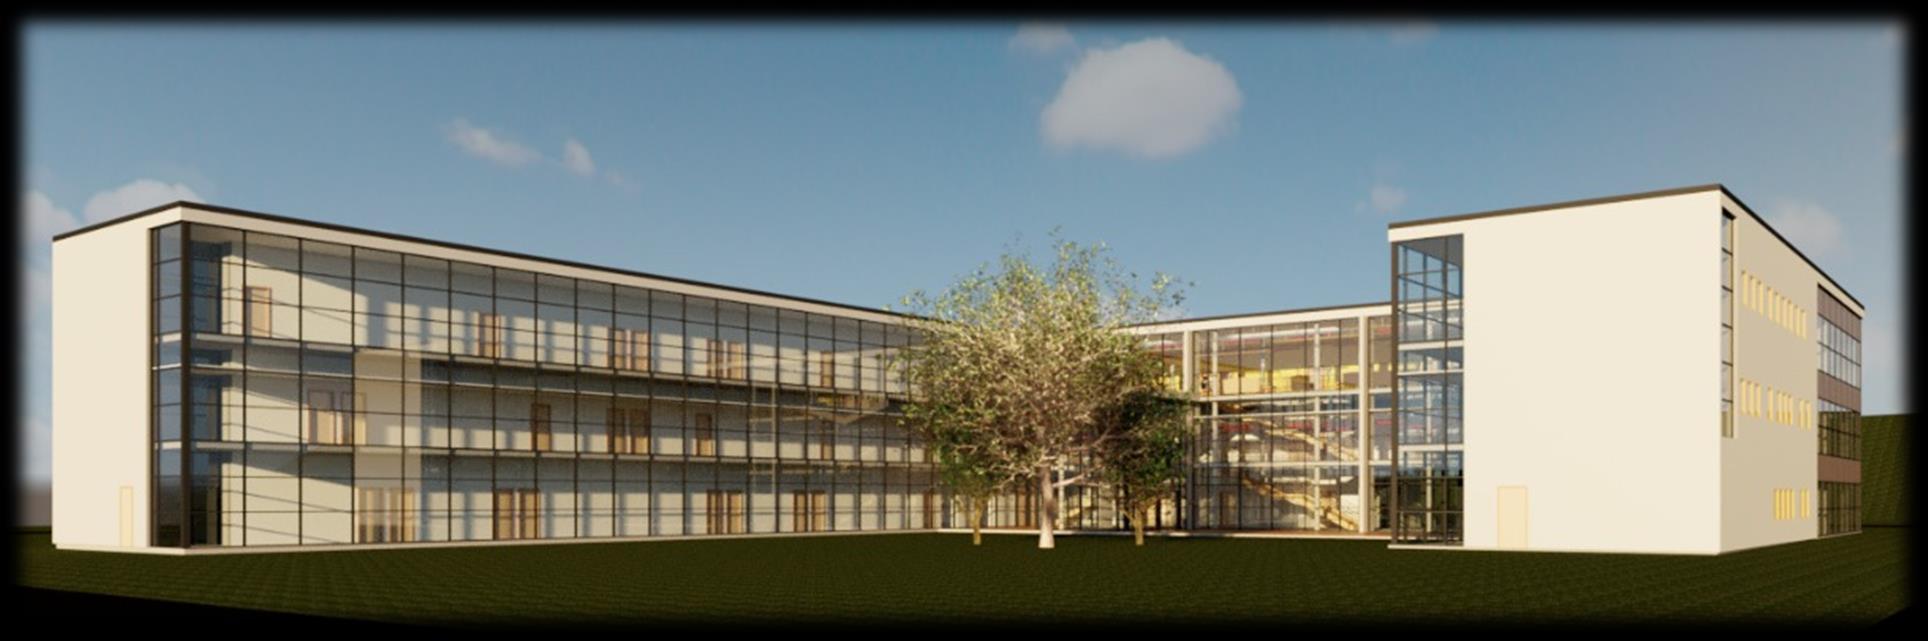
For this case-study, the building is relocated in the city of Milan, where will face similar climate conditions and the local normative
• The average temperature is 13.0 °C.
• The average annual maximum temperature is 17.6° C
• The average annual minimum temperature is 8 4° C
• With an average of 23 8 ° , July is the warmest month At 2 3
°C on average, January is the coldest month of the year.
At 10.4° C on average, July is the coldest month of the year. The coldest day of the year is July 27, with an average low of 7°C and high of 15°C
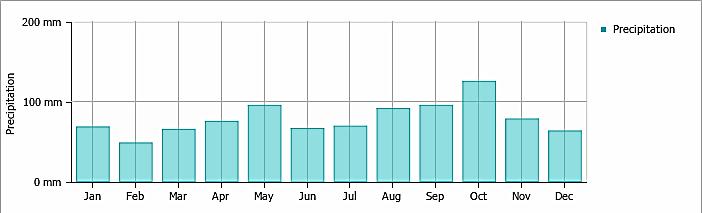
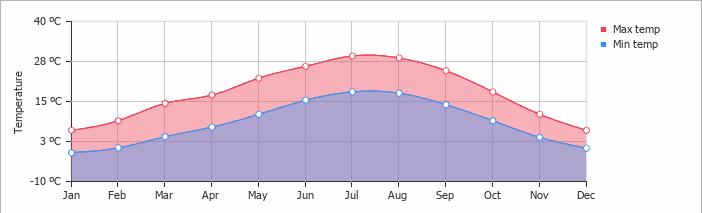
Regarding to the climate, Milan is 133m above sea level. In Milan, the climate is warm and temperate. The rainfall in Milan is significant, with precipitation even during the driest month The average temperature in Milan is 13 0 °C About 1162 mm of precipitation falls annually.
• The average amount of annual precipitation is 1162 mm
• The driest month is February. There is 61 mm of precipitation in February In October, the precipitation reaches its peak, with an average of 147 mm
• The average annual percentage of humidity is 77 0%
 Building, Location and Climate
Relocation
Weather Data Analysis
Building, Location and Climate
Relocation
Weather Data Analysis
Problem Definition
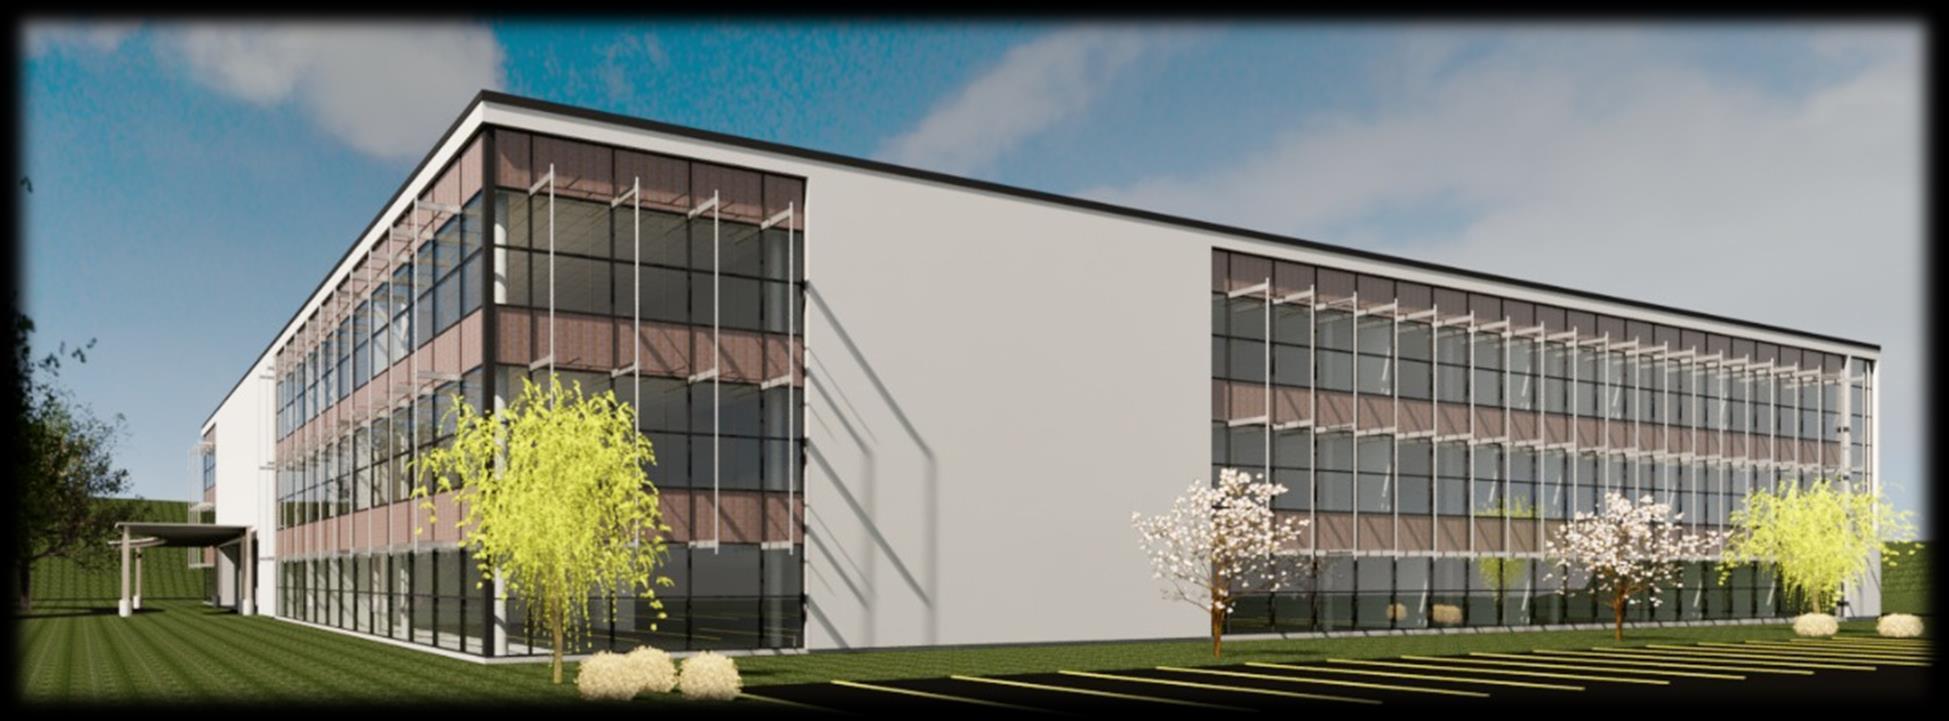
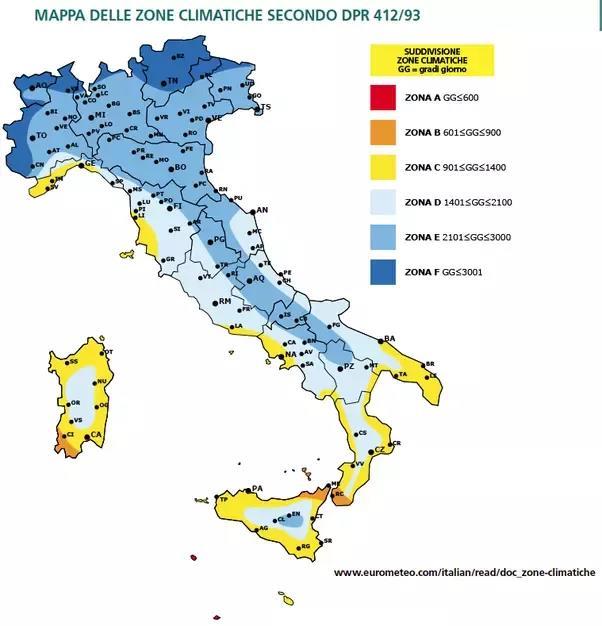
Once the building is being relocated in Milan, its envelope must be specified according to the Italian Climate Zone, which in our case is ZONE E.
Envelope Optimization
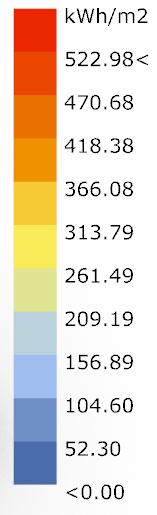
Building Envelope Systems Uvalue target Uvalue Case Study Uvalue optimizaded Uvalue reduction
Wall 0.26 [W/m²K] 3.0 W/M²k (2.46 W/M²k) 0.23 [W/m²K] 90%
Roof 0.23 [W/m²K] 0.6 W/m²K (0.48 W/M²k) 0.23 [W/m²K] 52%
Basement 0.28 [W/m²K] Not regulated (2.77 W/m²K) 0.25 [W/m²K] 90%
Windows 1.30 [W/m²K] 1.5 _2 W/m²K (2.85 W/m²K) 1.00 [W/m²K] 50%
Curtain Wall
For this reason, our first step was to set new materials for the new design conditions The next table shows a comparison between the two thermal regulations, the original U values, and the optimized values of the envelope.
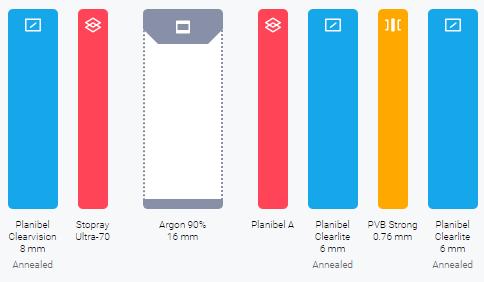
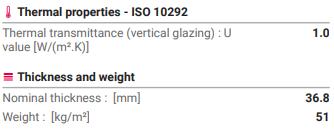
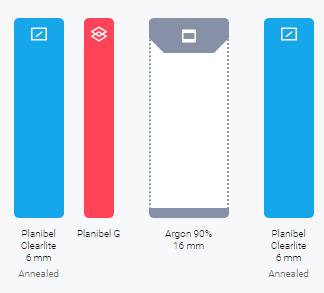
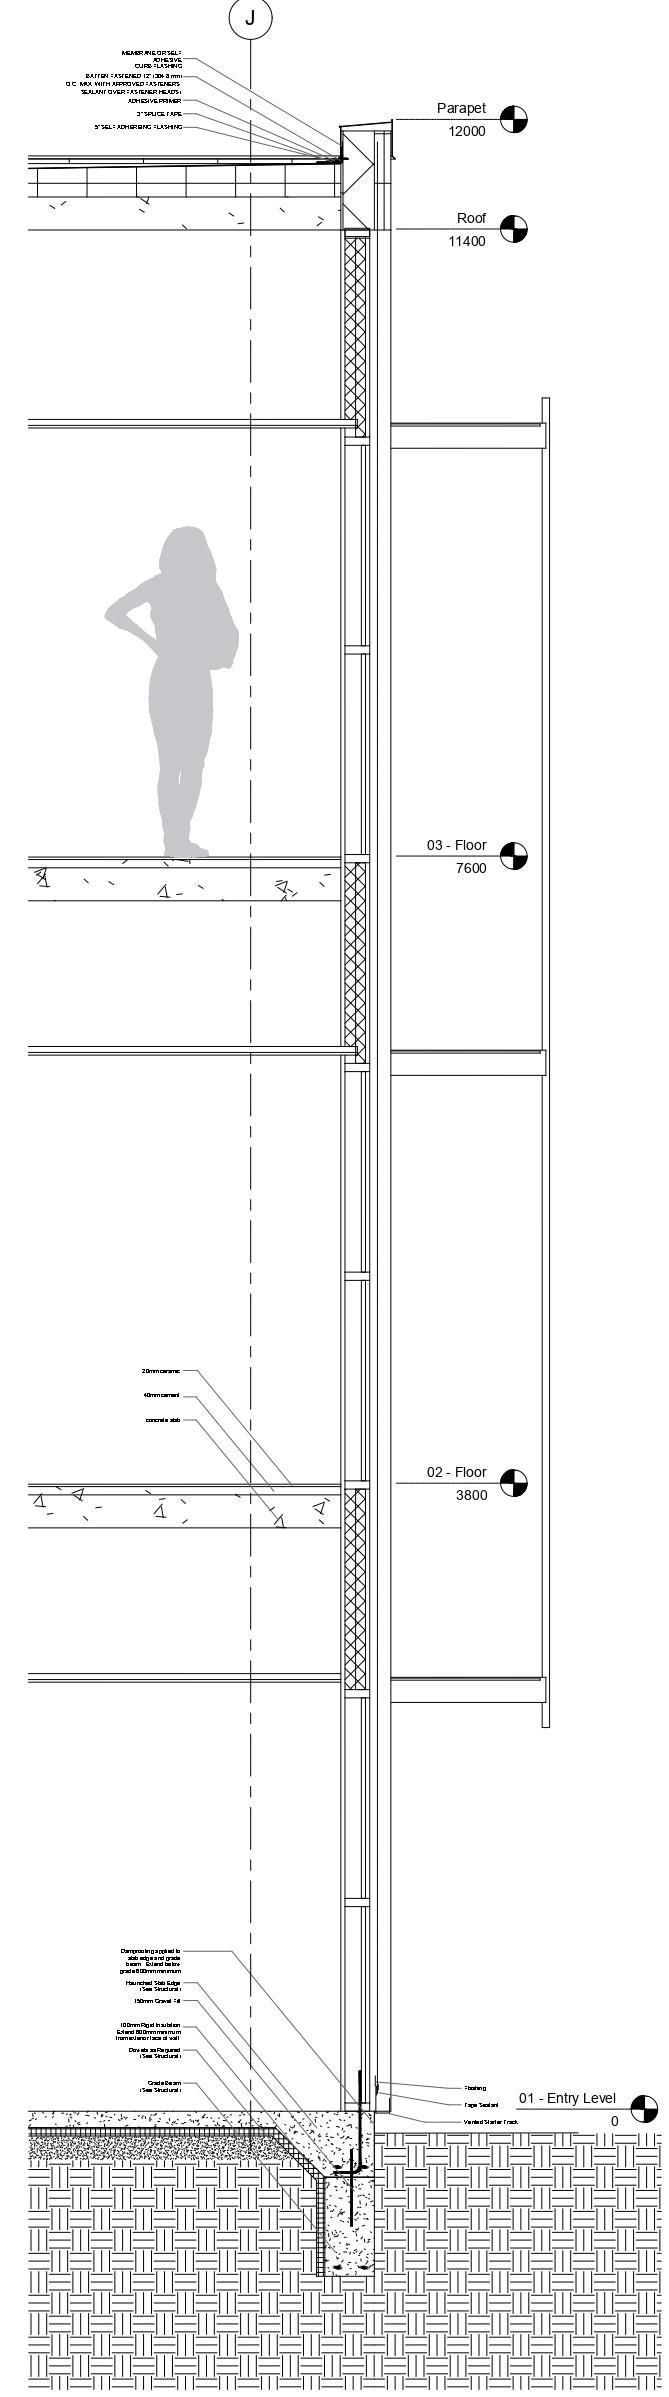
The new curtain wall consider the Schüco USC 65 F Unitized System Construction Frame with a double glazing from AGC The glazing system is configured by 8 mm planible Clearvision pos.2, 16 mm Argon 90%, 6 mm Planibel Clearlite,, Stratobel 66.2 (6 mm Planibel G pos. 5 + 0.76 mm PVB Clear +6 mm Planibel Clearlite).
Roof
Regarding the roof from the interior to the exterior is composed by 190 mm concrete slab + 120 mm Rockwool insulation + 45 mm cement board + waterproof vapour membrane + weldable waterproofing + weldable bitumen + waterproofing
Opaque Wall
The opaque wall of the envelope it was configurated with 13 mm gypsum board + a vapour barrier + 200 mm concrete block (heavyweight) filled with perlite + air infiltration barrier + 100 mm Extruded polysterene foam (XPS) with acrilyc finish.
Basement
The basement layer is structured by a 200 mm concrete slab + 100 mm Extruded polystyrene foam (XPS) + 150 mm gravel.
SPECIFICATION AND ENVELOPE OPTIMIZATION
INTRODUCTION PERFORMANCE
DPR
Italian Climate Zone
412/93
Problem Definition
DIIRECT NORMAL IRRADIATION GLOBAL HORIZONTAL IRRADIATION PHOTOVOLTAIC POWER POTENTIAL
THE PATH
After locating the Project in Milan and setting Milan conditions, our goal is by using less effective solutions to provide efficiency equal to the most efficient solution. At this point, we tried to understand which solution is not the most efficient so we can work on it and make it equal to the other most efficient solutions
By following this idea, we have worked in the radiation sector At this point, we have realized that Radiation is not the biggest problem for Milan but it is still remarkable From this point, we decided to work on it; how we can get benefit from radiation, and how we can solve the problems which cause by radiation Due to work on this section, we have set the energy efficiency parameters of our building first then worked on problem definitions, re-engineering.
These analysis made because of potential problems and opportunities seen by radiation energy
• Direct Normal Irradiation: This analysis done to understand do we need a shading system
• Global Horizontal Irradiation: This analysis done to understand which kind of shading system we are going to use
• Photovoltaic Power Potential: This analysis was done to see how we can make equal solar energy efficiency to others
As a result;
• Since our South facade is clear, we decided to work on a shading system that will provide a comfort zone to the interior side. Due to work on the shading system, we re-engineered the current shadings by working on daylight analysis and radiation analysis.
• Since there is remarkable solar energy can be provided according to photovoltaic power potential analysis, we decided to work on solar energy systems as well Yet as it is seen from the analysis, we decided to work on new tech systems which can provide much more efficiency than other kinds of solar energy systems
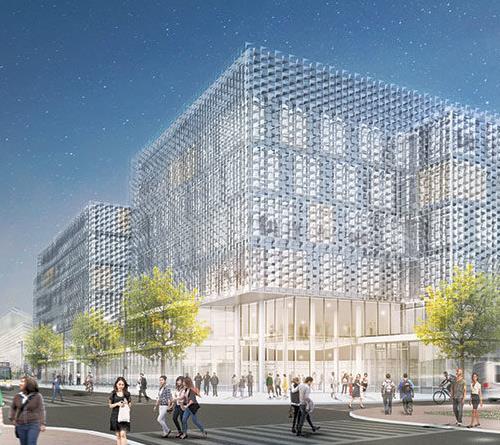
INTRODUCTION
ANALYSIS AND THE PATH
of
envelope 204 m² Ratio surface envelope/volume 1.17 m²/m³ �������������������� 0.20 W/m²K
heat losses 26.6 kW h/a
heat losses 0.23 kW h/a Internal heat gains 0.28 kW h/a Solar heat gains 1.60 kW h/a
Building Energy Efficiency Parameters Area
building
Transmission
Ventilation
PROBLEM DEFINITION (RADIATION) DAYLIGHT RE-ENGINEERING (PROBLEM SOLUTION) SOLAR RE-ENGINEERING (ENERGY EFFICIENCY) Performance Specifications Design Brief
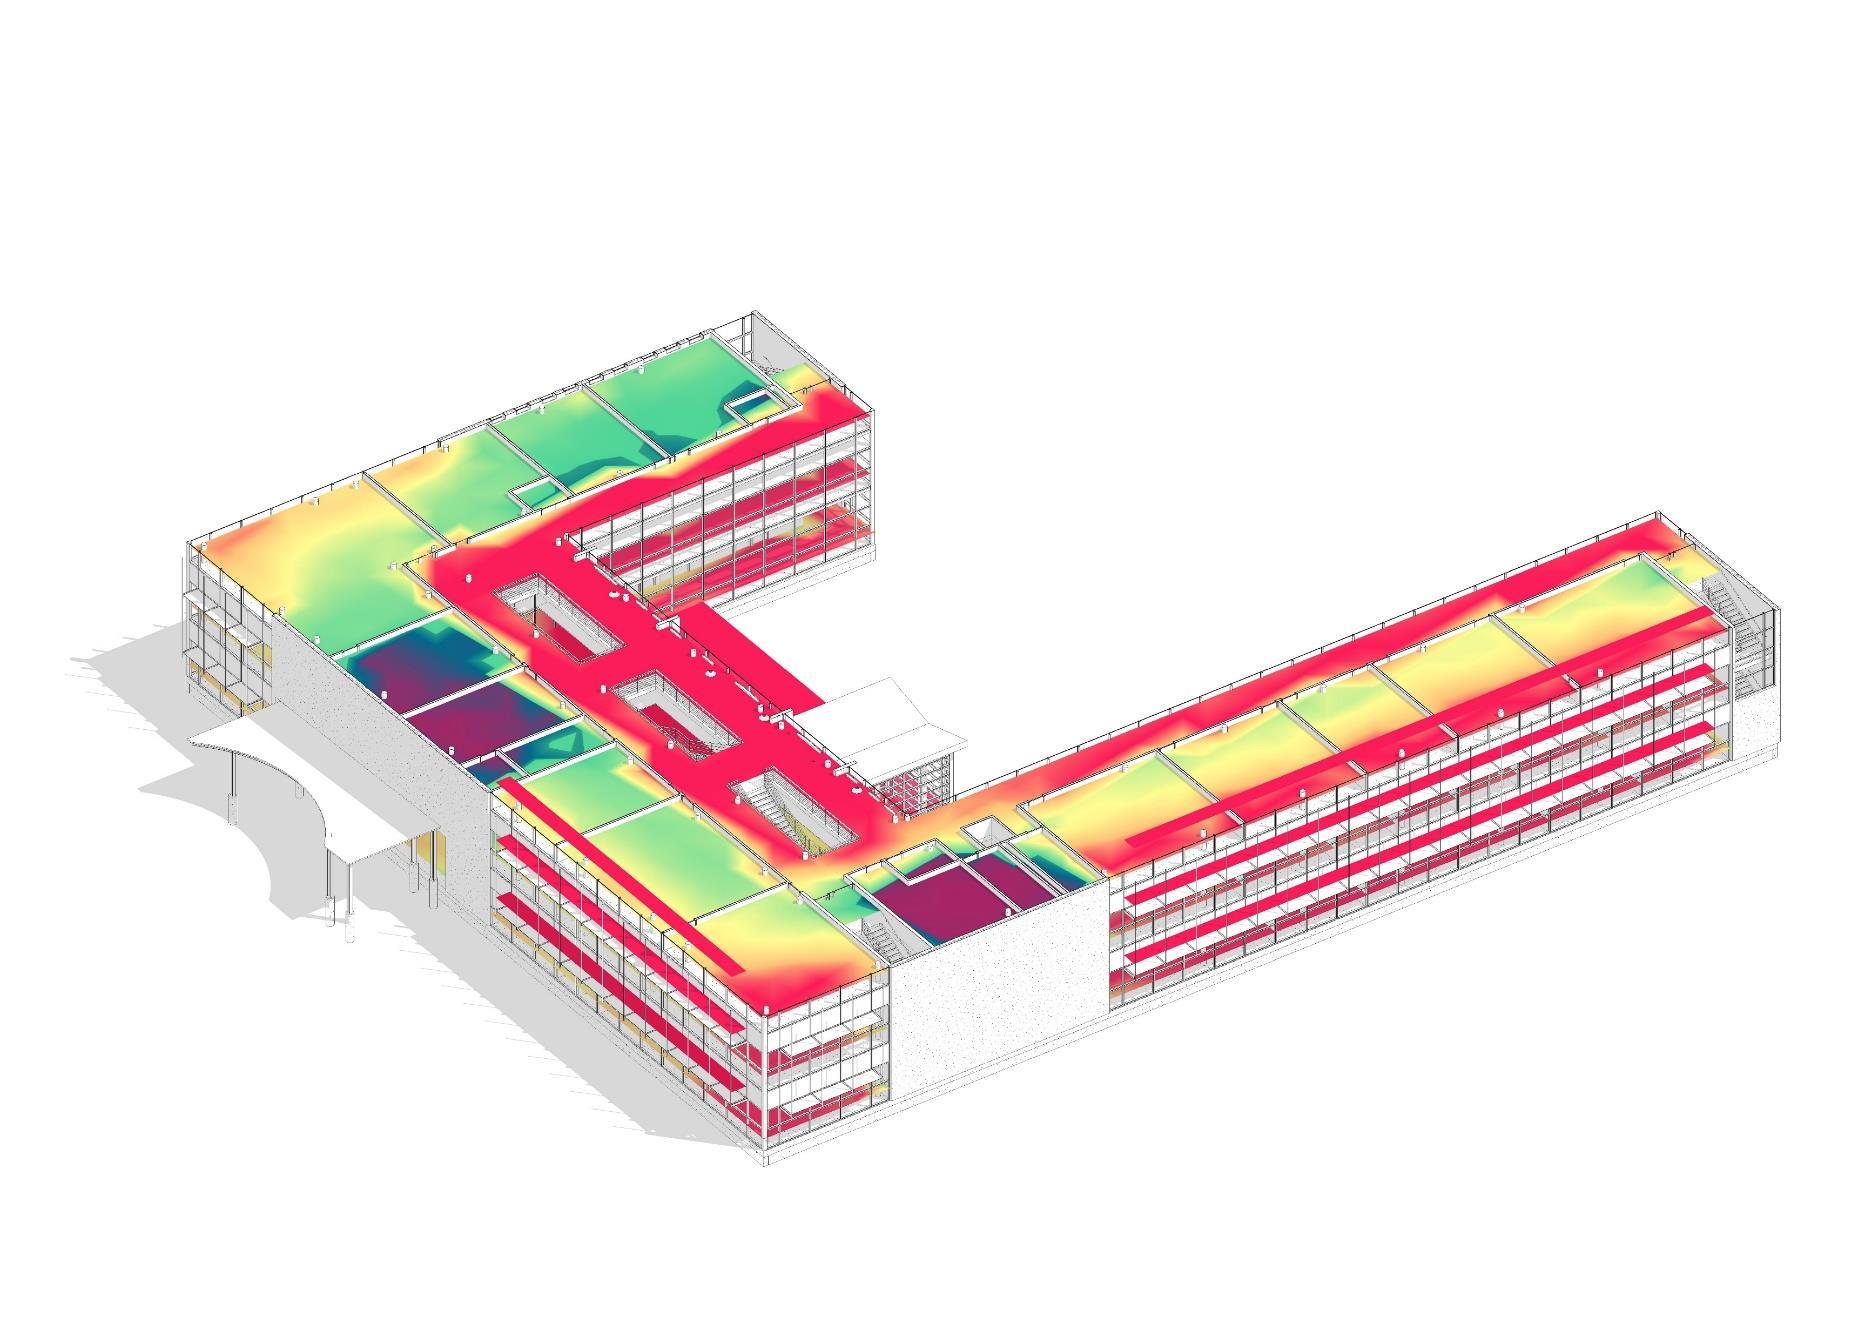
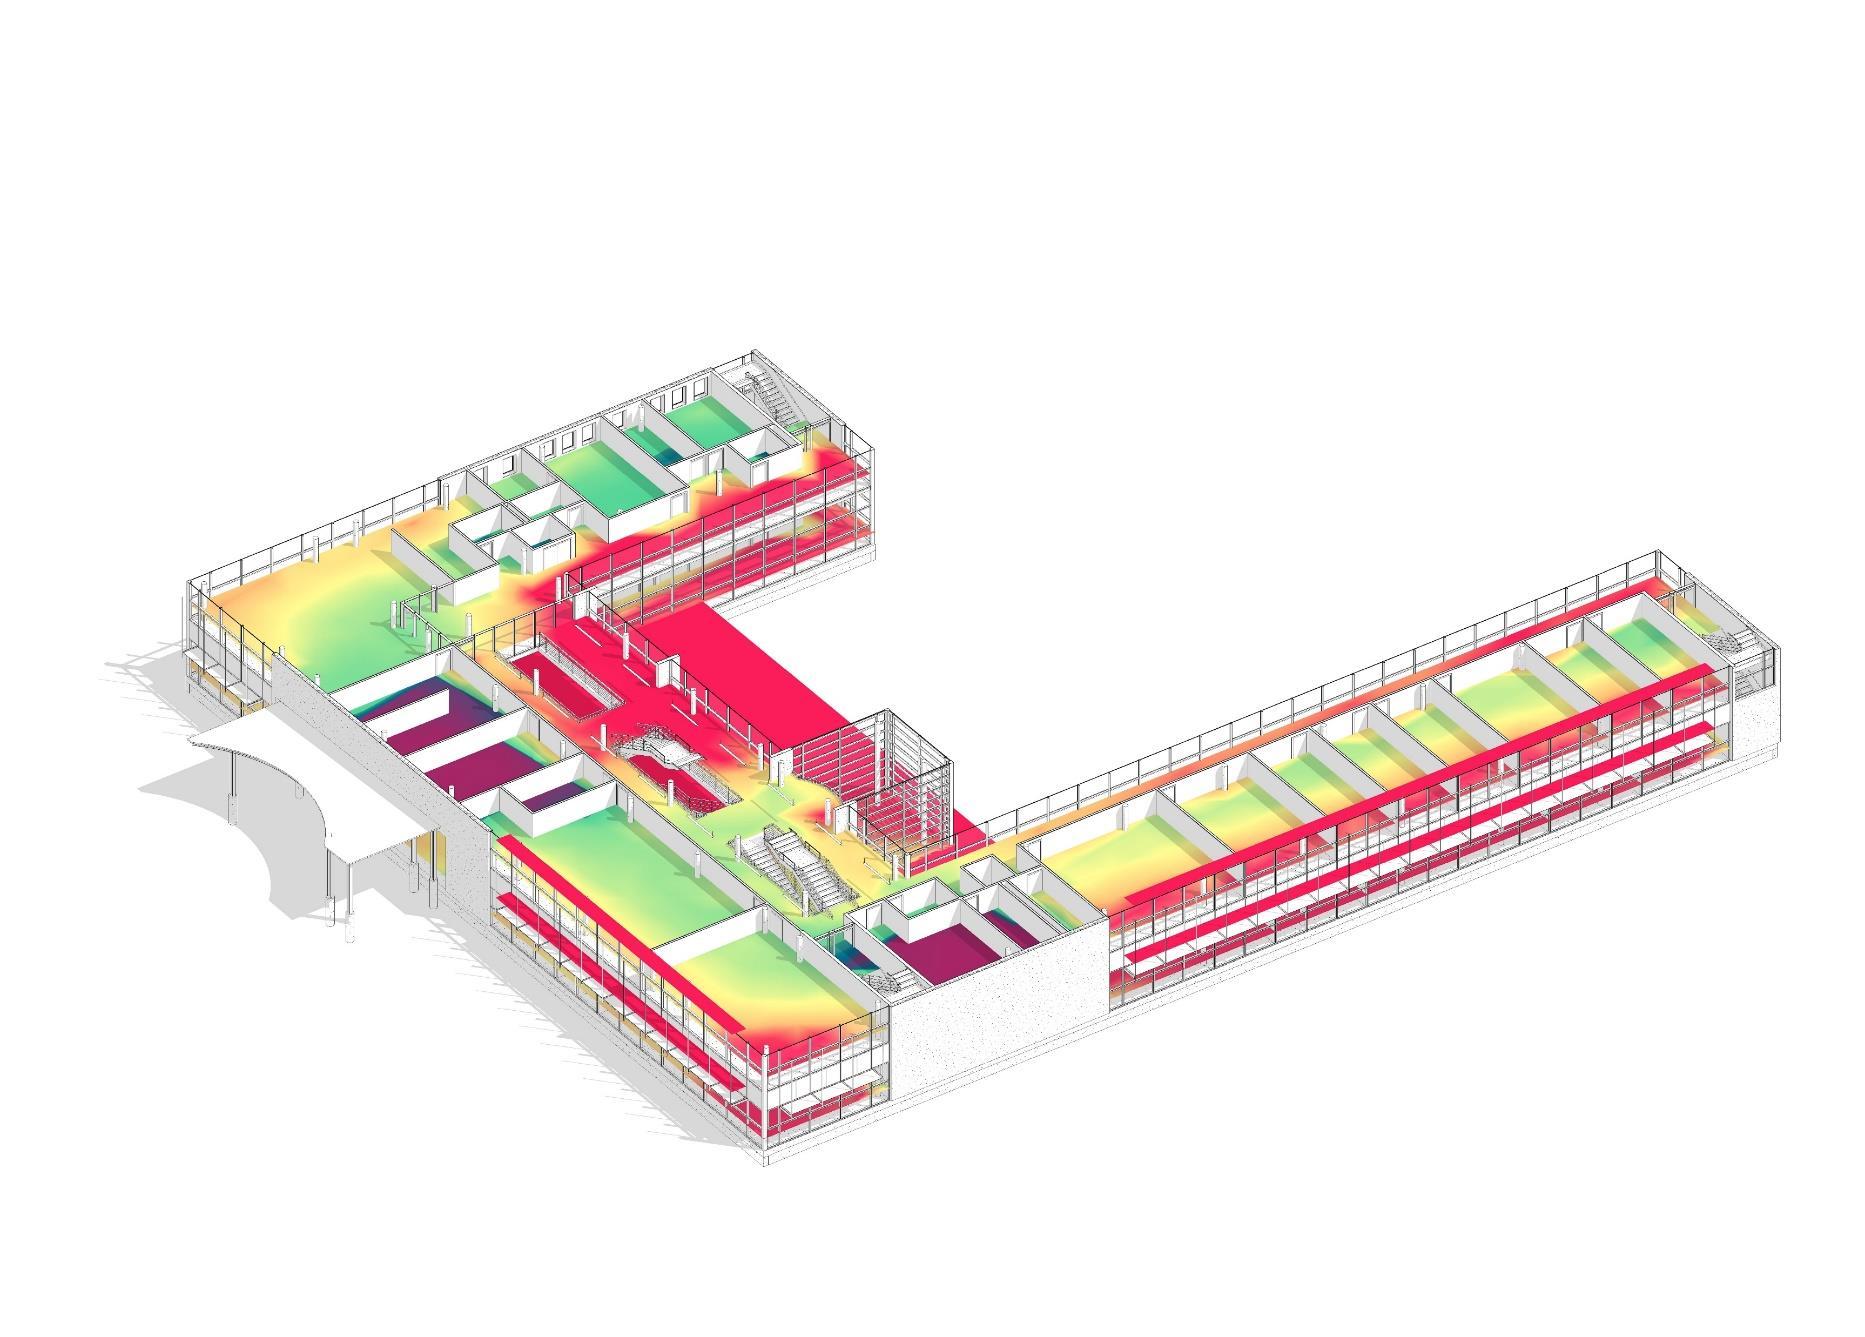
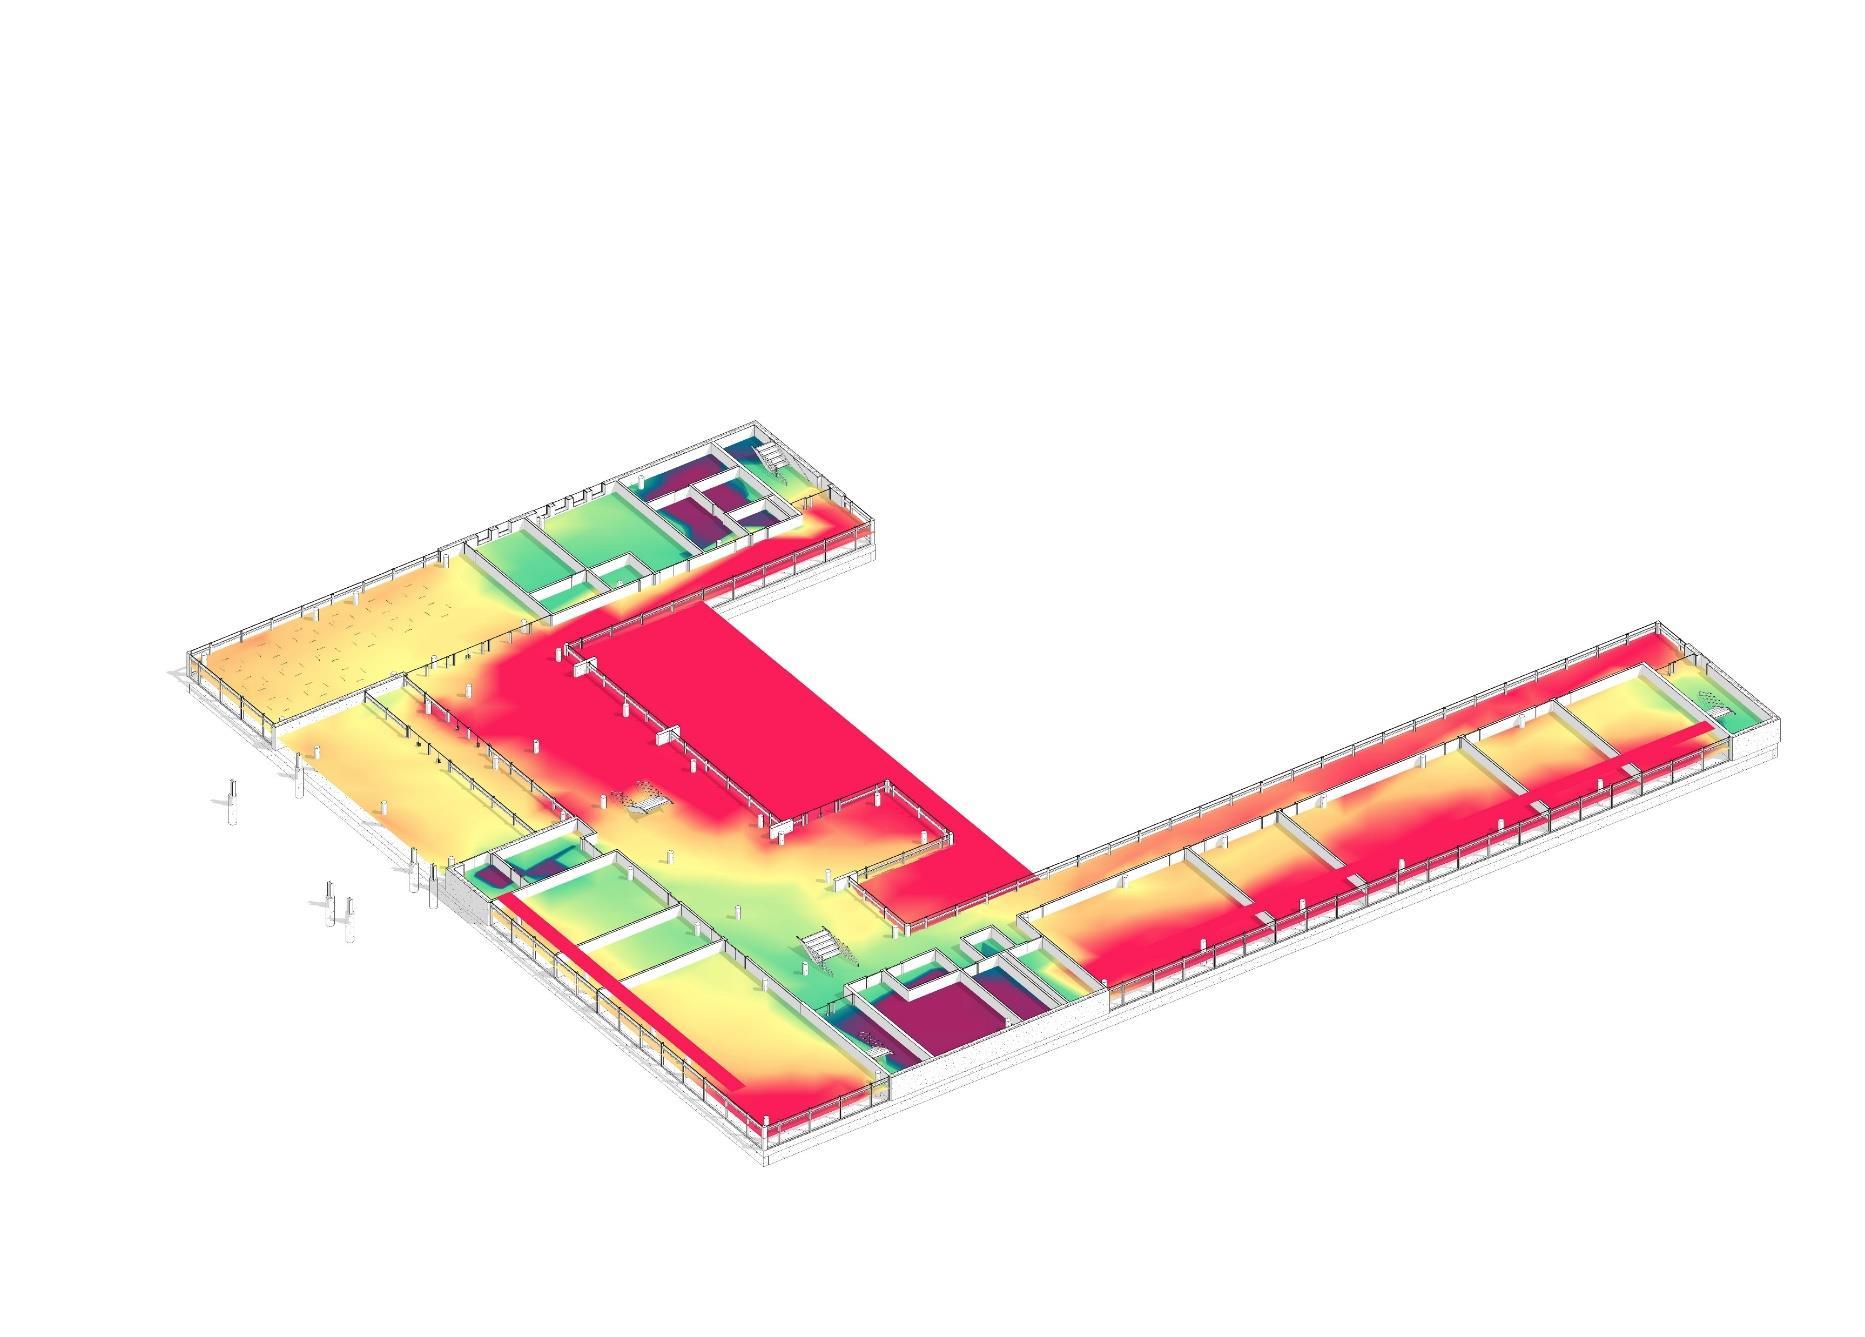
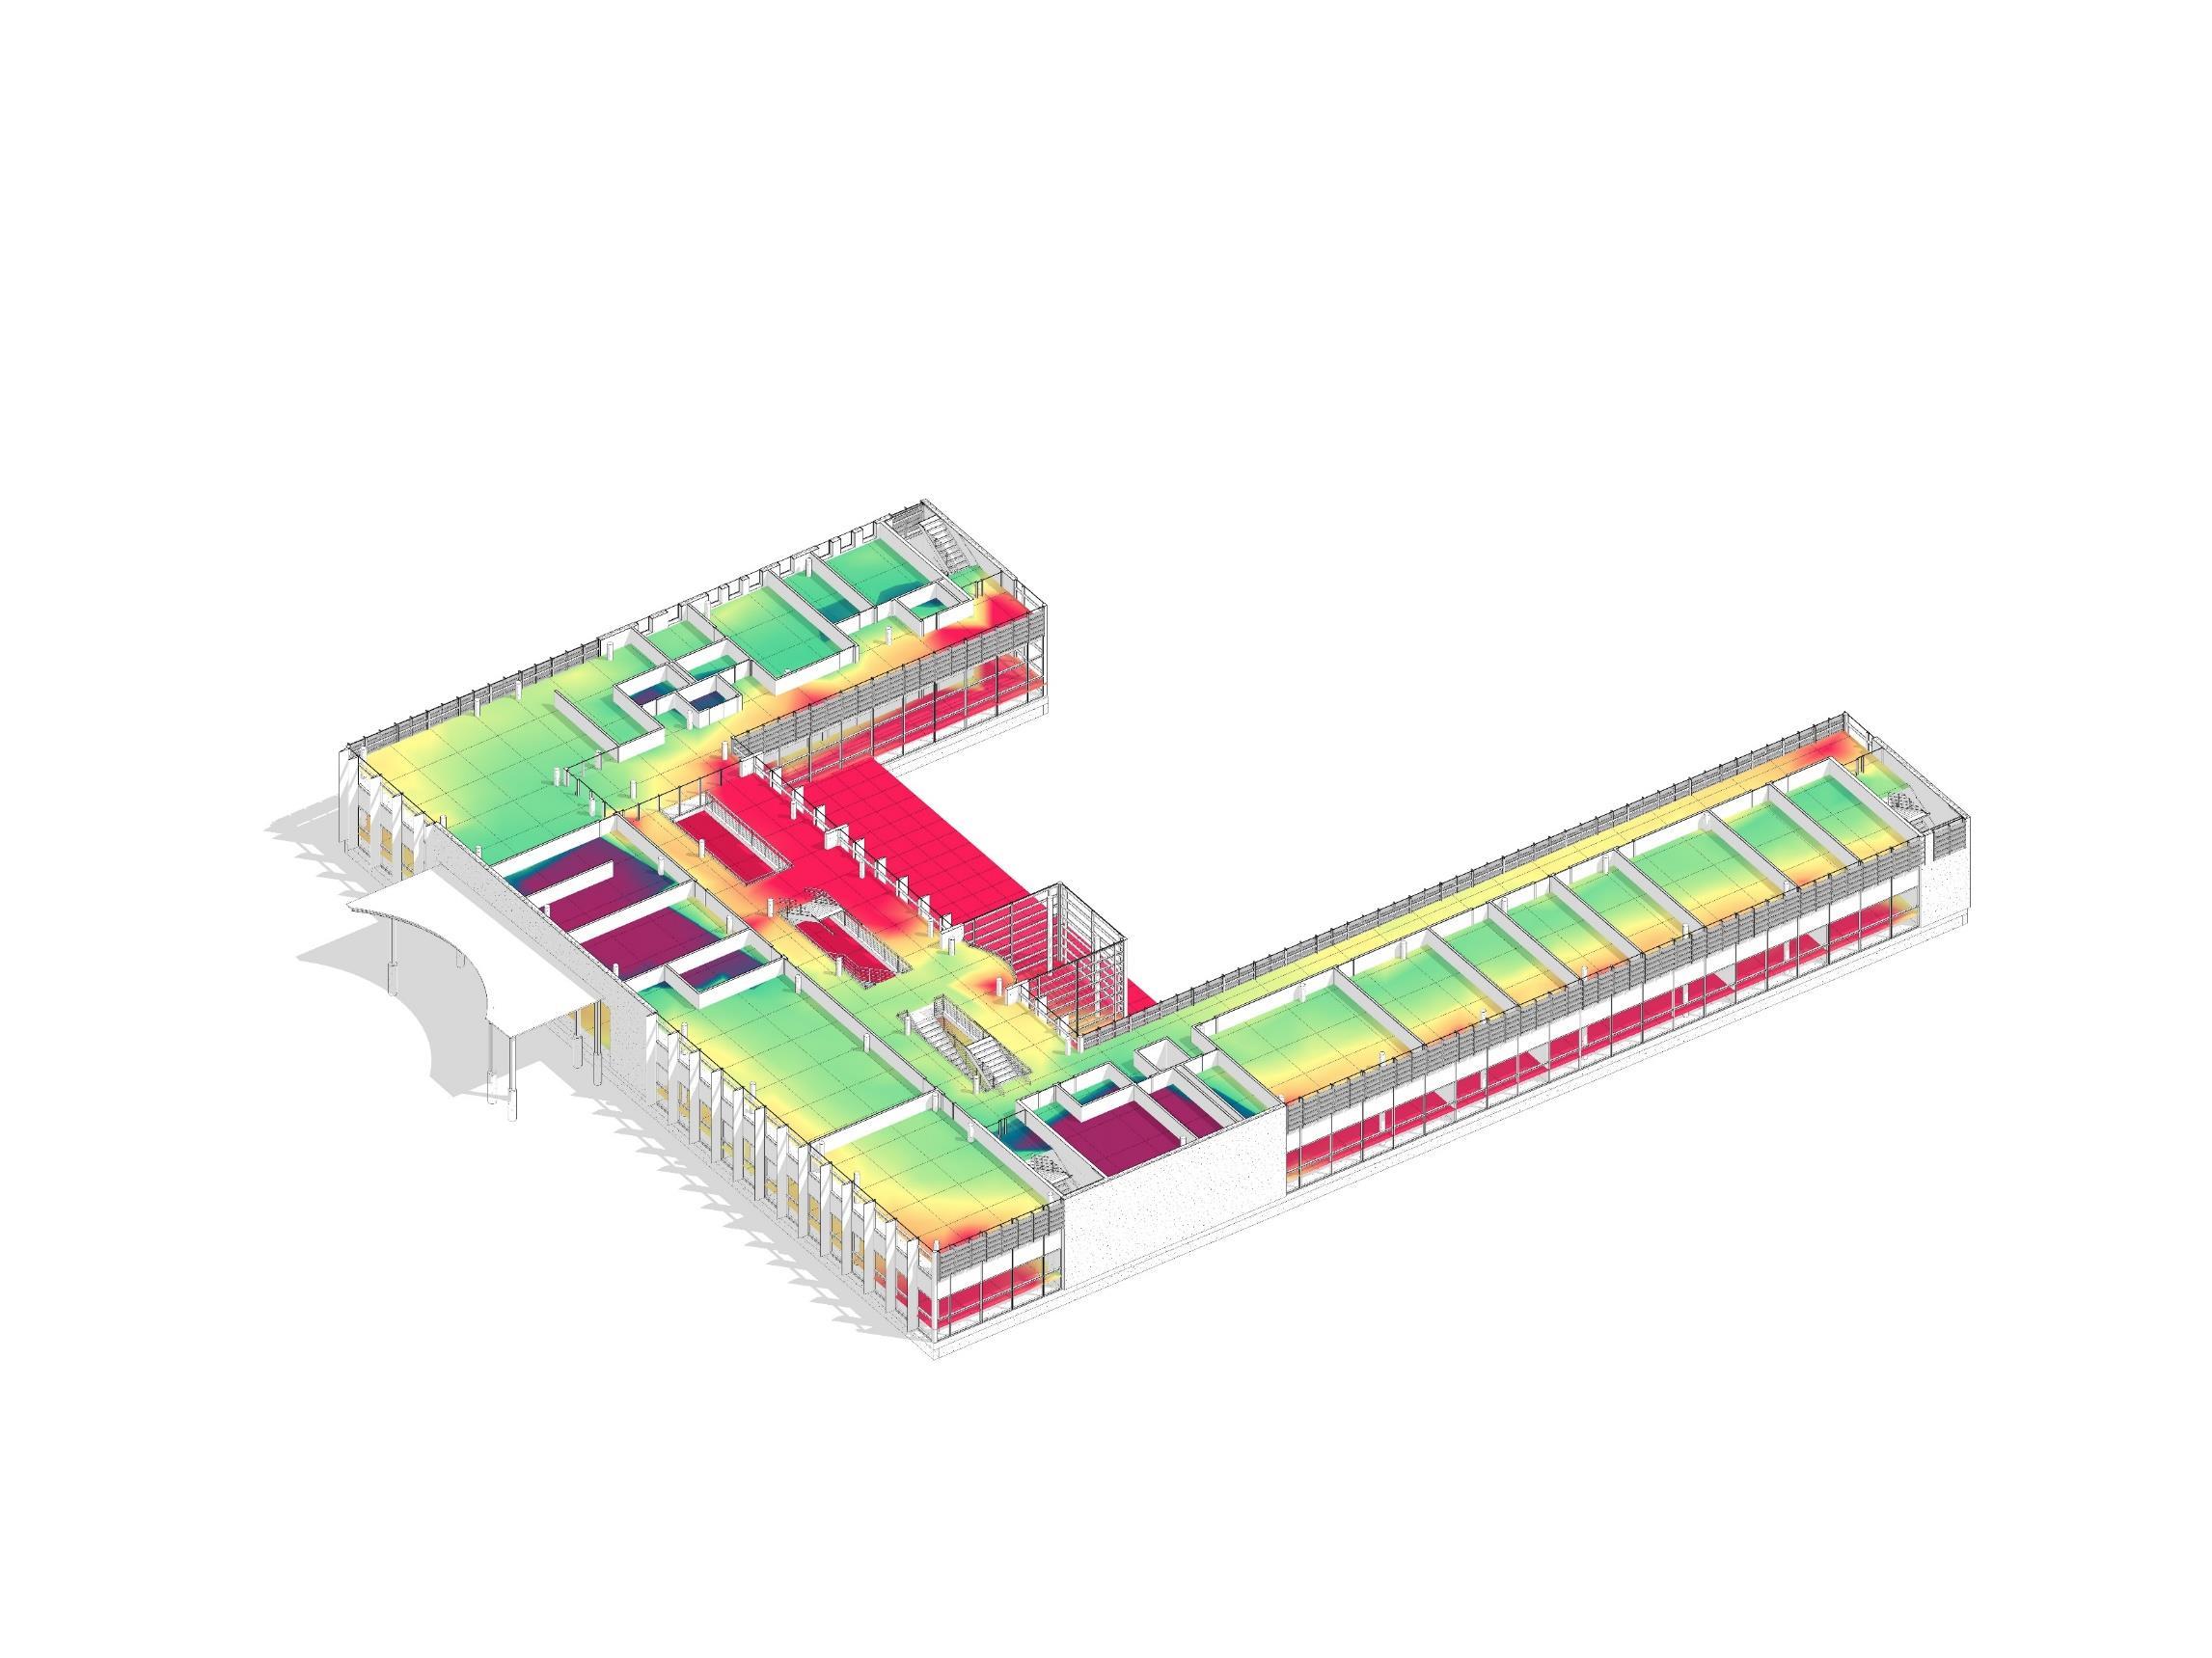
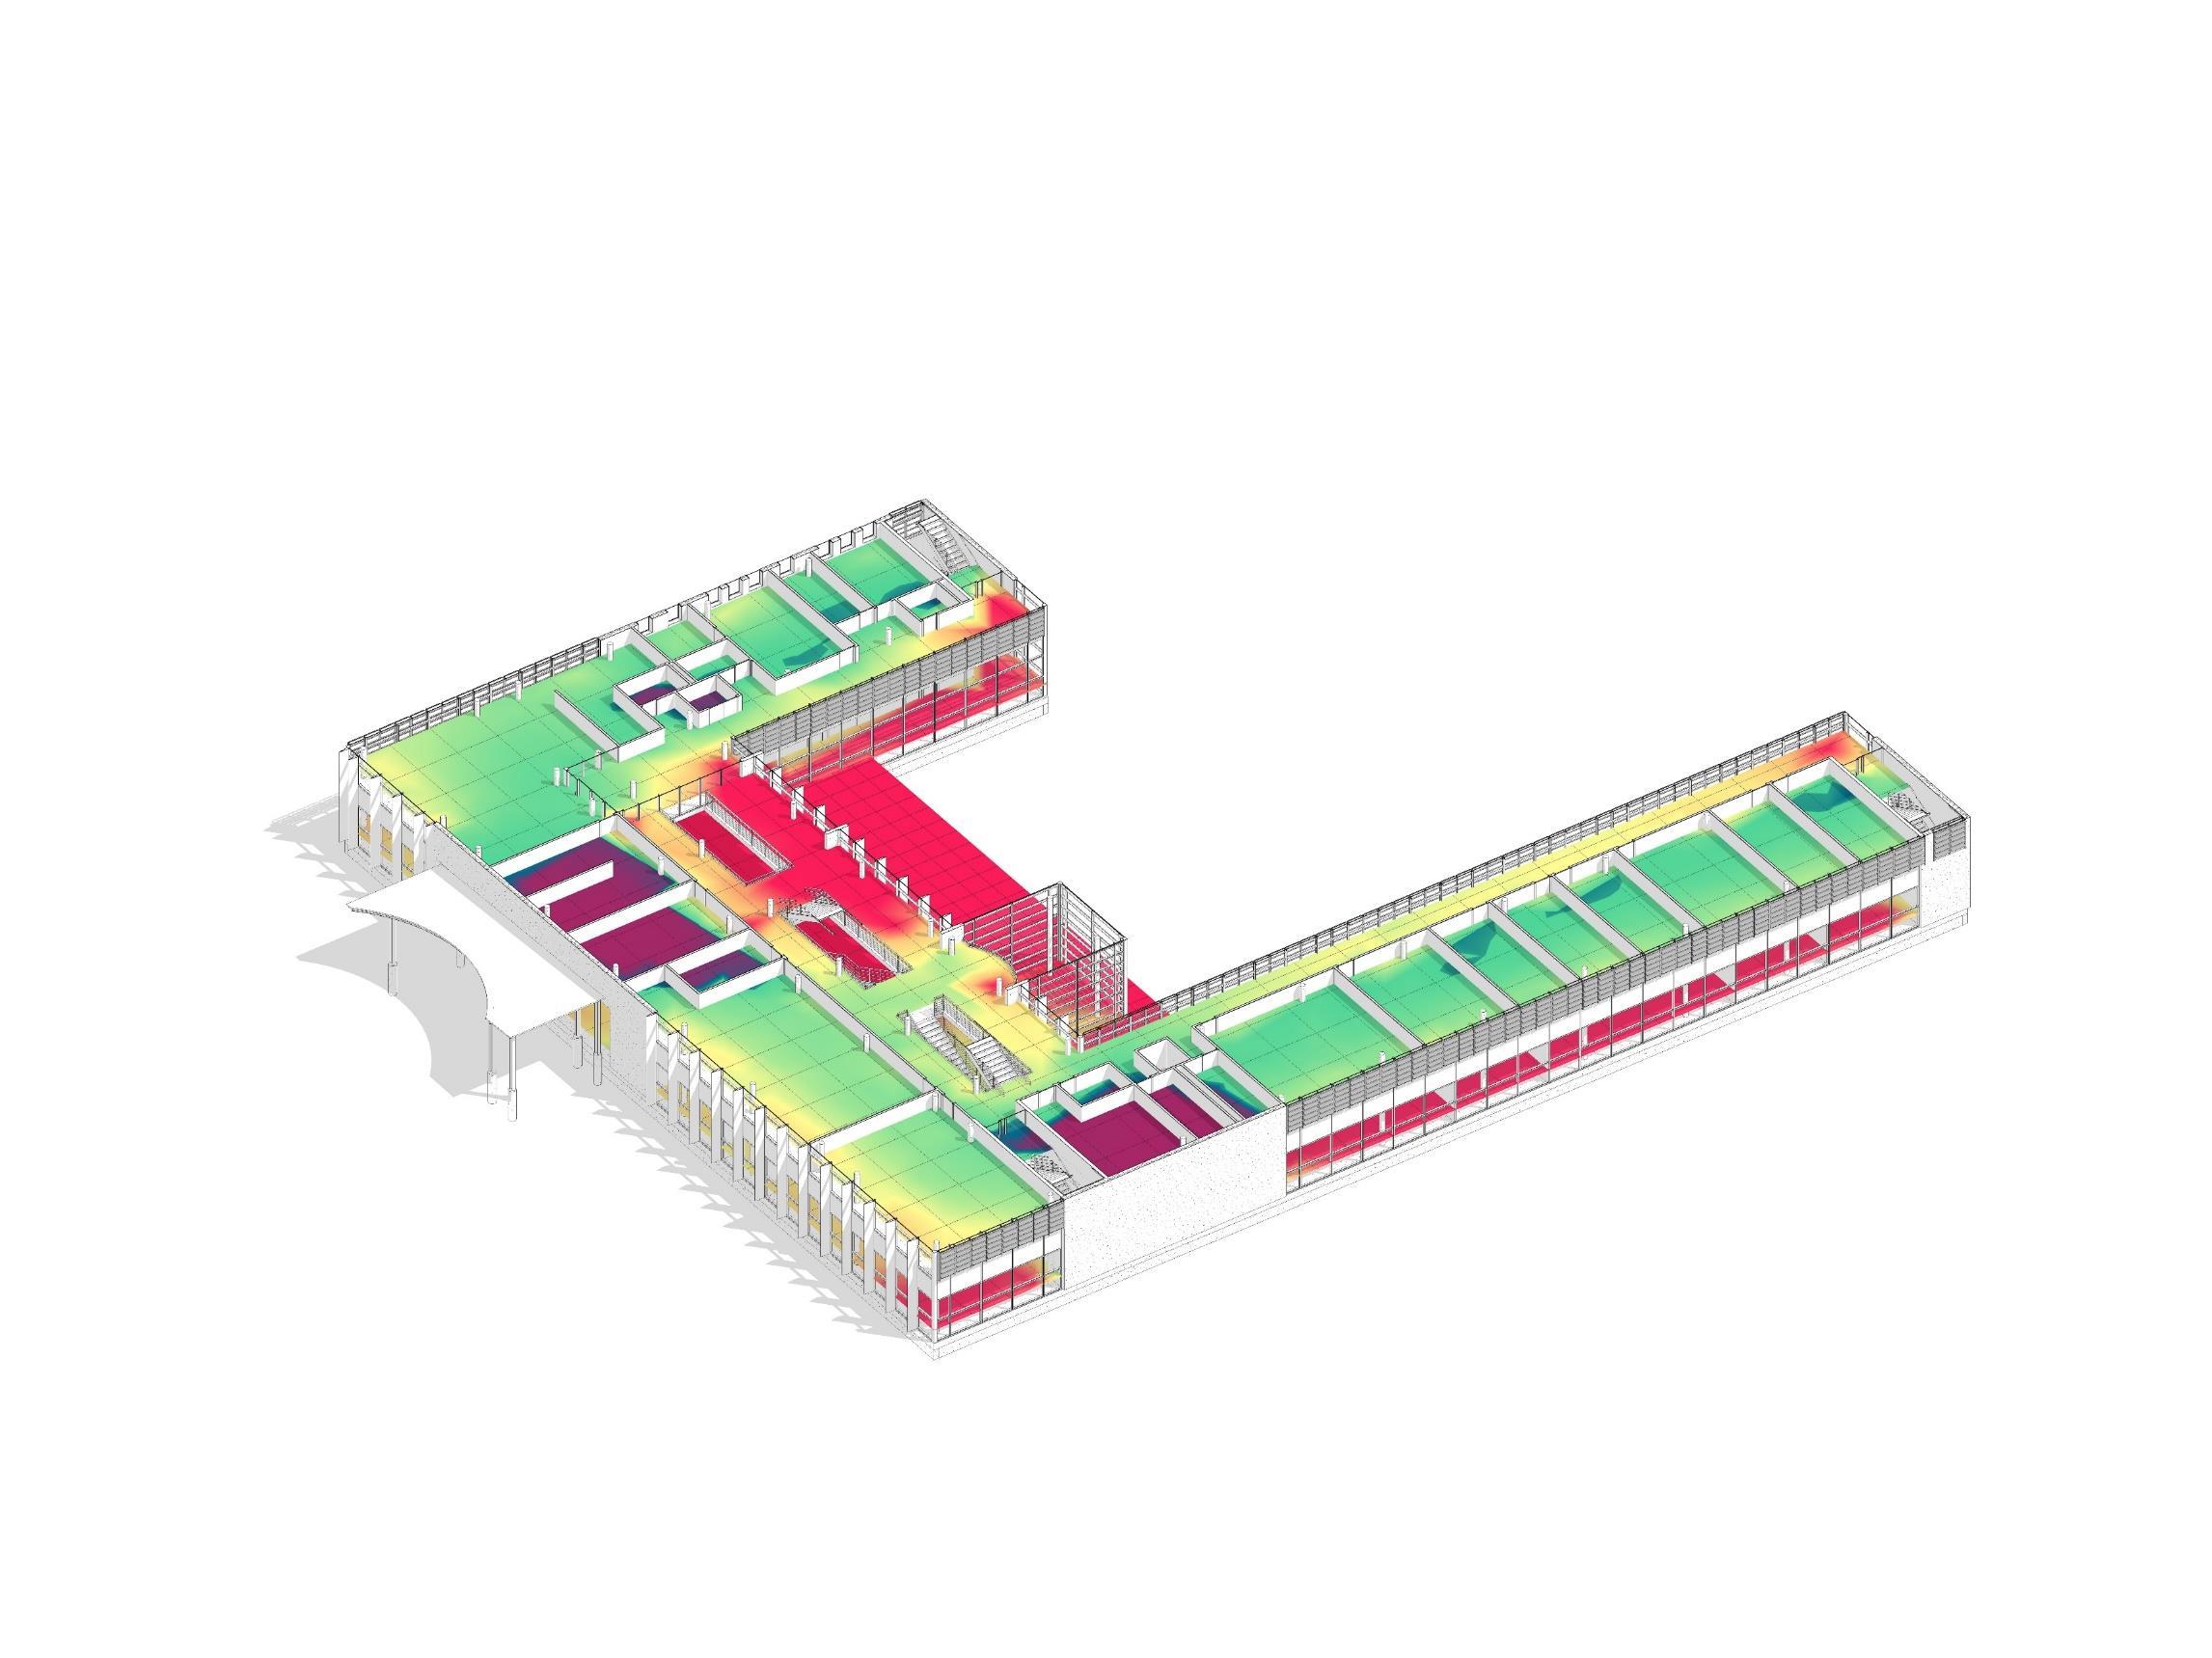
DAYLIGHT ANALYSIS FOR EACH FLOOR
The Typology of the building is to optimize the indoor building performance regarding the user’s functions where it allows natural sunlight to enter the offices labs and corridors without overheating and creating uncomfortable environment
We analyzed the daylight analysis for the indoor spaces using Insight daylight that allowed us to study the performance and identify the critical areas of the of the building.
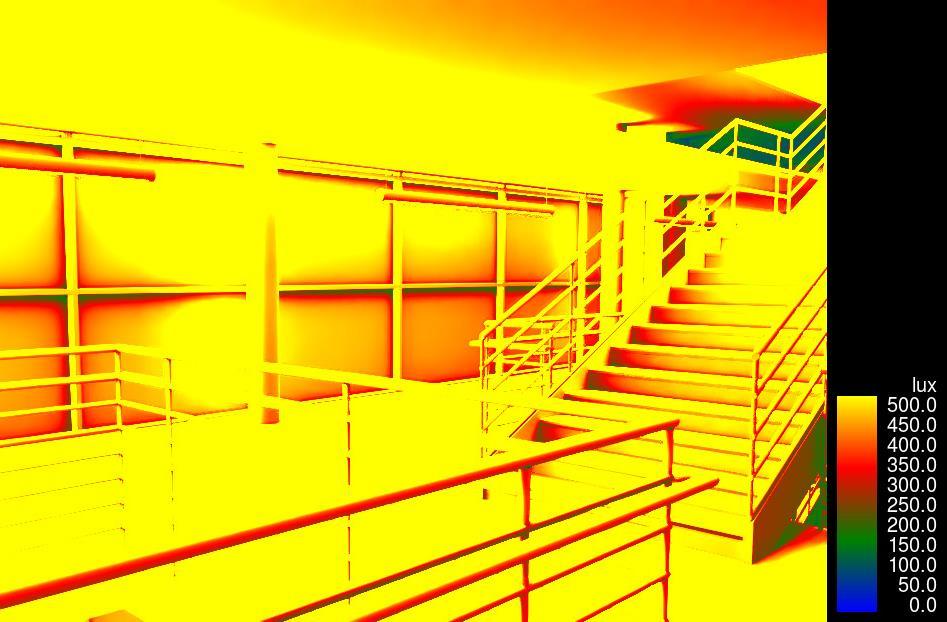
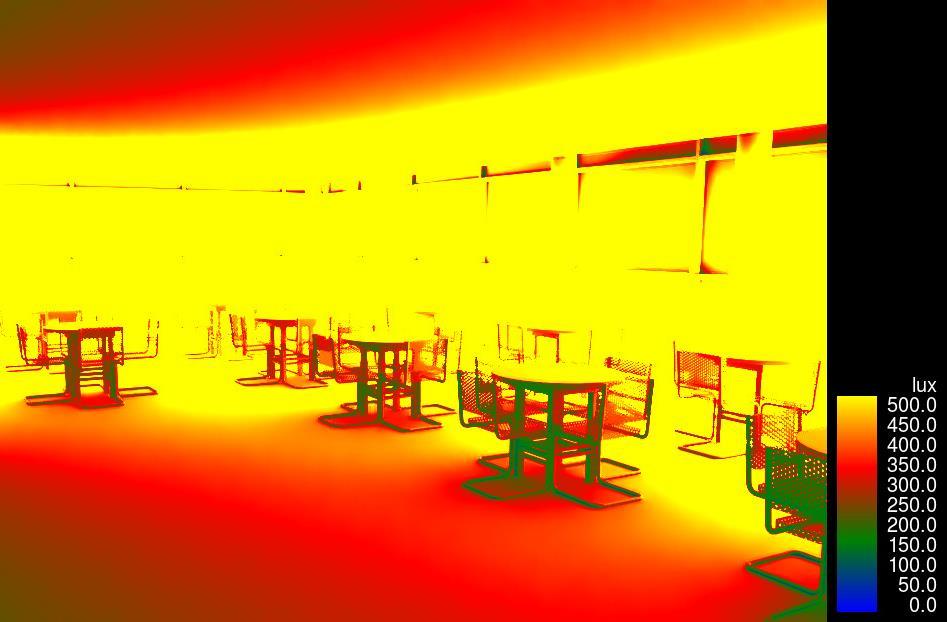
In the Southern façade we notice high Illumination and lower near the end side of the classed room than the required value.
In the Corridors the lux values varies from each area the requires to have artificial and natural lighting.
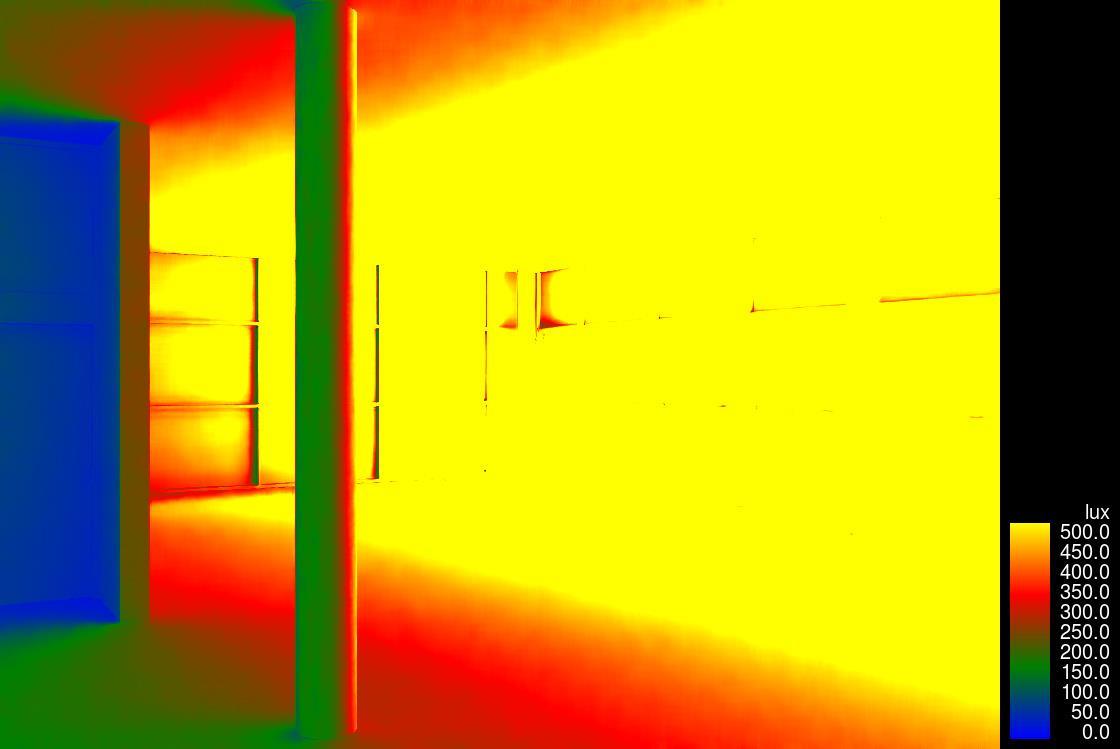
In service rooms where we have low luminosity the is the required to use artificial light to balance the lux needed for the space use.
The study reveals the entrance area where we have unbalance distribution of the illumination, where we have higher at the foyer and low luminosity this required to use artificial light to balance the lux needed for the space use.
In library we have the standard lux values for natural lighting during the day GSA
Daylight analysis Third Floor Daylight analysis Second Floor Daylight analysis First Floor
Cafeteria Area analysis
Corridor's analysis Library area analysis
Area Illumination (lux) Office Space 500 Conference Rooms 300 Internal Corridors 200 Laboratory (Classroom) 750 Services 300
Lighting Standard
DAYLIGHT ANALYSIS
Schematic Design
CALCULATIONS & RADIATION ANALYSIS
SHADING DIMENSION CALCULATIONS
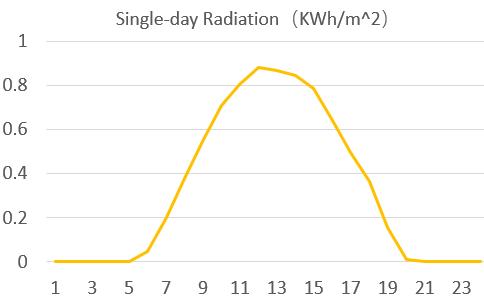
Most Radiative Season
• Lasts for 3.4 months;
• From June 1 to September 13;
• With an average daily high temperature above 25°C;
• The hottest day of the year is July 26, with an average high of 30°C and low of 19°C.
Calculation Summary and Result
Inputs
By applying three main data: EPW File, Context:, Façade and Shading Configuration
Standard Calculations
By using standard calculations, the horizontal shading depth can be found
The Following shows the shading’s calculations set by the standards during the summer season.
Knowing that the latitude corresponding to the study case, the site in Milan latitude.
The value is ��=45.46° �������������� =sin 1[(cos��)cos(2345)cos 0 + sin(��)sin(2345)]=6799° �������������� =sin 1[(cos��)cos( 2345)cos 0 + sin(��)sin( 2345)]=2109°
The length P of the horizontal shading can then be found with the following formula:
�� = ��+��
Tan(αSummer) = 0.323
W : Height of the glass, considering the section between louvers (��=0.6 ����)
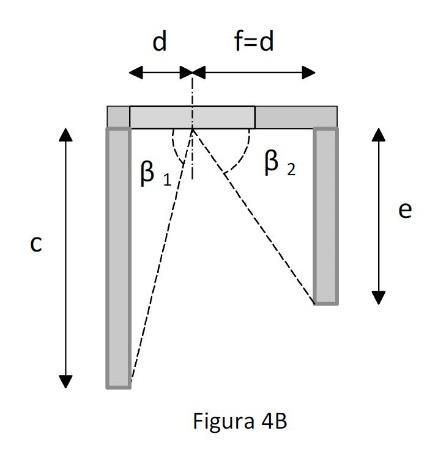
O : Distance between the window and the shading device (��=0.2 ����)
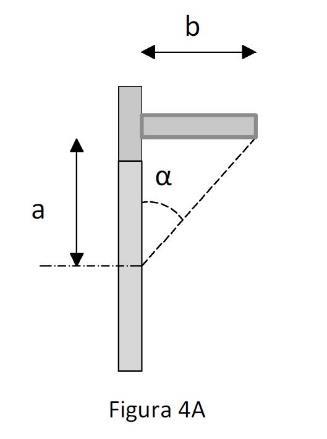
Effectiveness
Calculating the Ɛ effectiveness, to solve the reduction of the transmitted heat due to the presence of the shading system Where Ɛ effectiveness should be <030
We see the shading device performance coefficient in the critical season (summer) is lower than 0 3 which corresponds to the Italian code constrains Therefore, the effectiveness of the designed shading device is verified.
Least Radiative Season
• Lasts for 3.2 months;
• From November 19 to February 25;
• With an average daily high temperature below 10°C;
• The coldest day of the year is January 12, with an average low of -1°C and high of 6°C.
Month ���� (��=28.29°) June 0.680 July 0.670 August 0.710 September 0.784 Average 0.711 For the South façade: ���� �� ��=����,��,�� min ���� �� ��; ���� �� �� = 0711 Month ���� (��=32.86°) June 0.915 July 0.890 August 0.913 September 0.850 Average 0.892 For the East and West façade: ����,��,��=���� �� �� min ���� �� ��; ����,��,�� = 0892 South Facade Ɛs = 0.048 East Facade Ɛe = 0.051 West Facade Ɛw = 0.051
Schematic Design
Context Radiation Analysis
SHADING
SHADING FEATURES
SHADING FEATURES
SHADING FEATURES
SHADING FEATURES
Installation
SOLUTION
OFFERS
SOLUTION CONCEPTS
ACTUAL SECTION ACTUAL STRATIGRAPHY SOLUTION OFFERS GLASS AND Shading not verified
None
None
None
None
None
None
1.Bad Thermal transmittance of glass Glass
2. Lack
Installation option
Wind Stability
Louver blade Angle
Properties None Ease of Cleaning
Light Control None Energy Efficiency
Rainwater control
Glass Features
not Verified
of Shading Shading not verified Glass Features
Vertical
Fixed
OO
OO
Installation option
Wind Stability Unaffected by wind Louver blade Angle
Properties Sun shading Ease of Cleaning
Light Control Partial control Energy Efficiency OO Rainwater control
Glass Features
Installation option Horizontal Wind Stability Unaffected by wind Louver blade Angle Fixed Properties Sun shading, heat protection Ease of Cleaning O Light Control Full control Energy Efficiency OOOO Rainwater control O Glass Features
1.Good Thermal transmittance of glass Glass Verified 2. Partial
1.Good Thermal transmittance of glass Glass Verified 2Poor
Shading
verified 1.Good Thermal
2. Good
Detailed Design
option Horizontal Wind Stability Unaffected by wind Louver blade Angle Fixed Properties Sun shading, heat protection Ease of Cleaning OOO Light Control Full control Energy Efficiency OOOO Rainwater control OOO
light control Shading not verified
rainwater control
not
transmittance of glass Glass Verified
properties and rainwater control Shading verified
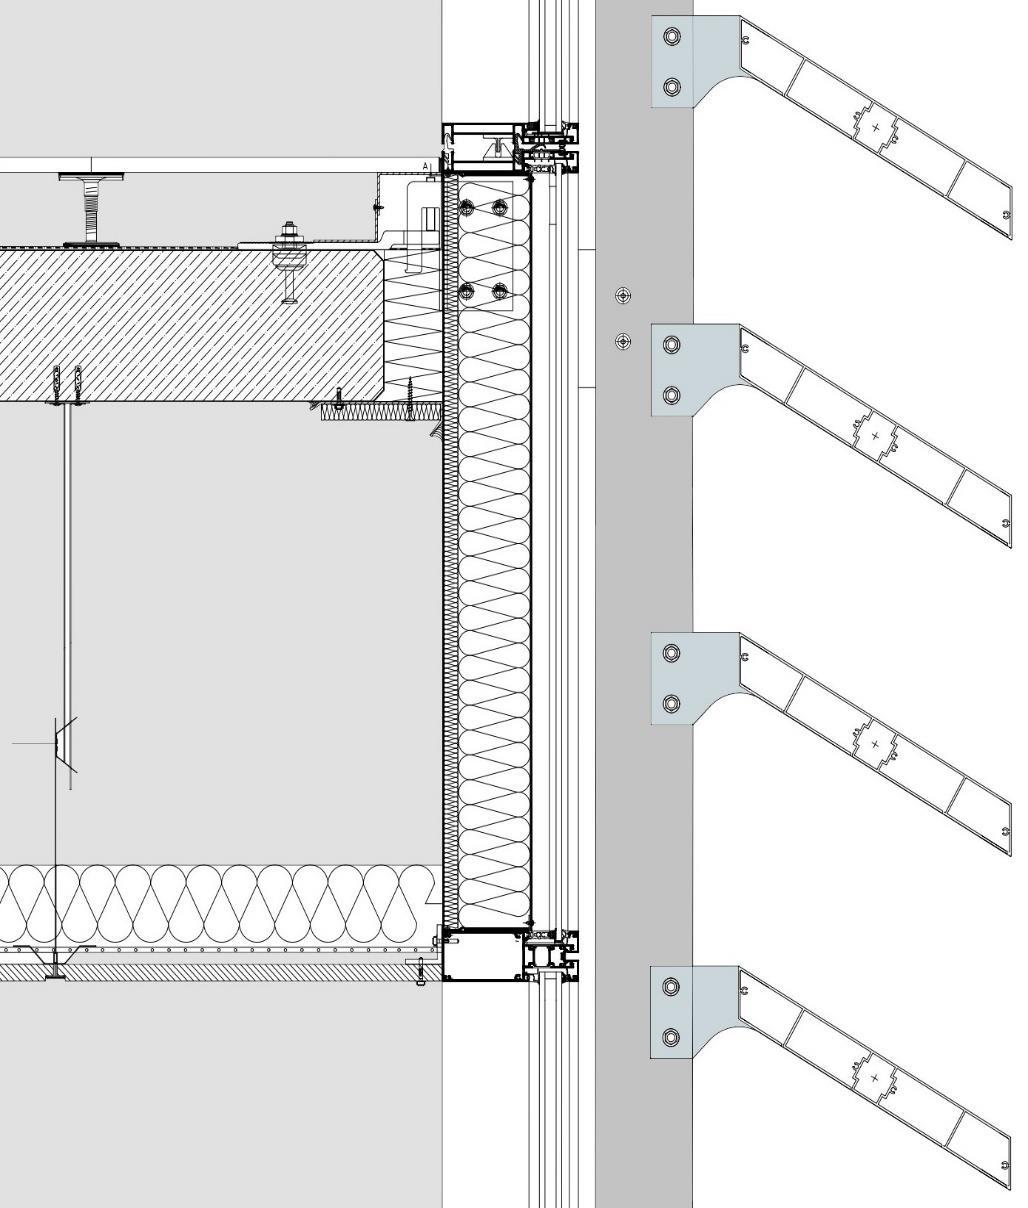
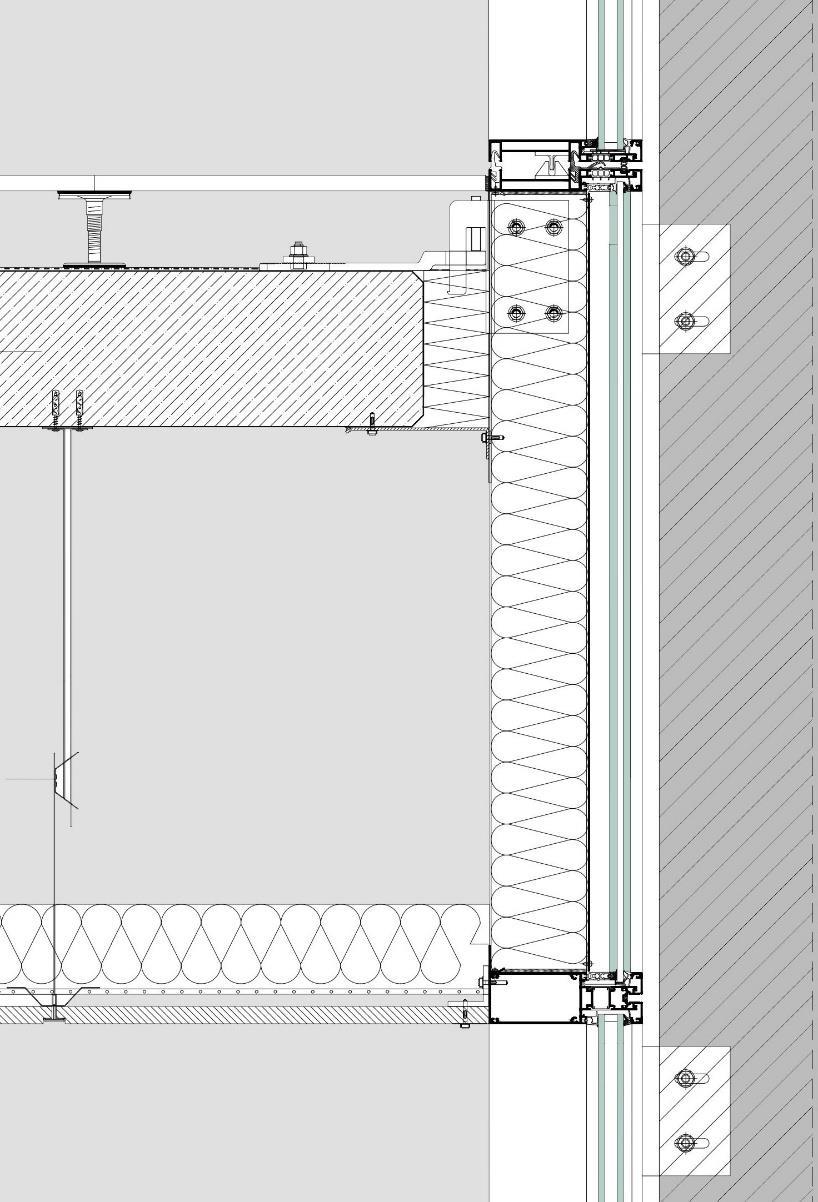
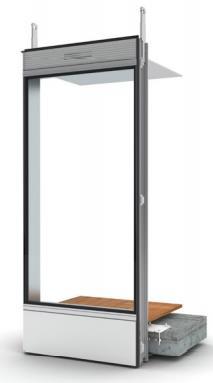
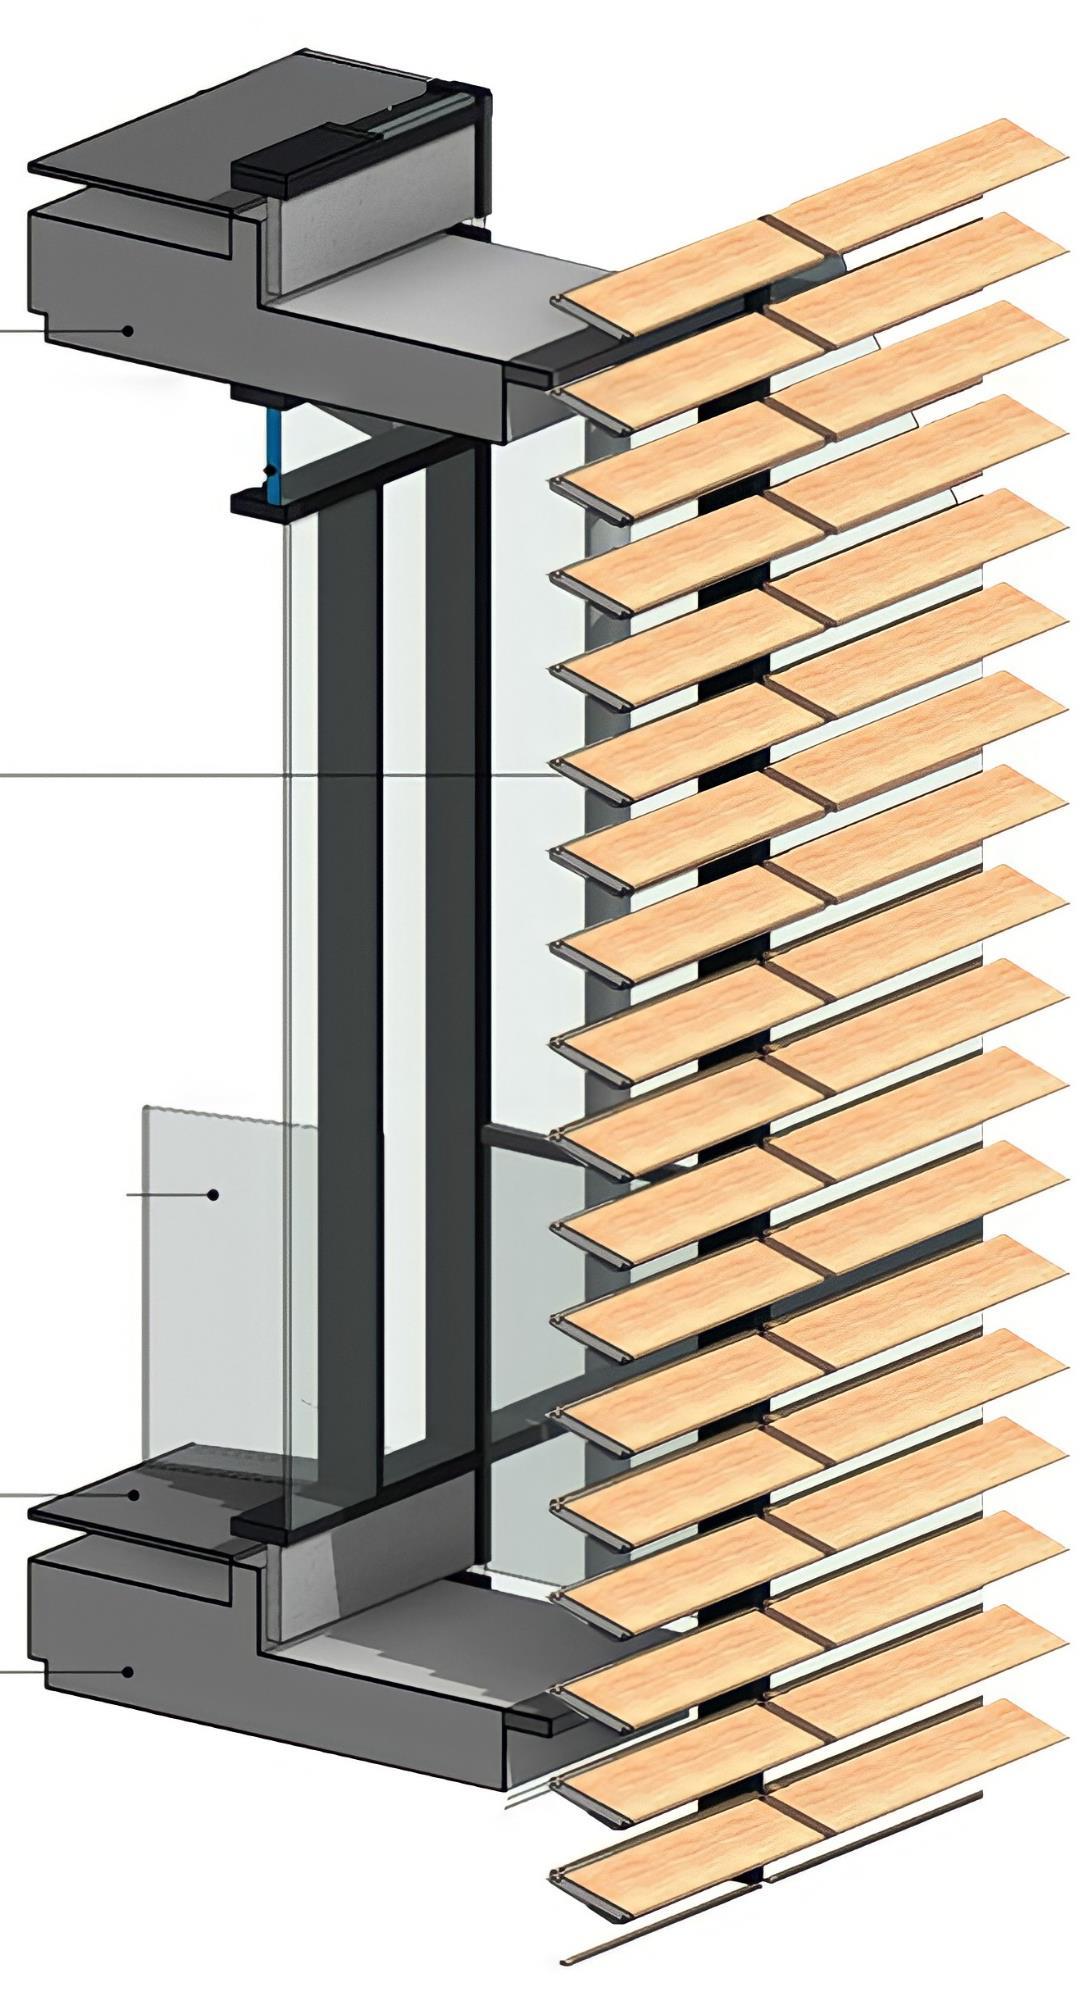
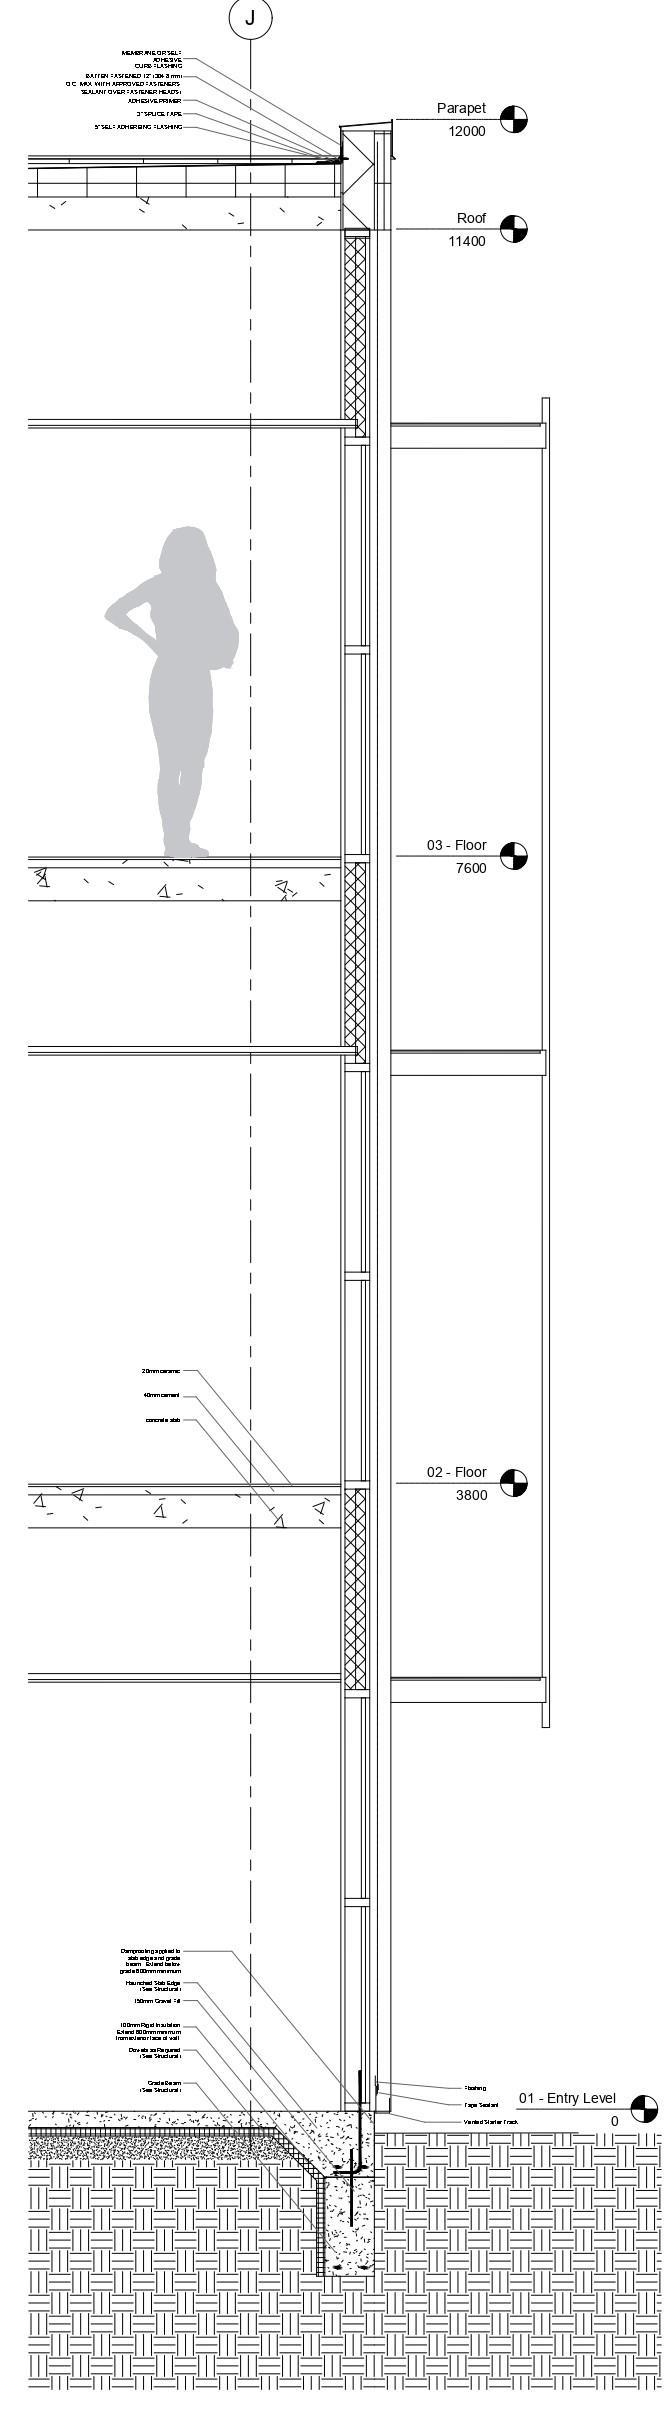
CURTAIN WALL DETAIL (SHADING – HORIZONTAL)
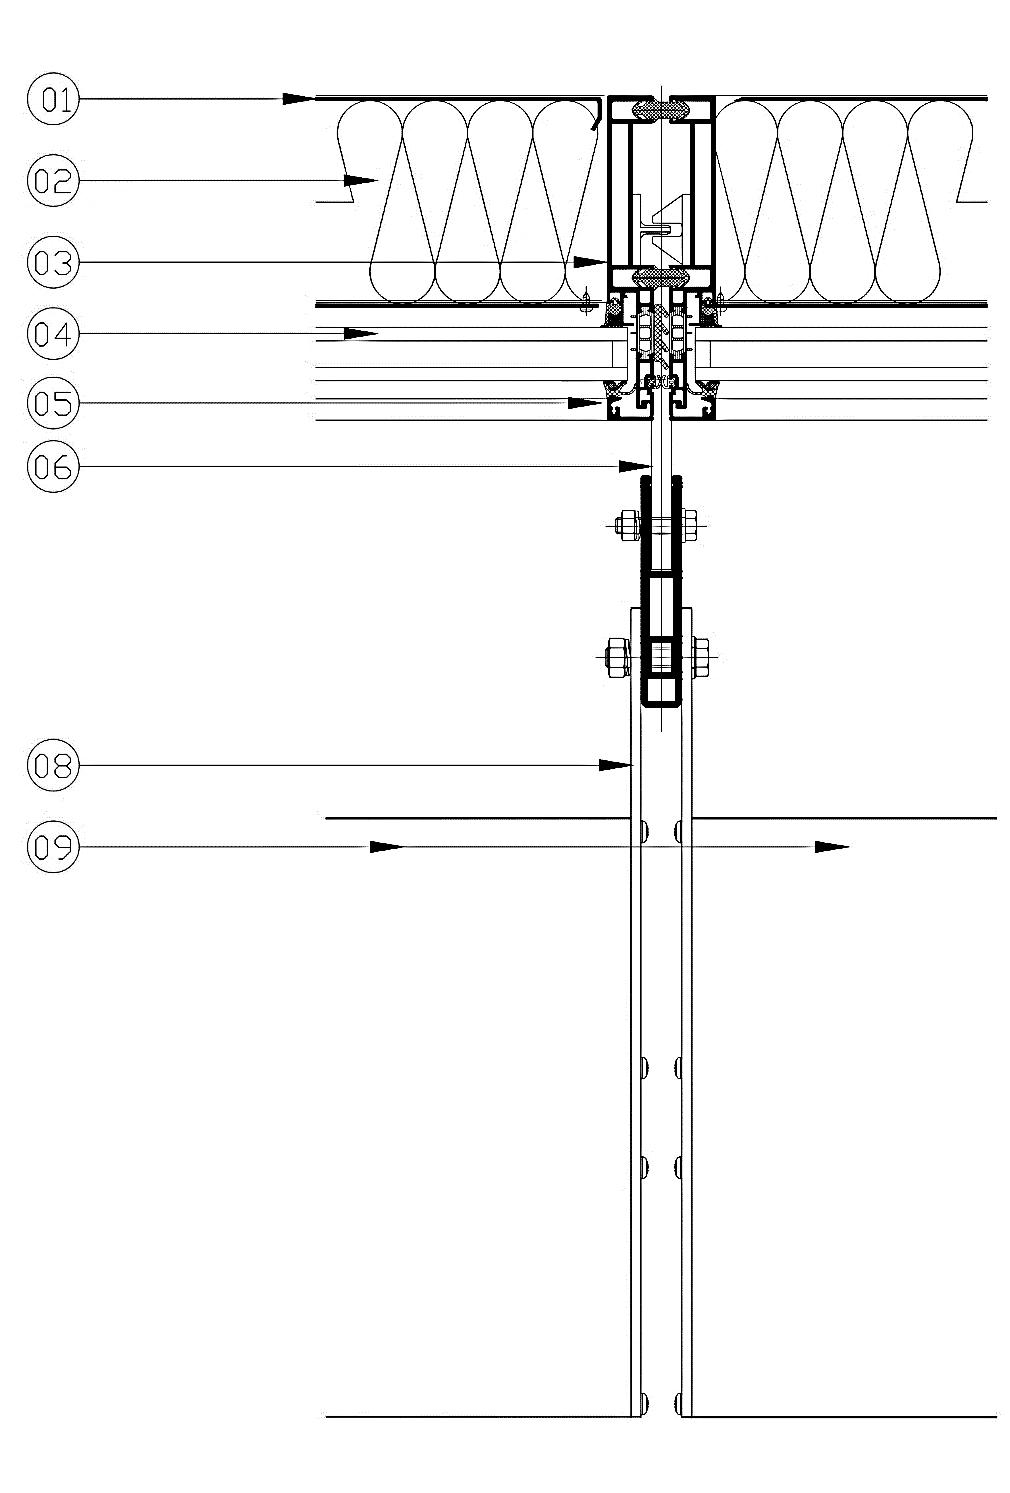
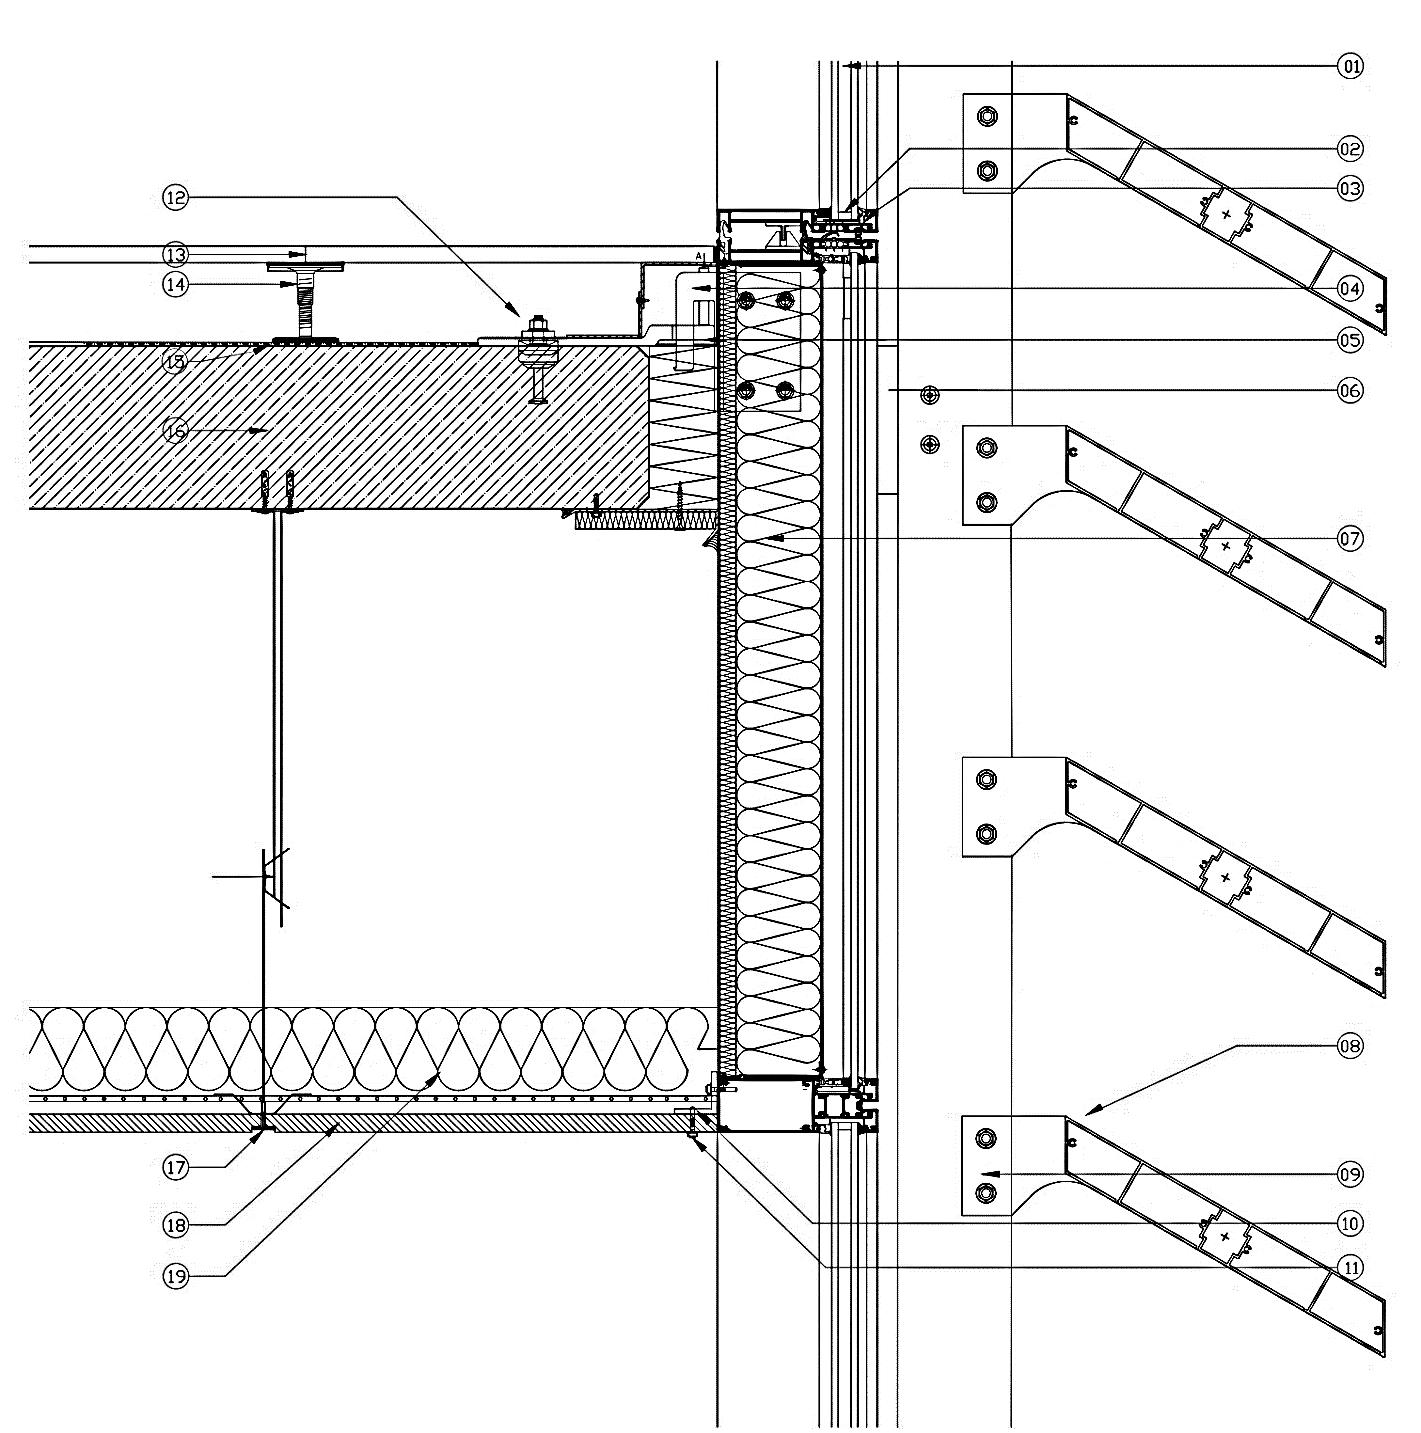
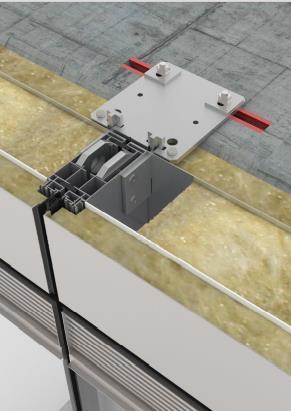
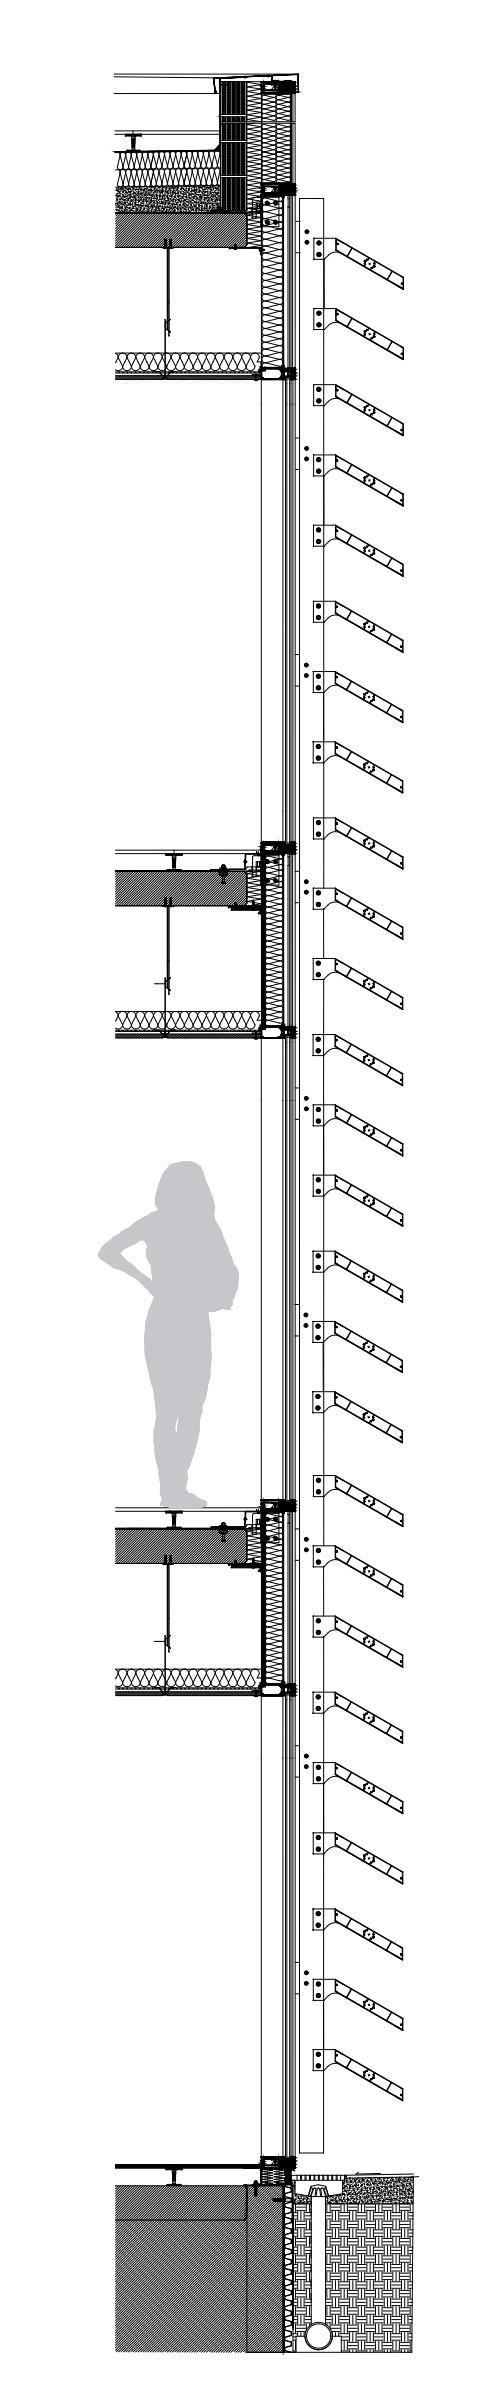
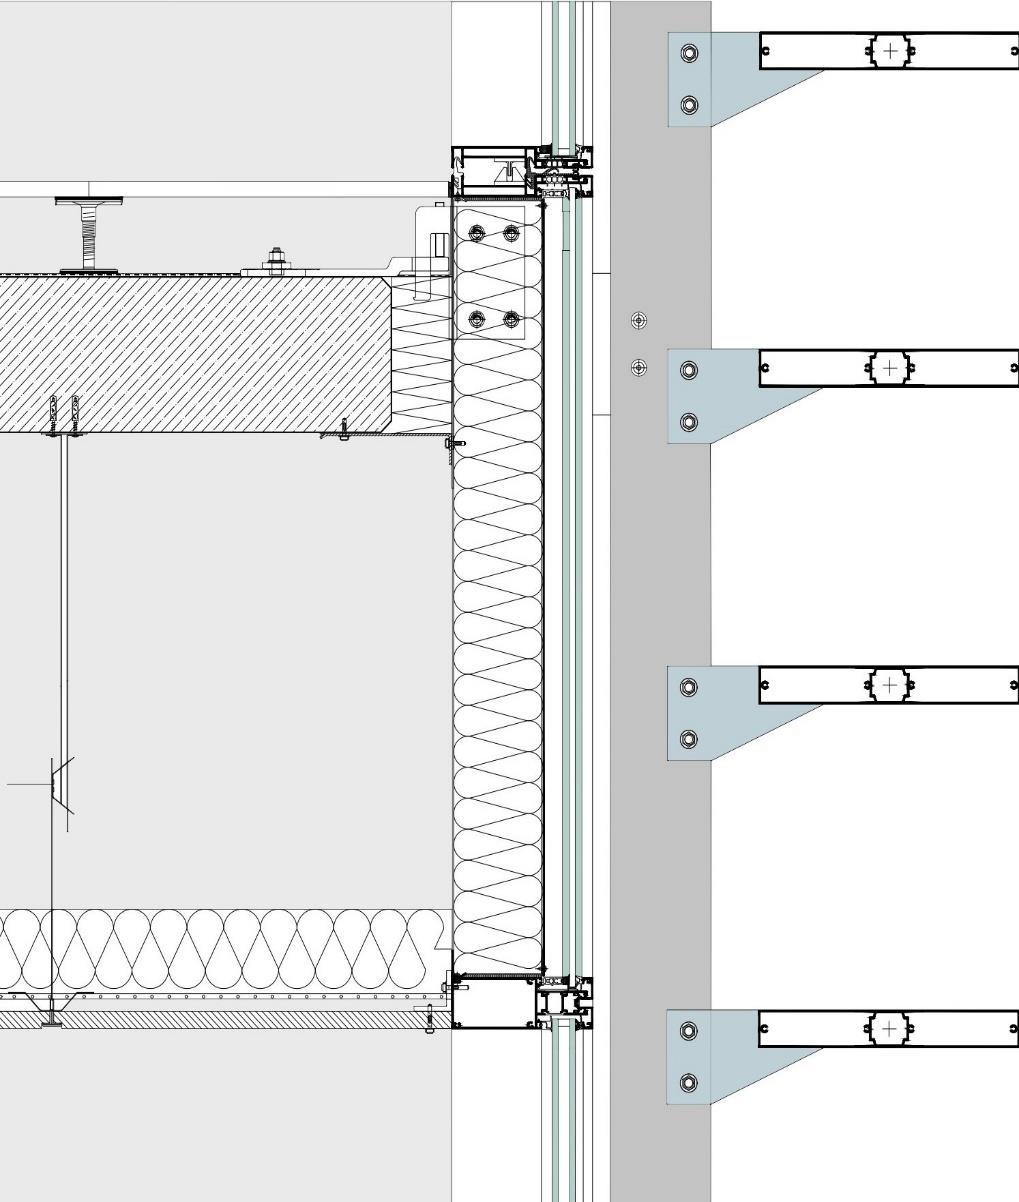
DETAIL SHADING - VERTICAL SOLUTION DETAILS DETAILS OF CHOOSEN SOLUTIONS SECTION WITH OUR SOLUTION SOLUTION STRATIGRAPHY MORE DETAILS ABOUT OUR SOLUTION SOLUTION STRATIGRAPHY (TECHNICAL Glass Features SHADING FEATURES Installation option Vertical Wind Stability Unaffected by wind Louver blade Angle Fixed Properties Sun shading, heat protection Ease of Cleaning OOO Light Control Full control Energy Efficiency OOOO Rainwater control OOO Cunclusion The overall thermal performance of the glazing unit is increased by 50% and the shading controls southern sun light and does the heat protection GLASS verified SHading verified Materials Function Dimension Relevant Properties Ref. Description 01 Double Glazed Unit Glazing 800/ 935/ 1800 8+15+12.76 U= W/mk 02 Glazing spacer - Aluminum profile filled with silica gel (Desiccant) Bulk and surrounded with Butyl Rubber Glazing Assembly 850/10/1503 EPDM Glazing gasketnonstructural Sealing - λ = 0.25 W/mK 04 Aluminum bracket Curtain wall structural fixing 100/17005 Hot rolled Anchoring ChannelHot dip galvanized stee Curtain wall structural fixing 290/24506 Bracket of the louvers bolted to the steel plate Connection07 Mineral wool insulation Insulation 850/100/120 = 0.037 W/mK 08 Aluminum extruded profile for the shading Shading09 Aluminum structure of the louvers that connects the profile for the shading to the structure Connection10 shape metal sheet Finishing -/50/611 Hex screw Fixing 20 Ø 512 Bolt - galvanized steel Curtain wall structural fixing 99 x 4913 Floating floor - High density fibers and a core of high density wood particles with thermolaminated top finishing Finishing 500 1000 20 = 0.14 W/mK 14 Galvanized steel pedestal Pavement support 100 / 95/-15 Special adhesive to bond metallic pedestals on concrete Fixing16 Slab (concrete) Structure - -/200 λ = 0.35 W/mK 17 Ceiling batten - bouncy acoustic connection - high tensile zinc + aluminum finishing profile Ceiling support -/75/818 Plasterboard Finishing 60/60/20 λ = 0.2 W/mK 19 Mineral wool Acoustic insulation - - 100 λ = 0.04 W/mK
–
Materials Function Dimension Relevan t Properti es Ref. Description 01 External metal sheetgalvanized steel Finishing 850/100/2 = 60 W/mK 02 Mineral wool insulation Insulation 850/100/120 = 0.037 W/mK 03 Mullion of the USC_65_F curtain wall system, with profile reinforcement inside Framing04 Double Glazed Unit Glazing 800/ 935/ 1800 8+15+12.76 U= W/mk 05 Pressure plate of the curtain wall cut in the middle to allow the steel plate passing trough Fixing06 Bracket of the louvers bolted to the steel plate Connection07 EPDM Glazing gasketnonstructural Sealing - λ = 0.25 W/mK 08 Aluminum extruded profile for the shading Shading09 Aluminum structure of the louvers that connects the profile for the shading to the structure Connection-
Detailed Design
CURTAIN WALL
CURTAIN WALL DETAIL (SHADING
VERTICAL)
HOW
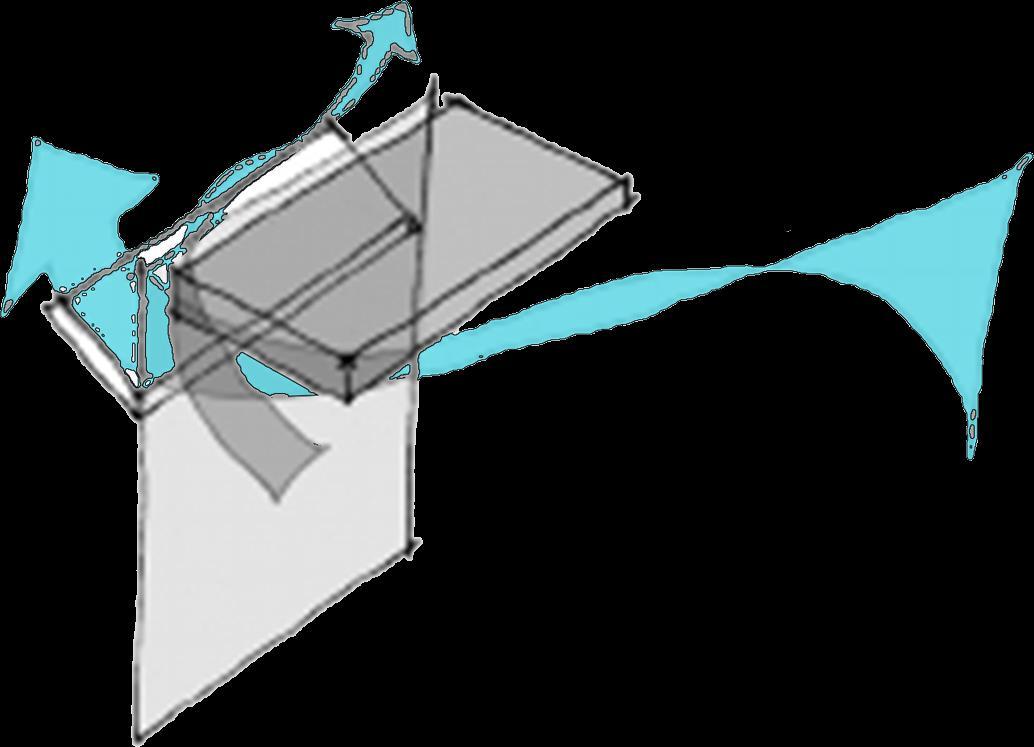
Concept
Shading decision is related to solar analysis After analysis the solar angles of Milano in winter and summer peak periods, it is clearly seen that there is a great difference between these angles In order to face with this kind of annual solar angle, Overhang
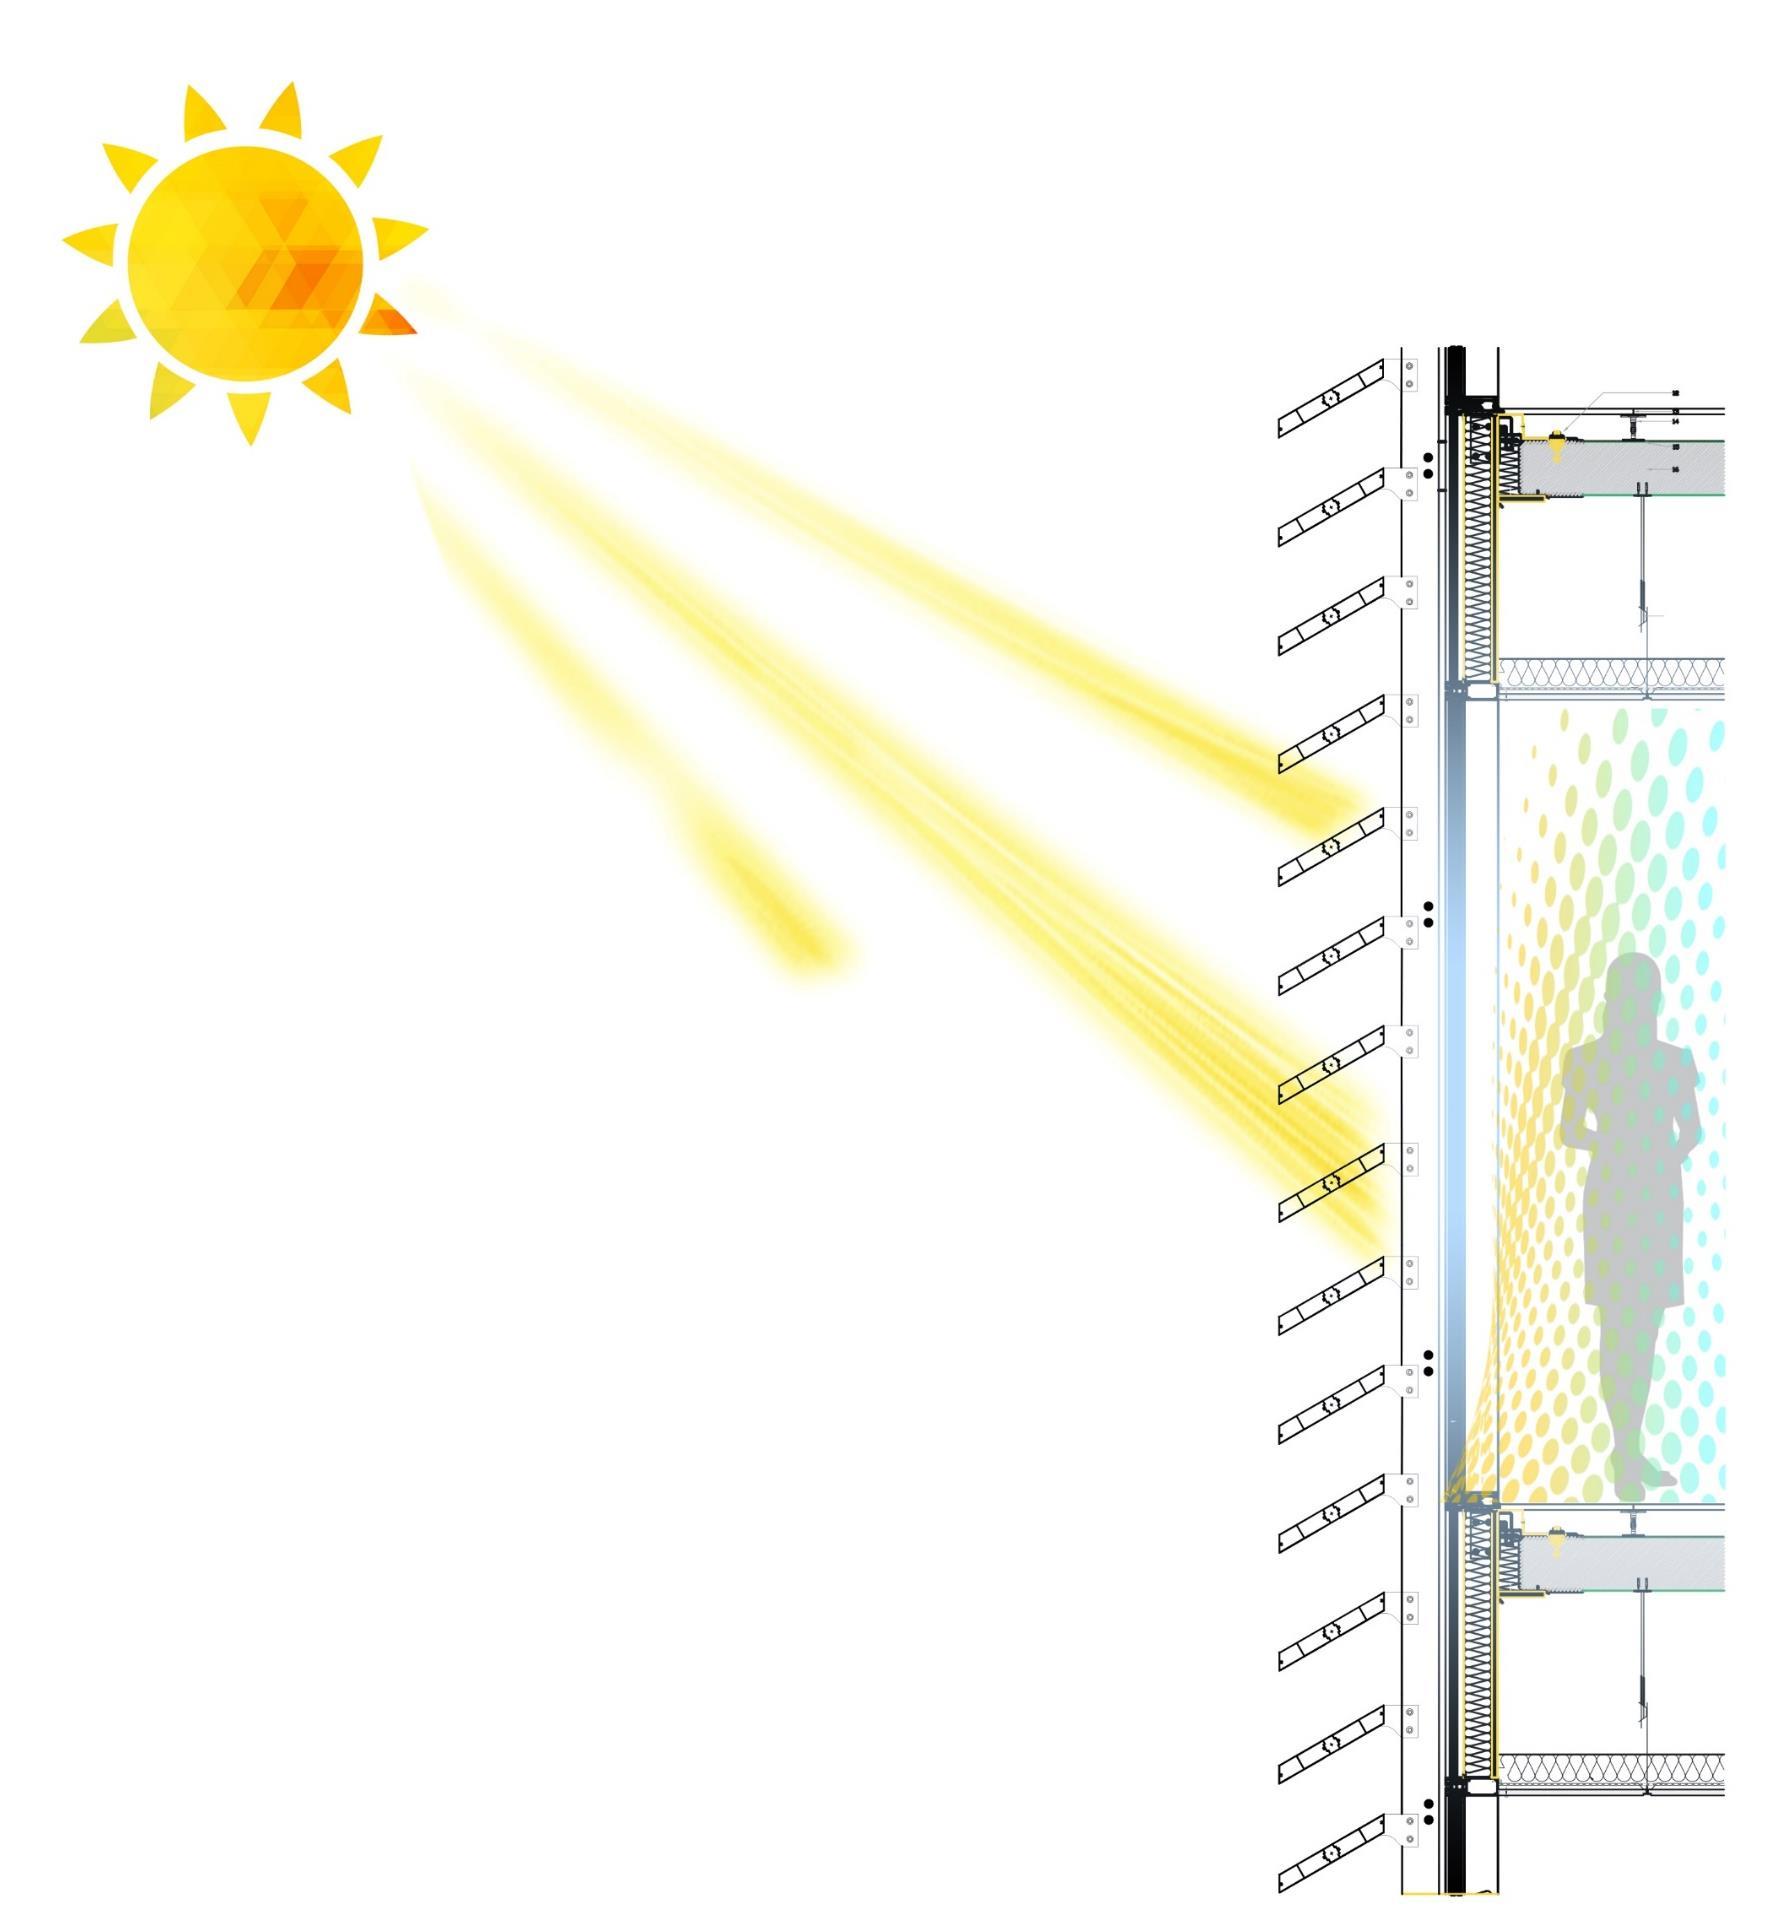
Shadings are offered It is a crucial element in passive solar design because it blocks the sun’s heat energy when it is not desired Since the sun travels different paths across the sky in the winter (low) and summer (high) time, an overhang can be constructed to utilize and manipulate the heat energy from the sun
In Summer;
• Keeps from summer sun
• Controls the light

• Prevents walls to act like thermal batt
Mullion
Raised Floor Concrete Slab
Summer Solar Angle: 21st of January
Winter Solar Angle: 21st of December
Allows Ventilation between Fabric and Shading In Winter;
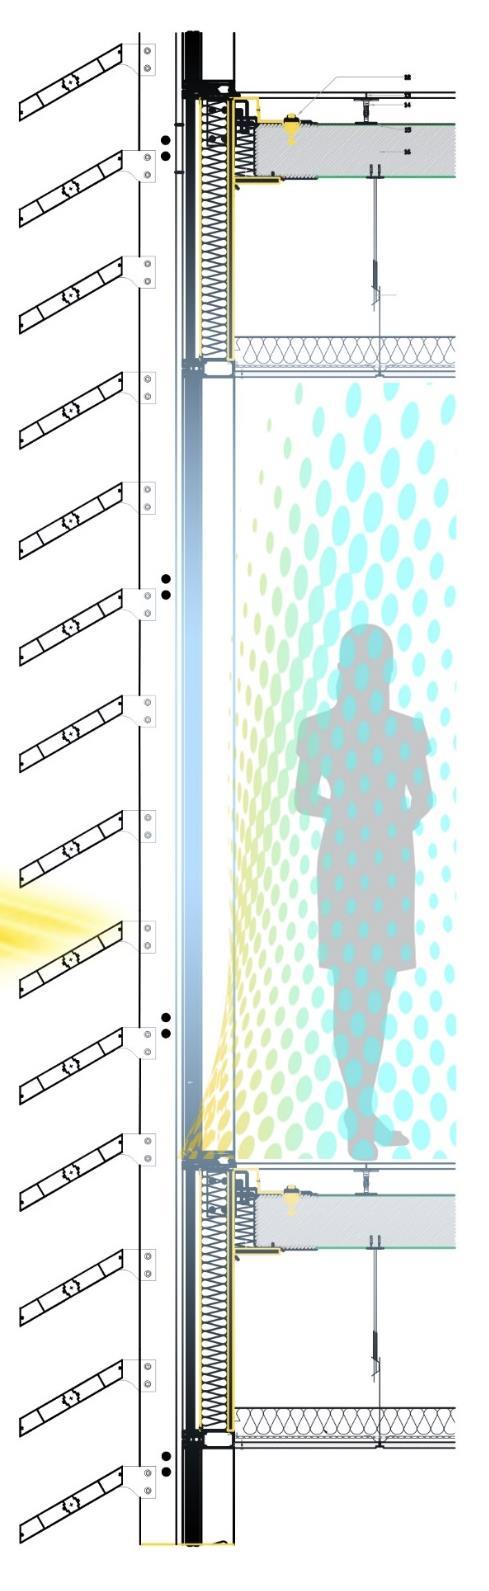
• Allows to sun in
• Provides insulation for the glass
• Acts as a windbreaker
Highest Angle
Lowest Angle
Summer Solar Gain Reduction
CONCEPT
DOES IT WORK? Working Principles Angle Analyzes and Solutions Reactions Concept and Example Harvard University’s SEAS Overhang Shading Louvers
%75
Detailed Design
RESULTS
COMPARISON OF INCLINATION OPTIONS AND REACHING THE RESULT
With the Actual Case, are able to see the higher daylight Intensity in the building with value 2x higher than the standard As well we notice the higher visibility to the interior around 6% as an average correspond to higher constant solar access during the day.

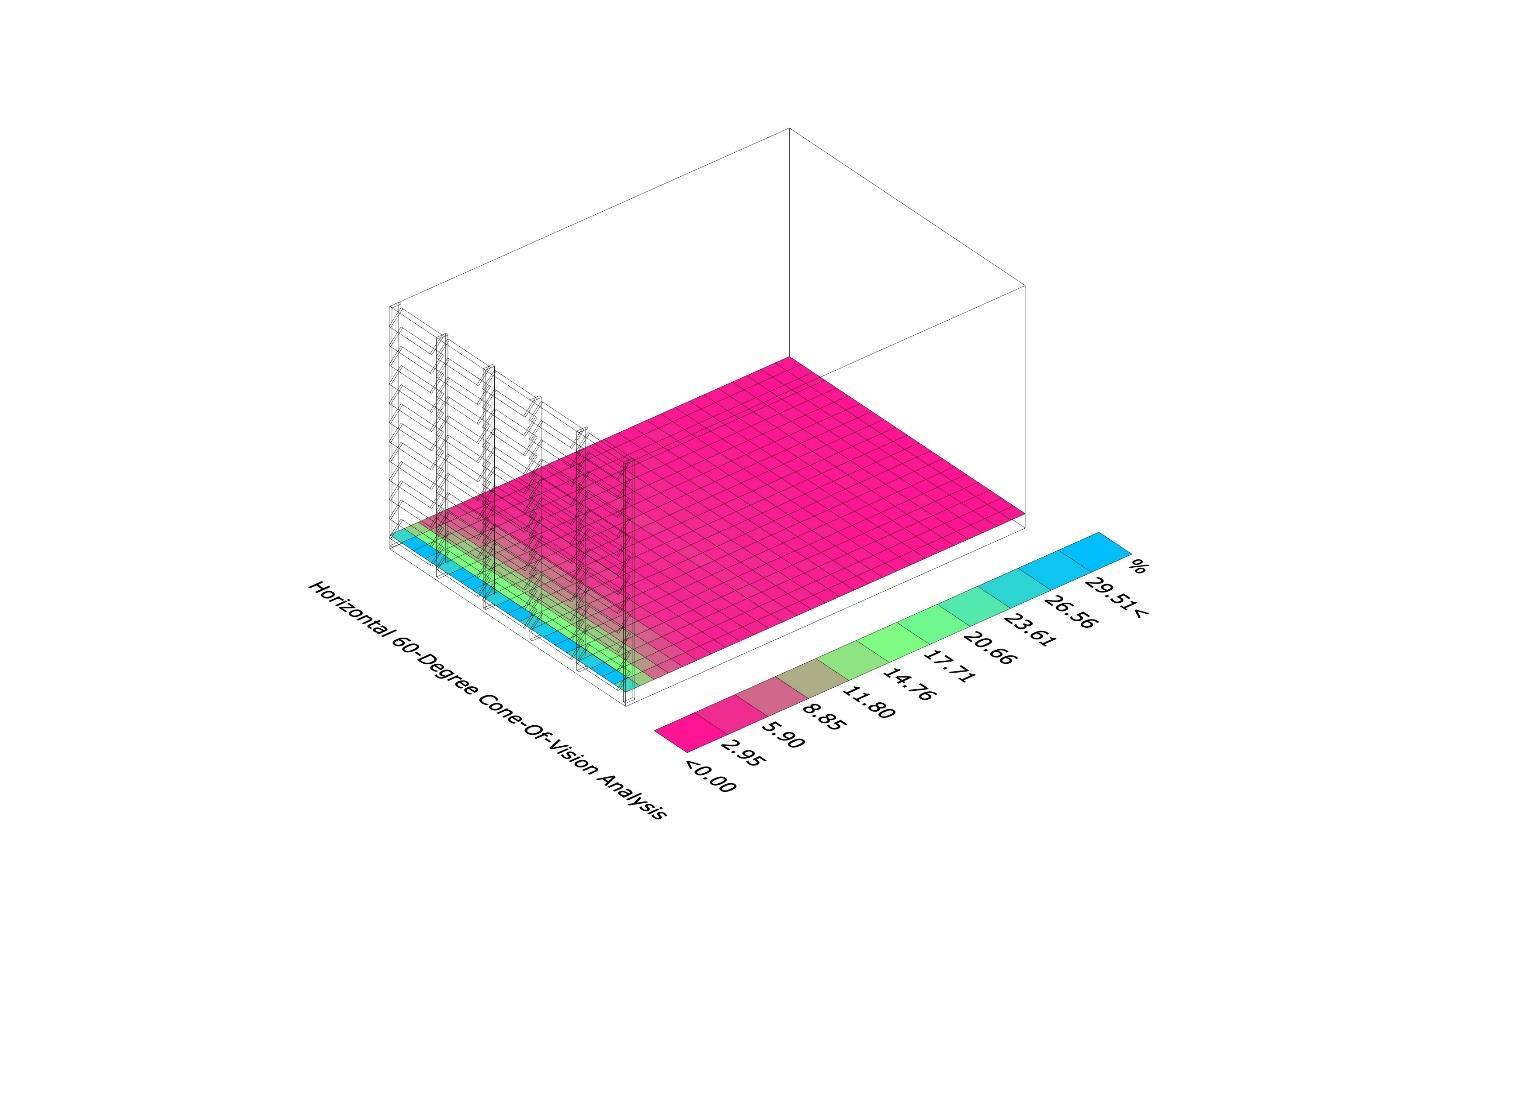

We analyzed Fixed shading with45DegreesSlopewesee higher reduction of the illumination intensity as we selected aluminum horizontal shading at has higher absorption and zero transmissionwhichcorelateto lower visibility during the day with average daylight within the standard requirements.
We have changed the Fixed shading with 10 Degrees Slope we see higher illumination compared to the pervious case we obtain higher visibility to the external environment and daylight average within the standard requirements.

Concept II Actual
I
Concept
Performance Assesment
Inclination Decision of Shading according to Daylight Results
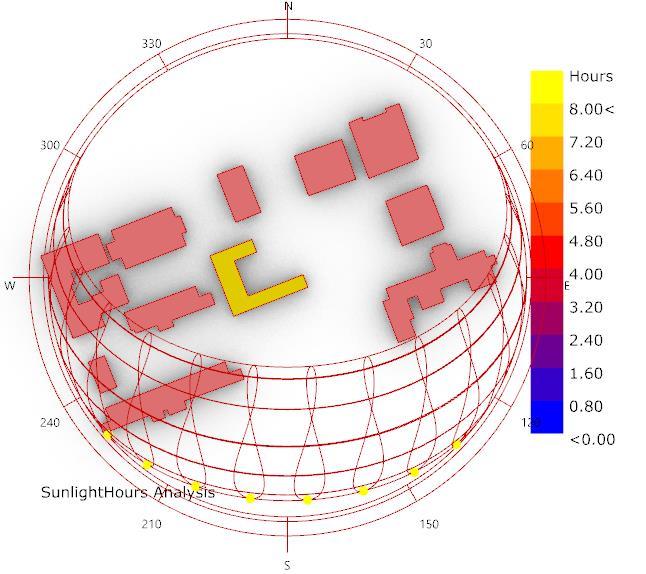
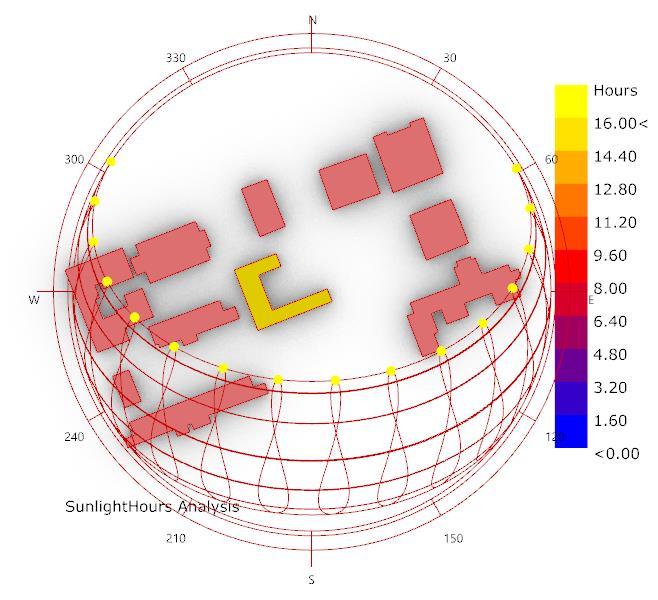
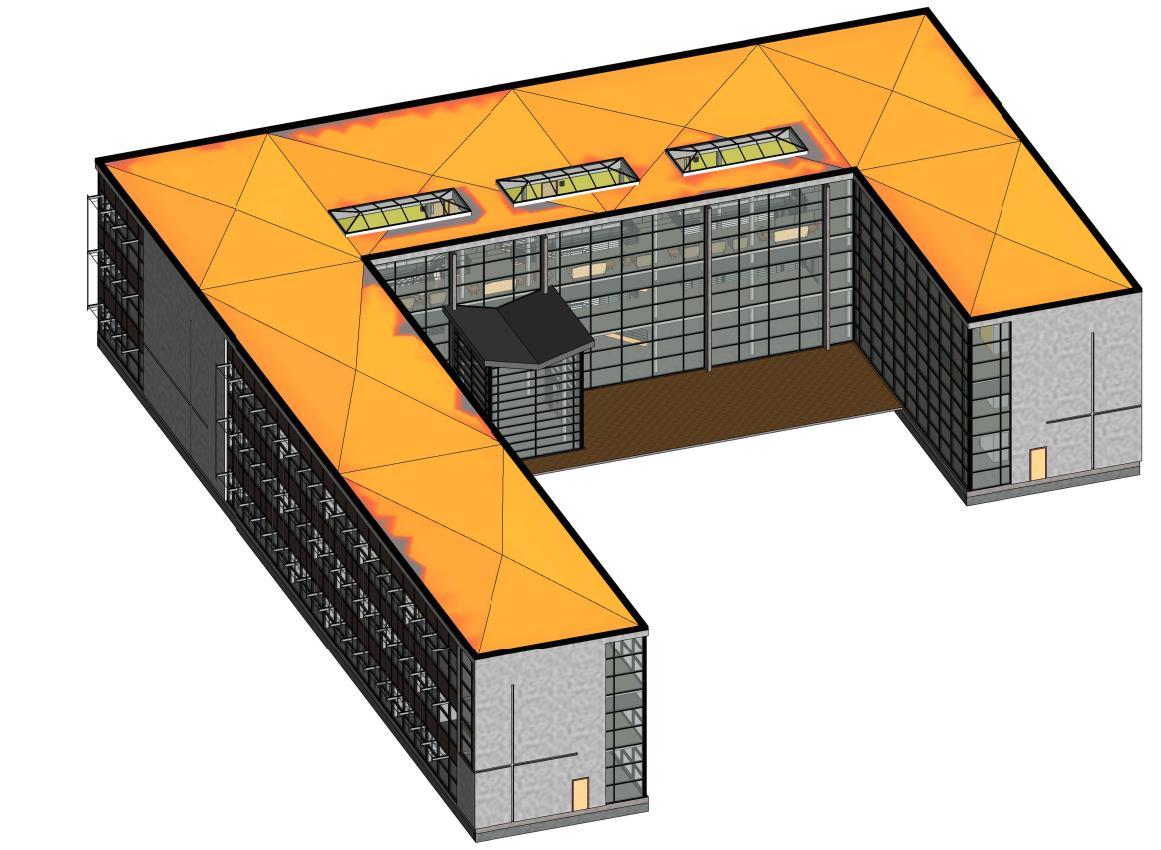
SOLAR ANALYSIS
OVERALL SOLAR ANALYSIS
MILANO, LINATE
Latitude: 45.4642° N
Longitude: 9.1900° E
Area: 181 8 km²
Elevation: 120 m
2
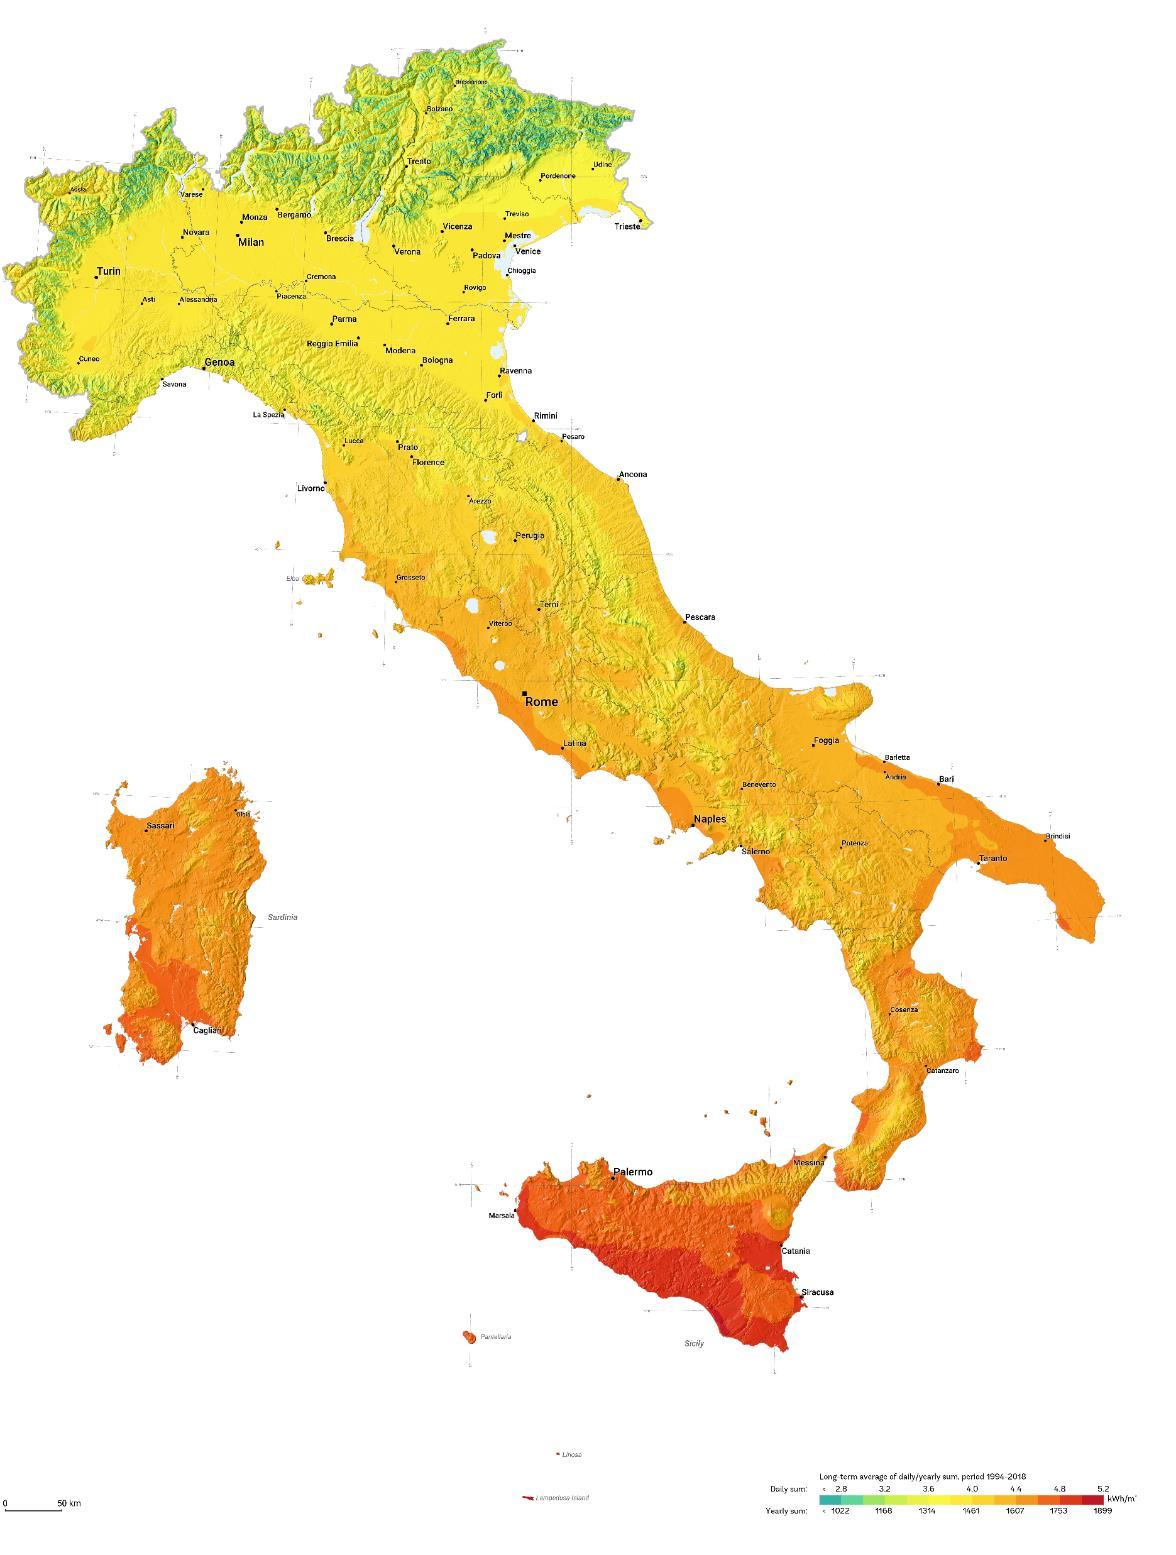
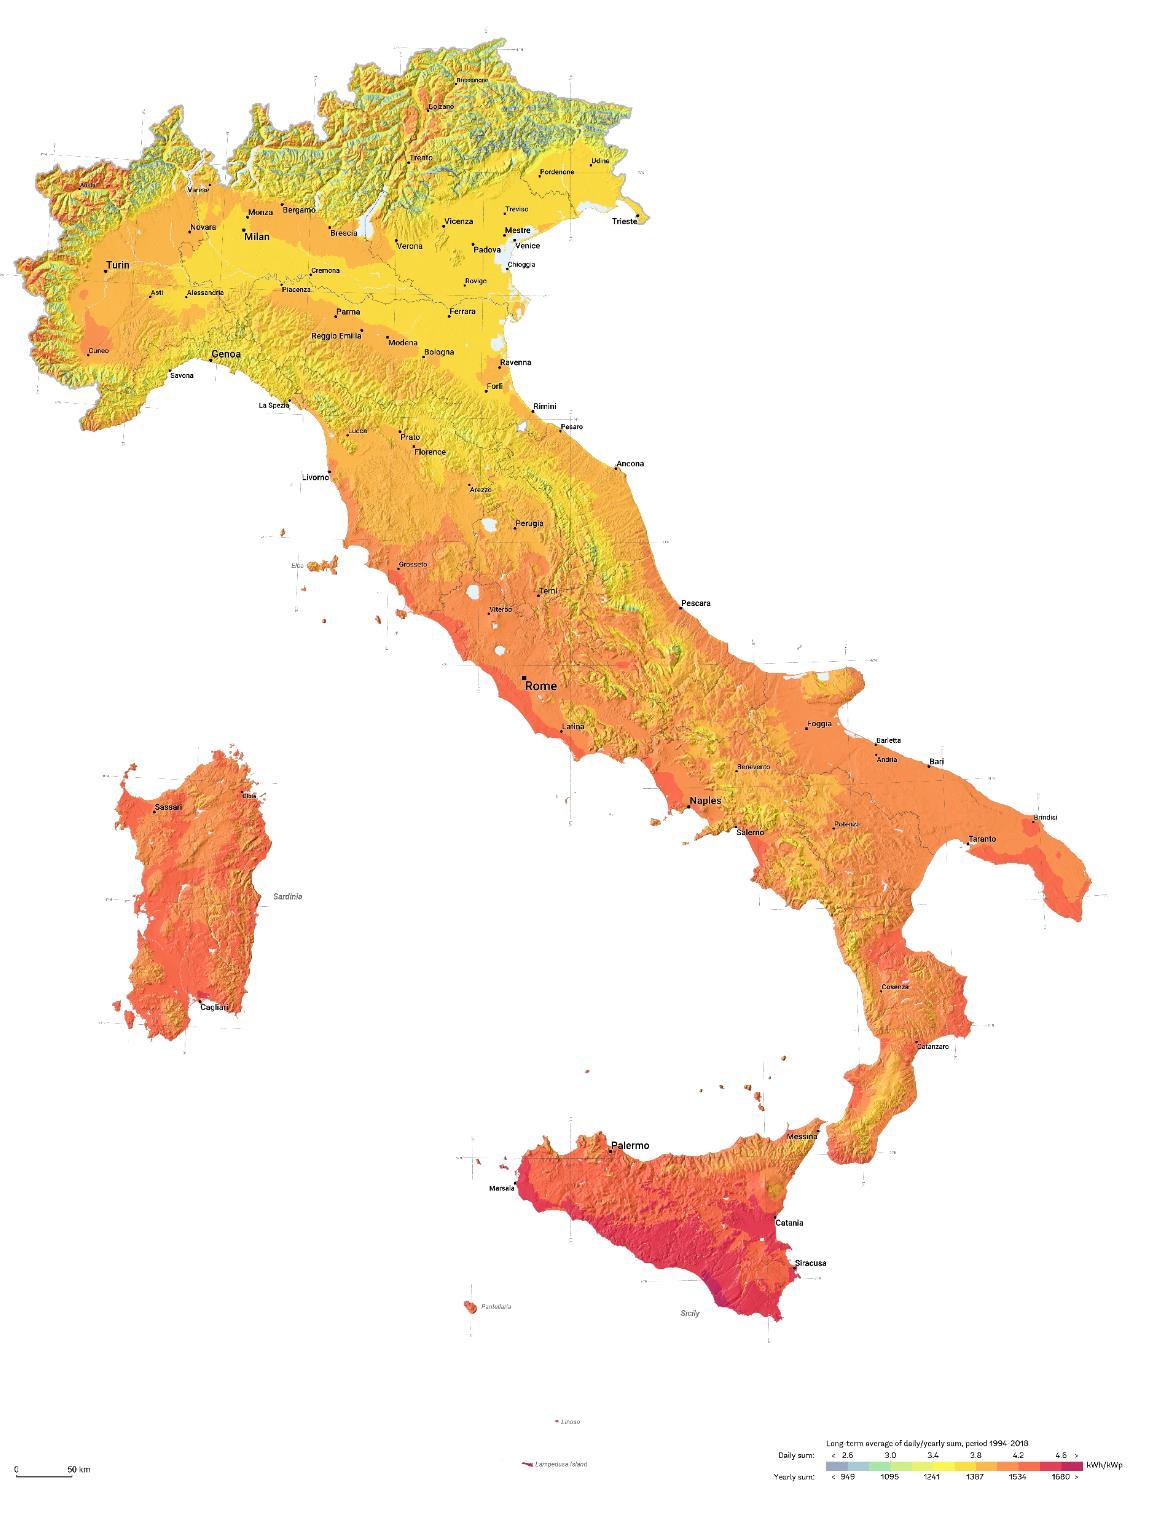
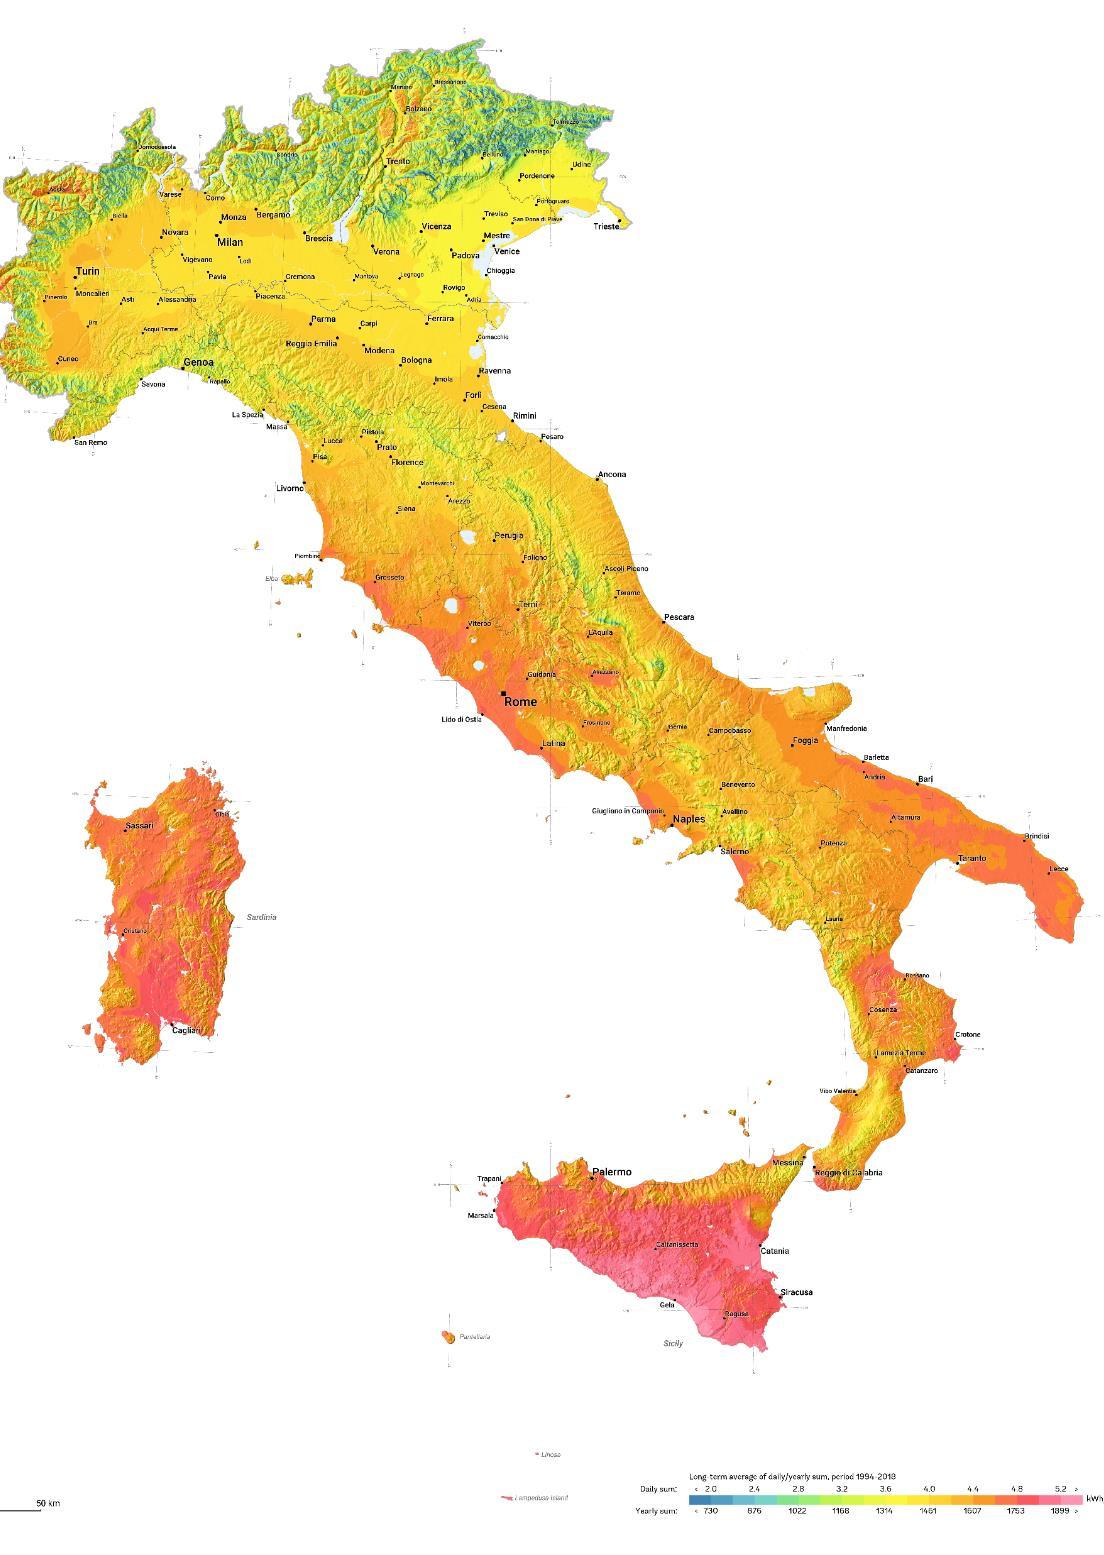
Italy is located in the sunny Mediterranean region in the south of Europe, which is rich in solar energy resources and has great potential for development and utilization, and the cost of solar photovoltaic power generation is relatively low compared to the midwestern region of Europe
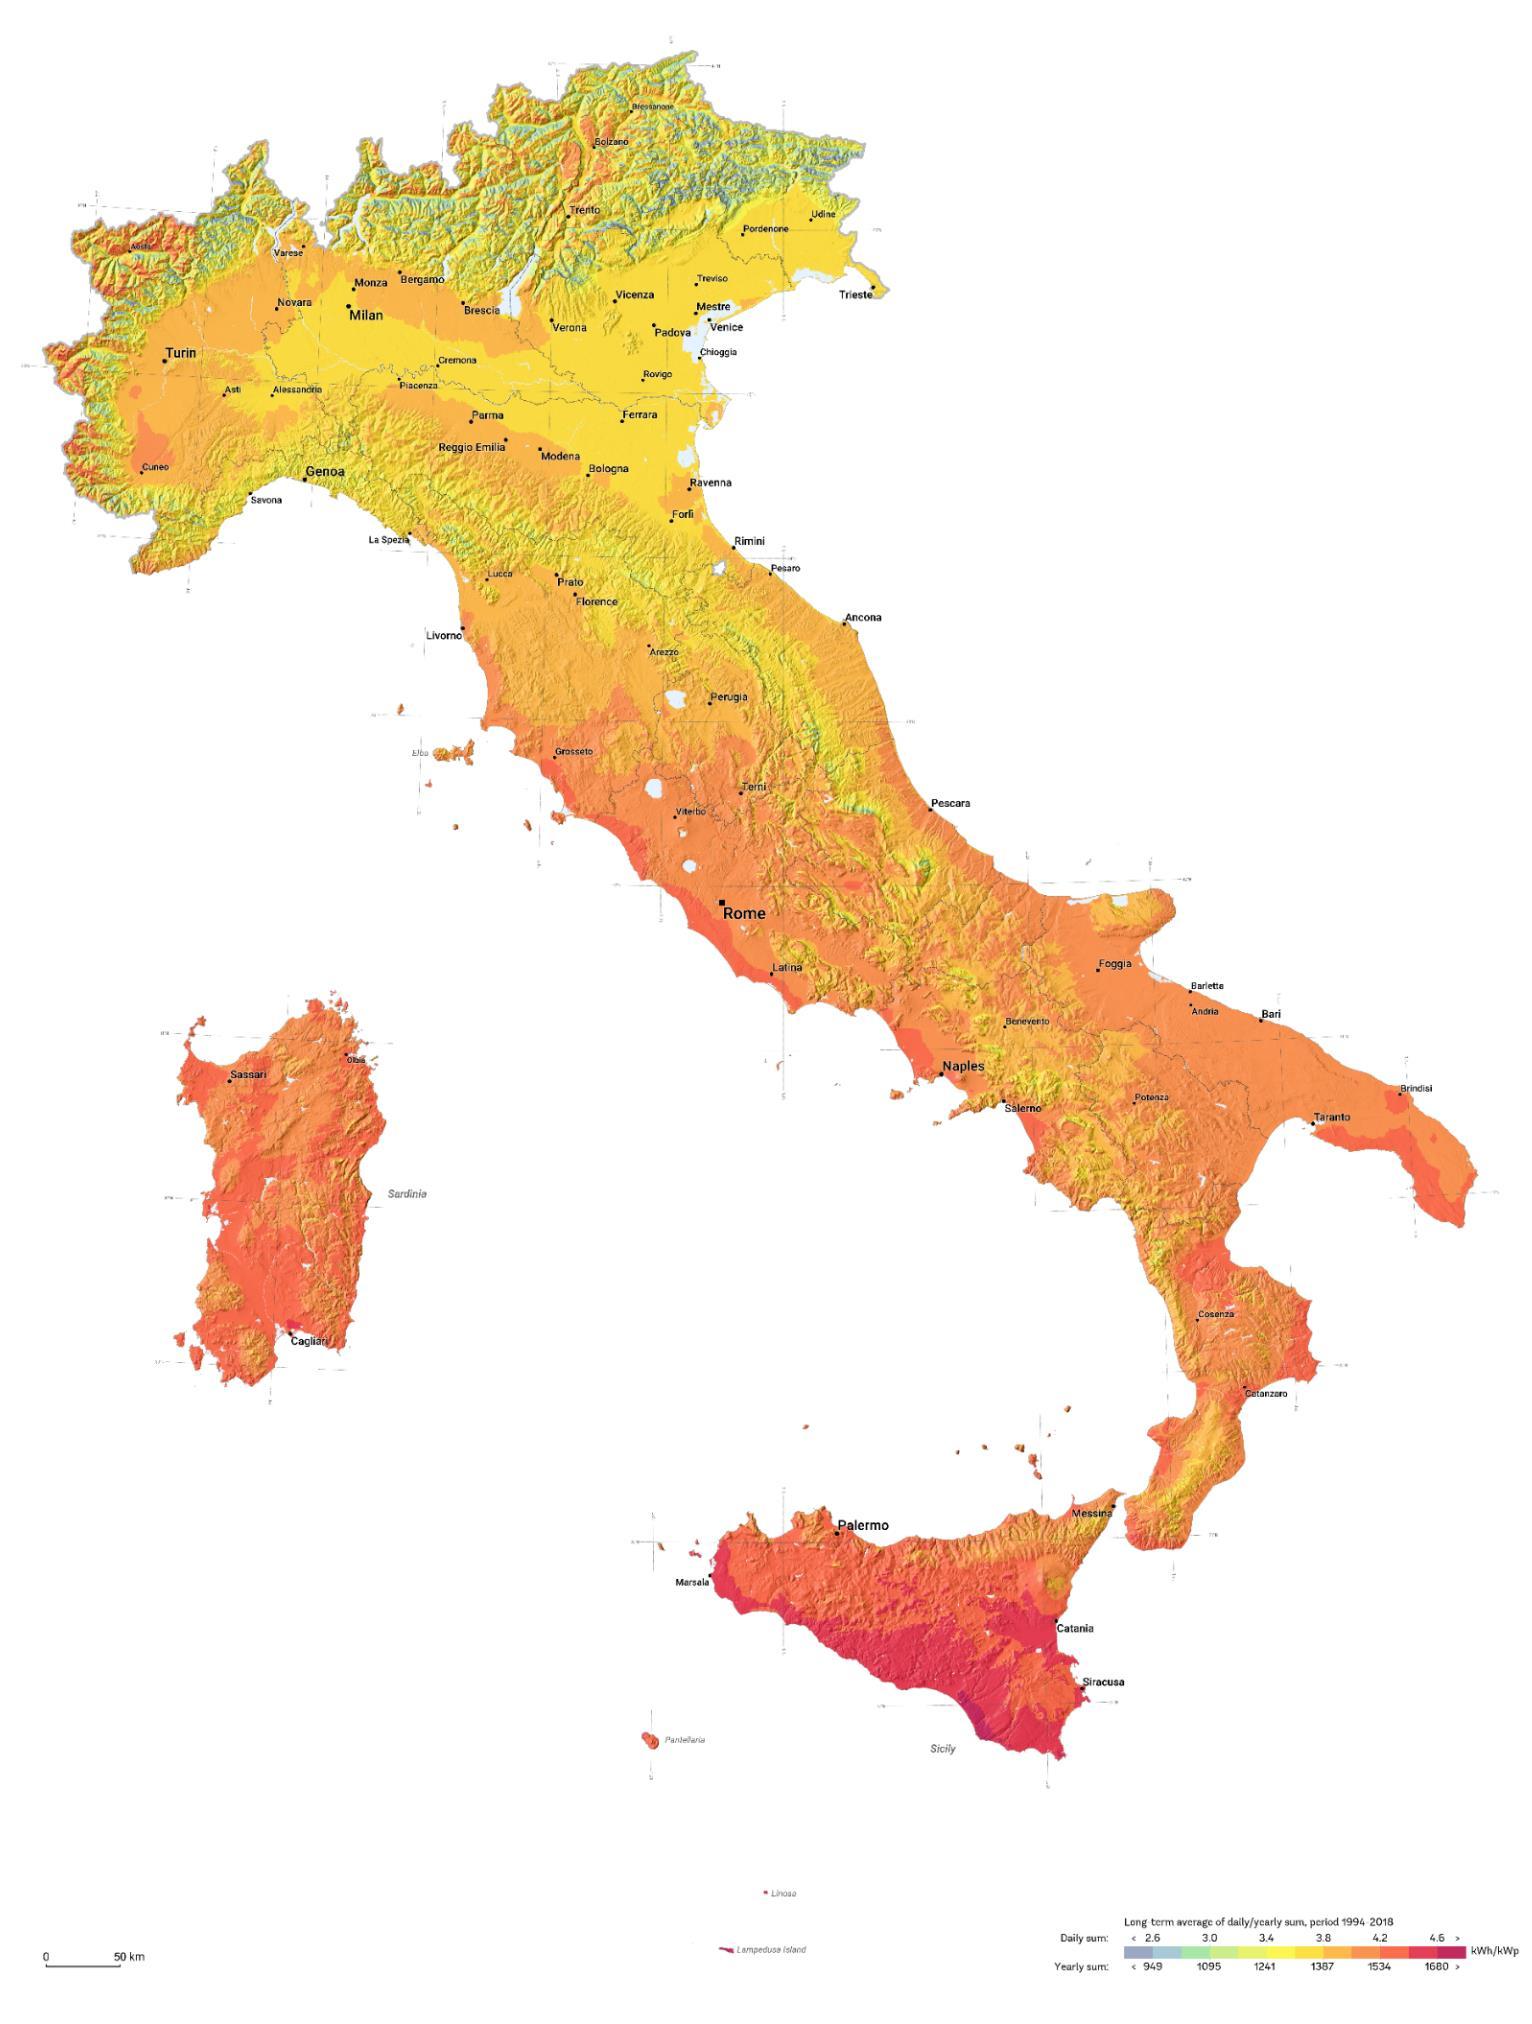
In addition, Italy is a relatively energy-poor country, most of the energy depends on imports from abroad According to data, Italy's domestic oil and gas production can only meet 4 5% and 22% of the domestic market demand, respectively, while nuclear power generation was rejected by a referendum
As a result, about 85% of energy imports make Italy's power generation costs remain high. The pressure of the energy crisis and the need for a low-carbon economy have led Italy to look to the clean energy sector, represented by solar energy.
As a result of the radiation analysis, solar energy production may highly increase energy performance of the building
There are several advantages of using solar energy system:
1 Renewable Energy Source
The most important thing is that solar energy is a truly renewable energy source It can be harnessed in all areas of the world and is available every day. We can not run out of solar energy, unlike some of the other sources of energy.
Impact on the Environment
Solar energy has the least negative impact on the environment compared to any other energy source It does not produce greenhouse gases and does not pollute the water It also requires very little water for its maintenance, unlike nuclear power plants for example, needing 20 times more water
3 Reduces Electricity Bills
Generating own electricity means that building will require less from the utility supplier This will immediately translate to savings on energy bills
4.
Low Maintenance Costs
The only thing that solar energy systems require is periodic light cleaning to make sure dirt, leaves, and other debris aren't obstructing the sun's rays
ANALYSIS ANALYSIS
Location: Milan, Italy
Surface Area: 1671 m²
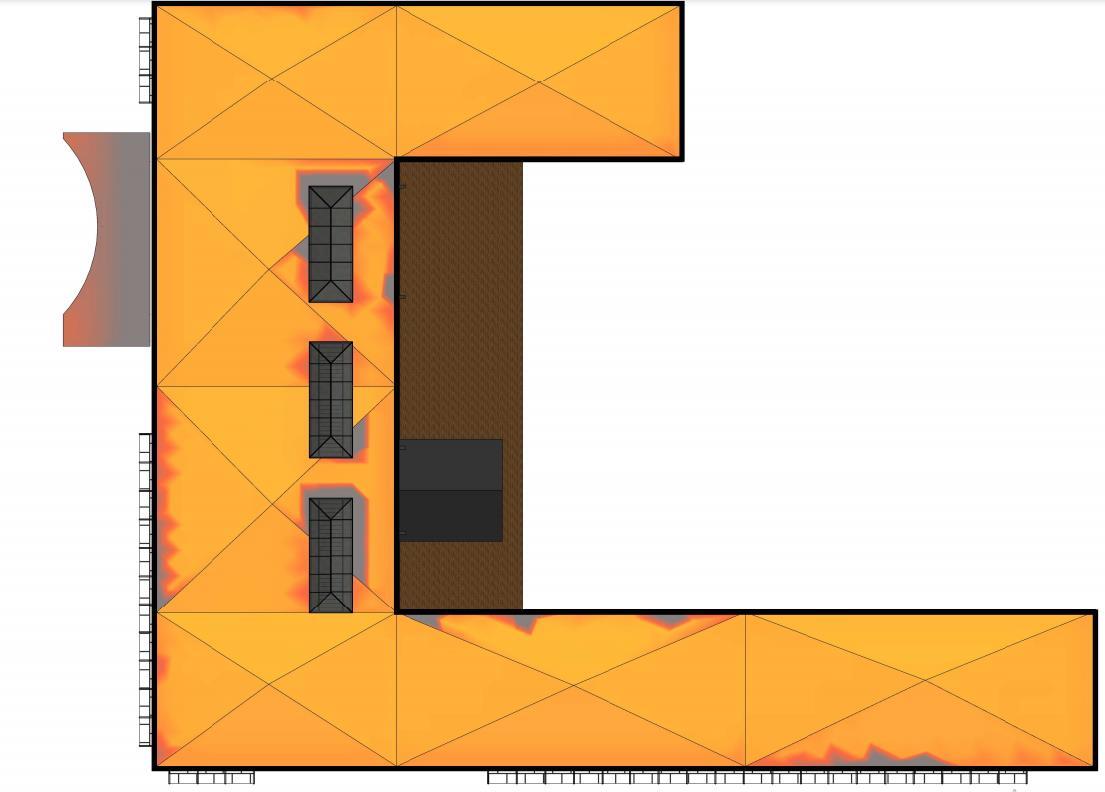
Analysis time: 01.01.2020 – 31.12.2020
Annual cumulative radiation: 2 190 003 kW
Average for square meter: 1257 kW
Probable PV energy production: 341106 kW/ year
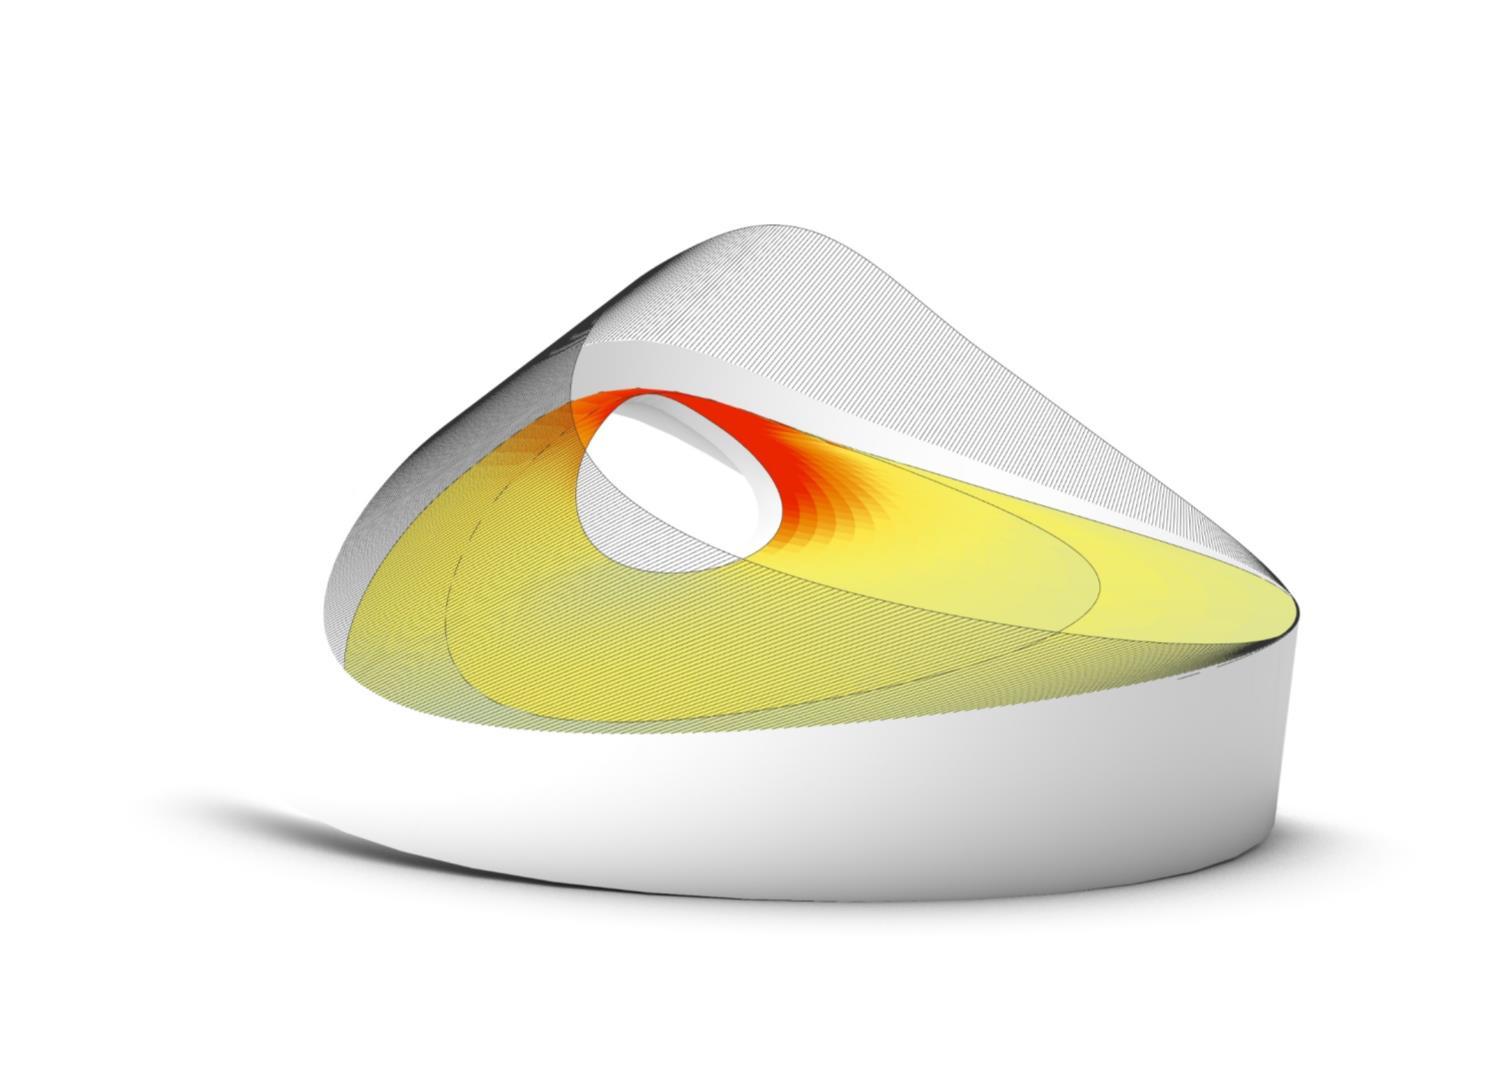
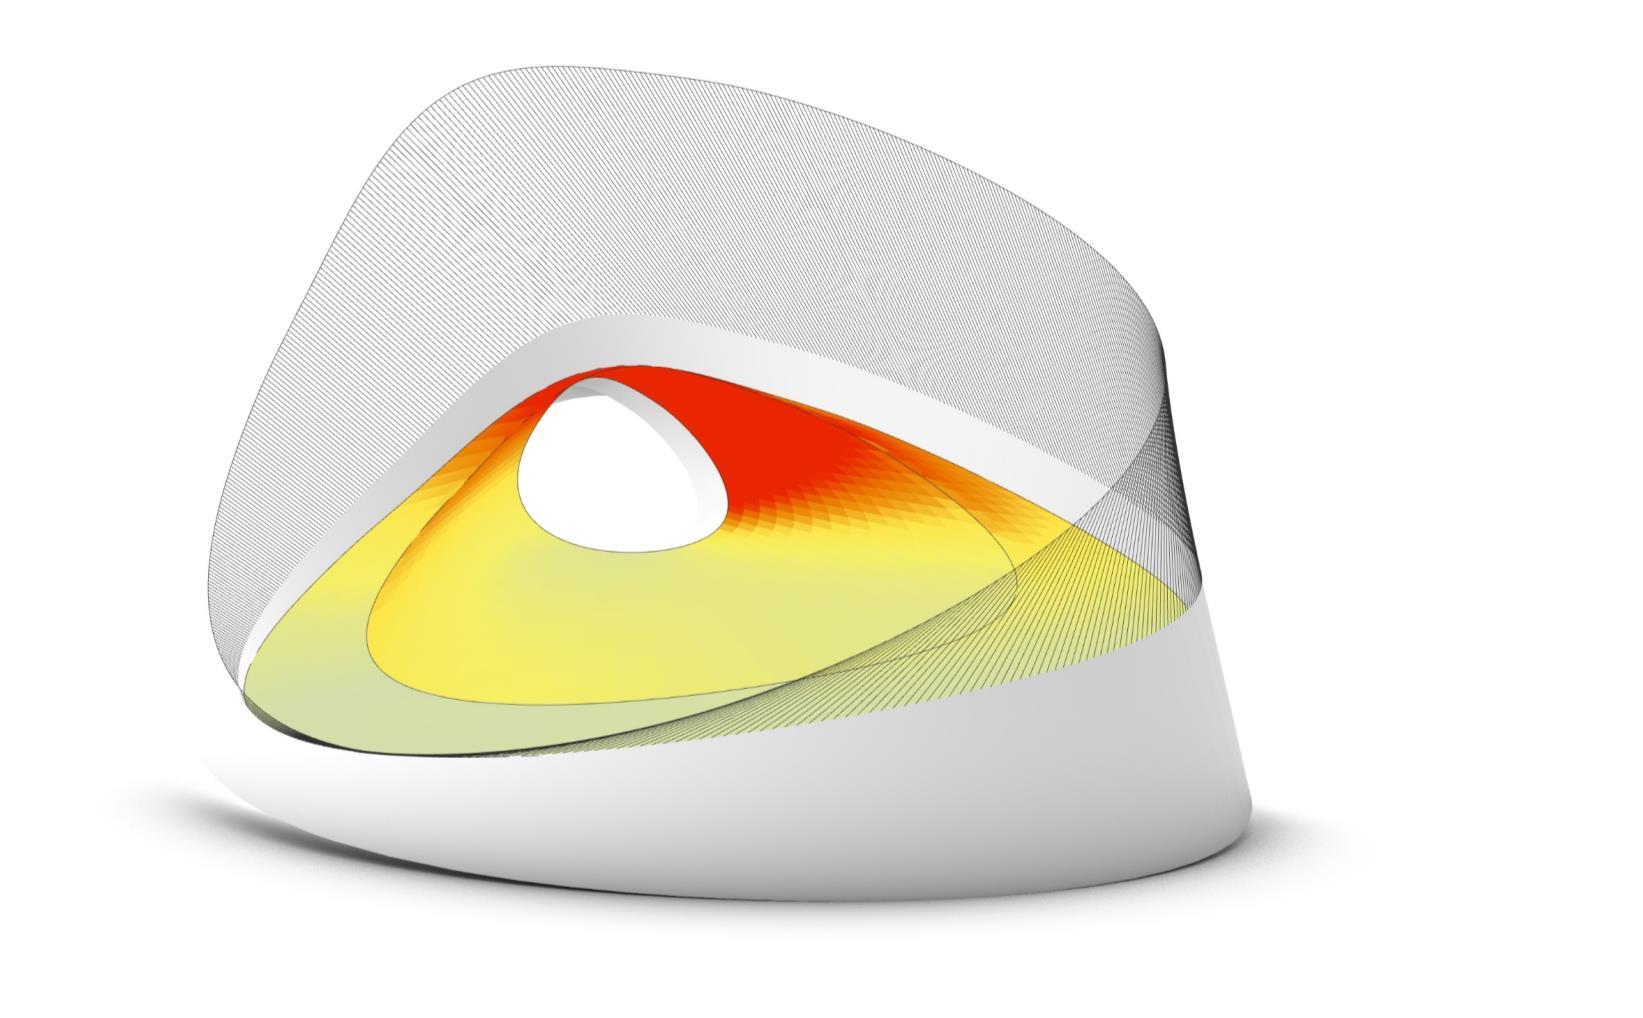
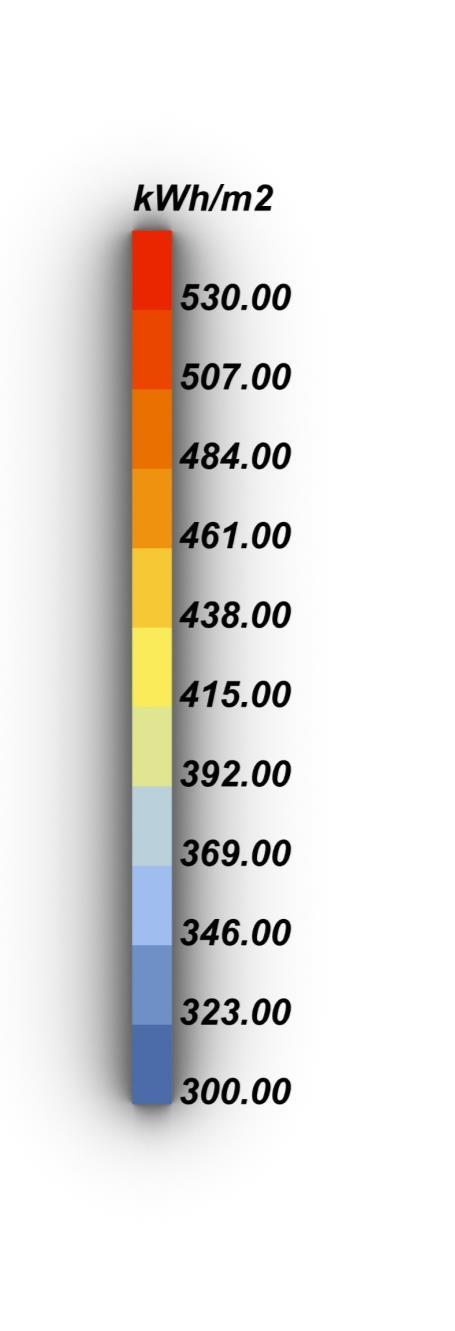
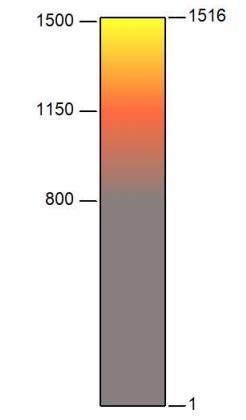
Solar Energy (kWh/m²)
1400-2200h of sunshine throughout the year in Milan, Italy
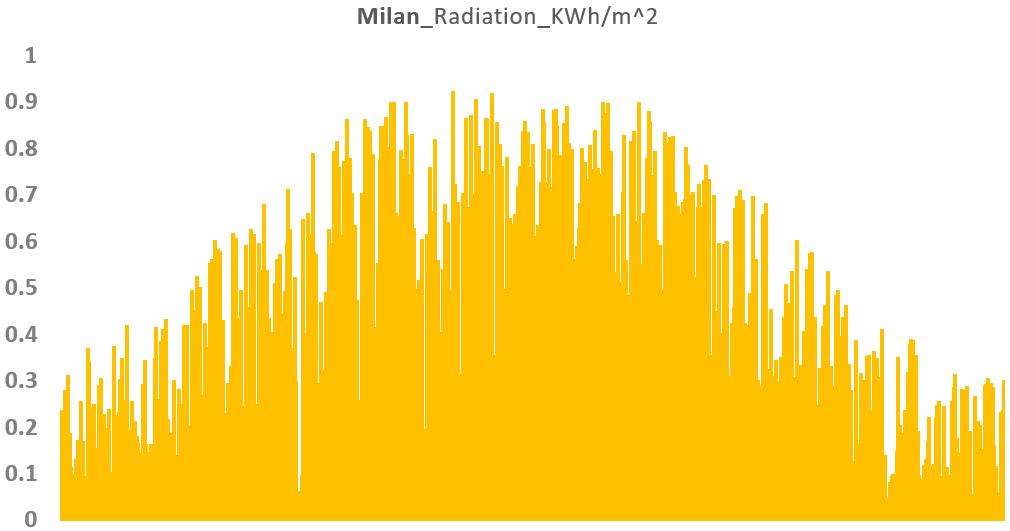
The total amount of solar radiation received in a year is approximately 1257 KWh/m2
ANALYSIS
Schematic Design
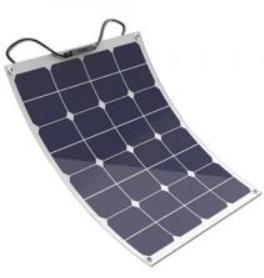
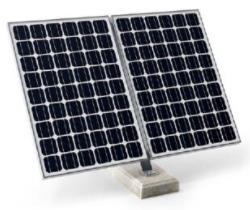
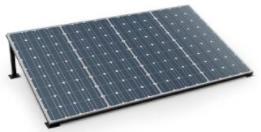
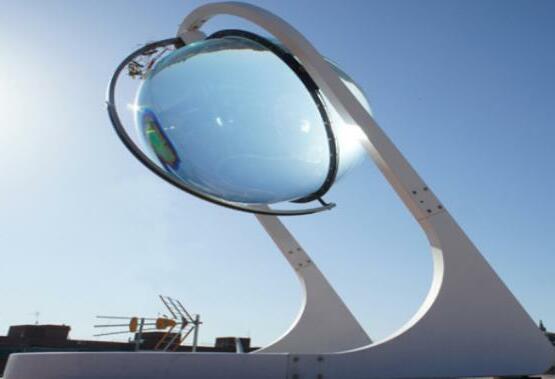

SOLAR SOLUTION SOLAR SOLUTION COMPARISON ACTUAL SECTION SOLUTION OFFERS SOLAR SOLUTION NOT AVAILABE Fixed silicon PV panels Silicon PV panels with tracking system Concentrating solar panels with tracking system Solar sphere with tracking system Sunny, cloudy, windy Sunny, cloudy Sunny , cloudy Sunny, cloudy, windy, Evening Si 100% ~180W/m2 70% ~180W/m2 Si Si 30% ~180W/m2 Si 25% ~180W/m2 FEATURES Mounting method Flat installation Maintenance HIGH Energy efficiency 10%~12% FEATURES Mounting method Installation facing due south Maintenance LOW Energy efficiency 18% FEATURES Mounting method Installation facing due south Maintenance Medium Energy efficiency 25% FEATURES Mounting method No requirement Maintenance Medium Energy efficiency 30%~35% 1. With solar tracking system 2. Low energy conversion rate 3. Low electricity production 1.With solar tracking system 2.Good energy conversion rate 3.Slightly higher construction costs 1. With solar tracking system 2. Good energy conversion rate 3. Good electricity production 1.Low energy conversion rate 2. High maintenance cost afterwards Detailed Design
CALCULATIONS CALCULATIONS FOR EACH CONCEPT
CALCULATIONS
CONCEPT 1
CONCEPT 2
Efficiency (%) Comparison for 20 Days
1 Calculate the total solar module panel area
Total roof area: 1630 m2
Occupied area per solar panel module: 3m2
Number of solar modules: 543
Single panel assembly area:2056mm*1140mm
The total solar module panel area =543*2.34=1273m2
2. Calculation of power generation
Ep=HA ×S×K1 × K2
HA Total annual solar irradiation per unit area(unit: KW/m2)
S Total solar module area
K1 Component conversion efficiency factor
K2 Integrated system efficiency factor
HA = 1257 KW/m2 ; S= 1273m2 ; K1=0.25 ; K2=0.8; Ep=320 032KW
1 Calculate the total installed capacity
Total roof area: 1630 m2
Occupied area per solar panel module: 4m2
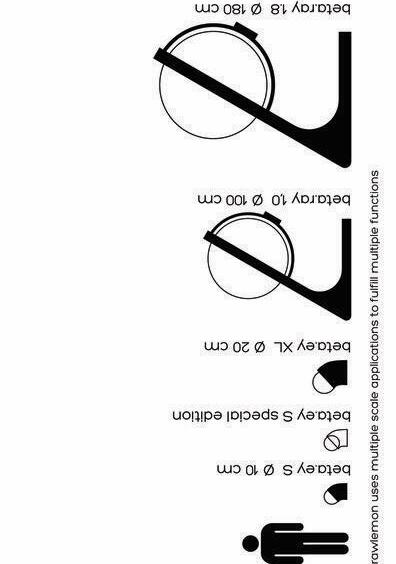
Number of solar modules: 400 Beta.ray 1.8( 180cm):
Daily theoretical generation of energy: 3.4KWh
Total installed capacity=400*3.4*365=496 400KW
2 Calculation of power generation
Ep= Total installed capacity × K(Integrated efficiency factor)
K: The integrated system efficiency factor is the value after taking into account the component inhomogeneity, inverter losses, AC/DC circuit losses, etc., and is generally taken as 0.8
Ep=496400*0.8=397 120KW
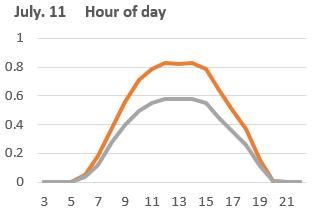
July 11.
Conventional
Solar Sphere
Detailed Design
Design Solutions

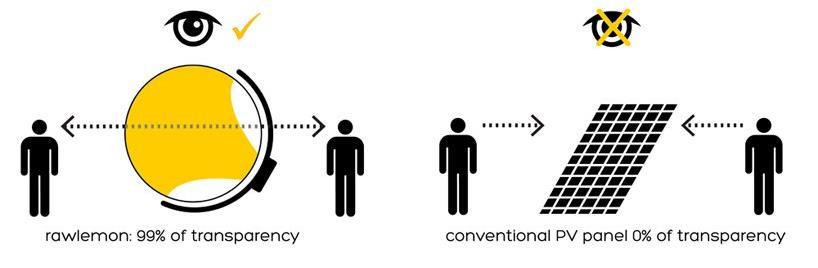
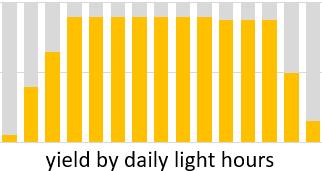
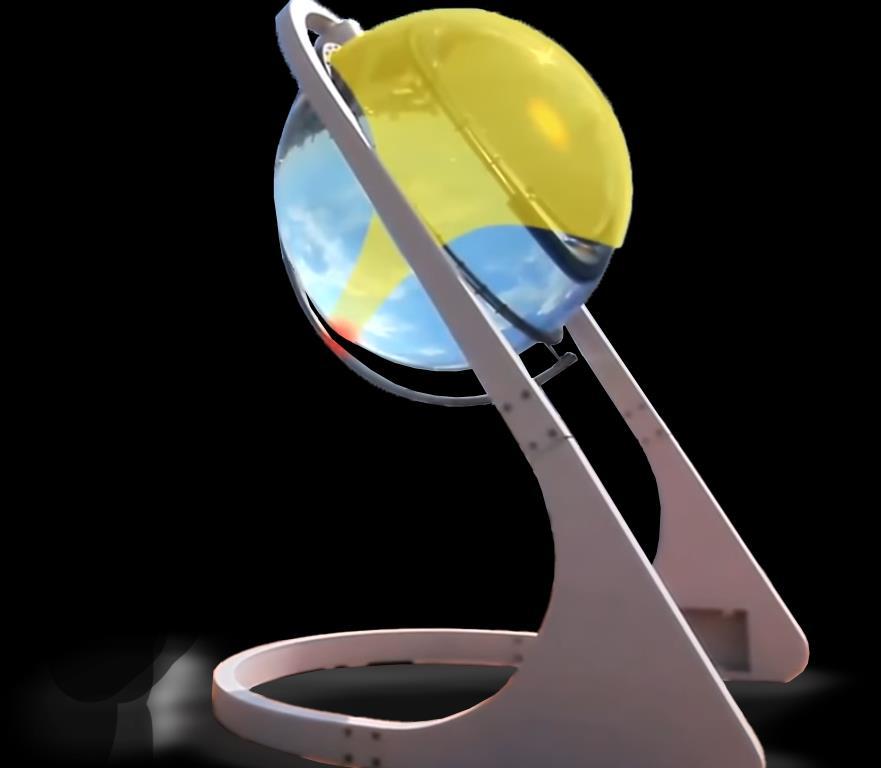
Choosing a solar sphere logical not only for efficiency but also for design parameters. While solar spheres are providing %99 transparency, pv panels are blocking the vision and the view. With this advantages solar spheres, prove that solar system can be also used as a part of design. By the approach, it can be integrated to fundementals of building design.
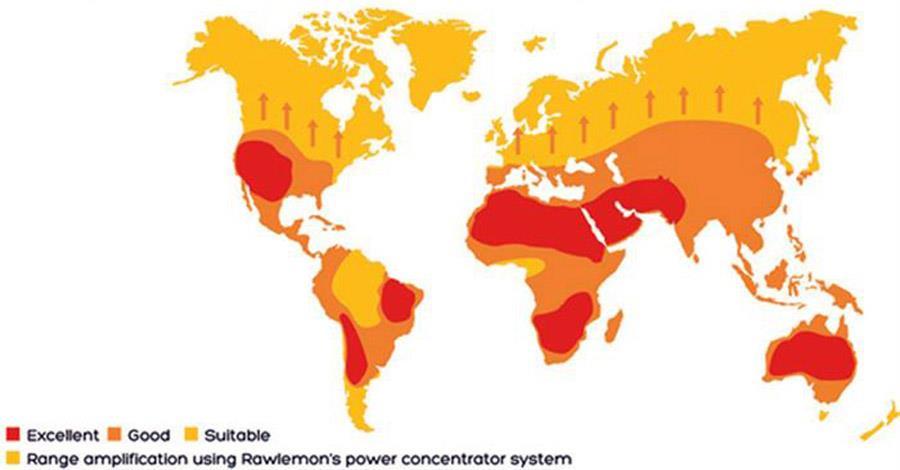
Offering a solutions is not only related to efficiency, and design aspects More important than these parameteres there is a feasibility which allows or denies to apply the solution About this issue, solar spheres has remarkable advantages rather than other solutions. Firstly, solar spheres does not restricted by solar angles like panels affected. It can gather energy from everywhere from where light source or fake source. Moreover application of solar system is modular and can be applied to any kind of Project. Solar spheres not only related to roof only, it can be used in landscape design, facade solutions and etc due to its advantages Before applying this solution, we need to understand that it where it can be much more better Chart below is explaining where it is much more efficient than other areas
SOLUTION DETAILS SOLUTION STRATIGRAPHY AND DETAILS SOLUTION STRATIGRAPHY
OUR
Sunny, cloudy, windy, Evening 25% ~180W/m2 Si FEATURES Mounting method No requirement Maintenance Medium Energy efficiency 30%~35%
Detailed Design
MORE DETAILS ABOUT
SOLUTION
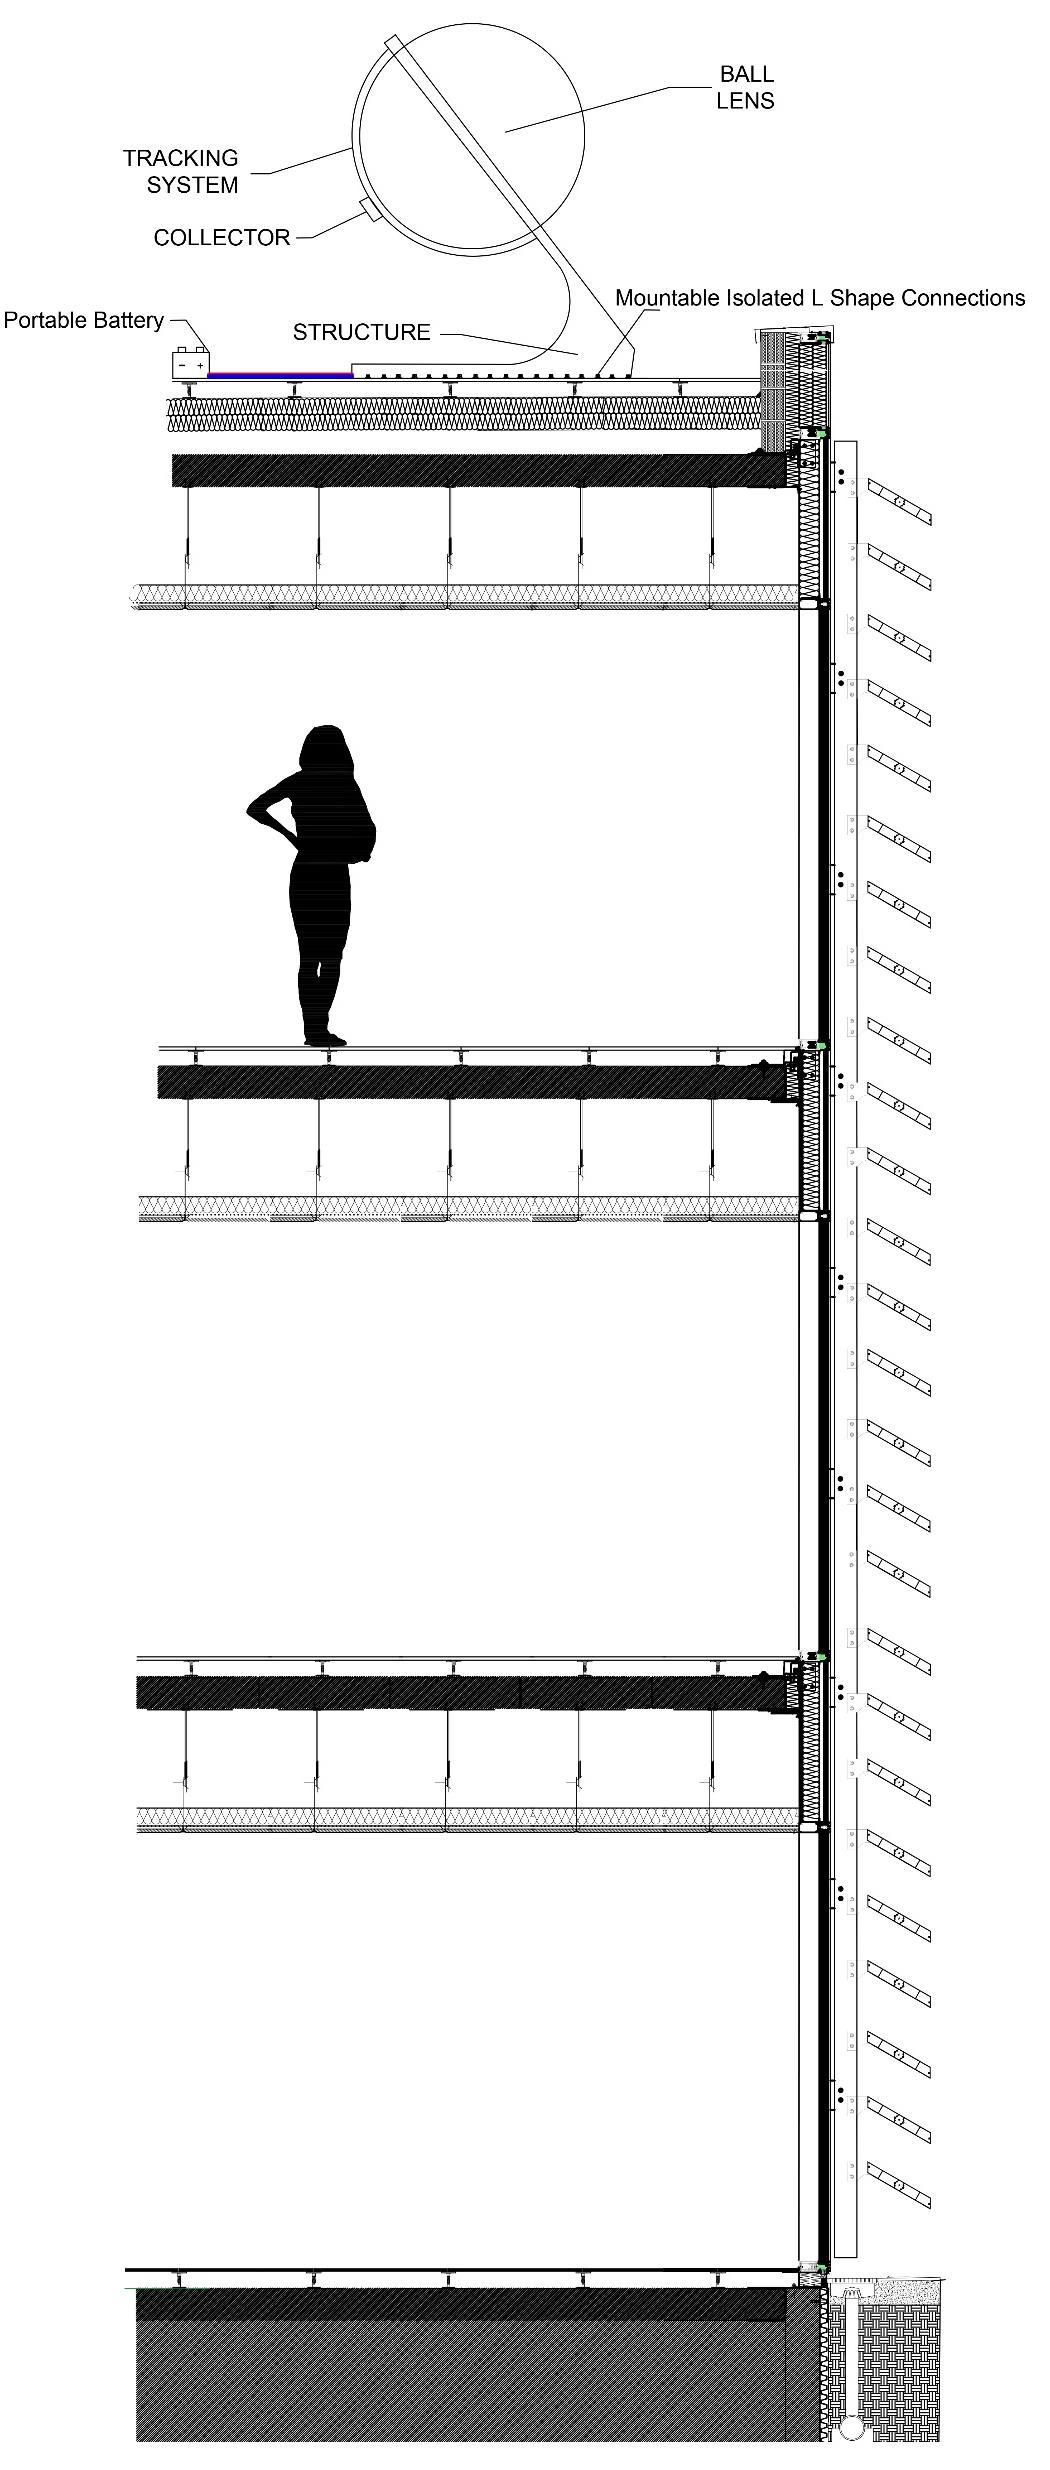
Solar Sphere Detailed
HOW DOES IT WORK?
Concept
To explain how it Works better, same solutions explained by differend kind of usage
The Spherical sun power generator
•Spherical solar power generator can work on both diffused or direct rays of the sun
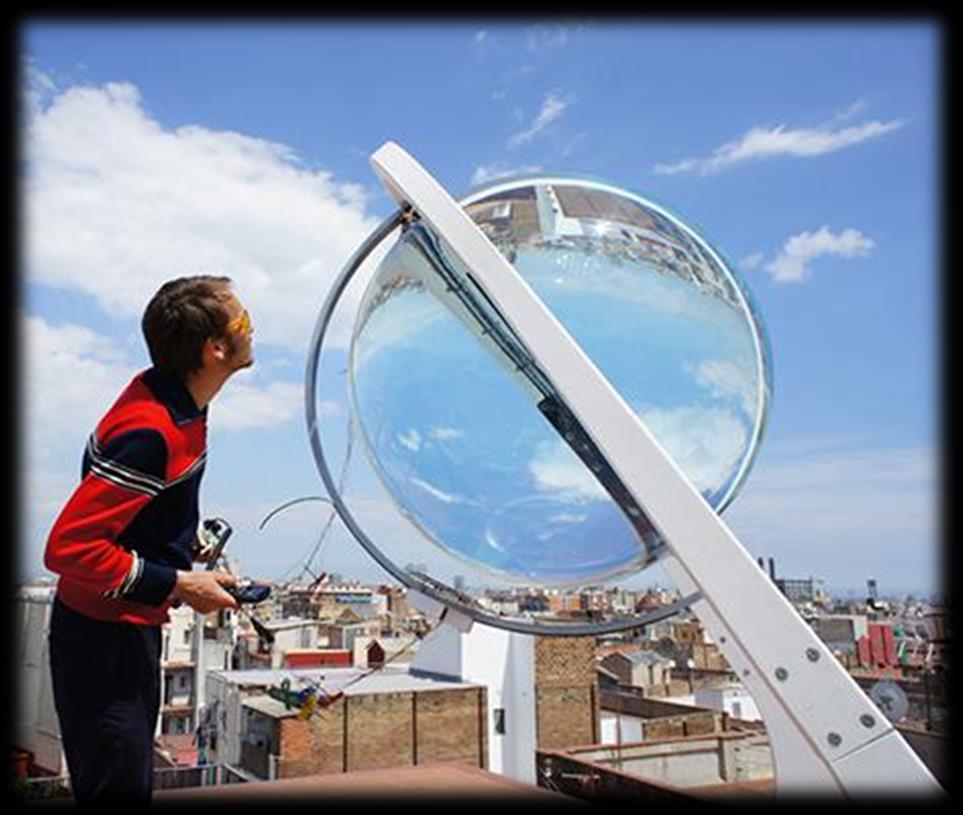
•Diffused rays of the sun are directed towards ball lens
•Ball lens will focus the diffused ray onto a collector plate.
•This collector plate is small but as powerful as a larger PV panel
•Collected energy will be converted into electricity using that smaller PV panel and will directed towards the battery
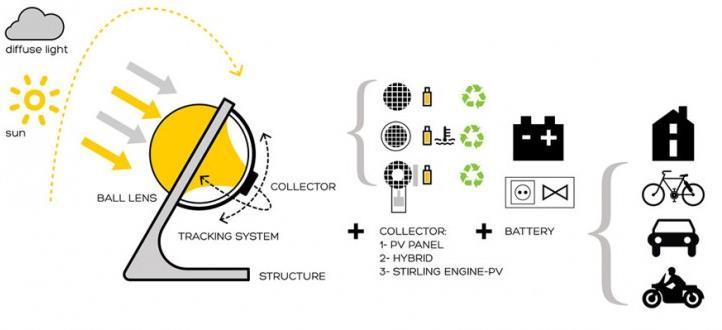
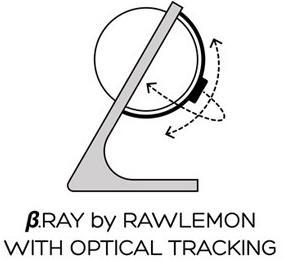
•The spherical sun power generator has a dual axis tracking system with a micro tracking system,
•both the spherical solar power generator and tracking system are immune to weather.
•It will absorb a very little damage in the windy season.
•Collected energy in the battery can be used in electric cars or any solar driven appliance
•Spherical sun power generator can easily supply its energy to the power grid in the future
•Heat is the additional benefit of the spherical solar power generator
Future
The spherical solar power generator is aiming to charge electric cars and fully integrate into the building and homes and Form small devices like mobile phones to the air conditioner, the spherical sun power generator can provide all of that with additional heat to the homes
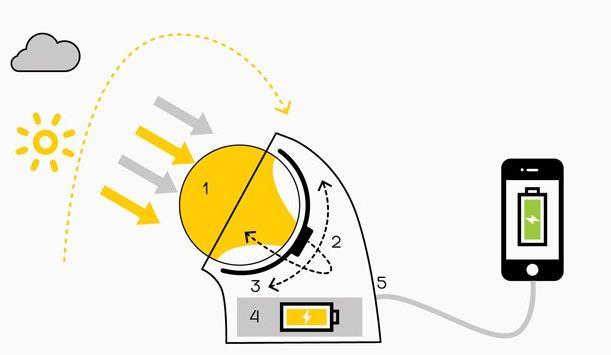
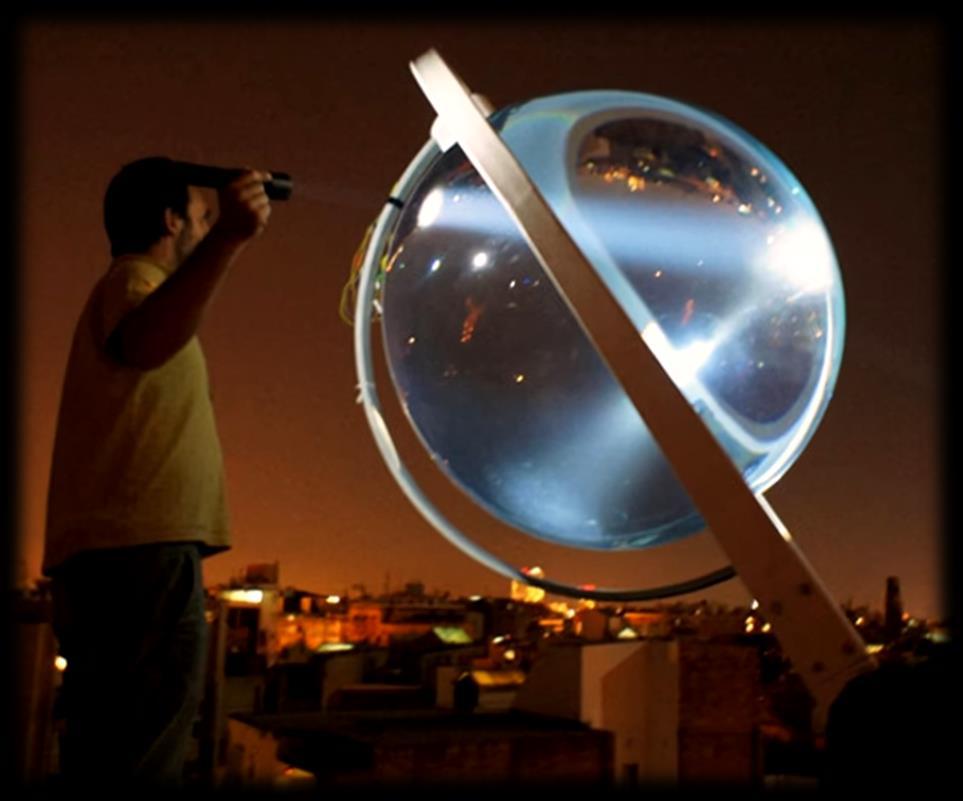
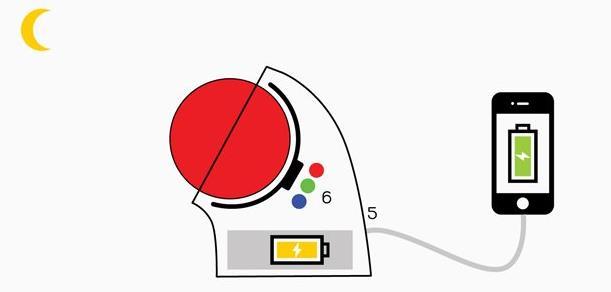
In Day Time;
• Collects light from each main and subsources
• Prevents Visual Pollution
• Eliminates reflectivity which can cause accidents
In Night Time;
Highest Angle
• Collect light from around (ex.Street lights,reflections)
• Provides unobtrusive clear view
• Acts as a solar light source with reflections insde
Lowest Angle
CONCEPT
Night
%35
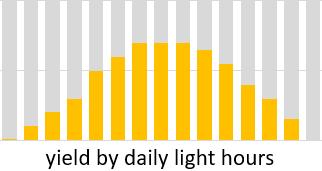
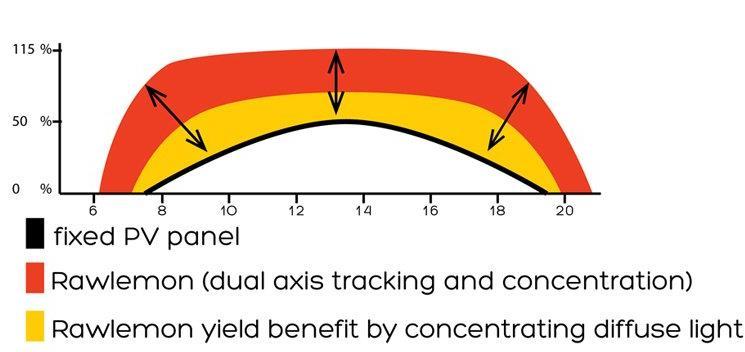
HOW DOES IT WORK Day and Night Functions Concept and Example
Time More Efficiency than PV Panels
Day Time
Detailed Design
RESULTS
APPLICATION RESULTS
A) BEFORE
319,072 kg 128,013 kg 87,049 kg
A) BEFORE
Annual electricity saving: 320,032kW of electricity

CO2 reduction: 319,072 kg
B) CONCEPT 1 B) CONCEPT 1
C) CONCEPT 2
Annual electricity saving: 397,120 kW of electricity
CO2 reduction: 395,928 kg Coal saving: 128013 kg Dust reduction: 87,049 kg

Savings in electricity costs: 73,607 € Savings in electricity costs: 91,337€

Dust reduction: 108,017kg
Initial Cost Initial Cost
395,928 kg 158,848 kg 108,017 kg Performance Assesment
C) CONCEPT 2
Coal saving: 158,848 kg
