16 minute read
Investigation into the Dynamic Particle Generation of Lubricating Greases


Jason T. Galary, Gus Flaherty
Nye Lubricants, Inc.
The purpose of this study is to examine the phenomenon of Dynamic Particle Generation in Lubricating Greases that are used in a variety of applications in critical Industries which include Aerospace, Semiconductor Manufacturing, Medical, and Cleanrooms. This Particle Generation occurs in bearings, ball screws, and other mechanical devices when dynamic conditions are present and should not be confused with Outgassing which is related to the pressure effects on a system. This is a critical factor in many systems as particle generation can contaminate critical systems or processes causing them to fail. These failures can lead to excessive costs, production lines going down, and equipment damage.
In this study, various PAO lubricating greases made from different thickener chemistries were tested to evaluate their particle generation properties. This particle generation phenomenon was studied using a custom test rig utilizing a high precision cleanroom ball-screw to simulate true application conditions. The ball-screw was tested at speeds from 200 RPM to 2,400 RPM to illustrate the effect of speed on the particle generation across different applications. This paper will show the tendencies of certain base oils and thickener chemistries to generate particles and which ones present advantages of improved durability and environmental cleanliness for critical processes and applications.
KEY WORDS: Particle Generation, DOE
Introduction
The thought of Particle Generation is one that haunts many Engineers’ minds especially if they are working on applications in the Aerospace, Semiconductor, or Clean Room industries. The idea of foreign particles of unknown or dubious nature flying through the air (or travelling through vacuum) only to deposit on a critical area like a semiconductor fab, optical sensor, or even into the human body as the case may be with medical robots for surgery can certainly bring nightmares. This has been such a critical area and movement in the last thirty years and given rise to Clean Rooms manufacturing and the characterization of air cleanliness.
The focus for so long has been on the quality of the air in the room and the perception has long been that lubricants are a source of contamination in cleanroom and vacuum environments. In order to alleviate the worries of many customers across various applications and industries, the solution over the last twenty years has been to Ultrafilter1 the lubricant to reduce the number of particles and the size of them.
There are three levels for cleanliness in a grease:
• Unfiltered grease – Can contain particles larger than 75 µm. • Filtered or so-called “Clean” grease – For example MIL-G81322 Aircraft grease cannot have any particles greater than
75µm and there must be fewer than 1,000 particles/cm3 between 24µm and 74µm. • Ultrafiltered or “Ultraclean” grease – Such as
MIL-G-81937 must not contain any particles greater than 35µm. In addition to this it cannot have more than 1,000 particles/cm3 between 10µm and 34µm in size.
This process will certainly help remove bulk and “hard” contaminants which will lead to smoother operation and lower noise in applications like bearings and ball screws but it may have little effect in regards to the amount of particles “shed” or generated from a lubricant in a dynamic condition.
This question has long stuck in our minds, wondering what the lubricant was truly doing and how the base fluid, thickener, additive, and manufacturing processes effected this property and ultimately the application environment around it. The first step to investigate this new area of lubricant properties required the construction of a new test apparatus and creation of an accurate and repeatable test method.
Objective for Testing:
The primary purpose of this study was to develop a new test method and apparatus that could be used to accurately and repeatedly measure the Dynamic Particle Generation of a lubricating grease.
The Key Factors of this study will be:
1. The repeatability and statistical significance of Dynamic Particle Generation results. 2. To study the effects of different lubricating thickeners that all utilize the same PAO base fluid. 3. To examine the effect that speed plays on the particle generation of a particular system 4. To examine the profile of the particle generation results plot; that is how the system behaves with respect to time and number of particles generated.
Experimental Test Method:
To compare the dynamic particle generation characteristics of various lubricating greases, a custom test apparatus was designed and built to detect, analyze, and classify the products being examined. As this is a newly created test method and fixture, a DOE project was also put together to investigate repeatability, functionality, and statistical significance.
The core of the test apparatus is a high precision cleanroom ball screw assembly meant for low outgassing applications. This ball screw design was used due to the fact that when lubricated correctly and under light load, a ball screw assembly experiences virtually zero wear on its components. Since a ball screw assembly utilizes a system of rolling elements, the amount of frictional wear on any components especially under no load is greatly reduced. With the addition of a lubricant that provides a protective layer between all surfaces, the main component of wear on the system is the lubricating grease, which then generates the particles being examined in this study. This ensures that the particles generated in the dynamic system are purely generated from the lubricating grease.
To supply clean, filtered air to the system, a laminar flow clean air handler supplies clean ISO 2 Class air to the system. The air handler can deliver filtered air at a range of velocities, depending on operator input, but for the sake of repeatability and comparison, a velocity of 1m/s +/- .25 m/s was used for all testing. This value was decided on after investigating the average volume of clean air turned over in a clean air environment. This filtered air passes over the test system as the ball screw assembly operates for the length of the test.
Particles are collected via an inlet tube mounted at the end of the ball screw assembly. The location of the pickup tube is key, as it captures only particles generated by the grease on the ball screw, and none generated by the servo motor, bearings, linear guides, or flex coupling. The pickup tube leads to a Light-scattering Airborne Particle Counter. The particle counter features simultaneous 5-stage particle measurement of .3µm and above, .5µm and above, 1µm and above, 2µm and above, and 5µm and above via the use of a transverse light-scattering system which provides the most accurate and repeatable measurements available.
During the test a particle count profile is then constructed, plotting the count of each category vs test duration. This profile chart is an important asset to have in order to understand the behavior of the grease being run as two greases may share the same ISO cleanliness
value, but may have completely different particle distribution profiles over the duration of the test.
The dynamic particle generation test apparatus has the ability to run at 3 rpm’s, 200, 1,200, and 2,400 RPM. This translates to .02, 0.1, and 0.21 m/s of linear velocity, respectively. Comparison between greases should only be conducted at like rotational speeds, as particle generation typically increases as RPM increases. For this study we will only be looking at 1,200 and 2,400 RPM.
Grease is applied to the ball screw assembly at 200RPM with a sample volume of 2cc being applied via syringe and a 10 cycle run-in to evenly distribute the grease. The test begins with the motor stationary while the particle counter takes a series of background readings. The number of readings taken is user defined. The average of these background readings are subtracted from the particle count under dynamic conditions before ISO, JIS, or Federal Classes are calculated. This ensures that the particles being counted are only those produced by the grease and not the filtered air passing over the system.
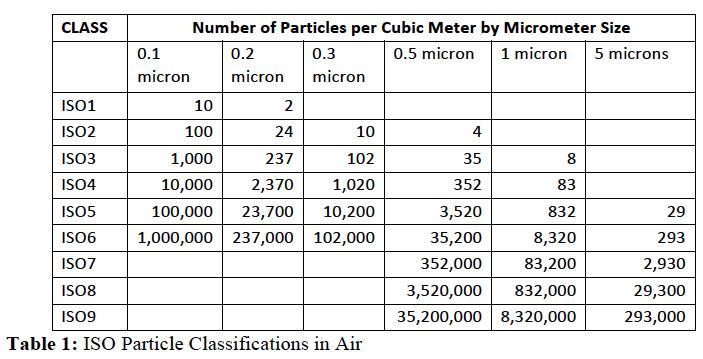
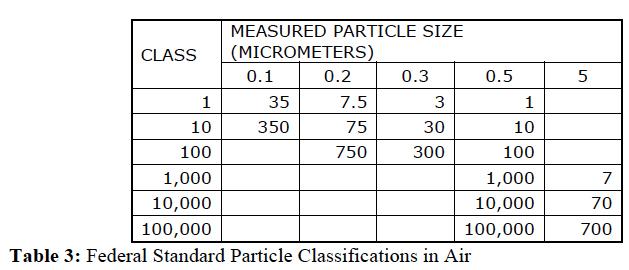
At the conclusion of the test, the collected data is compared against the ISO classification table and the ISO, Federal, and JIS classification are determined. All run parameters, a plot of the data collected over time, and the class are reported out to a prefabricated report template to be sent to the customer.
The ISO cleanliness levels are determined by the following formula and table.
Cn = 10N x [ 0.1/D ]2.08 (2)
Where
Cn = represents the maximum permitted concentration (in particle/m3of air) of airborne particles that are equal to or larger than the considered particle size; Cn is rounded to the nearest whole number
N = ISO class number, which must be a multiple of 0.1 and be 9 or less
D = the particle size in microns
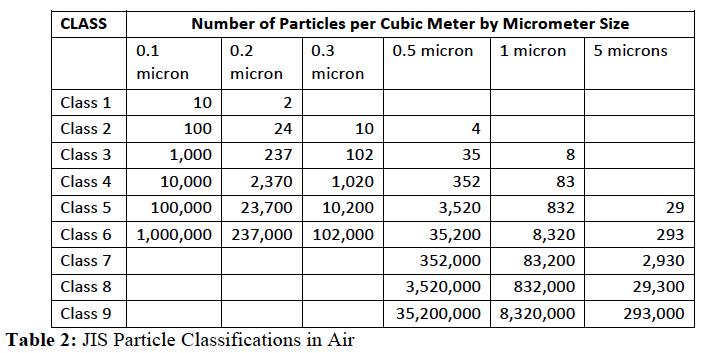
The JIS cleanliness levels are determined by the following formula and table.
Cn = 10N x [ 0.1/D ]2.08 (3)
Where
Cn = represents the maximum permitted concentration (in particle/m3of air) of airborne particles that are equal to or larger than the considered particle size; Cn is rounded to the nearest whole number
N = JIS class number, which must be a multiple of 0.1 and be 9 or less
D = the particle size in microns
Repeatability and Statistical Significance:
To validate this new experimental test method, materials were tested with a minimum of three replications. Afterwards, statistical analysis was performed on the sample sets to look for any statistically significant differences. Different lots of the same material and different sections of a specific batch were also tested.
Repeatability between Tests (Same Material, Same Operator).
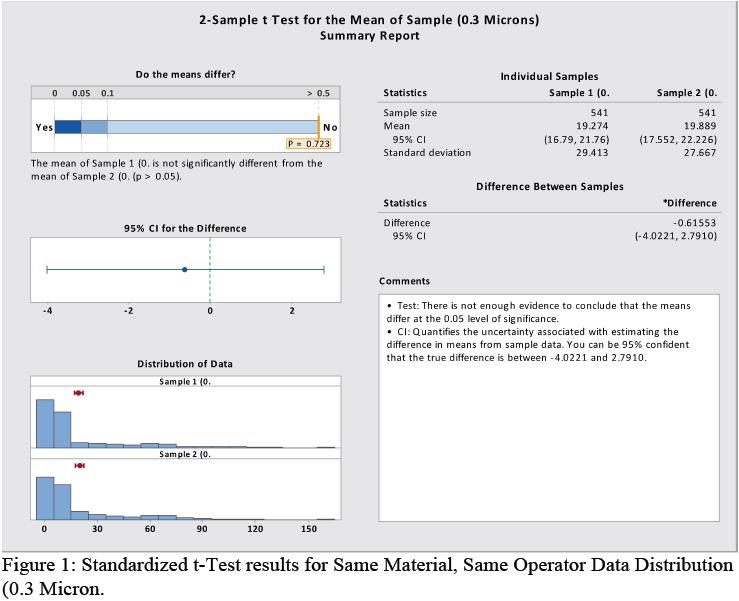
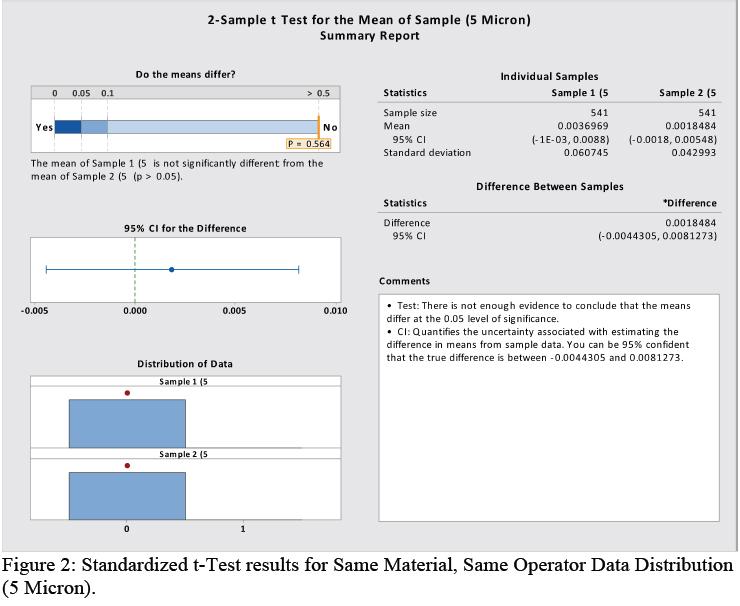
The results of statistically testing the same material multiple time with the same operator and using a Standardized t-test on the data shows that the means of the data are equivalent. A 95% confidence interval was constructed and the means of both sample distributions fall within these intervals. Based on this we can conclude with 95% confidence that the two samples have the same mean and this test equipment produces reproducible results.
Testing the same material from different lots with the same Operator.
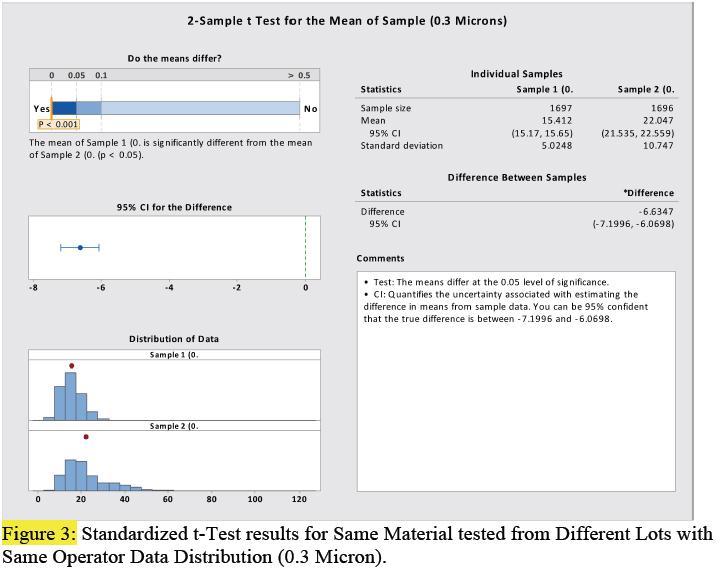
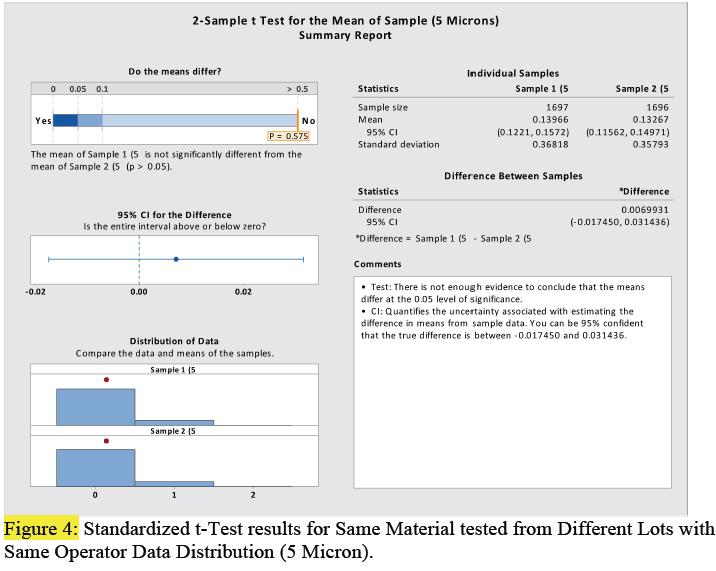
The results of statistically testing the same material from different lots with the same operator and using a Standardized t-test on the data shows that the means of the data are significantly different. A 95% confidence interval was constructed and the mean of the 0.3µm sample distributions did not include all values from both sets. Based on this we can conclude with 95% confidence that the two samples do not have the same mean and there were significant differences between the different lots tested.
Results and Discussion:
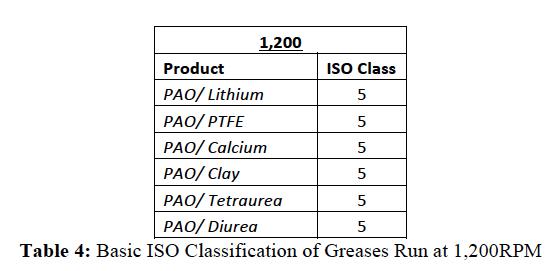
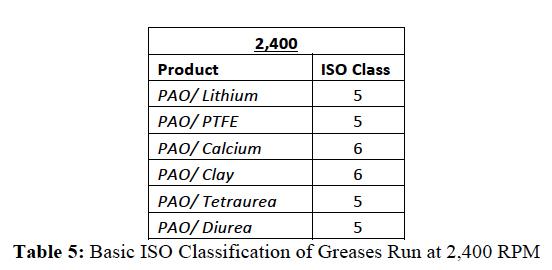
Tables 4 and 5 Summarize the ISO classifications for the six different greases that were studied in this experiment, at 1,200RPM and 2,400 RPM, respectively.
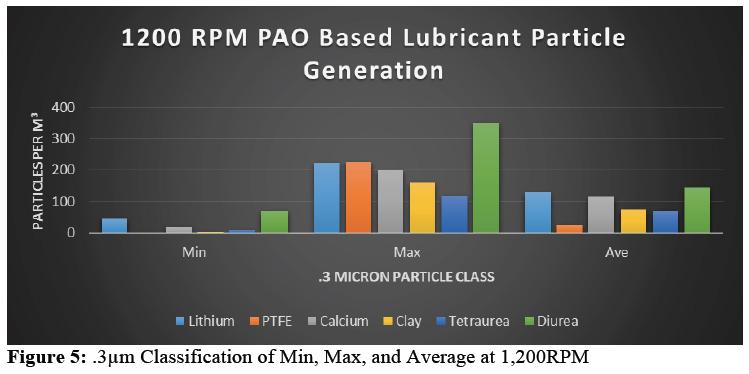
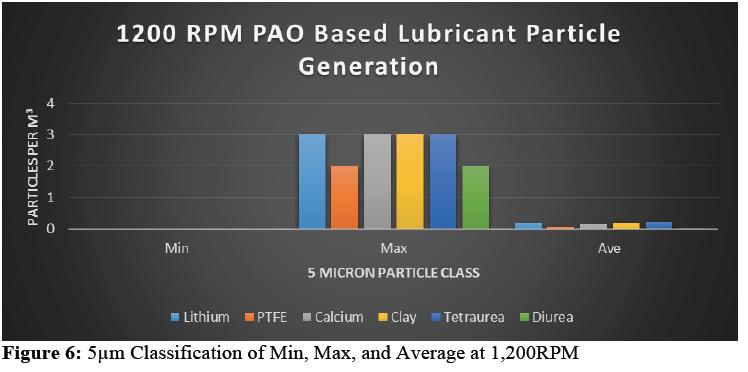
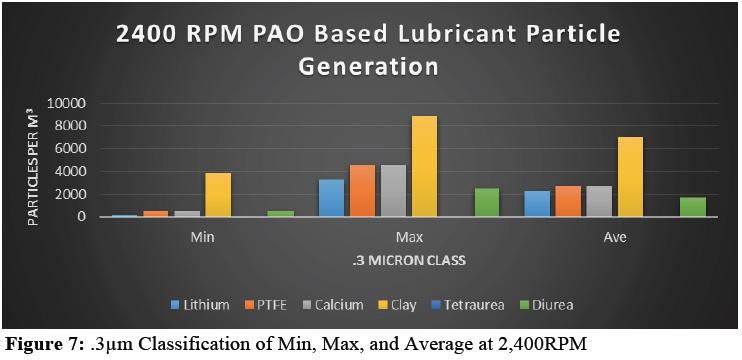
Figures 5-8 highlight the comparison between lubricants in relation to motor speed and particle size. (Note: For simplicity of comparison, only the smallest (.3µm) and largest (5µm+) particle size categories were examined.
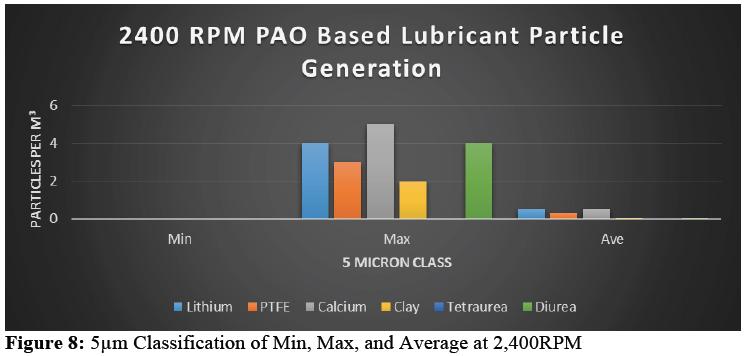
The Urea based thickeners have performed the best in this study with PAO as a base fluid. The tetraurea version did outperform the diurea. The size, complexity, and shear stability of the urea structures are helping to keep the lubricant anchored to the surface and lowering the probability of particles from escaping the thickener matrix and becoming particle generation.
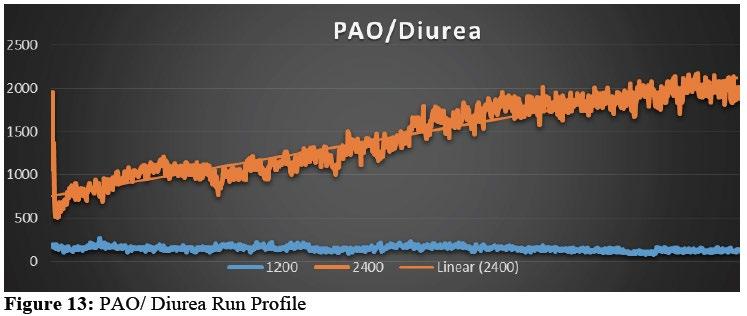
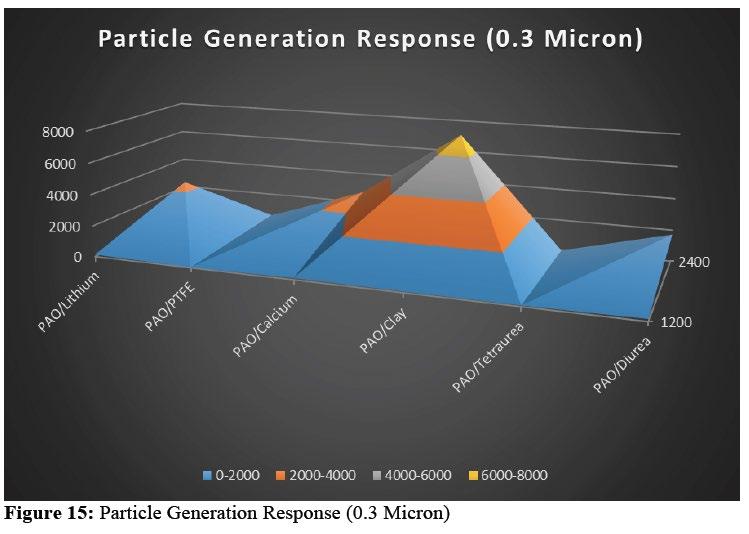
One curious result from the study is that the diurea based material generated almost double the amount of 0.3µm particle at the lower speed/shear than all of the other samples. The first thought might be that this amount of particle generation is from initial startup and wear in but as seen in Figure 13 this trend continues for the life of the test. At the same time the clay thickened material produced one of the lowest results. But once the samples were tested at a higher speed/sheer then we saw results that align better with expectations of these chemistries with the diurea generating a much smaller amount of particle and the clay generating the highest as there is very little more than a mechanical bond holding that system together. In low speed/shear conditions the clay grease and its distribution of smaller thickener particles are free to move around and stay bound together. Once the speed/sheer is increased then these materials have a higher tendency to agglomerate and create internal friction forces which will then allow some of the particles to be freed from the thickener system and out of the ball-screw.
Additional testing on different grades of diurea thickener as well as various speed/shear rates, manufacturing process, filtration, etc will be looked at in the future to determine why this PAO diurea grease generated almost double the amount of 0.35µm or smaller particles compared to all the other thickeners.
While the ISO classification system is very useful for classifying air cleanliness levels, it is lacking when used as a comparative tool for lubricants as all of the samples at both 1,200 and 2,400 RPM received either an ISO Class 5 or 6 rating. This is mainly driven by the 5µm particle requirement in the ISO/JIS/Fed Spec. Without any other way to compare materials, this would leave profile analysis as one of the only simple tools to differentiate between classes beyond a more complicate statistical analysis. To help differentiate materials, we broke each particle size sample set into ISO class sub-classes, which yields more differentiation between materials tested. Tables 4 and 5 break out the ISO sub-classes into a .1 increment scale (using previously mentioned formula2). The highest classification per chemistry is highlighted in bold.
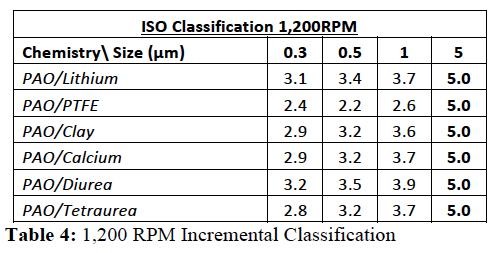
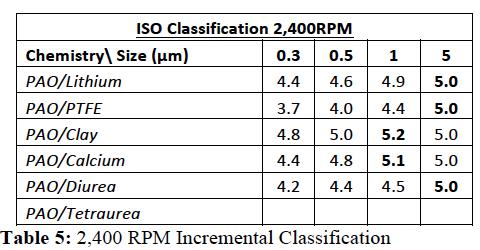
From this data we can see that the majority of classifications were driven by the particle result in the 5µm+ range. As Table 1 shows, in order for any grease to be rated at anything less than an ISO Class 5 there must be zero particles present at 5µm+ category even if the remaining categories consistently rate lower. Due to this requirement all of the greases run in this study were classified as an ISO Class 5 or higher.
Examining the run profile of the greases, it can be noted that all runs displayed an upward trending profile at 2,400 RPM. Figures 9-12 illustrate the run data profile associated with motor speed and a .3µm particle size.
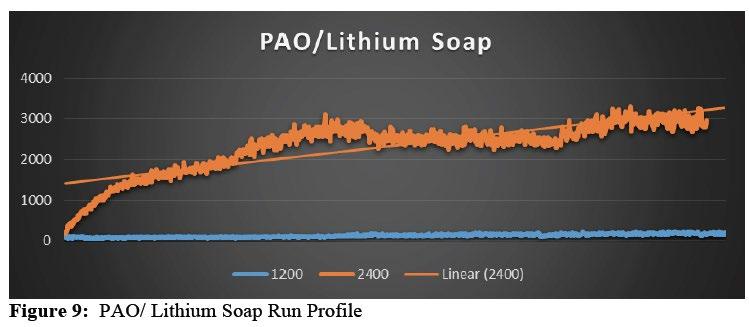
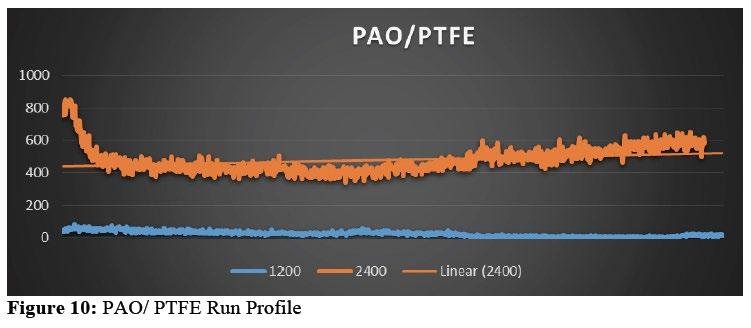
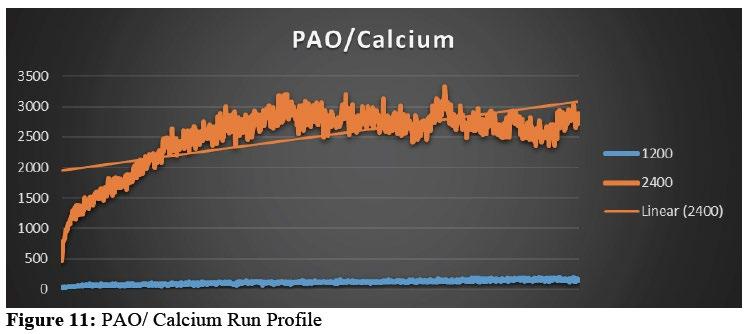
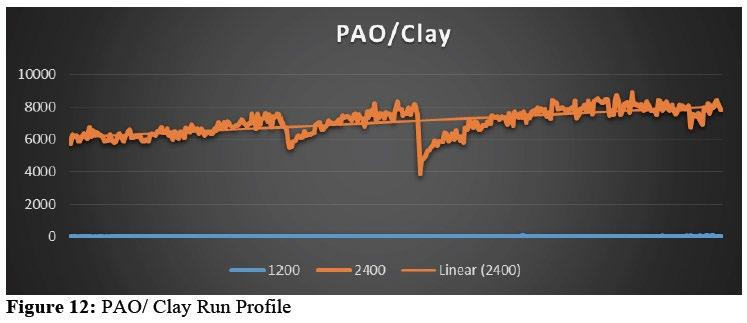
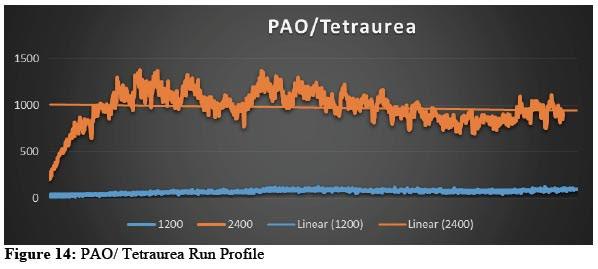
The steady increase in particle generation over the duration of the test can be attributed to many factors which will need to be investigated in future work. This increase as a factor of speed could be a result of the nature of the PAO chmistry to shed particles, not fully maximized thickener, Manufacturing process, etc.
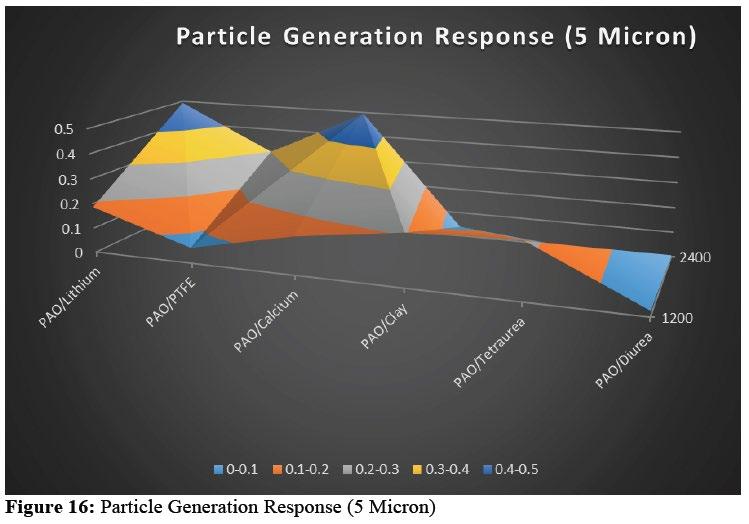
Figures 15 & 16 graphically illustrate the particle generation response of the various lubricating greases with speed of the ball screw as a factor.
The classification of particle generation of lubricating greases in dynamic conditions is a new area that we are just starting to explore. As presented in our study, many factors play into the behavior of a grease in respect to particle generation characteristics. Variables such as run speed, base oil chemistry, and thickening agent properties all play into how a grease will perform in a clean room environment.
We have developed a new test method that has proven to be repeatable and reproducible. This method can differentiate between materials, lots, and chemistries. Looking ahead this new testing method for Dynamic Particle Generation could be used not only for comparing products but also for Quality Certifications or R&D investigation into particle distribution in a lubricating grease or effects of processing equipment.
We now have a small set of data that is giving us a glimpse into the effects of thickening agents on particle generation. With more complex and in-situ thickeners providing a better matrix for the oil to hold onto as well as helping bond with the surface, they are at the top performers in this new performance measurement. The innate shear stability of these thickeners also helps them perform in this measurement as the thickener is less likely to be broken down which would allow particles to be freed from the thickener matrix and into the environment as particle generation.
The ability to plot particle generation over time and see differences in the distributions of various materials/lots, this will help us to form hypothesis about particle generation over time using normalized probability. Utilizing this type of analysis can also be used to predict lubricant service life. From these estimations, maintenance schedules could be determined which would help to keep units performing optimally.
The future goal is to develop a lubricating grease which will produce no more particles than its environment is rated for. Ideally a lubricant can be developed that will generate less particles than the clean air system that is being used in an applications environment. When this is accomplished, it will give end users the confidence that the lubricant they are using will not contaminate their clean environment or possibly effect their application
Future Work
We would like to expand testing to include additional lubricant chemistries and thickener combinations including Esters, Mineral Oils, Phenyl Ethers, PFPE’s, and Multiply-Alkylated Cyclopentanes. We also plan to investigate the effects of different types of manufacturing processes and their effect on the particle size of thickeners and the resultant Particle Generation. Finally we will also add additional tests to run the samples investigated in this study for longer periods of time to look at the trend of particle generation.
Acknowledgements
We would like to thank our colleagues in the Application Development and Validation Testing (ADVT) Lab at Nye Lubricants Inc. who conducted the Dynamic Particle Generation testing, specifically Mason Wood. We would also like to Akira Nogami from THK Inc., for his collaboration on this project development and his help on the optimal ball-screw design. Finally we would like to William Galary for all of his support and consultation about the Clean Room Industry and its technologies.
References
[1] Galary, William: Ultraclean Grease. Journal of Advancing Applications in Contamination
Control 1999; Volume 2, No. 7:23-27
[2] Cleanrooms and associated controlled environments Part 1 : Classification of air cleanliness. ISO 14644-1 1999;
[3] Classification of air cleanliness for cleanrooms. JIS B 9920 2002;
[4] Cleanroom and Work Station Requirements,
Controlled Environments. Federal Standard 209 1963;


