NEWS
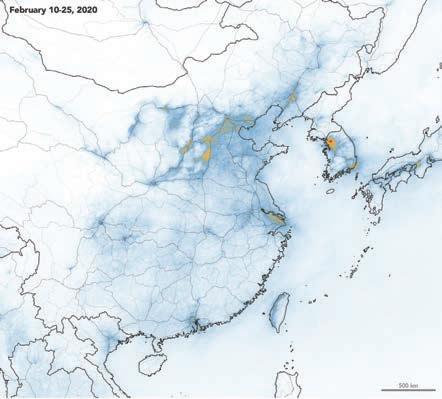
Locked down, but breathing freely Some of the most striking images of lockdown around the world have been the blue skies of cities ordinarily choking in smog. From New Delhi to Los Angeles, Beijing to Paris, the changes were so remarkable they were visible from space. Scientists commented that while there have been other incidents that led to measurable decreases in nitrogen dioxide (NO2) and nitric oxide (NO) emitted by vehicles and industry, none had been so intense or happened as quickly as the global shutdown prompted by Covid-19.
Throughout Level 3, when restrictions were eased, concentrations of traffic pollutants rebounded to between 47% and 63% of normal in Auckland and Christchurch and to about 75% of normal in Wellington. Level 2 saw levels more or less the same as pre-lockdown.
Pollution in New Zealand’s main cities followed similar patterns to those overseas. NIWA air quality scientist Dr Ian Longley kept a close eye on our air throughout Levels 4 and 3 and provided weekly updates. It was a complex exercise that necessitated the use of unverified data due to the many restrictions operating, but it provided a compelling insight into how much our air quality improves when we keep our cars at home.
Ian says this rare occurrence has provided the opportunity for a natural experiment to improve our understanding of the different health impacts of air pollution.
Ian found that under Level 4, concentrations of road traffic exhaust pollutants were about 25–35% of normal in Auckland, Wellington and Christchurch. The drop was sharp and immediate but not quite as pronounced in Queen Street, Auckland’s main street, where the drop was about 45% of normal.
“Although air quality changed dramatically across the cities monitored – and probably all other towns and cities too – the benefits would not have been experienced equally,” Ian says. “Air quality was improved in our home neighbourhoods, around our workplaces and on the roads we use to travel from one to the other, but to slightly different degrees. Our personal experience was therefore determined by where we live and work and how we experienced lockdown.”
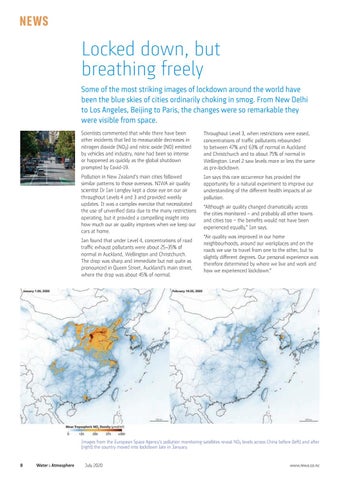
Images from the European Space Agency’s pollution monitoring satellites reveal NO2 levels across China before (left) and after (right) the country moved into lockdown late in January.
8
Water & Atmosphere
July 2020
www.niwa.co.nz