A civic ecosystem has been burgeoning for decades in the South and it offers a path to turn the tragedy of the pandemic into an opportunity to build prosperity and progress for all. Data and civic engagement will be critical for this to occur Together, the Southern Economic Advancement Project (SEAP) — which works to lift up policies that address particular vulnerabilities in the South — and Fair Count whose work focuses on strengthening pathways to continued civic participation partnered with the National Conference on Citizenship to document the state of the South during the pandemic. State and local governments prioritizing projects for the American Rescue Plan, the Bipartisan Infrastructure Law, and the Inflation Reduction Act can use these findings to target disparities that ultimately undermine community resilience and prosperity
The worst of the pandemic may now be over, indicated by the number of overall deaths falling in recent months to “normal.”[1] But what’s considered “normal” for the U.S. is abnormal compared to our peers As compared with Western Europe, the U S had over 400,000 excess deaths annually pre-Covid.[2] Pregnancy-related and overdose death rates were both 3 times higher than in other wealthy countries, and gun suicide rates were 8 times higher before Covid hit.[3],[4] The Covid crisis accelerated these and other trends, and the impacts will be felt for generations Our review of 25 indicators includes a number of breakdowns by race and ethnicity to highlight the disparity of impacts across Americans.
Health The mental health shocks associated with the pandemic drove up overdose death rates, which remain 40% above pre-Covid, and motor vehicle deaths, which remain 10% above pre-Covid. Overdose death rates are highest among American Indian, Black, and white Americans. Motor vehicle death rates are highest among American Indian and Black Americans. Pregnancy-related death rates are still 10% above pre-Covid, and are 2.5 times more likely among Black as white Americans. Firearms are now the leading cause of death for American children up 37% since 2019. Black kids are 5 times more likely to die from gunfire than white kids, yet the majority of gun deaths among white kids are suicides. Long Covid is now the 3rd leading neurological disorder in the U.S. and is particularly severe for Americans who got Covid

Pandemic to Prosperity July 19, 2023 1
before the Omicron outbreak in late 2021 or were unvaccinated. And as we experience hotter and longer heat waves, it’s no surprise that heat-related deaths have spiked 88% since 2019.
Economy and financial well-being The nation is still growing jobs, reaching a new record of 156.2 million in June. But employers continue to struggle to find workers with nearly 2 job openings per job seeker despite the fact that labor force participation rates are on par with pre-Covid. The labor market will remain tight with hundreds of thousands fewer workers due to excess deaths. Meanwhile, inflation has fallen to 3% but paying basic expenses is still difficult for ½ of all Black and Hispanic families and ⅓ of white and Asian families. Across the South, 25% of renters spend the majority of their income on housing, and 13% of Southerners went hungry in June. College tuition for a 4-year degree has more than tripled from $5,000 in 1969 (in 2021 dollars) to over $16,000 in 2021. Roughly 44 million borrowers owe $1.5 trillion in student loan debt, and the resumption of student loan payments in October is expected to reduce consumer spending by some $70 billion each year.
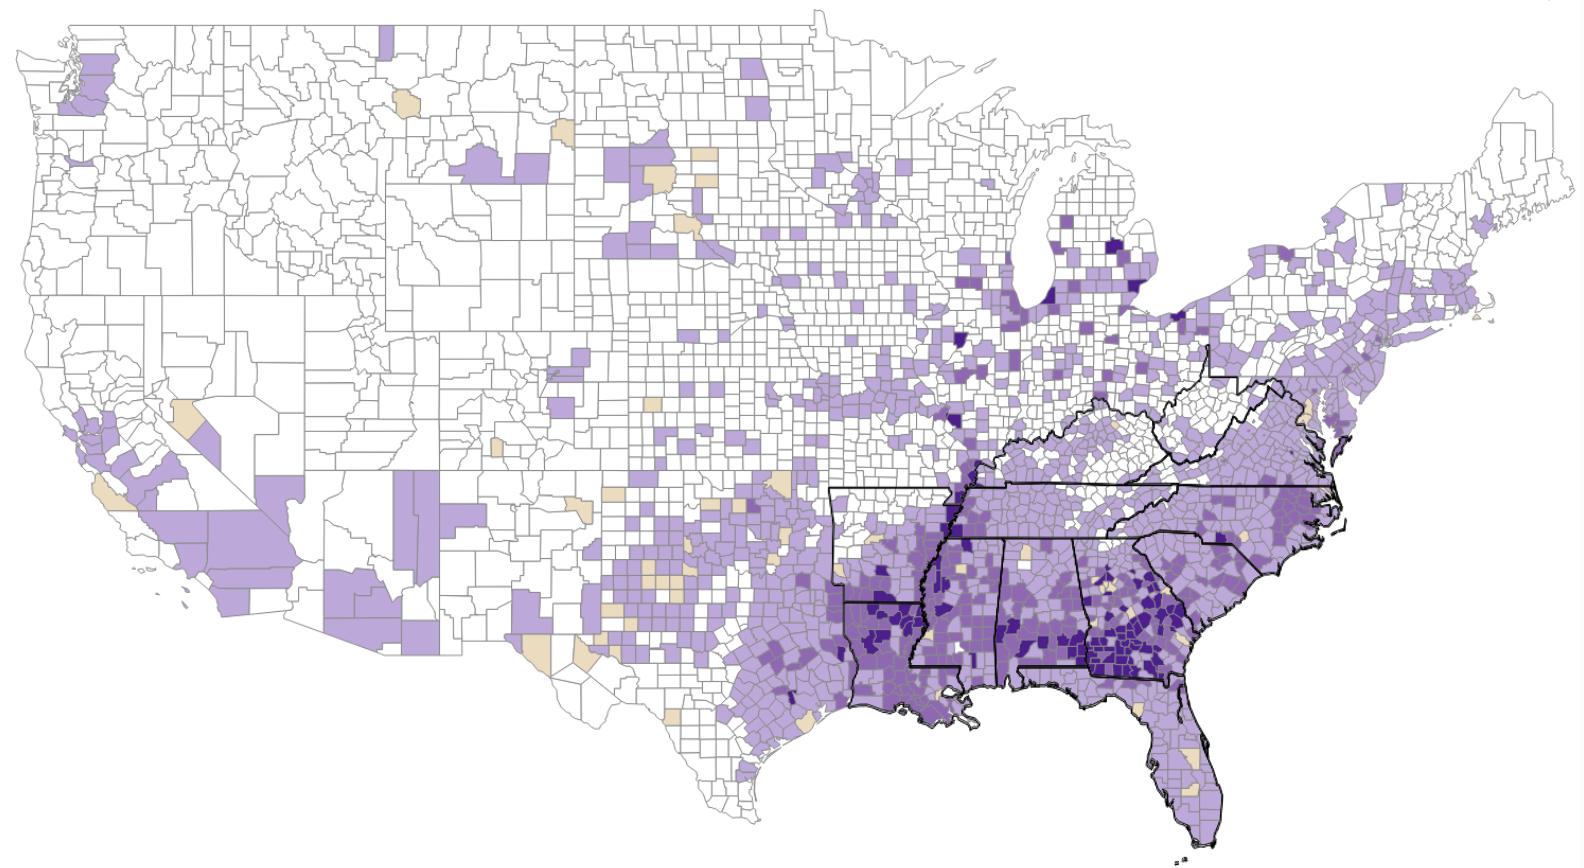
Democracy The share of Black votes was less than the share of Black registrants in more than 95% of Southern counties in 2020. And from January 2021 to May 2023, 27 states (including 8 Southern states) passed voting laws that make it harder for Americans to vote. 11 Southern states have state Supreme Courts that lack the racial diversity of the state's population. All 12 Southern states have introduced anti-LGBTQ legislation and 9 have passed them into law. Meanwhile, 1 in 3 LGBTQ youth reported they have been physically attacked, and 1 in 4 LGBQ+ high school students have attempted suicide a crisis that experts expect will be exacerbated by the new wave of anti-LGBTQ legislation.


As emergency food stamps end, people lose their Medicaid insurance due to the end of the pandemic emergency coverage, and graduates resume making student loans payments, financial challenges may increase for many Americans. Many state and local officials have remaining American Rescue Plan dollars which they can deploy to address their community’s needs. Despite state laws that make voting more difficult, organizers can build networks and infrastructure now that will support voter education and mobilization efforts for elections in 2023 and 2024.
Dr Jeanine Abrams McLean President, Fair Count Executive Director, The Southern Economic Advancement Project
Pandemic to Prosperity July 19, 2023 2
TABLE OF CONTENTS
DEFINING THE SOUTH: Racial/ethnic group representation
PANDEMIC: LIVES AND LIVELIHOODS
Covid vaccinations
Long Covid
Drug overdose deaths, by race/ethnicity
Motor vehicle deaths, by race/ethnicity
Total jobs
Quits rate
Employment rate, by race/ethnicity
Heat-related deaths by race/ethnicity
PROSPERITY: GOVERNMENT
Census-driven federal funding
Vote share gap
State voting laws
Anti-LGBTQ laws
State supreme court diversity gaps
PROSPERITY: INSTITUTIONS
College tuition and fees
Lack of health insurance coverage, by race/ethnicity
Lack of internet, by race/ethnicity
News deserts
PROSPERITY: PEOPLE
Difficulty paying expenses, by race/ethnicity
Renters with severe housing cost burdens
Likelihood of eviction or foreclosure
Food insecurity
Pregnancy-related death rates, by race/ethnicity
Gun deaths among children, by race/ethnicity
Anxiety or depression
Youth mental health
REFERENCES ABOUT, AUTHORS, AND ACKNOWLEDGEMENTS
Pandemic to Prosperity July 19, 2023 3
DEFINING THE SOUTH
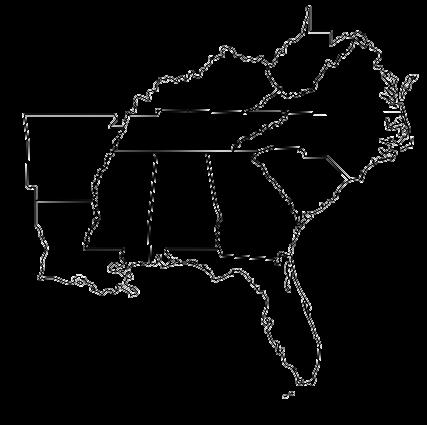
In this report, the South is defined as the 12 states of Alabama, Arkansas, Florida, Georgia, Kentucky, Louisiana, Mississippi, North Carolina, South Carolina, Tennessee, Virginia, and West Virginia.

Southern states include 217 of the 221 U.S. counties where the Black population is uniquely greater than the national average. ation of racial/ethnic group by county 2021
The Black Belt, vestiges of a there. The Appalachian dominated b struggled from job training,
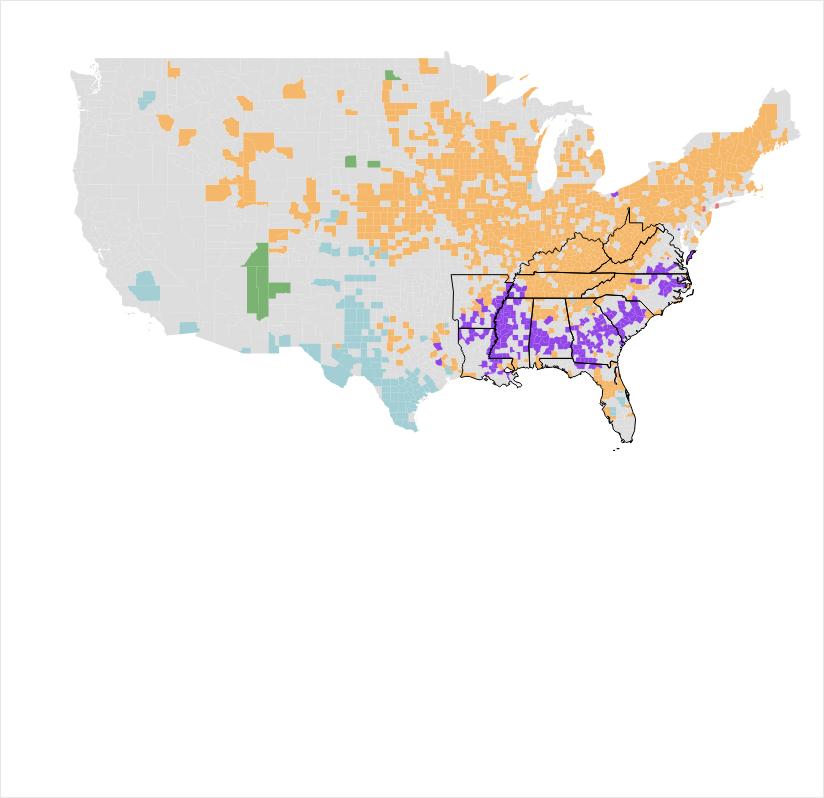 Source: U S Ce county. Multi-e
Pandemic to Prosperity July 19, 2023 4
To recover from any disaster, an assessment of damages is essential. Covid exacerbated multiple health and economic trends. As such, tracking Covid-related damage requires monitoring a number of metrics, each of which may change as conditions change. Additionally, shocks and stressors such as extreme weather continue to compound the nation’s distress.
In later sections of this report, these indicators serve as context for a unique analysis of the complex interactions between recent shocks, the nation’s civic health, and Americans’ well being.

Indicators in this section
● Covid vaccinations
● Long Covid
● Drug overdose deaths, by race/ethnicity
● Motor vehicle deaths, by race/ethnicity
● Total jobs, by month
● Quits rate, by industry
● Employment rate, by race/ethnicity
● Heat-related deaths, by race/ethnicity
Pandemic to Prosperity July 19, 2023 5
8 of 10 states with the lowest Covid vaccination rates are in the South. Only about 13% of Southerners are up-to-date.
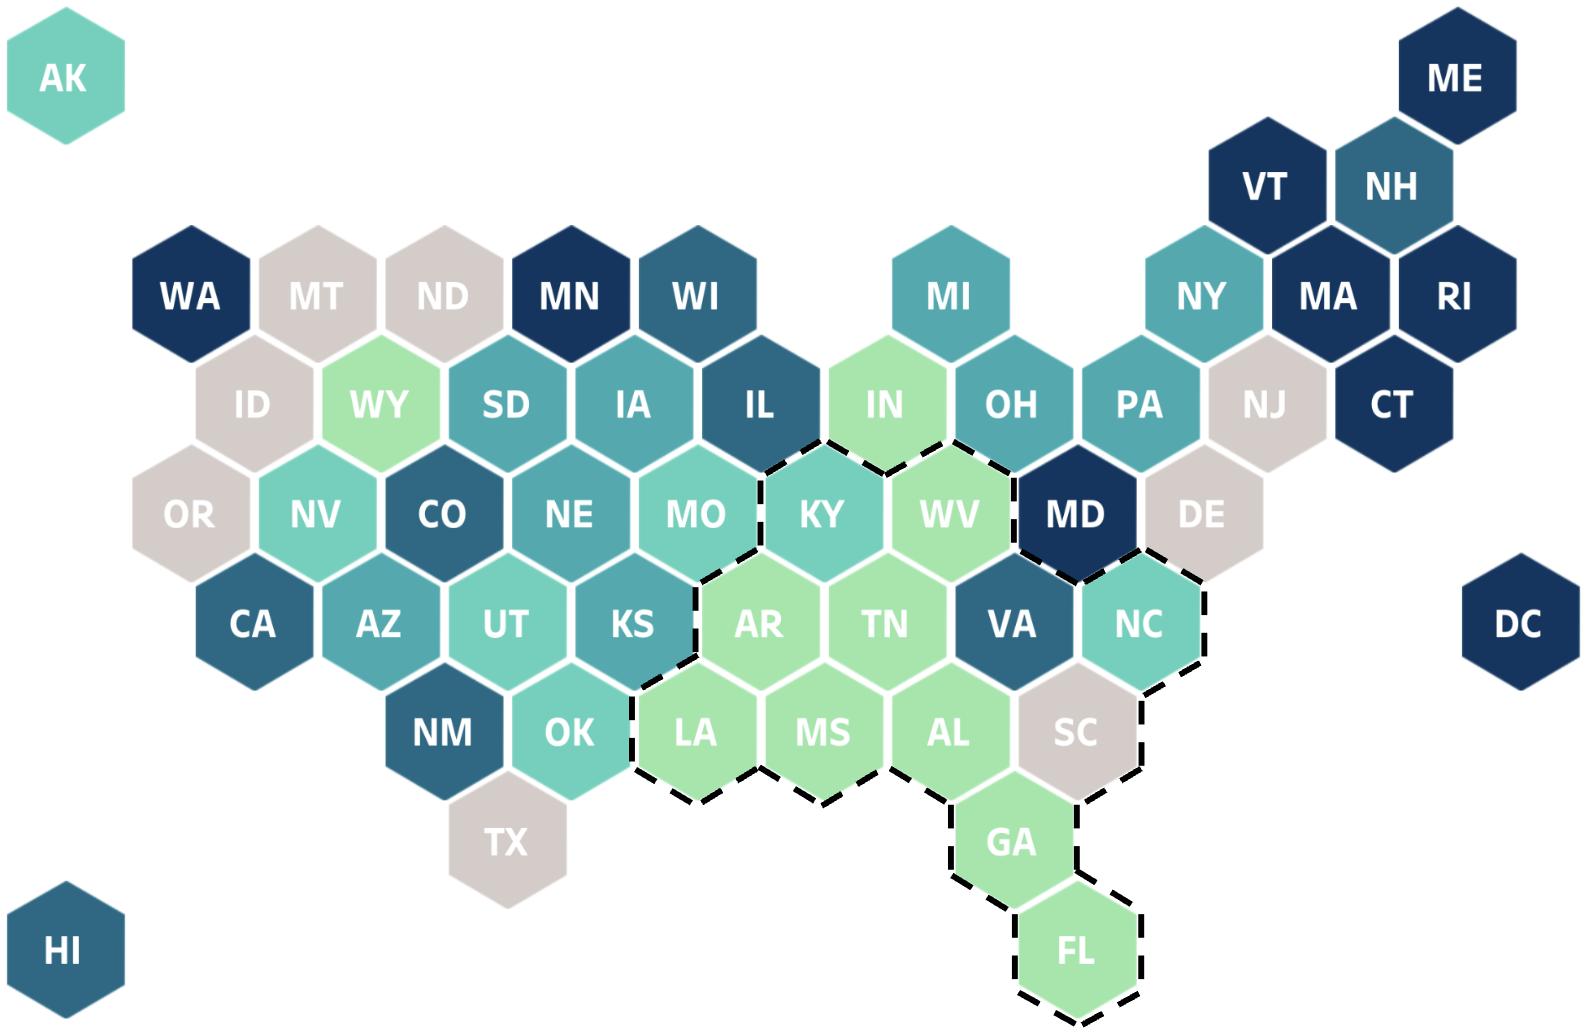
Percent of population who are up-to-date with Covid vaccines
Source: CDC Notes: States without data have chosen not to report their vaccination data to the CDC Adults and children aged 6 years and older are up-to-date with Covid vaccines if they got a bivalent (updated) Covid vaccine. Definition of up-to-date for children 6 months- 5 years is available here
The U.S. Department of Health and Human Services ended the Covid public health emergency in May 2023, transitioning or terminating a number of programs and benefits that improved access to Covid care.[1] Though Covid vaccination remains free through the CDC Covid-19 Vaccination Program, only 19% of Americans are up-to-date with Covid vaccines.[2],[3],[4] Southerners are lagging, with just 13% of Southerners up-to-date compared to 21% of Non-southerners. 8 of 10 states with the lowest vaccination rates are in the South: MS (7.1%), AL (8.0%), LA (8.1%), TN (11.1%), GA (11.2%), AR (11.6%), WV (12.2%), and FL (12.6%).
A recent survey by the CDC found that the low take-up for the bivalent Covid vaccine was due to a lack of awareness about eligibility or availability, and overconfidence in immunity [5] As the FDA discusses the future of Covid vaccines, about half of adults said they would likely get an annual Covid vaccine, similar to an annual flu shot.[6],[7] Experts recommend a multi-faceted approach to increase vaccine coverage that both conveys information about booster shots and waning immunity, and increases access to vaccination.
Pandemic to Prosperity July 19, 2023 6
Among Americans who have ever had Covid, 29% suffered from Long Covid symptoms. In West Virginia, it’s 41%.
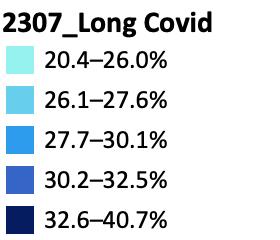
Long Covid estimates, June 7-19, 2023
P previously had Covid, with symptoms lasting 3 months or longer
Source: Census Bureau’s Household Pulse Survey
Among Americans who previously had Covid, 29% experienced prolonged symptoms, known as Long Covid.[1] Long Covid is the third leading neurological disorder in the U.S., and continues to impact millions of Americans across the nation.[2] Long Covid largely affects immune and circulatory systems, as well as the brain and lungs.[3],[4],[5],[6] In a new study by the National Institutes of Health, patients and researchers identified over 200 symptoms associated with Long Covid.[7] The study also found that Long Covid was more common and severe for patients who had Covid before the Omicron outbreak in December 2021 or who were unvaccinated. Long Covid contraction dropped from 1 in 3 Covid patients before Omicron, to 1 in 10 Covid patients after. In patients who had Long Covid as early as May 2020, a separate study from Northwestern Medicine found that 85% of patients reported decreased quality of life, 51% had cognitive impairment, 45% had altered lung function, 83% had abnormal CT chest scans, and 12% had elevated heart rate on rhythm monitoring [8]
Persistent Covid symptoms sidelined approximately 500,000 workers in 2022, equivalent to $62 billion in per-year value of labor loss supply.[9] Safe and effective treatments for Long Covid patients are crucial for overall wellbeing and the nation’s economic recovery (Total jobs).
Pandemic to Prosperity July 19, 2023 7
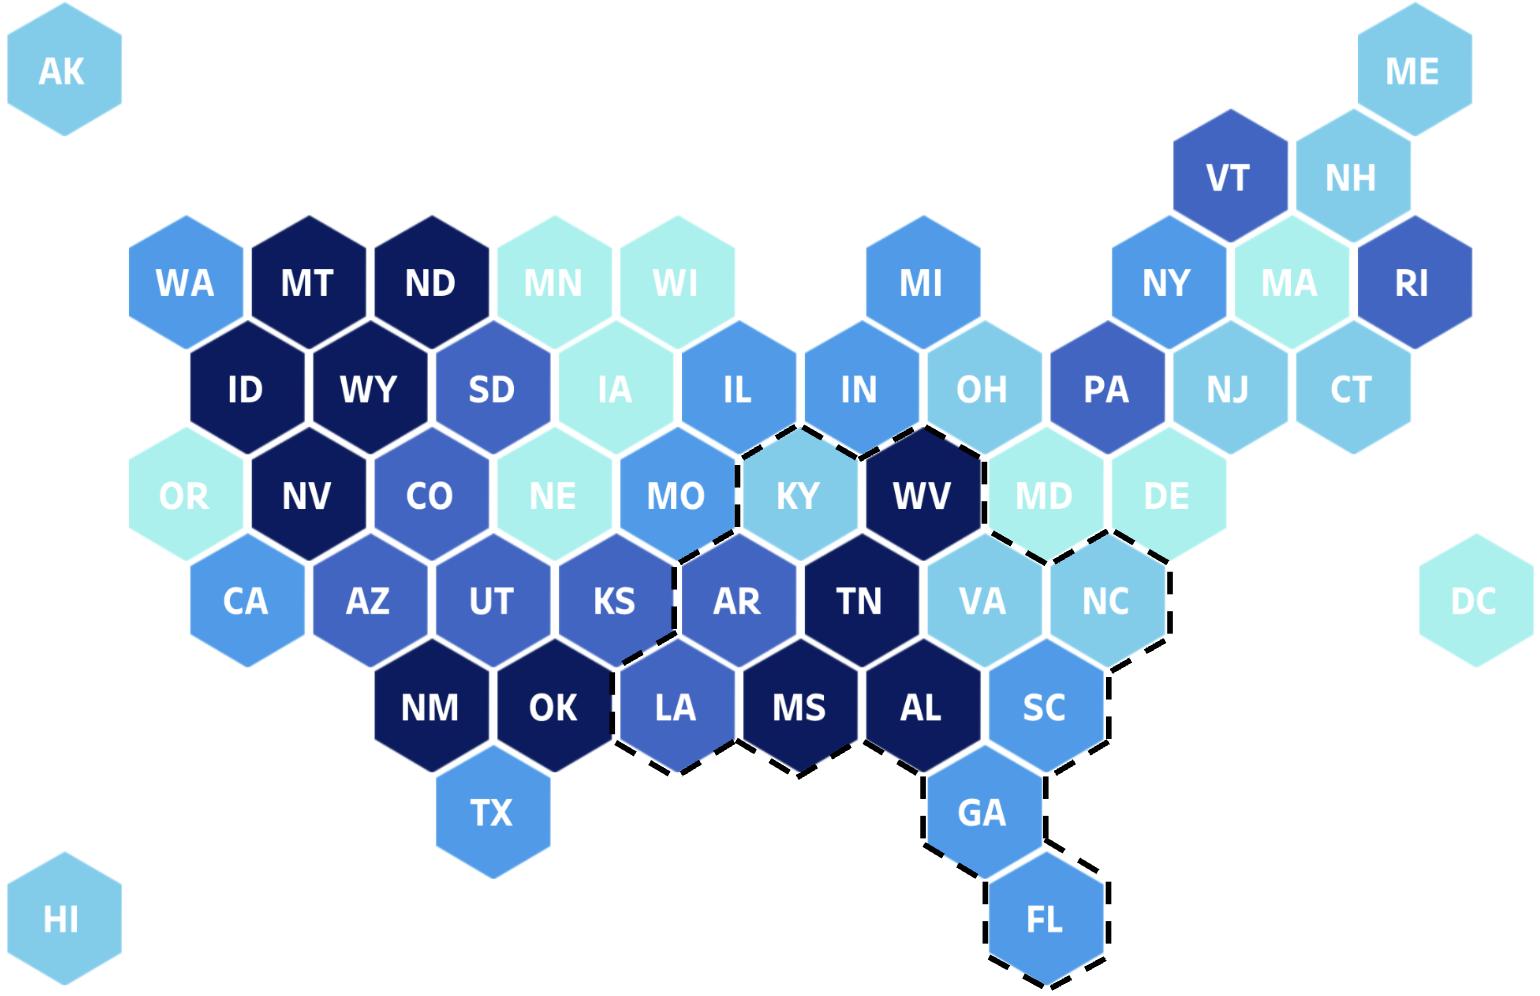
Drug overdose deaths increased 50% in two years, reaching a high of 106,699 deaths in 2021. Overdose death rates are highest among American Indian, Black, and white Americans.
Drug overdose deaths, U.S. 1999-2022
Source: CDC/Wonder Notes: 2022 data is provisional AN=Alaska Native Drug overdose deaths are identified using ICD–10 underlying cause-of-death codes: X40–X44, X60–X64, X85, and Y10–Y14.
The number of drug overdose deaths in America rose dramatically from about 17,000 in 1999 to 70,000 in 2019 (pre-Covid) and then skyrocketed by 50% in just 2 years – reaching nearly 107,000 deaths in 2021. The 98,000 overdose deaths in 2022 were still 40% above pre-pandemic.
Drug overdose deaths were a major reason why the U.S. had an excess death problem even before Covid hit.[1] In 2015, when roughly 53,000 Americans died of drug overdoses, the drug overdose rate in the U.S. was about 3 times higher than other wealthy countries.[2] High levels of suffering, pain, and distress have contributed to ballooning overdose rates, particularly in regions of the country with poor education and work opportunities, unaffordable housing, and weak social bonds and community cohesion.[3] The mental health shocks associated with the pandemic, along with the increasing impact of fentanyl, caused rates of drug overdose deaths to spike, along with deaths from alcohol, firearms, road rage and motor vehicle accidents (Motor vehicle deaths, Gun deaths among children).[4],[5],[6],[7] Drug overdose death rates have been highest among American Indians and white Americans but, since 2020, the rate of drug overdose deaths among Black Americans has surpassed the rate of white Americans.
The opioid epidemic has contributed to reduced labor force participation, particularly among men.[8],[9] In addition, researchers have found a link between despair and vulnerability to misinformation.[10] Pharmaceutical manufacturers and distributors have agreed to pay at least $26 billion to states and localities as part of the National Opioid Settlement.[11] As with American Rescue Plan funds, communities can ensure that opioid settlement funds are dedicated to community priorities by connecting and engaging with their local and state leaders, insisting on transparency, and using data and storytelling to amplify community needs.[12]
Pandemic to Prosperity July 19, 2023 8
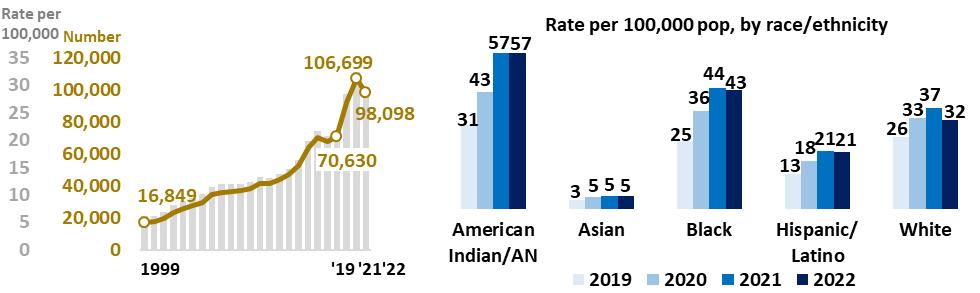
Motor vehicle deaths increased 20% in two years, reaching 46,980 deaths in 2021. Motor vehicle death rates are highest among American Indian and Black Americans.
Motor vehicle deaths, U.S. 1959-2022
Sources: CDC/ Wonder and National Safety Council Notes: Motor-vehicle deaths include all deaths arising from a motor vehicle accident, including pedestrians and bicyclists struck by a motor vehicle, as well as non-traffic motor vehicle deaths occurring in parking lots, private roads, and driveways Data for 2022 is provisional AN=Alaska Native.
Motor vehicle death rates declined by more than half between 1969 and 2014, and remained relatively low from 2015 to 2019 just before the pandemic struck. Then, although travel declined, motor vehicle death rates in the U.S. increased in 2020 and 2021, reaching roughly 47,000 deaths in 2021. Motor vehicle deaths in 2022 at roughly 43,000 remained 10% higher than pre-pandemic. Comparatively, peer nations have maintained lower motor vehicle fatality rates, with fewer increases since Covid struck.[1],[2],[3]
Non-white Americans saw the largest increases in motor vehicle death rates post-Covid. By 2022, Asian Americans experienced a motor vehicle death rate of 5 per 100,000 population, Hispanic Americans experienced 12 per 100,000, white Americans experienced 13 per 100,000, and Black Americans experienced 17 per 100,000. American Indian/Alaska Native (AIAN) populations historically have the highest rate of motor vehicle deaths, and experienced a rate of 32 deaths per 100,000 population in 2022. While studies traditionally point to alcohol and drug abuse as causes of high rates of motor vehicle fatalities, they tend to overlook the historical trauma and mistreatment of AIAN populations that are linked to these “diseases of despair”[4],[5],[6],[7],[8]
When accounting for differing levels of travel by race, studies show that Black and Hispanic Americans who are walking or cycling are more likely to be killed in a traffic fatality than white Americans.[9] The Bipartisan Infrastructure Law includes policies to improve roadway safety and infrastructure.[10]
Pandemic to Prosperity July 19, 2023 9
Although job growth has slowed, employers added 209,000 jobs in June for a net growth of 1.7 million jobs in 2023.
Total jobs by month, U.S.
Jan 2000 - Jun 2023

Source: Bureau of Labor Statistics Note: Seasonally adjusted Data for May 2023 and June 2023 are preliminary
The nation gained 1.7 million jobs in the first six months of 2023 to reach a new record of 156.2 million jobs. Overall labor force participation has been increasing and is on par with pre-Covid rates.[1] Black adults are now more likely to be participating in the labor force (62.6%) than white adults (62.3%).[2],[3] Many white men and older white women are reaching retirement or otherwise dropping out of the labor force.[4]
Despite rebounding overall labor force participation rates, employers continue to struggle to find workers, with nearly 2 job openings for every job seeker.[5] A large part of the problem is that too many working-age Americans have died. In 2020-2021, approximately 800,000 working-age Americans died, in excess of expected, due to Covid and other causes (Drug overdose deaths).[6]
Together, the Bipartisan Infrastructure Law and the Inflation Reduction Act are predicted to create over 2 million new jobs each year for 10 years.[7],[8] Ensuring that Americans are healthy enough to take advantage of these jobs will be essential. In addition, helping workers build the skills necessary to fill these jobs and to transition from old industries to new industries will require substantial retooling of current workforce development systems.[9],[10],[11],[12]
Pandemic to Prosperity July 19, 2023 10
Quits rate by industry, U.S.

Dec 2000 - May 2023
Source: Bureau of Labor Statistics Notes: The quits rate is the number of quits during the entire month as a percent of total employment. Quits include employees who left voluntarily, except retirements or transfers to other locations Data is seasonally adjusted May 2023 data is preliminary
Buoyed by a tight labor market, 48 million American workers quit their jobs over the last 12 months in search of better wages and working conditions. In May alone, 4 million workers quit jobs. The overall quits rate has stabilized at an elevated 2.6%. The quits rate is highest in the leisure and hospitality sector (where wages are typically low) at 4.8% in May, but is down from its peak of 5.8% in July 2021.
The Federal Reserve’s efforts to tame inflation by raising interest rates is aimed at reducing employment growth and increasing unemployment to bring down wage levels.[1] These efforts may be having some effect as job growth may be slowing (Total jobs). Meanwhile, the 12-month inflation rate has decreased steadily down to 3% in June 2023.[2] However, when unemployment increases, low-wage workers historically have borne the brunt of job losses.
As job growth has slowed, quits rates have declined but remain above pre-Covid.
Pandemic to Prosperity July 19, 2023 11
Since reaching a record high in March 2023, the employment rate for Black adults has fallen 2 points, but remains closer to the white employment rate than pre-Covid.
Employment rate (age 16+) by race/ethnicity, U.S.
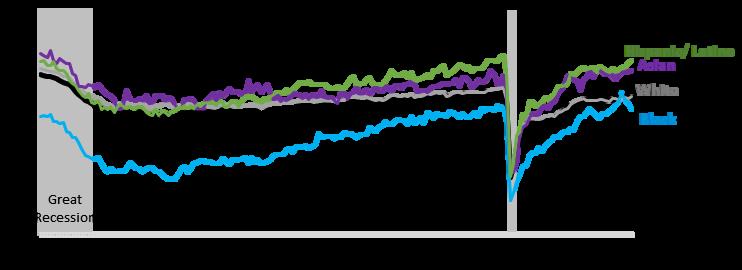
Jan 2008 - Jun 2023
Source: Bureau of Labor Statistics. Note: The employment rate is officially known as the “employment-population ratio ” Here it is calculated for the population 16 years and older Data is seasonally adjusted
The Black employment rate fell to 58.9% in June after reaching a peak of 60.9% in March, but remains closer to the white employment rate than it was pre-Covid. In fact, Black adults are now more likely to be participating in the labor force (62.6%) than white adults (62.3%).[1],[2]
Many white men and older white women are reaching retirement or otherwise dropping out of the labor force, providing Black adults with expanding opportunities as employers search for workers.[3]
Compared to February 2020 (immediately before the effects of the pandemic), the overall U.S. employment rate is down slightly. Several factors may be contributing to fewer people securing employment, including lack of available and affordable child care, opioid addiction, and Long Covid which is sidelining workers regardless of age, gender, race or ethnicity (Drug overdose deaths, Long Covid).[4],[5],[6],[7],[8]
Pandemic to Prosperity July 19, 2023 12
Heat-related deaths increased 88% in three years, reaching a high of 1,713 deaths in 2022. Heat-related death rates are highest among American Indians.
Heat-related deaths, U.S. 1999-2022
Source: CDC/Wonder Notes: 2022 data is provisional Rates are age-adjusted AN=Alaska Native Deaths are identified using ICD–10 underlying/contributing cause-of-death codes: P81.0, T67, and X30.
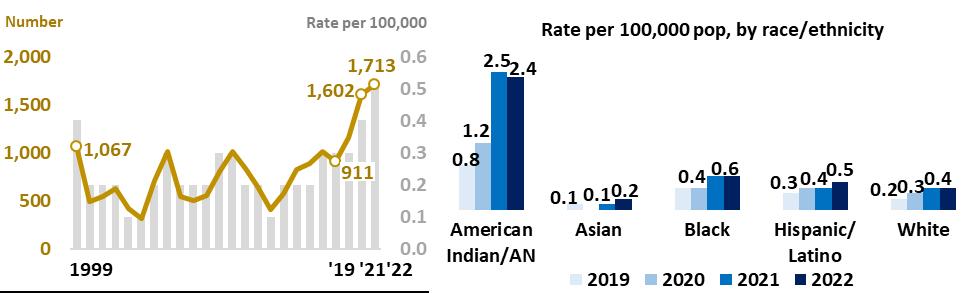
Last month, June 2023, was the hottest June ever recorded.[1] And the heat is continuing. On July 14, 2023, the National Weather Service issued a heat alert affecting 15 states and 1 out of every 3 Americans.[2] Older adults, young children, and pregnant women can experience damage to vital organs and even die from extreme heat.[3] Extreme heat can also exacerbate medical conditions such as hypertension and heart disease. Drug overdose and alcohol-related deaths are more common during extreme heat days (Drug overdose deaths).[4]
Since 1999, men have experienced increasing rates of heat-related deaths and are twice as likely to die from excessive heat as women.[5] Heat-related deaths jumped from 911 in 2019 to 1,156 in 2020. They increased again in 2021 to 1,602 and again in 2022 to 1,713. American Indians experienced by far the highest rate of heat-related deaths in 2022 at 2.4 per 100,000 population. Black Americans and Hispanic Americans experienced 0.6 and 0.5 deaths per 100,000 respectively. White Americans and Asian Americans experienced 0.4 and 0.2 heat-related deaths per 100,000 respectively.
Air conditioning is critical for keeping vulnerable people safe during extreme heat days. But lower-income households and renters are less likely to have air conditioning, even in the South where air conditioning is more widely available.[6] The Inflation Reduction Act includes substantial funding that can be used for home weatherization, but only via tax credits for homeowners.[7] The Centers for Medicare & Medicaid Services recently approved a Medicaid waiver from the Oregon Health Plan to allow coverage of air conditioners, humidifiers, air filtration devices, generators, and refrigeration units when medically necessary.[8]
Pandemic to Prosperity July 19, 2023 13
This section tracks measures of democracy and high-functioning governments that will be important as the nation continues to grapple with recent shocks.
Indicators in this section
● Census-driven federal funding
● Vote share gap
● State voting laws
● Anti-LGBTQ bills
● State supreme court diversity gaps
Pandemic to Prosperity July 19, 2023 14
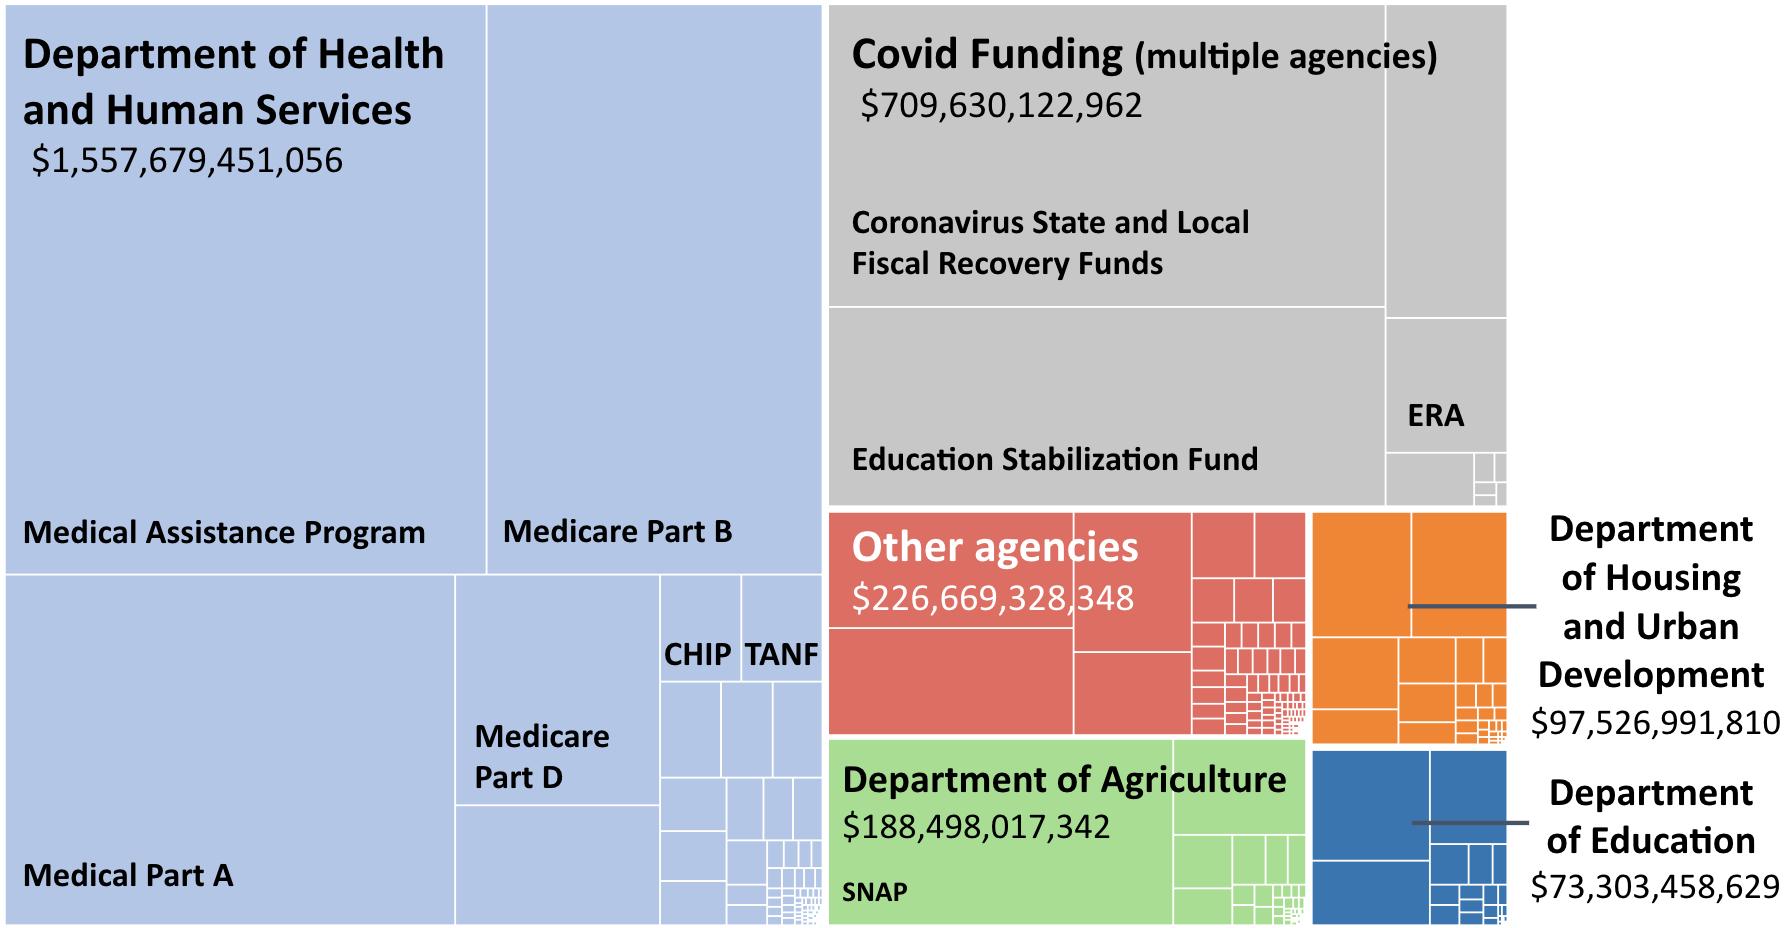
More than $2.8T in federal funding, including $700B in pandemic recovery funds, was distributed in FY21 based on Census data.
Census-driven federal funding by agency
Fiscal Year 2021 Total: $2.85 Trillion
Source: Census Bureau Notes: “Covid Funding” consists of programs from multiple departments and agencies that have non-renewable funding. Some program names are shortened using their acronyms including Supplemental Nutrition Assistance Program (SNAP), Children’s Health Insurance Program (CHIP), Temporary Assistance for Needy Families (TANF), and Emergency Rental Assistance (ERA).
The numbers produced from the 2020 Census not only determine political representation in Congress, state legislatures, and local government, they are also used to distribute federal funding to local communities for the entire decade. A recent report from the Census Bureau found that in Fiscal Year 2021, 353 federal assistance programs used Census Bureau data to distribute more than $2.8 trillion in funds including over $700 billion to respond to the pandemic.
These funds flow into communities from a multitude of federal programs, including ones for health, education, housing, and infrastructure. Although a portion ($700 billion) of this funding is for Covid-related programs, the remaining $2.1 trillion total is a marked increase from the $1.5 trillion that was estimated for Fiscal Year 2017 – demonstrating the key importance for communities to have accurate census data.[1] The Census Bureau has already started to improve the annual Population Estimates which are used directly and indirectly to distribute funding, and plans to do more next year.[2] Full participation in census surveys, including the decennial census and the American Community Survey remains crucial.
Pandemic to Prosperity July 19, 2023 15
Despite record turnout, the share of Black voters was less than the share of Black registrants in more than 95% of Southern counties in 2020.
Vote share gap for Black voters in the 2020 general election
Percentage point difference between % of registered voters and % of voters who are Black
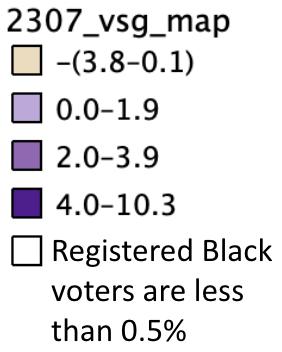
Source: Fair Count, based on 2020 election vote history and racial data from the TargetSmart national voter file Notes: In counties with no data, Black voters make up less than 0 5% of registered voters in the county Positive values indicate that the Black vote share is less than the Black registration share in a particular county.

Despite the ongoing pandemic, the 2020 election saw turnout rates surge nationwide, reaching a record high of 67%.[1] In 44 states, voter turnout rose from 2016, and nationwide turnout improved for Black, Latino, and Asian Americans.[2],[3] Even in the wake of these overall improvements, disparities persisted between racial groups.
Vote share gaps tend to occur when the electorate does not closely match the demographics of the community In the South, and across the nation, white voters tend to vote well over their share of the electorate and communities of color tend to vote under their share. In the South, Black vote share gaps occurred in more than 95% of Southern counties and more than a quarter of Southern counties had a Black vote share gap greater than 2%.
Significant challenges to improving these disparities exist. Section 5 of the Voting Rights Act, which was gutted in 2013, required preclearance before changing voting laws in 8 Southern states – where some of the largest Black vote share gaps exist today.[4],[5] Additionally, existing voting restrictions, and the barriers proposed in new legislation to make it harder to vote, have been shown to disproportionately impact voters of color and therefore pose a serious challenge to reaching equitable access to the ballot box (State voting laws).[6]
Pandemic to Prosperity July 19, 2023 16
Despite gains made in voter turnout in 2020, 27 states have passed laws restricting voter access since 2021.
Voting laws passed
Jan 1, 2021 May 29, 2023
Source: Brennan Center for Justice Notes: “Mixed” indicates that a state has passed both restrictive and expansive voting laws
In anticipation of the 2020 election and in response to the pandemic, nearly every state did something to make voting easier, such as temporarily expanding access to mail-in voting, establishing ballot drop-boxes, or increasing the availability of early voting. Despite concerns that the pandemic might depress voting rates, voter turnout reached a record high in the 2020 election with national voter participation jumping to about 67% amid an increase in new voters from both parties.[1]
However, since 2020, many states have reversed those temporary provisions and there have been a deluge of new voting laws passed in states across the nation. From Jan 2021- May 2023, 27 states have passed voting laws that make it harder for Americans to vote. 35 states have passed expansive voting laws and, of those, 18 states passed a combination of both expansive and restrictive voting laws.
Among the one-third of voters who did not participate in the 2020 election, the Current Population Survey found that 8% did not vote because of structural barriers.[2] Rather than building on progress made in 2020, states’ efforts to restrict voting access could significantly reduce participation in future elections, including the 2024 presidential election.
Pandemic to Prosperity July 19, 2023 17
In 2023, all 12 Southern states introduced anti-LGBTQ bills, and 9 passed them into law.
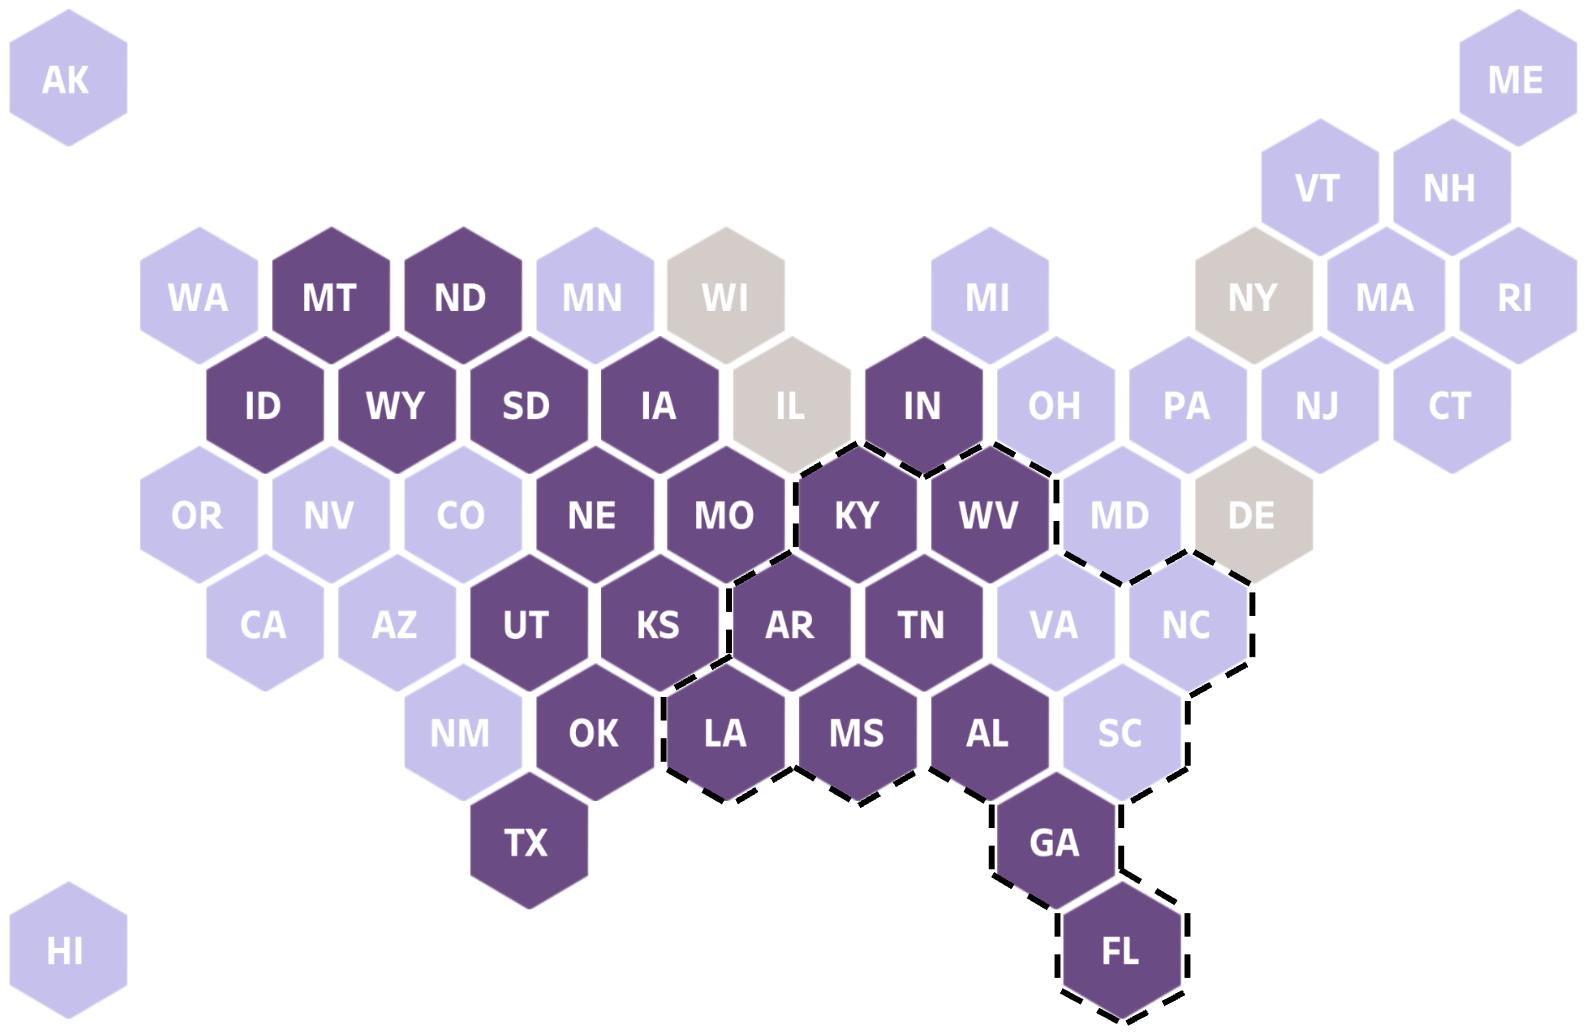
Anti-LGBTQ bills passed into law
2023 Legislative Session
Source: ACLU. Notes: Data represents outcomes from the 2023 Legislative Session as of July 18, 2023. The ACLU tracks anti-LGBTQ legislation on a yearly basis Historical data can be found here Data was updated with news on 7/18/23 when the Louisiana legislature passed Anti-LGBTQ legislation
Nearly 500 anti-LGBTQ bills have been introduced in state legislatures since the start of 2023. 78 bills have passed into law during the 2023 Legislative Session, including 32 in the South. TN and AR have enacted the most anti-LGBTQ bills in the nation since 2018 (18 and 12, respectively), passing the majority of those laws this year alone (TN: 10; AR: 8).[1] While bills in VA were defeated, bills introduced in SC will carry over to the 2024 Legislative Session.[2] The NC legislature is likely to override the Governor’s veto of anti-LGBTQ legislation.[3]
The anti-LGBTQ legislation sweeping the nation often targets transgender people and includes bills prohibiting access to gender-affirming care for youth regardless of parental consent, bills that allow teachers to refuse to use a student’s preferred pronoun even against parents’ wishes, and bills that require educators to “out” a student by alerting parents if a student begins going by a different name or pronoun. Meanwhile, 1 in 3 LGBTQ youth reported they have been physically attacked or threatened due to their gender identity, gender expression, or sexual orientation.[4] Fully half of LGBQ high school students have seriously considered attempting suicide and 1 in 4 have actually attempted suicide, a crisis that experts expect will be exacerbated by the wave of anti-LGBTQ legislation (Youth mental health).[5]
Pandemic to Prosperity July 19, 2023 18
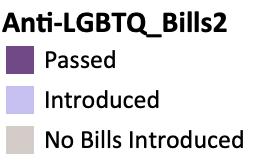
11 of 12 Southern states have supreme courts that lack the racial diversity of the state’s population.
Underrepresentation of people of color among state supreme court justices, May 2023
Percentage point difference between % of population and % of state supreme court justices
Source: Brennan Center for Justice Note: "Non-white" includes individuals who are Black, Asian, Hispanic, Native American, or multiracial. White is limited to non-Hispanic white individuals.
State supreme courts are highly influential institutions, making final decisions that impact the day-to-day lives of Americans on a wide array of critical issues including voting rights and the conduct of elections, healthcare access, public education, and more. They are a critical part of governmental checks and balances, and a diverse judiciary promotes a more robust, deliberative process and richer jurisprudence, benefiting from judges who have seen problems from different angles.[1] However, in 39 states, the state supreme court lacks the racial and ethnic diversity of the populations they represent.
Of the 12 Southern states, all but Florida have supreme courts that are less racially diverse than their state’s population. There are 0 Black justices in 3 Southern states where Black residents make up at least 10% of the population (AL, AR, and TN). In Alabama, where 37% of the population is non-white, there are 0 non-white supreme court justices.
Many state supreme courts also show steep gender disparities. Nationwide, men hold 58% of state supreme court seats and in 6 states, there is only one woman on the supreme court bench. In the South, 7 state supreme courts are less than ⅓ female.
Pandemic to Prosperity July 19, 2023 19
Beyond governments, American society has always depended on a wide array of civic institutions to provide critical information to constituents, hold governments accountable, and offer support to families and workers to be healthy, educated, and productive. This section examines civic institutions and whether they are fair, effective, and sufficiently available.
Indicators in this section
● College tuition and fees
● Lack of health insurance coverage, by race/ethnicity
● Lack of internet, by race/ethnicity
● News deserts

Pandemic to Prosperity July 19, 2023 20
Average undergraduate tuition and fees (constant 2020-21 dollars)
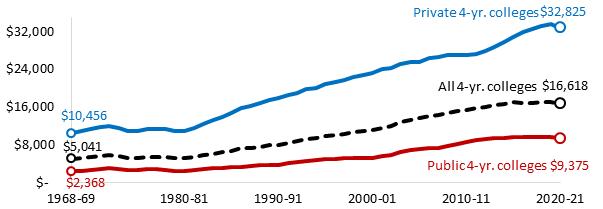
Full-time students at 4-year colleges and universities
Sources: NCES Digest of Education Statistics Table 330 10 Notes: Dollar cost of tuition and fees has been adjusted for inflation based on the Consumer Price Index, adjusted to an academic-year basis.
College tuition costs have more than tripled over the last 50 years, even after adjusting for inflation. In 1968, the average cost of tuition and fees for a 4-year institution was $5,041 (in today’s dollars). By 2021, the cost was $16,618. Average tuition and fees tripled for 4-year private institutions (1968: $10,456; 2021: $32,825) and quadrupled for 4-year public institutions (1968: $2,368; 2021: $9,375).
Though higher education is touted as a means of upward mobility, as the cost of college tuition rises, many graduates find themselves burdened by student loan debt. The federal Pell Grant, a financial need-based award, was able to cover almost all tuition costs and fees when first introduced in 1972. As of 2017, it only covered 29% of total college costs.[1] The Income-Driven Repayment (IDR) plan began in 1994 with the intent to lower borrowers’ payments over an extended period of time but, instead, studies find that borrowers’ student debt continues to mount because payments do not cover monthly interest.[2],[3] Roughly 44 million borrowers owe $1.5 trillion in student loan debt.[4]
The resumption of student loan payments in October 2023 is expected to pull $70 billion a year out of the economy and some experts worry it will push the nation’s economy into recession.[5],[6] In the wake of the Supreme Court’s decision ruling against the Biden administration’s original plan for one-time student loan debt relief, the administration announced another plan that will automatically provide $39 billion in debt relief for 804,000 IDR borrowers. Still, this will cover only a tiny fraction of all borrowers.[7],[8]
The cost of tuition and fees at a 4-year public university has quadrupled since 1968 (even after accounting for inflation).
Pandemic to Prosperity July 19, 2023 21
Among the working-age, 26% of American Indians, 25% of Hispanic Americans, and 14% of Black Americans were without health insurance in 2021. Gains in coverage have stalled since 2016.
Lack of health insurance coverage by race/ethnicity
Population age 19-64
Sources: Census Bureau’s American Community Survey Note: 2020 data is not available A N = Alaska Native P I = Pacific Islander. Data for years prior to 2017 is for the population age 18-64.
Lack of health insurance is one of the reasons that the U.S. has an “excess death” problem.[1],[2] Americans without health insurance often fail to get treatment for chronic conditions until they are very ill and go to emergency rooms. From 2010 to 2016, the Affordable Care Act dramatically reduced the number of uninsured people across the country through Medicaid expansion and new subsidies for health insurance “marketplaces.” But progress stalled in 2016 and, among the working-age population, 7% of Asian adults, 8% of white adults, 13% of Native Hawaiian/Pacific Islander adults, 14% of Black adults, 25% of Hispanic adults, and 26% of American Indian/Alaska Native adults still lack health insurance coverage.
In addition, patients who qualify for Medicaid must regularly renew their coverage and periodically verify their eligibility which often leads to patients inadvertently becoming unenrolled. When Covid struck, Congress required that Medicaid keep patients enrolled continuously, a provision which ended in March 2023. Experts estimate 7 million people will lose coverage at some point this year. States with poorly linked data systems are more likely to disenroll eligible individuals. But the largest number of people likely to lose their coverage are individuals who live in the 10 states (6 of them in the South) that have not adopted Medicaid expansion.[3],[4]
Pandemic to Prosperity July 19, 2023 22
Internet access has improved since 2013. Still, 13% of American Indians and 10% of Black Americans lacked internet as of 2021.
Lack of internet access by race/ethnicity, U.S. Percent of individuals without internet access
Source: Census Bureau’s American Community Survey. Notes: 2020 data is not available. A.N.= Alaska Native. P.I.= Pacific Islander Note: “Lacking internet access” means the household has no internet subscription (including no cellular data plan) or no computing device (including no smartphone)
In 2013, 39% of American Indians, 33% of Black Americans, and 29% of Hispanic Americans lacked internet access (including cellular data plans), compared to only 18% of white Americans and 10% of Asian Americans. By 2021, internet access had spread and disparities had narrowed such that 13% of American Indians, 10% of Black Americans, 8% of Hispanic Americans, 7% of white Americans and 4% of Asian Americans lacked internet access. But among those who have internet access, about 15% are cell phone dependent and do not have broadband access at home.[1] While a cellular data plan is helpful, studies have shown that without broadband access, workers and students are at a disadvantage in the job market and education system.[2]
The Bipartisan Infrastructure Law is sending $42.45 billion directly to states to bring broadband internet access to areas that do not have it.[3] The law also works to make internet more affordable in places where it already exists by allocating $14.25 billion toward a $30 monthly subsidy of household broadband subscriptions through the Affordable Connectivity Program.[4]
6 Southern governors have prioritized the implementation of the Affordable Connectivity Program, including governors in AL, KY, MS, NC, TN, and WV.[5] However, the program is projected to run out of funding by early 2024.[6] Moreover, as artificial intelligence tools become increasingly powerful, training in the effective use of technology will be just as important as internet access for reducing the digital divide.[7]
Pandemic to Prosperity July 19, 2023 23
75% of Southern counties are “news deserts,” counties with no or only one newspaper compared to 50% of non-Southern counties.

ted since the start of the Southern counties are more likely or only one newspaper. non-Southern counties. wly attempts to fill the void. ormation, and political the vulnerability of news ord University study under emains low, signaling that the

al news. The Southern South Carolina newspaper across the state.[5] At the ainability Act (a bipartisan at local news y [6],[7],[8],[9]
24
At the end of the day, governments and institutions are responsible for ensuring the well-being of the communities they serve. This section examines key metrics of community well-being.
Indicators in this section
● Difficulty paying expenses, by race/ethnicity
● Renters with severe housing cost burdens
● Likelihood of eviction or foreclosure
● Food insecurity
● Pregnancy-related death rates, by race/ethnicity
● Gun deaths among children, by race/ethnicity
● Symptoms of anxiety or depression
● Youth mental health
Pandemic to Prosperity July 19, 2023 25
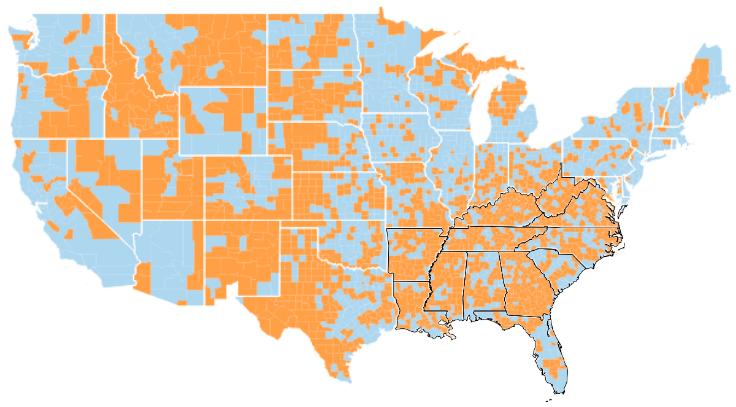
Nearly half of Black and Hispanic adults struggled to make ends meet in June 2023. So did one-third of white and Asian adults.
Percent of adults having difficulty paying for usual household expenses, by race/ethnicity Adults in households where it has been somewhat or very difficult to pay for usual household expenses in the last 7 days
Source: Census Bureau’s Household Pulse Survey. Notes: For June 2023, differences between Black and Hispanic adults, and between White and Asian adults, are not statistically significant
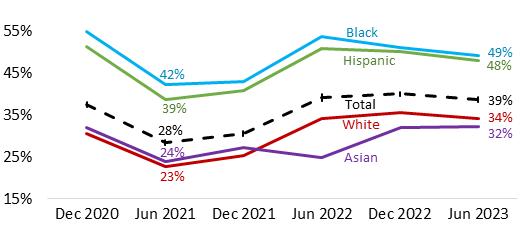
The end of stimulus and child tax credits in 2021 combined with high inflation in 2022 added up such that by June 2023, more than 1 in 3 American households was having difficulty paying for usual household expenses, up from 28% in June 2021. Among Black and Hispanic households, roughly half are struggling to pay for basic expenses.
Southern Economic Advancement Project (SEAP) surveyed 1,600 Supplemental Nutrition Assistance Program (SNAP) recipients in Louisiana, South Carolina, and Tennessee in early 2023, and found that 72% had difficulty paying utility bills and 54% experienced challenges with paying for housing (Likelihood of eviction or foreclosure). About 1 in 3 respondents wanted federal funding to be spent on affordable housing (Severe housing cost burden).[1]
Meanwhile organizers in Georgia are educating community members about flexible American Rescue Plan (ARP) funds and, as a result, Georgia localities have used ARP funds to invest in affordable housing. In North Carolina, Latino organizers won $250,000 in ARP funds to help low-income homeowners pay rapidly rising property taxes. And in South Carolina, organizers with FoodShare are helping local communities to build relationships with local officials to communicate the need for food assistance (Food Insecurity).[2]
Pandemic to Prosperity July 19, 2023 26
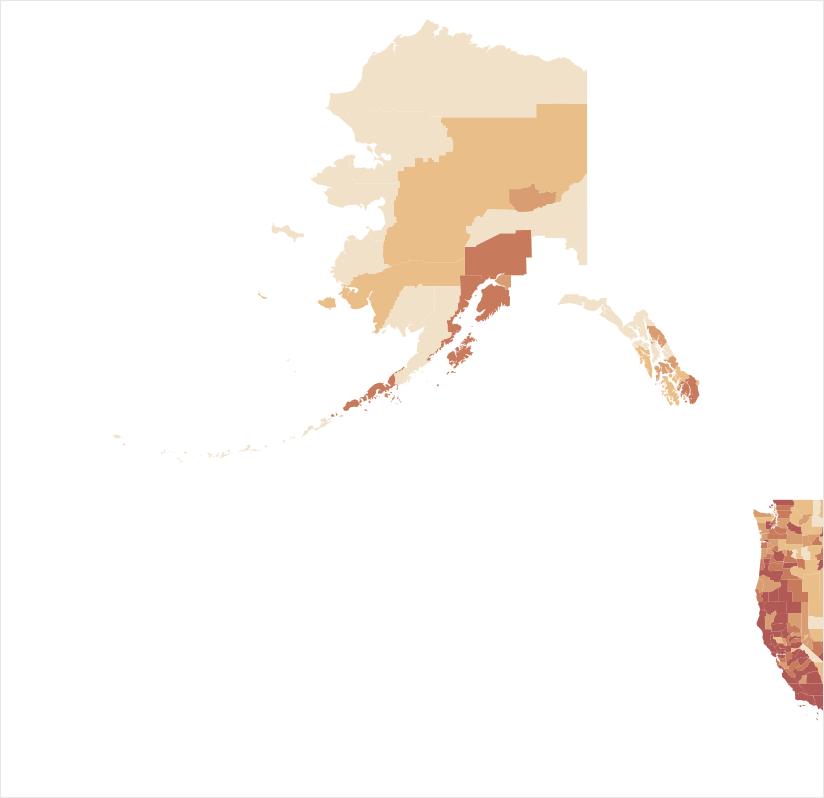
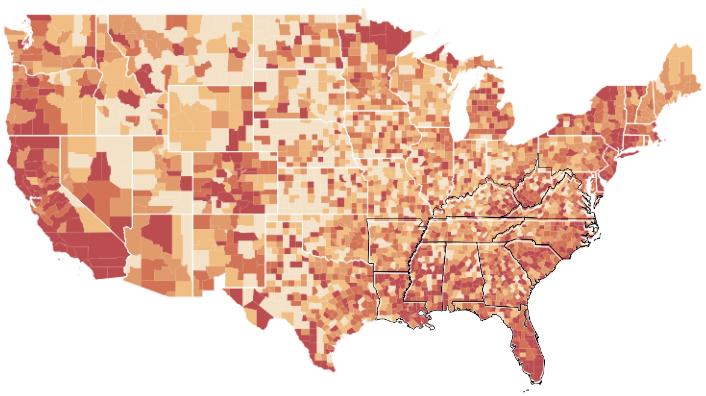
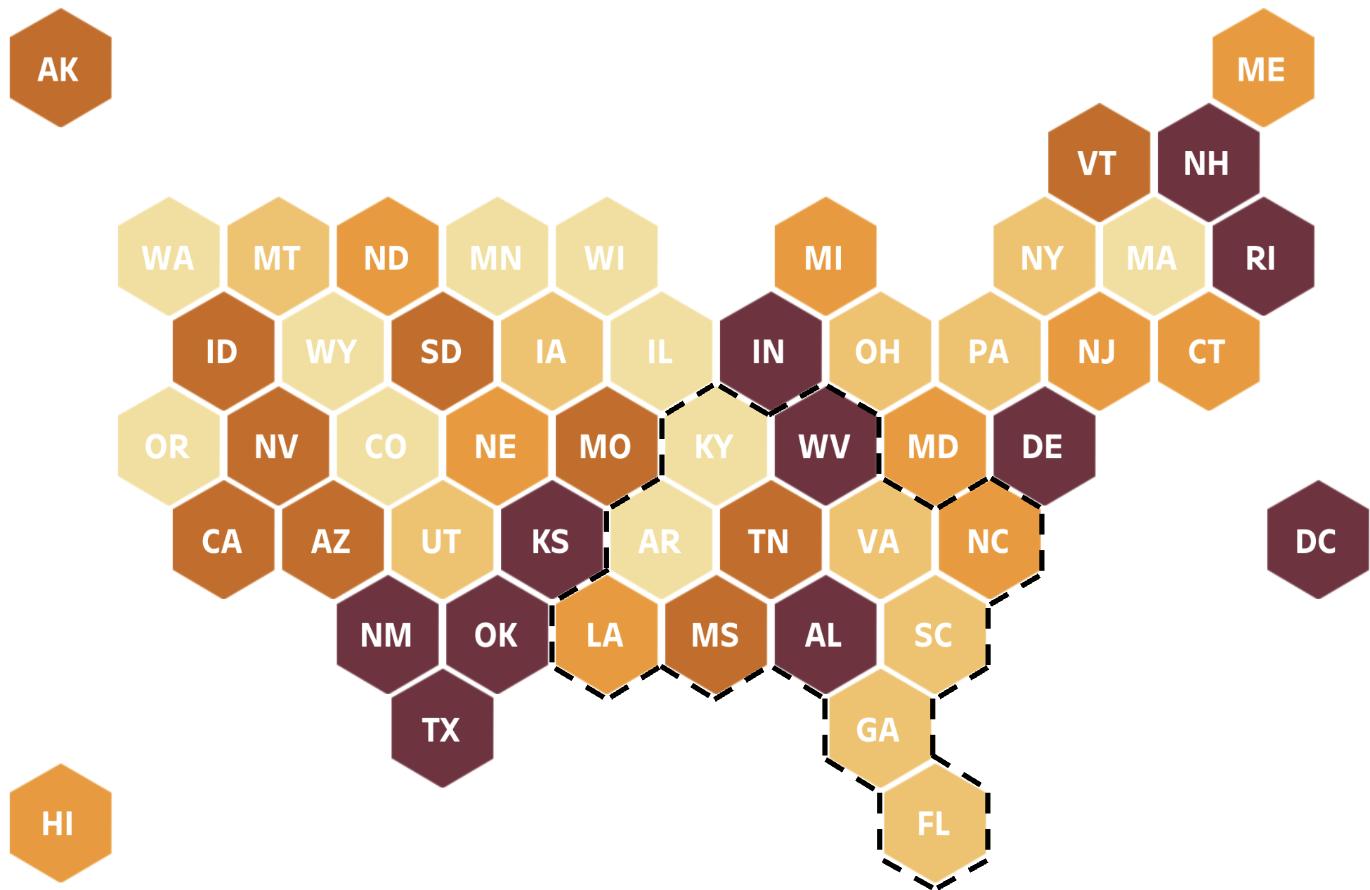
25% of U.S. renters pay the majority of their household income on
ey 2017-21.

severe housing shortage since the Great Recession declined driving up home prices over the decade ome.[1],[2] From 2017-21, at least 1 in 4 renters in several 29%, West Virginia: 25%, Mississippi: 25%, and South al household income toward housing costs. Having to means less money for families to buy food, clothing, necessities (Food Insecurity).[3],[4]
outpace the growth in income, renters look to dens.[5] But the National Low Income Housing shortage of 7.3 million affordable rental homes across number of low-income renters and a decrease in the private markets were found to supply low-cost rental units, but with unaffordable utility costs, often totaling an additional $500 or more a month. Three out of every four eligible families did not receive federal housing assistance due to a severely underfunded budget. A survey by the Southern Economic Advancement Project (SEAP) of SNAP recipients in Louisiana, South Carolina, and Tennessee finds that 1 in 3 respondents wanted federal funding to be spent on affordable housing.[7]
Pandemic to Prosperity July 19, 2023 27
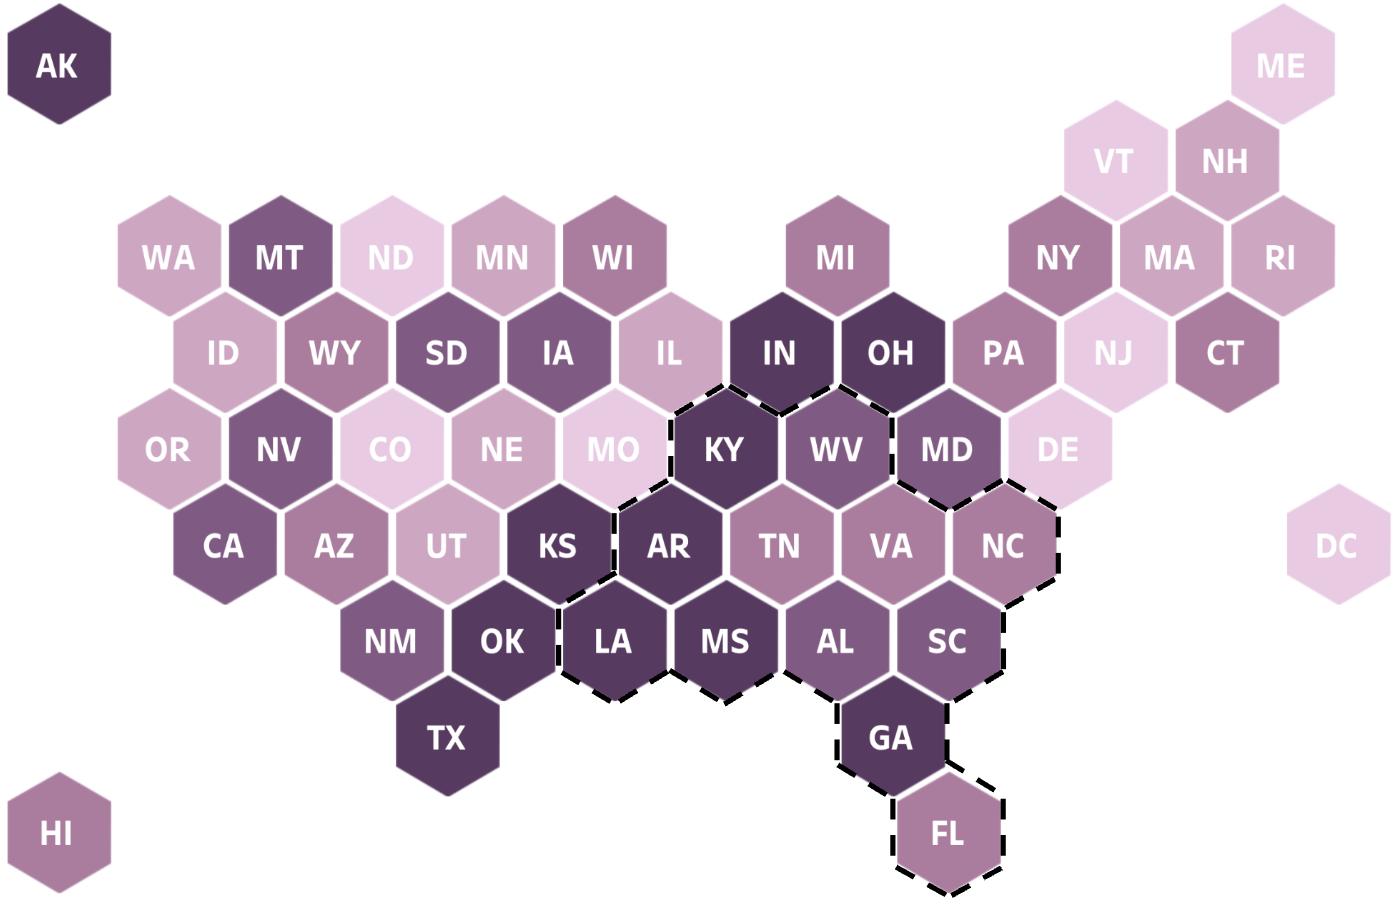
1 in 4 Southerners who are late on rent/mortgage said they feared losing their home. In AL and WV, it is 1 in 2.
Likelihood of eviction or foreclosure, June 7-19, 2023
Percent of adults living in households not current on rent or mortgage where eviction or foreclosure in the next two months is “very likely” or “somewhat likely”
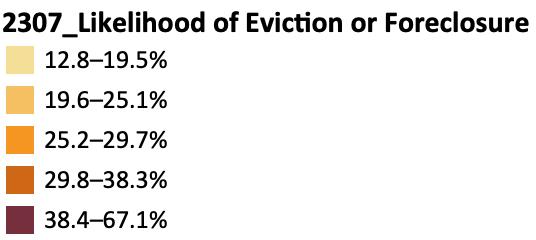
In the South, 25% of adults who were past-due on rent or mortgage feared that eviction or foreclosure was likely. Among Southern states, fears are highest in AL (48%), WV (48%), and MS (34%).
Rising interest rates and high inflation in 2022 resulted in higher housing costs. Mortgage interest rates grew by a higher margin in 2022 than in any other year on record, and rent increased about 5% in 2022 — after an 18% increase in 2021.[1] More than 1 in 4 Southern renters have to spend the majority of their household income on rent and utilities (Severe housing cost burden). While inflation has fallen, as of June 2023, more than 1 in 3 American households were having difficulty paying for usual household expenses, up from 28% in June 2021 (Difficulty paying expenses).
Source: Census Bureau’s Household Pulse Survey.
Pandemic to Prosperity July 19, 2023 28
13% of Southern households went hungry in June. The highest rates of hunger nationwide were in LA (19%), MS (18%), and AR (17%).
Food insecurity, June 7-19, 2023
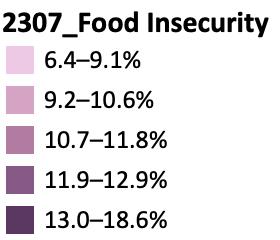
Percent of adults who report their household sometimes or often went hungry in last 7 days
In June 2023, 12% of Americans reported that their household sometimes or often went hungry. In the South, it was 13%. Three Southern states had the highest rate of food insecurity: LA (19%), MS (18%), and AR (17%). In 2021, before high inflation took hold, households with incomes in the lowest ⅕ of all Americans spent an average of $4,875 annually on food or nearly ⅓ of their income.[1] Then, in 2022, grocery prices rose 10%.[2] While inflation has cooled, grocery prices have still increased 5.7% for the 12-month period ending June 2023.
7 Southern states ended pandemic emergency food benefits early, and all states ended these benefits in March 2023, leaving SNAP recipients across the nation with at least $90 less per month.[3] More and more Americans are turning to food banks, nonprofits, and other community organizations for help. [4],[5]
Food insecurity has effects on physical and mental health (Symptoms of anxiety/ depression).[6],[7] Food insecurity for children, in particular, contributes to chronic stress that actually disrupts the development of the brain [8] Eliminating sales tax on groceries is one way that states can reduce food insecurity. AL and MS are 2 of 3 states that offers no relief on the sales tax rate on groceries.[9],[10]
Source: Census Bureau’s Household Pulse Survey
Pandemic to Prosperity July 19, 2023 29
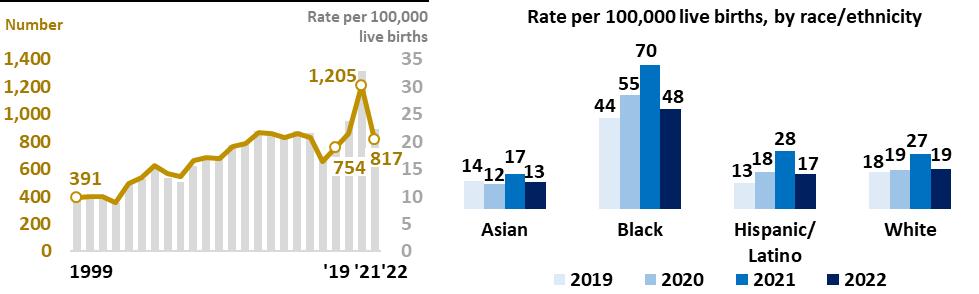
Pregnancy-related deaths increased 60% in two years, reaching a high of 1,205 deaths in 2021. Black people are about 3 times more likely to die from a pregnancy-related cause than white and Hispanic people.
Pregnancy-related deaths, U.S. 1999-2022
Sources: CDC/Wonder Mortality Data (deaths) and CDC Natality Data/ Report (births) Notes: 2022 data is provisional A pregnancy-related death is defined as a death while pregnant or within 42 days of termination of pregnancy, from any cause related to or aggravated by the pregnancy or its management, but not from accidental or incidental causes Pregnancy-related deaths are identified using ICD–10 underlying cause-of-death codes: A34, O00–O95, and O98–O99.
In 2020 and 2021, pregnancy-related deaths spiked in the U.S., jumping from 20 deaths per 100,00 live births in 2019 (754 overall deaths) to 33 per 100,00 live births in 2021 (1,205 overall deaths). According to GAO estimates, 25% of pregnancy-related deaths that occurred in 2020 and 2021 listed Covid as a contributing cause of death.[1] Provisional data for 2022 shows that pregnancy-related deaths decreased to 22 per 100,00 live births (817 overall deaths). Still, pregnancy-related deaths in the U.S. have more than doubled since 1999. The American Indian and Alaska Native population has had the largest increase in pregnancy-related deaths since 1999.[2] Black people are 2.5 times more likely than white people to die from pregnancy-related complications. Black and Indigenous people have historically faced racial discrimination, bias, and inequity in health care systems, for pregnancy-related and other care.[3],[4],[5],[6],[7],[8],[9]
Pregnancy-related deaths are more common in the U.S. than in any other developed country. In 2020, pregnancy-related deaths in the U.S. were more than 3 times the rate of other high income countries.[10] Among efforts to reduce maternal health disparities, experts recommend increased implicit bias training across the field.[11],[12] At the state and national level, the 2021 American Rescue Plan Act included a 12-month postpartum coverage extension option that expanded Medicaid postpartum coverage from 60 days to 12 months after giving birth.[13],[14] 36 states have implemented the extension, 10 of which are Southern states (AL, FL, GA, KY, LA, NC, SC, TN, VA, WV).[15],[16]
Pandemic to Prosperity July 19, 2023 30
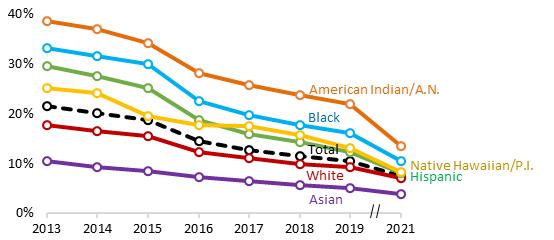
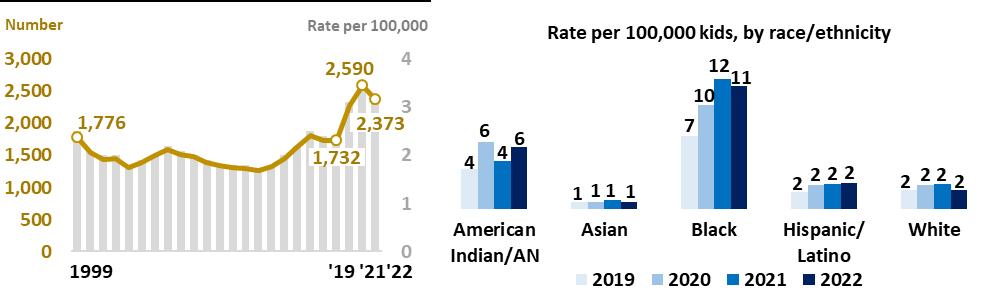
Gun deaths among children increased 50% in two years, reaching a high of 2,590 deaths in 2021. Black kids are about 5 times more likely than white and Hispanic kids to die from guns.
Gun deaths among U.S. kids (under 18 years old)
1999-2022
Firearms are now the leading cause of death for children in the U.S.[1] Gun deaths among children have increased by 50%, reaching a high of 2,590 deaths in 2021. Homicides were the largest category of gun deaths among children, making up 60% of the total in 2021. Suicides made up 32%, accidents were 5%, and other incidents were 3%.[2]
Racial disparities persist in gun deaths among children. Black children were victims in 46% of all gun deaths among children, despite making up just 14% of the child population in the U.S. They are 5 times more likely to die from firearms than white children. Types of gun deaths among children also differed by race. The majority of gun deaths among white children were suicides (66%), with homicides making up a much smaller share (24%). In contrast, 86% of gun deaths among Black children were homicides, and just 9% were suicides.
Compared to its peer nations, the U.S. has a disproportionately high rate of gun deaths among children. The U.S. is the only nation to have firearm deaths in the top 4 leading causes of death among children, let alone be the number one cause of death.[3] Among the U.S. and peer nations, the U.S. accounts for 97% of all child firearm deaths, while making up just 46% of the total child population. To reduce firearm fatalities among children, experts suggest that states implement new laws, including universal background checks, extreme risk protection or “red flag laws,” and child access prevention or “CAP” laws.[4],[5],[6]
 Source: CDC/Wonder Notes: 2022 data is provisional Gun deaths are identified using ICD–10 underlying cause-of-death codes: U01 4; W32-W34; X72-X74; X93-X95; Y22-Y24; Y35 AN= Alaska Native
Pandemic to Prosperity July 19, 2023 31
One-third of Americans report symptoms of anxiety or depression, up from 11% in 2019. The South had 8 of 10 states with the highest rates.
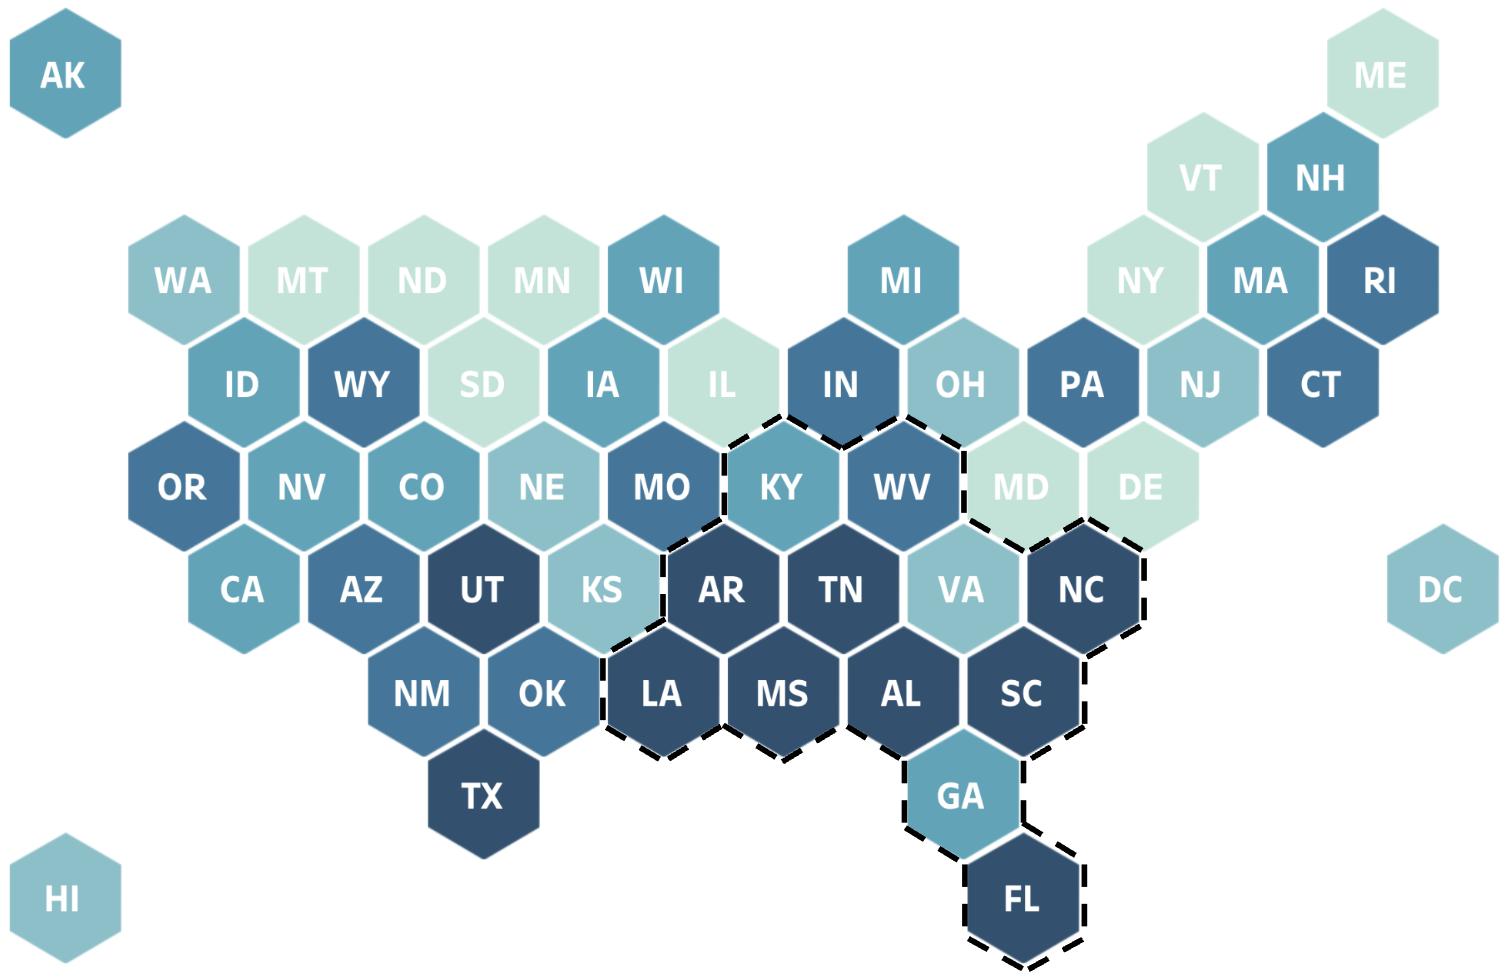
Symptoms of anxiety or depression, June 7-19, 2023 experienced symptoms of anxiety or depression in the last two weeks
Source: CDC and Census Bureau’s Household Pulse Survey. Notes: This indicator is based on self-report of the frequency of anxiety and depression symptoms, derived from responses to the first two questions of the eight-item Patient Health Questionnaire (PHQ-2) and the seven-item Generalized Anxiety Disorder (GAD-2) scale.
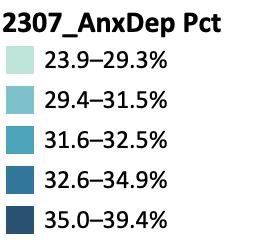
Americans face a growing mental health crisis. The percent of adults in the U.S. reporting symptoms of anxiety and depression has tripled from 11% in 2019 to 33% in June 2023.[1] 8 out of the 10 states with the highest rates were in the South: AR (39%), LA (39%), FL (38%), TN (37%), SC (36%), MS (36%), NC (36%), and AL (35%). The effects of this mental health crisis continue to become clear, with increasing incidence of substance abuse, drug overdose and alcohol-induced deaths, gun violence, and road rage and other vehicular fatalities(Drug overdose deaths, Motor vehicle deaths, Gun deaths among children).[2],[3],[4],[5],[6],[7]
In June 2023, the U.S. Preventive Services Task Force finalized its recommendation for adults under 65 to be screened for anxiety, depression, and suicide risk.[8],[9] This comes months after the force’s recommendation for anxiety screening in children and adolescents back in October 2022 (Youth mental health).[10] These recommendations are part of an effort to intervene and diagnose mental health concerns early July 2023 marks one year of the nation’s relaunched suicide and crisis prevention hotline, 988. Since its launch, the simplified dial code has had over 5 million contacts.[11] Yet, a recent survey finds that over 80% of Americans are not familiar with the hotline.[12] The Department of Human Health Services announced an additional $200 million in funding in May 2023 for states, territories and tribes to build local capacity for the hotline.
Pandemic to Prosperity July 19, 2023 32
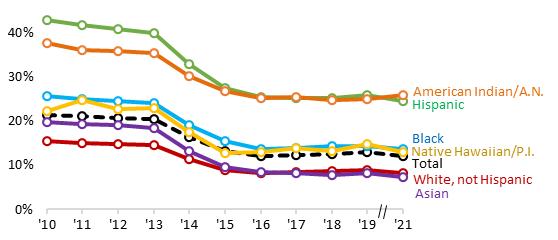
Nearly 1 in 2 LGBQ+ students and 1 in 3 female students in U.S. high schools reported that they had seriously considered attempting suicide.
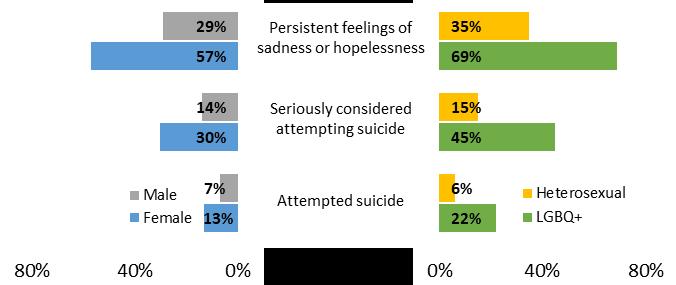
Mental health among U.S. high school students, by sex and sexual identity
Fall 2021
Source: CDC Youth Risk Behavior Survey (YRBS). Notes: Because the 2021 national YRBS did not have a question assessing gender identity, data specifically on students who identify as transgender is not available Survey questions on mental health and suicidality were worded as “During the past 12 months, did you ”
The youth mental health crisis surged prior to the pandemic, and recent studies show that it has heightened since.[1],[2] From 2011–2021, the share of high school students that experienced persistent feelings of sadness or hopelessness, seriously considered suicide, or attempted suicide increased by 50%, 38%, and 25%, respectively [3] While reports of worsening mental health and suicidality were higher among all teens, female and LGBQ+ students fared worst according to Fall 2021 data. The share of female students that experienced persistent feelings of sadness or hopelessness, and either seriously considered or attempted suicide, was twice the share of male students. Almost half of LGBQ+ students seriously considered attempting suicide and 22% attempted suicide rates 3 to 4 times higher than that of heterosexual students.
Social pressures, limited school resources, anti-LGBTQ legislation, and gun-related incidents are among the many challenges today’s youth face.[4],[5],[6] In April 2022, 70% of public schools reported an increase in the number of students requesting mental health support since the pandemic, but only 12% felt that their schools were adequately able to provide services to all students in need.[7] Over 300 bills that target LGBTQ youth and their right to healthcare and/or the ability to express themselves in school have been introduced across the nation, with many advancing to hearings and floor debates (Anti-LGBTQ Laws).[8] Firearms are now the leading cause of death for U.S. children, with homicides making up 60% of gun deaths among children overall (Gun deaths among children).
Pandemic to Prosperity July 19, 2023 33
REFERENCES
Foreword
1. “Excess Deaths Associated with COVID-19” CDC. June, 2023.
https://www.cdc.gov/nchs/nvss/vsrr/covid19/ex cess_deaths.htm?te=1&nl=the-morning&emc=e dit_nn_20230717
2. “Excess mortality in the United States in the 21st century” Preston, Vierboom. PNAS. April, 2021.
https://www.pnas.org/doi/10.1073/pnas.202485 0118
3. “Violent Death Rates: The US Compared with Other High-income OECD Countries, 2010” Grinshteyn, Hemenway The American Journal of Medicine. March, 2016.
https://www.amjmed.com/article/S0002-9343(1 5)01030-X/fulltext
4. “The U.S. Maternal Mortality Crisis Continues to Worsen: An International Comparison”. Gunja, Gumas, and Williams II. The Commonwealth Fund. December, 2022.
https://www.commonwealthfund.org/blog/2022
/us-maternal-mortality-crisis-continues-worsen-i nternational-comparison
Percent of population who are up-to-date with Covid vaccines
1. “Fact Sheet: End of the COVID-19 Public Health Emergency” U.S. Department of Health and Human Services. May, 2023.
https://www.hhs.gov/about/news/2023/05/09/f
act-sheet-end-of-the-covid-19-public-health-eme rgency.html
2. “End of the Federal COVID-19 Public Health Emergency (PHE) Declaration” CDC. May, 2023.
https://www.cdc.gov/coronavirus/2019-ncov/yo ur-health/end-of-phe.html
3. “CDC COVID-19 Vaccination Program Provider Requirements and Support”. CDC.
https://www.cdc.gov/vaccines/covid-19/vaccinat ion-provider-support.html#5-23-23
4. “COVID-19 Vaccinations in the United States” June, 2023.
https://covid.cdc.gov/covid-data-tracker/#vaccin ation-states-jurisdictions
5. “Reasons for Receiving or Not Receiving Bivalent COVID-19 Booster Vaccinations Among Adults –United States, November1-December 10, 2022” CDC. January, 2023.
https://www.cdc.gov/mmwr/volumes/72/wr/m m7203a5.htm
6. “KFF COVID-19 Vaccine Monitor: March 2023” Sparks, Presiado, Valdes, Kirzinger, and Brodie. KFF April, 2023.
https://www.kff.org/coronavirus-covid-19/poll-fi nding/kff-covid-19-vaccine-monitor-march-2023/
7. “Once-A-Year Covid Shot Plan In The Works By FDA” KFF Health News. January, 2023.
https://kffhealthnews.org/morning-breakout/on ce-a-year-covid-shot-plan-in-the-works-by-fda/
Long Covid estimates, June 7-19, 2023
1. “Long COVID: Household Pulse Survey” CDC. https://www.cdc.gov/nchs/covid19/pulse/long-c ovid.htm
2. “PRESIDENT’S COLUMN”. American Academy of Neurology”. July, 2022.
https://www.aan.com/AAN-Resources/Details/a bout-the-aan/board-of-directors/presidents-colu mn/july-2022/
3. “Immunological dysfunction persists for 8 months following initial mild-to-moderate SARS-CoV-2 infection” Phetsouphanh, Darley, Wilson, Howe, Munier, Patel, Juno, Burrell, Kent, Dore, Kelleher, and Matthews. Nature Immunology January, 2022.
https://www.nature.com/articles/s41590-021-01 113-x
4. “Persistent Exertional Intolerance After COVID-19, Insights From Invasive Cardiopulmonary Exercise Testing” Singh, Joseph, Heerdt, Cullinan, Lutchmansingh, Gulati, Possick, Systrom, and Waxman. January, 2022.
https://journal.chestnet.org/article/S0012-3692( 21)03635-7/fulltext
5. “Nervous system consequences of COVID-19” Spudich, Nath. Science.org. January, 2022.
https://www.science.org/doi/10.1126/science.a bm2052
6. “The Investigation of Pulmonary Abnormalities using Hyperpolarised Xenon Magnetic Resonance Imaging in Patients with Long-COVID” Grist, Collier, Walters, Chen, Eid, Laws, Matthews, Jacob, Cross, Eves, Durant,
Pandemic to Prosperity July 19, 2023 34
Mcintyre, Thompson, Schulte, Raman, Robbins, Wild, Fraser, and Gleeson. MedRxiv. February, 2022.
https://www.medrxiv.org/content/10.1101/2022 .02.01.22269999v1
7. “Large study provides scientists with deeper insight into long COVID symptoms” NIH. May, 2023.
https://www.nih.gov/news-events/news-release s/large-study-provides-scientists-deeper-insight-i nto-long-covid-symptoms
8. “Northwestern Medicine shares new findings from the Comprehensive COVID-19 Center as significant demand remains for patient appointments” Newsroom. July, 2023.
https://news.nm.org/northwestern-medicine-sh ares-new-findings-from-the-comprehensive-covi d-19-center-as-significant-demand-remains-for-p atient-appointments/
9. “THE IMPACTS OF COVID-19 ILLNESSES ON WORKERS” Goda, Soltas. National Bureau of Economic Research.
https://www.nber.org/system/files/working_pap ers/w30435/w30435.pdf
Drug overdose death rates, U.S.
1. “The Covid-19 pandemic and the expansion of the mortality gap between the United States and its European peers” Heuveline. PLOS. March, 2023.
https://journals.plos.org/plosone/article?id=10.1 371/journal.pone.0283153
2. “The Contemporary American Drug Overdose Epidemic in International Perspective”. Ho. National Library of Medicine.
https://www.ncbi.nlm.nih.gov/pmc/articles/PMC 6527318/
3. “We need to talk about well-being: Why the study of well-being is crucial for race relations and advancing prosperity” Perry, Rothwell. Brookings. April, 2023.
https://www.brookings.edu/articles/we-need-totalk-about-well-being-why-the-study-of-well-bein g-is-crucial-for-race-relations-and-advancing-pros perity/
4. “Effect of increased alcohol consumption during COVID-19 pandemic on alcohol-associated liver disease: A modeling study” Julien, Ayer, Tapper, Barbosa, Dowd, and Chhatwal. American Association For The Study of Liver Diseases. December, 2021.
https://aasldpubs.onlinelibrary wiley.com/doi/ful l/10.1002/hep.32272
5. “Gun Violence Archive”. July, 2023. https://www.gunviolencearchive.org/
6. “2020 Fatality Data Show Increased Traffic Fatalities During Pandemic”. U.S. Department of Transportation. June, 2021.
https://www.nhtsa.gov/press-releases/2020-fata lity-data-show-increased-traffic-fatalities-duringpandemic
7. “Road Rage Shootings Are Continuing to Surge” Burd-Sharps, Tetens, and Szkola. Everytown.
https://everytownresearch.org/reports-of-road-r age-shootings-are-on-the-rise/
8. “Labor Market Effects of the Oxycodone-Heroin Epidemic” Cho, Garcia, montes, and Weingarden. Federal Reserve Board. April, 2021.
https://www federalreserve.gov/econres/feds/fil es/2021025pap.pdf
9. “Where have all the workers gone? An inquiry into the decline of the U.S. labor force participation rate” Krueger Brookings. September, 2017.
https://www.brookings.edu/articles/where-have -all-the-workers-gone-an-inquiry-into-the-decline -of-the-u-s-labor-force-participation-rate/
10. “Despair underlies our misinformation crisis: Introducing an interactive tool”. Graham, Dobson. Brookings. July, 2023.
https://www.brookings.edu/articles/despair-und erlies-our-misinformation-crisis-introducing-an-i nteractive-tool/
11. “State Approaches for Distribution of National Opioid Settlement Funding” NASHP
https://nashp.org/state-approaches-for-distributi on-of-national-opioid-settlement-funding/#:~:tex t=States%20are%20in%20the%20process,of%20t he%20National%20Opioid%20Settlement
12. “The ARP Activist Playbook” The Southern Economic Advancement Project. March, 2023. https://theseap.org/wp-content/uploads/2023/0 3/ARP_Activist_Playbook.pdf
Motor vehicle deaths, U.S.
1. “Motor-Vehicle Deaths in the U.S. Compared to the World”. National Safety Council.
https://injuryfacts.nsc.org/international/motor-v ehicle-deaths-in-the-u-s-compared-to-the-world/
Pandemic to Prosperity July 19, 2023 35
2. “The Exceptionally American Problem of Rising Roadway Deaths”. Badger, Parlapiano. The New York Times. November, 2022.
https://www.nytimes.com/2022/11/27/upshot/r oad-deaths-pedestrians-cyclists.html?action=clic k&module=Well&pgtype=Homepage§ion=U S%20News
3. “Road injury crashes, fatalities and injuries” International Transport Forum.
https://stats.oecd.org/Index.aspx?DataSetCode=I TF_ROAD_ACCIDENTS#
4. “Why Native Americans Are Dying Sooner” Gounder Time. October, 2022.
https://time.com/6219765/native-americans-life -expectancy/
5. “Examining the Theory of Historical Trauma Among Native Americans” Brown-Rice. The Professional Counselor October, 2014.
https://tpcjournal.nbcc.org/examining-the-theor y-of-historical-trauma-among-native-americans/
6. “An Analysis of Traffic Fatalities by Race and Ethnicity” Governors Highway Safety Association. June, 2021.
https://www.ghsa.org/sites/default/files/2021-0
6/An%20Analysis%20of%20Traffic%20Fatalities% 20by%20Race%20and%20Ethnicity_0.pdf
7. “Motor Vehicle Deaths Among American Indian and Alaska Native Populations”. Pollack, Frattaroli, Young, Dana-Sacco, Gielen. Oxford Academic. November, 2011.
https://academic.oup.com/epirev/article/34/1/7 3/495638
8. “Tribal Road Safety: Get the Facts” CDC.
https://www.cdc.gov/transportationsafety/nativ e/factsheet.html
9. “Disparities in Activity and Traffic Fatalities by Race/Ethnicity” Raifman, Choma. American Journal of Preventive Medicine. June, 2022.
https://www.ajpmonline.org/article/S0749-3797
(22)00155-6/fulltext
10. “Bipartisan Infrastructure Law” U.S. Department of Transportation.
https://www.nhtsa.gov/bipartisan-infrastructure
-law
Total jobs by month, U.S.
1. “Labor Force Participation Rate”. FRED. July, 2023. https://fred.stlouisfed.org/series/CIVPART
2. “Labor Force Participation Rate - White” FRED July, 2023.
https://fred.stlouisfed.org/series/LNS11300003
3. “Labor Force Participation Rate - Black or African American”. FRED. July, 2023.
https://fred.stlouisfed.org/series/LNS11300006
4. “Who’s missing from the post-pandemic labor force?” Bauer, Edelberg, Estep, and Hershbein. Brookings. April, 2023.
https://www.brookings.edu/2023/04/04/whosmissing-from-the-post-pandemic-labor-force/
5. “Unemployment Level/Job Openings: Nonfarm” FRED https://fred.stlouisfed.org/graph/?g=p9aA
6. “Inflation and the Labor Market” Powell. Board of Governors of the Federal Reserve System. November, 2022.
https://www federalreserve.gov/newsevents/spe ech/powell20221130a.htm
7. “Job Creation Estimates Through Proposed Inflation Reduction Act” Pollen, Lala, Chakraborty University of Massachusetts Amherst Political Economy Research Institute. August, 2022.
https://peri.umass.edu/publication/item/1633-j ob-creation-estimates-through-proposed-inflatio n-reduction-act
8. “15 Million Infrastructure Jobs. Georgetown University Center on Education and the Workforce.
https://cew georgetown.edu/cew-reports/infrast ructure/
9. “Inflation Reduction Act Benefits: Good Paying Jobs and Revitalized U.S. Manufacturing” Spengeman. Forbes. September, 2022.
https://www.forbes.com/sites/energyinnovation /2022/09/28/inflation-reduction-act-benefits-go od-paying-jobs-and-revitalized-us-manufacturing /?sh=7820165f6ff9
10. “The Insightful Leader Live: What You Need to Know about the New Climate Bill. Kellogg Insight. October, 2022.
https://insight.kellogg.northwestern.edu/webina rs/the-insightful-leader-live-new-climate-bill
11. “Biden needs to create an infrastructure talent pipeline, not just more jobs” Kane. Brookings. January, 2021.
https://www.brookings.edu/blog/the-avenue/20 21/01/29/biden-needs-to-create-an-infrastructur e-talent-pipeline-not-just-more-jobs/
Pandemic to Prosperity July 19, 2023 36
12. “Telecommunications Workforce: Additional Workers Will Be Needed to Deploy Broadband, but Concerns Exist About Availability”. U.S. Government Accountability Office. December, 2022.
https://www.gao.gov/assets/gao-23-105626.pdf
Quits rate by industry, U.S.
1. “Federal Funds Effective Rate” FRED
https://fred.stlouisfed.org/series/FEDFUNDS
2. “12-month percentage change, Consumer Price Index, selected categories”. U.S. Bureau of Labor Statistics.
https://www.bls.gov/charts/consumer-price-inde x/consumer-price-index-by-category-line-chart.ht m
Employment rate (age 16+) by race/ethnicity, U.S.
1. “Labor Force Participation Rate - White” FRED July, 2023.
https://fred.stlouisfed.org/series/LNS11300003
2. “Labor Force Participation Rate - Black or African American” FRED July, 2023.
https://fred.stlouisfed.org/series/LNS11300006
3. “Who’s missing from the post-pandemic labor force?” Bauer, Edelberg, Estep, and Hershbein. Brookings. April, 2023.
https://www.brookings.edu/2023/04/04/whosmissing-from-the-post-pandemic-labor-force/
4. “Association of Post-COVID-19 Condition Symptoms and Employment Status. Perlis, Trujillo, Safarpour, et al. Jama Network. February, 2023.
https://jamanetwork.com/journals/jamanetwork open/fullarticle/2801458
5. “Inflation and the Labor Market” Powell. Board of Governors of the Federal Reserve System. November, 2022.
https://www.federalreserve.gov/newsevents/spe ech/powell20221130a.htm
6. “Measuring Household Experiences during the Coronavirus Pandemic” U.S. Census Bureau. January, 2023.
https://www.census.gov/data/experimental-data -products/household-pulse-survey.html
7. “One billion days lost: How COVID-19 is hurting the US workforce” Berdan, Charumilind, Craven, Lamb, and Singhal. McKinsey & Company January, 2023.
https://www.mckinsey.com/industries/healthcar e-systems-and-services/our-insights/one-billiondays-lost-how-covid-19-is-hurting-the-us-workfor ce
8. “The economic impact of the opioid epidemic”. Paris, Rowley, and Frank. Brookings. April, 2023. https://www.brookings.edu/articles/the-econom ic-impact-of-the-opioid-epidemic/
Heat-related deaths, U.S.
1. “Earth just had its hottest June on record” National Oceanic and Atmospheric Administration. July, 2023.
https://www.noaa.gov/news/earth-just-had-its-h ottest-june-on-record
2. “Expanding heat wave prompts alerts for 115 million people” Freedman. Axios. July, 2023.
https://www.axios.com/2023/07/12/heat-wavewarnings-millions-southeast-to-southwest
3. “About Extreme Heat” CDC.
https://www.cdc.gov/disasters/extremeheat/hea t_guide.html
4. “Heat-Related Deaths – United States, 2004-2018”. Vaidyanathan, Malilay, Schramm, and Saha. CDC. June, 2020.
https://www.cdc.gov/mmwr/volumes/69/wr/m m6924a1.htm#T1_down
5. “QuickStats: Deaths Involving Exposure to Excessive Heat,* by Sex – National Vital Statistics System, United States, 1999-2020” Miniño. CDC. August, 2022.
https://www.cdc.gov/mmwr/volumes/71/wr/m m7134a5.htm
6. “As extreme heat grips the globe, access to air conditioning is an urgent public health issue” Mann, Schuetz. Brookings. July, 2022.
https://www.brookings.edu/blog/the-avenue/20 22/07/25/as-extreme-heat-grips-the-globe-acces s-to-air-conditioning-is-an-urgent-public-health-i ssue/
7. “The U.S. needs better, more accessible home weatherization programs” Mann, Schuetz. Brookings. October, 2022.
https://www.brookings.edu/blog/the-avenue/20 22/10/10/the-u-s-needs-better-more-accessiblehome-weatherization-programs/
8. “Frequently Asked Questions (FAQ): OHP 1115 Medicaid Waiver for 2022-2027”. Oregon Health Authority.
Pandemic to Prosperity July 19, 2023 37
https://www.oregon.gov/oha/HSD/Medicaid-Poli cy/Documents/2022-2027-Waiver-FAQ.pdf
Census-driven federal funding by agency
1. “Counting for Dollars 2020” The Role of the Decennial Census in the Geographic Distribution of Federal Funds”. Reamer. GW Institute of Public Policy April, 2020.
https://gwipp.gwu.edu/counting-dollars-2020-ro le-decennial-census-geographic-distribution-fede ral-funds
2. “COVID-19 Pandemic Leads to Innovative Census Bureau Methods of Estimating U.S. Population” Hartley, Rogers, and Doren. U.S. Census Bureau. June, 2023.
https://www.census.gov/library/stories/2023/06 /blended-base-methodology.html
Vote share gap for Black voters in the 2020 general election
1. “Voting and Registration in the Election of November 2020”. U.S. Census Bureau. April, 2021.
https://www.census.gov/data/tables/time-series /demo/voting-and-registration/p20-585.html
2. “Turnout in 2020 election spiked among both Democratic and Republican voting groups, new census data shows” Frey Brookings. May, 2021.
https://www.brookings.edu/articles/turnout-in-2 020-spiked-among-both-democratic-and-republi can-voting-groups-new-census-data-shows/
3. “Large Racial Turnout Gap Persisted in 2020 Election” Morris, Grange. Brennan Center for Justice. August, 2021.
https://www.brennancenter.org/our-work/analy sis-opinion/large-racial-turnout-gap-persisted-20 20-election
4. “5 Reasons Why Section 5 of the Voting Rights Act Enhances Our Democracy” Bathija. Center for American Progress. February, 2013.
https://www.americanprogress.org/article/5-rea sons-why-section-5-of-the-voting-rights-act-enha nces-our-democracy/
5. “About Section 5 Of The Voting Rights Act”. U.S. Department of Justice.
https://www.justice.gov/crt/about-section-5-voti ng-rights-act
6. “The Impact of Voter Suppression on Communities of Color”. Brennan Center for Justice. January, 2022.
https://www.brennancenter.org/our-work/resea rch-reports/impact-voter-suppression-communiti es-color
Voting laws passed
1. “Turnout soared in 2020 as nearly two-thirds of eligible U.S. voters cast ballots for president” DeSilver Pew Research Center January, 2021.
https://www.pewresearch.org/short-reads/2021 /01/28/turnout-soared-in-2020-as-nearly-two-thi rds-of-eligible-u-s-voters-cast-ballots-for-preside nt/
2. “Voting and Registration in the Election of November 2020. U.S. Census Bureau. April, 2021. https://www.census.gov/data/tables/time-series /demo/voting-and-registration/p20-585.html
Anti-LGBTQ bills passed into law
1. “Over 100 Anti-LGBTQ+ Laws Passed In The Last Five Years – Half Of Them This Year” Rogers, Radcliffe, and Lodhi. FiveThirtyEight. May, 2023.
https://fivethirtyeight.com/features/anti-lgbtq-la ws-red-states/
2. “SC Legislation” LegiScan.
https://legiscan.com/SC/legislation/2023?status =introduced
3. “North Carolina governor vetoes 3 LGBTQ+ restrictions in ongoing fight with GOP”. Schoenbaum. PBS. July, 2023.
https://www.pbs.org/newshour/nation/north-ca rolina-governor-vetoes-3-lgbtq-restrictions-in-on going-fight-with-gop-supermajority
4. “Anti-Transgender Legislation” The Trevor Project.
https://www thetrevorproject.org/survey-2022/ #anti-transgender-legislation
5. “Survey: Anti-LGBTQ legislation takes alarming mental-health toll on queer youth” Gaffney Stat News. May, 2023.
https://www.statnews.com/2023/05/01/mentalhealth-lgbtq-youth/
Pandemic to Prosperity July 19, 2023 38
Underrepresentation of people of color among state supreme court justices, May 2023
1. “Diversity Matters: Judicial Policy Making in the U.S. Courts of Appeals”. Haire, Moyer. University of Virginia Press. 2015.
https://www.jstor.org/stable/j.ctt14bthkq
Average undergraduate tuition and fees (constant 2020-21 dollars)
1. “Pell Grants – a Key Tool for Expanding College Access and Economic Opportunity – Need Strengthening, Not Cuts” Protopsaltis, Parrott. Center on Budget and Policy Priorities. July, 2017.
https://www.cbpp.org/research/federal-budget/ pell-grants-a-key-tool-for-expanding-college-acce ss-and-economic#_ftn3
2. “Education Needs to Take Steps to Ensure Eligible Loans Receive Income-Driven Repayment Forgiveness” U.S. Government Accountability Office. March, 2022.
https://www gao.gov/assets/720/719612.pdf
3. “A regressive student loan system results in costly racial disparities”. Seamster, Aja. Brookings. January, 2022.
https://www.brookings.edu/blog/how-we-rise/2 022/01/24/a-regressive-student-loan-system-res ults-in-costly-racial-disparities/
4. “Making the Case: Solving the Student Debt Crisis” Shaw, Hansen. The Aspen Institute. March, 2020.
https://www.aspeninstitute.org/publications/sol ving-the-student-debt-crisis/
5. “Resuming Student Loan Payments May Slow Economic Growth” Moore. Forbes. June, 2023.
https://www forbes.com/sites/simonmoore/202 3/06/29/resuming-student-loan-payments-may-s low-economic-growth/?sh=26641b872caf
6. “Warning: Student loan cliff ahead” Peck. Axios. July, 2023.
https://www.axios.com/2023/07/10/student-loa n-payments
7. “Department of Education et al v Brown et al” The Supreme Court of the United States. June, 2023.
https://www.supremecourt.gov/opinions/22pdf/ 22-535_i3kn.pdf
8. “Biden-Harris Administration to Provide 804,000 Borrowers with $39 Billion in Automatic Loan
Forgiveness as a Result of Fixes to Income Driven Repayment Plans”. U.S. Department of Education. July, 2023.
https://www.ed.gov/news/press-releases/bidenharris-administration-provide-804000-borrowers -39-billion-automatic-loan-forgiveness-result-fixe s-income-driven-repayment-plans
Lack of health insurance coverage by race/ethnicity
1. “New study finds 45,000 deaths annually linked to lack of health coverage” Cecere. The Harvard Gazette. September, 2009.
https://news.harvard.edu/gazette/story/2009/09 /new-study-finds-45000-deaths-annually-linked-t o-lack-of-health-coverage/
2. “The Relationship of Health Insurance and Mortality: Is Lack of Insurance Deadly?” Woolhandler, Himmelstein. Annals of Internal Medicine. September, 2017.
https://www.acpjournals.org/doi/full/10.7326/ M17-1403
3. “The problem with Medicaid ‘unwinding’” Harvard T.H. Chan School of Public Health. July, 2023.
https://www.hsph.harvard.edu/news/features/t he-problem-with-medicaid-unwinding/
4. “Status of State Medicaid Expansion Decisions: Interactive Map” KFF July, 2023.
https://www.kff.org/medicaid/issue-brief/statusof-state-medicaid-expansion-decisions-interactiv e-map/
Lack of internet access by race/ethnicity, U.S.
1. “Internet/Broadband Fact Sheet” Pew Research Center April, 2021.
https://www.pewresearch.org/internet/fact-she et/internet-broadband/?tabId=tab-3109350c-8d ba-4b7f-ad52-a3e976ab8c8f
2. “Scaling the Digital Divide”. Vigdor, Ladd. National Center for Analysis of Longitudinal Data in Education Research. June, 2010.
https://citeseerx.ist.psu.edu/viewdoc/download ?doi=10.1.1.849.6663&rep=rep1&type=pdf
3. “Infrastructure Investment and Jobs Act Implementation” Federal Register January, 2022.
https://www.federalregister.gov/documents/202 2/01/10/2022-00221/infrastructure-investmentand-jobs-act-implementation
4. “Washington may be about to take a giant step backward in closing the digital divide” Levin. Brookings. March, 2023.
https://www.brookings.edu/blog/the-avenue/20
Pandemic to Prosperity July 19, 2023 39
23/03/13/washington-may-be-about-to-take-a-gi ant-step-backward-in-closing-the-digital-divide/
5. “Governors in 28 States Have Already Made Affordable Connectivity Program Adoption A Priority” Education Superhighway
https://www.educationsuperhighway.org/no-ho me-left-offline/governors/
6. “Free internet funding expected to run out in 2024 – what does this mean for you?” Smith. AllConnect. May, 2023.
https://www.allconnect.com/blog/acp-funding-t o-run-out
7. “AI and the next digital divide in education” Trucano. Brookings. July, 2023.
https://www.brookings.edu/articles/ai-and-the-n ext-digital-divide-in-education/
Counties with no or only one newspaper (“news deserts”)
1. “The State of Local News”. Abernathy. Northwestern Local News Initiative. June, 2022. https://localnewsinitiative.northwestern.edu/res earch/state-of-local-news/report/
2. “As ‘pink slime’ aims to fill local news vacuum, is anyone reading?” Caro. Northwestern Local News Initiative. March, 2023.
https://localnewsinitiative.northwestern.edu/po sts/2023/03/28/pink-slime-stanford-study/
3. “‘Journalistic meat or fraudulent filler’ – What is pink slime journalism?” David. Poynter October, 2022.
https://www.poynter.org/tfcn/2022/journalisticmeat-or-fraudulent-filler-what-is-pink-slime-jour nalism/
4. “‘Pink slime’ network gets $1.6M election boost from PACs backed by oil-and-gas, shipping magnates” Bengani. Columbia Journalism Review October, 2022.
https://www.cjr.org/tow_center/pink-slime-netw ork-gets-1-6m-election-boost-from-pacs-backedby-oil-and-gas-shipping-magnates.php
5. “Post and Courier awarded $25K grant to stem news deserts throughout SC”. Altman. The Post and Courier. April, 2023.
https://www.postandcourier.com/news/post-and -courier-awarded-25k-grant-to-stem-news-desert s-throughout-sc/article_23e50af0-de06-11ed-9f1 f-779896cecb25.html
6. “Summary: H.R.3940 117th Congress (2021-2022)”. Congress.Gov.
https://www.congress.gov/bill/117th-congress/h ouse-bill/3940
7. “Rebuilding Local News” Rebuild Local News. https://www.rebuildlocalnews.org/solutions/our -plan/
8. “Pro-Journalism Legislation Faces a
Make-or-Break Session” Burns. Northwestern Local News Initiative. October, 2022.
https://localnewsinitiative.northwestern.edu/po sts/2022/10/31/jcpa-congress-lame-duck/index. html
9. “The case for government support of local journalism” Caro. Northwestern Local News Initiative. March, 2023.
https://localnewsinitiative.northwestern.edu/po sts/2023/03/01/anna-brugmann-rebuild-local-ne ws/index.html
Percent of adults having difficulty paying for usual household expenses, by race/ethnicity
1. “Louisiana, South Carolina and Tennessee Residents Weigh in on Federal Funding”. The Southern Economic Advancement Project. May, 2023.
http://100.26.193.31/wp-content/uploads/2023 /06/Federal-Funding-Community-Needs-SurveyData-Report-June-2023.pdf
2. “Organizing for Federal Funds: Case Studies from Southern Organizers” The Southern Economic Advancement Project. May, 2023.
http://100.26.193.31/wp-content/uploads/2023 /05/Case-Studies-Organizing-for-Federal-FundsMay-2023.pdf
Severe housing cost burdens by county, 2017-21 (5-yr average)
1. “A Decade of Home Building: The Long Recovery of the 2010s” Dietz. National Association of Home Builders. January, 2020.
https://eyeonhousing.org/2020/01/a-decade-ofhome-building-the-long-recovery-of-the-2010s/
2. “Gap between income growth and housing cost increases continues to grow”. Binkovitz. Kinder Institute for Urban Research. July, 2019.
https://kinder.rice.edu/urbanedge/gap-betweenincome-growth-and-housing-cost-increases-conti nues-grow
3. “Housing Cost Burden, Material Hardship, and WellBeing” Shamsuddin, Campbell. Housing Policy Debate. March, 2021.
https://nlihc.org/sites/default/files/Housing-Cost -Burden-Material-Hardship-and-Well-Being.pdf
4. “The Rent Eats First – Rental Housing Unaffordability in the US” Airgood-Obrycki, Hermann, and Wedeen. Joint Center for Housing Studies. January, 2021.
Pandemic to Prosperity July 19, 2023 40
https://www.jchs.harvard.edu/sites/default/files
/research/files/harvard_jchs_rent_eats_first_airg
ood-obrycki_hermann_wedeen_2021.pdf
5. “‘A steady deterioration’: US communities face a public housing crisis”. Kofsky, Rosenfeld. ABC News. May, 2023.
https://abcnews.go.com/Politics/steady-deterior ation-us-communities-face-public-housing-crisis/ story?id=99049597
6. “Out of Reach: The High Cost of Housing” National Low Income Housing Coalition.
https://nlihc.org/oor
7. “Louisiana, South Carolina and Tennessee Residents Weigh in on Federal Funding” The Southern Economic Advancement Project. May, 2023.
http://100.26.193.31/wp-content/uploads/2023
/06/Federal-Funding-Community-Needs-SurveyData-Report-June-2023.pdf
Likelihood of eviction or foreclosure, June 7-19, 2023
1. “A Housing Market Hangover”. Kaysen. The New York Times. January, 2023.
https://www.nytimes.com/2022/12/30/realestat e/housing-market-prices-interest-rates.html
Food insecurity, June 7-19, 2023
1. “Food Prices and Spending” USDA
https://www.ers.usda.gov/data-products/ag-and -food-statistics-charting-the-essentials/food-pric es-and-spending/
2. “Food Inflation in the United States (1968-2023)” U.S. Inflation Calculator
https://www.usinflationcalculator.com/inflation/ food-inflation-in-the-united-states/
3. “Temporary Pandemic SNAP Benefits Will End in Remaining 35 States in March 2023”
Rosenbaum, Bergh, and Hall. Center on Budget and Policy Priorities. February, 2023.
https://www.cbpp.org/research/food-assistance
/temporary-pandemic-snap-benefits-will-end-inremaining-35-states-in-march
4. “East Manatee food pantries see consistent, growing demand”. Ramos. Your Observer. July, 2023.
https://www.yourobserver.com/news/2023/jul/1
7/east-manatee-food-pantries-see-consistent-de mand/
5. “New food bank center targeting another area of major need: Cobb County”. 11Alive. July, 2023.
https://www.11alive.com/article/life/food/new-f ood-bank-atlanta-cobb-county-austell-road-fair-o aks-marietta-square-family/85-1507e2e2-0a06-4 a6d-8834-43e523ff37cf
6. “Food Insecurity”. U.S. Department of Health and Human Services.
https://health.gov/healthypeople/priority-areas/ social-determinants-health/literature-summaries /food-insecurity
7. “Food Insecurity, Chronic Disease, and Health Among Working-Age Adults” Gregory, Coleman-Jensen. USDA July, 2017.
https://www.ers.usda.gov/webdocs/publications /84467/err-235_summary.pdf?v=0
8. “Excessive Stress Disrupts the Architecture of the Developing Brain” National Scientific Council on the Developing Child. May, 2005.
https://developingchild.harvard.edu/wp-content /uploads/2005/05/Stress_Disrupts_Architecture _Developing_Brain-1.pdf
9. “Mississippi’s grocery tax rate versus other states”. Grove. WJTV. June, 2023.
https://www.wjtv.com/news/state/mississippis-g rocery-tax-rate-versus-other-states/#:~:text=Groc ery%20taxes%20do%20not%20exist,highest%20t o%20lowest%20is%20below.
10. “After decades of attempts, major Alabama bill to cut state’s 4% grocery tax wins final passage” Chandler AP News. June, 2023.
https://apnews.com/article/alabama-legislaturegrocery-tax-cut-70b306a1dcb583ea707a055a73f 535fd
Pregnancy-related deaths, U.S.
1. “Maternal Health: Outcomes Worsened and Disparities Persisted During the Pandemic” U.S. Government Accountability Office. October, 2022.
https://www.gao.gov/products/gao-23-105871
2. “Trends in State-Level Maternal Mortality by Racial and Ethnic Group in the United States”. Fleszar, Bryant, Johnson, et al. July, 2023. JAMA Network.
https://jamanetwork.com/journals/jama/articleabstract/2806661
3. “Health Equity Among Black Women in the United States” Chinn, Martin, and Redmond. Journal of Women’s Health. February, 2021.
Pandemic to Prosperity July 19, 2023 41
https://www.ncbi.nlm.nih.gov/pmc/articles/PMC 8020496/
4. “Implicit Bias and Racial Disparities in Health Care”. Bridges. American Bar Association.
https://www.americanbar.org/groups/crsj/public ations/human_rights_magazine_home/the-state -of-healthcare-in-the-united-states/racial-dispari ties-in-health-care/
5. “How Our Health Care System Treats Black Mothers Differently” Seervai. The Commonwealth Fund. October, 2019.
https://www.commonwealthfund.org/publicatio ns/podcast/2019/oct/how-our-health-care-syste m-treats-black-mothers-differently
6. “Racial Misconceptions in Healthcare Are Killing Black Women” Blount, Biggers. Healthline. October, 2022.
https://www.healthline.com/health/racial-misco nceptions-in-healthcare-are-killing-black-women
7. “Working Together to Reduce Black Maternal Mortality” CDC. April, 2022.
https://www.cdc.gov/healthequity/features/mat ernal-mortality/index.html
8. “The Article That Could Help Save Black Women's Lives”. Stallings. Oprah.com.
https://www.oprah.com/health_wellness/the-art icle-that-could-help-save-black-womens-lives#ixz z5VRnkBHiz
9. “Maternal Health of Women and Girls of African Descent in the Americas” UNFPA July, 2023.
https://www.unfpa.org/sites/default/files/resour ce-pdf/UNFPA_MM_Analysis-July2023.pdf
10. “Health and Health Care for Women of Reproductive Age” Gunja, Seervai, Zephyrin, and Williams II. The Commonwealth Fund. April, 2022.
https://www.commonwealthfund.org/publicatio ns/issue-briefs/2022/apr/health-and-health-care -women-reproductive-age
11. “Mandated Implicit Bias Training for Health Professionals – A Step Toward Equity in Health Care” Cooper, Saha, and Ryn. Jama Network. August, 2022.
https://jamanetwork.com/journals/jama-healthforum/fullarticle/2795358
12. “Maternal death rates doubled in the past 20 years in the US”. Moore. Live Science. July, 2023. https://www.livescience.com/health/fertility-pre
gnancy-birth/maternal-death-rates-doubled-in-t he-past-20-years-in-the-us
13. “Racial Disparities in Maternal and Infant Health: Current Status and Efforts to Address Them”. Hill, Artiga, and Ranji. Kaiser Family Foundation. November, 2022.
https://www.kff.org/racial-equity-and-health-pol icy/issue-brief/racial-disparities-in-maternal-andinfant-health-current-status-and-efforts-to-addre ss-them/
14. “Medicaid Enrollment Patterns During the Postpartum Year” Corallo, Tolbert, Saunders, and Frederiksen. Kaiser Family Foundation. July, 2022.
https://www.kff.org/medicaid/issue-brief/medic aid-enrollment-patterns-during-the-postpartumyear/
15. “Medicaid Postpartum Coverage Extension Tracker” Kaiser Family Foundation. December, 2022.
https://www.kff.org/medicaid/issue-brief/medic aid-postpartum-coverage-extension-tracker/
16 “To help tackle US maternal health crisis, more states extend Medicaid postpartum coverage”. Howard. CNN Health. June, 2023.
https://edition.cnn.com/2023/06/17/health/mat ernal-health-crisis-medicaid-postpartum-coverag e/index.html#
Gun deaths among U.S. kids (under 18 years old)
1. “Preventing Gun Violence, the Leading Cause of Childhood Death” NIH. July, 2022.
https://www.nichd.nih.gov/about/org/od/direct ors_corner/prev_updates/gun-violence-July2022
2. “Gun deaths among U.S. children and teens rose 50% in two years” Gramlich. Pew Research Center April, 2023.
https://www.pewresearch.org/short-reads/2023 /04/06/gun-deaths-among-us-kids-rose-50-perce nt-in-two-years/
3. “Child and Teen Firearm Mortality in the U.S. and Peer Countries” McGough, Amin, Panchal, and Cox. KFF. July, 2023.
https://www.kff.org/global-health-policy/issue-b rief/child-and-teen-firearm-mortality-in-the-u-s-a nd-peer-countries/
4. “State Gun Laws and Pediatric Firearm-Related Mortality”. Goyal, Badolato, Patel, Iqbal, Parikh,
Pandemic to Prosperity July 19, 2023 42
and McCarter American Academy of Pediatrics. August, 2019.
https://publications.aap.org/pediatrics/article/1
44/2/e20183283/38493/State-Gun-Laws-and-Pe diatric-Firearm-Related?autologincheck=redirect ed
5. “Firearm-Related Injuries and Deaths in Children and Youth: Injury Prevention and Harm Reduction” Lee, Fleegler, Goyal, Doh, Laraque-Arena, and Hoffman. American Academy of Pediatrics.
https://publications.aap.org/pediatrics/article/1
50/6/e2022060070/189686/Firearm-Related-Inj uries-and-Deaths-in-Children
6. “U.S. Gun Violence in 2021: An Accounting of a Public health Crisis” Davis, Kim, and Crifasi. Johns Hopkins Center for Gun Violence Solutions. June, 2023.
https://publichealth.jhu.edu/sites/default/files/2
023-06/2023-june-cgvs-u-s-gun-violence-in-2021 .pdf
Symptoms of anxiety or depression, June 7-19, 2023
1. “Anxiety and Depression”. CDC.
https://www.cdc.gov/nchs/covid19/pulse/menta l-health.htm
2. “The Implications of COVID-19 for Mental Health and Substance Use” Panchal, Saunders, Rudowitz, and Cox. March, 2023.
https://www.kff.org/coronavirus-covid-19/issuebrief/the-implications-of-covid-19-for-mental-he alth-and-substance-use/#anxietyanddepression
3. “Rate of Deaths Involving Any Drug in the United States in 2020: 28.3 (per 100,000 Population”
https://public.tableau.com/app/profile/dcdd/viz /04_DrugOverdose/04_DrugOverdose
4. “Effect of increased alcohol consumption during COVID-19 pandemic on alcohol-associated liver disease: A modeling study” Julien, Ayer, Tapper, Barbosa, Dowd, and Chhatwal. AASLD December, 2021.
https://aasldpubs.onlinelibrary.wiley.com/doi/ab s/10.1002/hep.32272
5. “As gun violence reaches record levels in the US, an underlying trauma may be building up”. McPhillips. CNN Health. April, 2023.
https://www.cnn.com/2023/04/17/health/massshootings-mental-health/index.html
6. “2020 Fatality Data Show Increased Traffic Fatalities During Pandemic”. U.S. Department of Transportation. June, 2021.
https://www.nhtsa.gov/press-releases/2020-fata lity-data-show-increased-traffic-fatalities-duringpandemic
7. “Road Rage Shootings Are Continuing to Surge”. Burd-Sharps, Tetens, and Szkola. Everytown. March, 2023.
https://everytownresearch.org/reports-of-road-r age-shootings-are-on-the-rise/
8. “Screening for Anxiety Disorders in Adults” JAMA Network. June, 2023.
https://jamanetwork.com/journals/jama/fullarti cle/2806250?guestAccessKey=86b2bfe6-b947-4b fc-aea9-c22ca5d1da15&utm_source=For_The_M edia&utm_medium=referral&utm_campaign=ft m_links&utm_content=tfl&utm_term=062023
9. “Screening for Depression, Anxiety, and Suicide
Risk in Adults: A Systematic Evidence Review for the U.S. Preventive Services Task Force”
O’Connor, Henninger, Perdue, Coppola, Thomas, and Gaynes. Agency for Healthcare Research and Quality. June, 2023.
https://www.ncbi.nlm.nih.gov/books/NBK59280 5/
10. “Screening for Anxiety in Children and Adolescents”. Viswanathan, Wallace, Middleton, et al. JAMA Network. October, 2022. https://jamanetwork.com/journals/jama/fullarti cle/2797220
11. “988 Lifeline Performance Metrics” SAMHSA
https://www.samhsa.gov/find-help/988/perform ance-metrics
12. “New NAMI-Ipsos Poll Finds Low Familiarity of 988 Suicide & Crisis Lifeline but Broad Bipartisan Support for Federal Funding” National Alliance on Mental Illness. July, 2023.
https://www.nami.org/Press-Media/Press-Releas es/2023/New-NAMI-Ipsos-Poll-Finds-Low-Familia rity-of-988-Suicide-Crisis-Lifeline
Mental health among U.S. high school students, by sex and sexual identity
1. “Second Year of Pandemic Saw Spike in Child Mental Health Visits to ED”. Miller. Harvard Medical School. July, 2023.
https://hms.harvard.edu/news/second-year-pan demic-saw-spike-child-mental-health-visits-ed
Pandemic to Prosperity July 19, 2023 43
2. “State Suicide Rates Among Adolescents and Young Adults Aged 10-24: United States, 2000-2018”. Curtin. National Vital Statistics Reports. September, 2020.
https://www.cdc.gov/nchs/data/nvsr/nvsr69/nvs r-69-11-508.pdf
3. “Youth Risk Behavior Survey”. CDC. https://www.cdc.gov/healthyyouth/data/yrbs/p df/YRBS_Data-Summary-Trends_Report2023_50
8.pdf
4. “COVID-19 stressors and symptoms of anxiety and depression in a community sample of children and adolescents” Watson, Coiro, Ciriegio, Dakkak, Jones, Reisman, Kujawa, and Compas. ACAMH. September, 2022.
https://acamh.onlinelibrary wiley.com/doi/abs/1 0.1111/camh.12598
5. “Impact of Current Events” The Trevor Project. https://www.thetrevorproject.org/survey-2022/ #impact-of-current-events
6. “The Impact of Gun Violence on Children and Adolescents”. Panchal. KFF. October, 2022. https://www.kff.org/other/issue-brief/the-impac t-of-gun-violence-on-children-and-adolescents/
7. “Report on the Condition of Education 2023” Irwin. Institute of Education Sciences. May, 2023. https://nces.ed.gov/pubs2023/2023144.pdf
8. “Mapping Attacks on LGBTQ Rights in U.S. State Legislatures” ACLU April, 2023. https://www.aclu.org/legislative-attacks-on-lgbt q-rights?impact=
Pandemic to Prosperity July 19, 2023 44
ABOUT THIS SERIES
History has shown that large-scale crises accelerate pre-existing trends, exacerbate inequities, and permanently change societies and civic life. The American South has lagged on nearly every indicator of prosperity and equity for decades, and similar patterns are emerging following the Covid crises Pandemic to Prosperity: South offers an overview of the Covid-related impacts on our lives and livelihoods, governments, civic institutions, and overall well-being, with a focus on the states of Alabama, Arkansas, Florida, Georgia, Kentucky, Louisiana, Mississippi, North Carolina, South Carolina, Tennessee, Virginia, and West Virginia.
Pandemic to Prosperity: South’s thoughtfully-curated data serves to illuminate the challenges facing the South. In addition, this reliable source of wide-ranging, impartial information will be valuable in aligning public and private sector efforts and assessing the progress made, or the lack thereof, over time
The National Conference on Citizenship (NCoC) launched the Pandemic to Prosperity series in July 2020 to look at the nation as a whole and this is the twelve edition of Pandemic to Prosperity: South.
About Fair Count (FairCount.org) Founded by Stacey Abrams in 2019 and anchored in Georgia, Fair Count works to build long-term power in communities that have been historically undercounted in the decennial census, underrepresented at the polls, and whose communities are often torn apart in redistricting.
About the Southern Economic Advancement Project (TheSEAP.org) SEAP works to broaden economic power and build a more equitable future in the South through research, policy, and network-building Focused on 12 Southern states and marginalized/vulnerable populations within the region, SEAP amplifies the efforts of existing organizations and networks that work toward similar goals. The organization was founded by Stacey Abrams in 2019.
About the National Conference on Citizenship (NCoC.org) NCoC is committed to strengthening democracy by supporting local leaders and nonpartisan projects dedicated to citizen engagement and public service Our vision is one of full participation in our democracy, and that in doing so our democracy equitably and inclusively reflects the combined voices, dreams, and actions of all who call our country home.
Pandemic to Prosperity July 19, 2023 45
AUTHORS
Allison Plyer is the Chief Demographer for The Data Center of Southeast Louisiana. She is author of The New Orleans Index series, developed in collaboration with Brookings to analyze the state of the recovery post-Katrina and later to track the region’s progress toward prosperity. She is also a co-author of The New Orleans Prosperity Index which examines the extent to which economic outcomes have improved for Black New Orleanians since the end of the Civil Rights era. She served as an editor for Resilience and Opportunity: Lessons from the U.S. Gulf Coast after Katrina and Rita, a Brookings Institution Press volume. Allison is an international expert in post–Katrina demographics and disaster recovery trends and frequently provides commentary on recovery and development to media such as NPR, the Associated Press, the New York Times, and USA Today. Allison received her Doctorate in Science from Tulane University and has an MBA from the Kellogg Graduate School of Management at Northwestern University.
Alysha Rashid is a policy and data consultant with a focus on building a more equitable society through a social and racial lens. She supports nonprofit and government organizations across policy areas using data analytics and visualization to promote data-informed decisions for marginalized populations. Previously, Alysha’s focus was on increasing college access and success for underrepresented populations, developing her expertise as an admissions counselor, a high school college advisor, and ultimately a nonprofit administrator As the Director of Program and Operations for America Achieves and Bloomberg Philanthropies’ CollegePoint initiative, she oversaw day-to-day programming and led the data operations, working closely with the research and evaluation team. She received her MPP from the Harris School of Public Policy at the University of Chicago, and her BA from Adelphi University
Elaine Ortiz is the Lead Data Analyst for Pandemic to Prosperity Elaine is an expert in economic and demographic data for applied research to support informed decision-making and more resilient communities. She has 20 years experience in research design, implementation, data analysis, statistical methods, and writing on complex and technical topics for a lay audience. Elaine’s work in data dissemination is grounded in the importance of user-centered design and strategic communications for reaching targeted audiences. She is an expert in federal statistics (e.g. BLS, Census) and private sources of data (e.g. EMSI, Moody’s). Elaine has an MS in urban and regional planning from University of Iowa and a BA in economics from Hanover College.
Taylor Savell is Program Manager for the Census Quality Reinforcement Task Force at the National Conference on Citizenship, where she focuses on 2020 Census issues such as data quality and the use of census data for redistricting and federal funding. Prior to NCoC, Taylor worked at the Beeck Center for Social Impact and Innovation and co-authored the website USApportionment.org, which was the go-to resource for census watchers and journalists in the lead up to the release of the 2020 Census data for congressional apportionment. Taylor is a graduate of the Walsh School of Foreign Service at Georgetown University where she received her BS in International Politics.
Pandemic to Prosperity July 19, 2023 46
ACKNOWLEDGMENTS
Substantive contributors to this Pandemic to Prosperity report:
Seth Amgott, Census research and strategic communications
Cameron Blossom, Communications and design, NCoC
Cameron Hickey, Chief Executive Officer, NCoC
John Kilcoyne, Project manager, NCoC
Tamika Turner, Strategic communications
Suggested citation format:
Plyer, A., Rashid, A., Ortiz, E., & Savell, T. (2023, July 19). Pandemic to Prosperity: South.
Retrieved from: PandemicToProsperity.org
For More Information
Allison Plyer, Chief Demographer, The Data Center, allisonp@datacenterresearch.org
This report is dedicated to all of the data heroes in state, local, federal government, institutions, nonprofits, and volunteer organizations who make these types of analyses possible.
Pandemic to Prosperity July 19, 2023 47