
42 minute read
Covid-associated hospitalizations for U.S. seniors spiked in the most


recent Covid surge.
Covid-associated hospitalizations per 100,000 population by age, U.S. Aug 1, 2020 - Jan 7, 2023
Advertisement
Source: HHS Covid-19 datasets and Census Bureau Vintage 2021 PEP Notes: 7-day average of new admissions for confirmed Covid cases. Based on reporting from all hospitals (n=5,317).
Though Covid hospitalizations are below the Omicron surge in early 2022, the CDC’s Community Transmission map shows high levels of community transmission across the nation, meaning that many counties have 100 or more new cases per 100,000 persons and 10.0% or more positive diagnostic tests (NAATs).1,2 The newest variant, XXB.1.5, is said to be highly transmissible and experts express concern as hospitalizations rates tick upwards for all ages in the 2022-2023 winter season.3,4,5,6 For those ages 70 and up, the concerns are even greater. As of January 7, 2023, elderly people ages 70 and up were 9 times more likely to be hospitalized than adults between the ages of 18-59.
Vaccine take-up, while traditionally high for seniors, has been lower for the most recent updated booster shot. 94% percent of Americans ages 65 and up received a complete primary dosage but only 39% have gotten their updated bivalent booster shot.7 Studies indicate that the updated bivalent booster shot is more effective than the initial vaccines in protecting against Covid.8,9 Medical experts encourage communities to get boosted and get vaccinated in an effort to ease overwhelmed hospitals and health care workers.10,11,12
Sparked by the Covid crisis, life expectancy has declined by 4+ years for Black, Hispanic, and American Indian populations.
Life expectancy at birth by race/ethnicity, U.S. 2019-21
Source: CDC National Center for Health Statistics Data Brief and Report. Notes: Life expectancy at birth is defined as how long, on average, a newborn can expect to live, if current death rates do not change. However, the actual age-specific death rate of any particular birth cohort cannot be known in advance Estimates for 2021 for race/ethnicity are provisional. Race is for the non-Hispanic population.

Life expectancy in the U.S. dropped in 2021 for a second year in a row, losing 25 years of progress and reaching its lowest level since 1996.1 (In comparison, studies show that peer nations had modest increases in life expectancy from 2020 to 2021.2,3) Life expectancy declined from 78.8 years in 2019 to 76.4 in 2021, a loss of 2.4 years. Based on provisional 2021 data, the declines were greater for Black, Hispanic, and American Indian/Alaska Native (AIAN) populations. Black Americans saw a 4.0 year decrease, while AIAN saw a massive 6.6 year decrease from 2019 to 2021, bringing life expectancy to 70.8 years and 65.2 years, respectively. Though life expectancy for Hispanic populations (77.7 years) is still above the overall U.S. life expectancy, there was a 4.2 year decrease from 2019 to 2021. While Covid was a significant contributor in driving down life expectancy, health disparities rooted in discrimination and systemic racism have long impacted these populations.4,5,6,7,8
8 of the 10 leading causes of death in 2019 remained the same in both 2020 and 2021, with newly added Covid becoming the third highest cause, surpassed only by heart disease and cancer 9,10,11 Over the last 3 years, the nation has seen 400,000 excess deaths among working-age Americans due to Covid as well as other causes such as overdoses, suicides, motor vehicle deaths, and pregnacy-related deaths (Motor Vehicle Deaths, Maternal Mortality).12
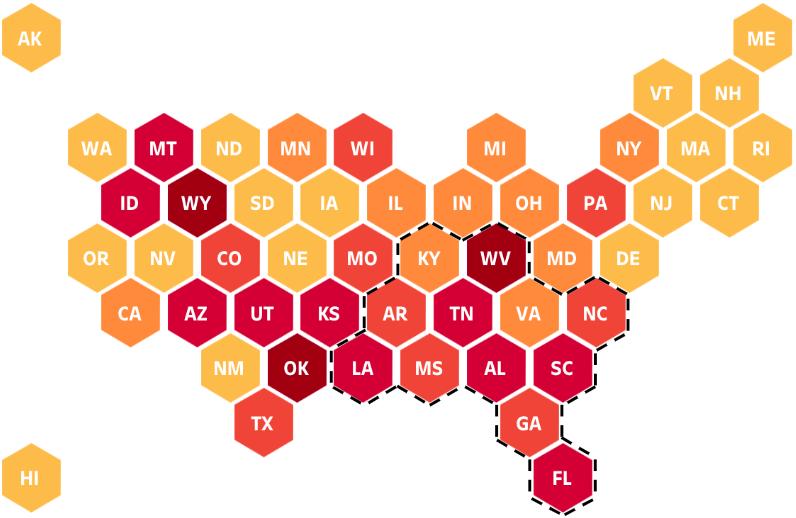
30% of Southerners who previously had Covid currently suffer from Long Covid symptoms. In Mississippi, it’s 37%.
Long Covid estimates, Dec 9-19, 2022 who previously had Covid, with symptoms lasting 3 months or longer
Source: Census Bureau’s Household Pulse Survey
Among those who previously had Covid, 30% of Southerners (and 27% of non-Southerners) are currently experiencing prolonged symptoms, known as Long Covid.1 Long Covid largely affects immune and circulatory systems, as well as the brain and lungs.2,3,4,5 Consistent with the Census Bureau’s Household Pulse Survey results, experts find that one-third of Covid patients continue to become Long Covid patients.6,7 A new study finds that most Long Covid patients experienced a mild initial Covid infection, yet still developed prolonged symptoms that affected their daily lives.8,9 It also found that women were more likely to develop Long Covid, though scientific evidence as to why remains outstanding.
While new studies aimed at understanding Long Covid have provided more awareness, developing new medical treatments for patients with Long Covid has been slow for a condition that is likely to become very widespread.10,11,12 Many Long Covid patients face challenges finding health care plans that cover the extensive testing and doctors visits, and many are denied shortand long-term disability.13,14,15,16 For those with insurance, some patients turn to clinical trials to explore the newest safe and efficient treatments. Long Covid patients from Alabama, Florida, and Georgia were part of a recent study that created four subcategories of Long Covid, allowing doctors to route patients towards the best possible treatment.17,18 Safe and effective treatments for Long Covid patients are crucial to the nation’s economic recovery, as symptoms have sidelined an estimated 1.3 to 4.3 million workers from the workforce (Total jobs).19

Motor vehicle fatalities reached 14.3 per 100,000 population in 2021, up from 11.9 in 2019. Rates spiked by 8, 6, and 3 percentage points for American Indian, Black, and Hispanic populations, respectively.
Motor vehicle deaths per 100,000 population, U.S. 1913-2021
Sources: CDC/ Wonder and National Safety Council Notes: Motor-vehicle deaths include all deaths arising from a motor vehicle accident, including pedestrians and bicyclists struck by a motor vehicle, as well as non-traffic motor vehicle deaths occurring in parking lots, private roads, and driveways Data for 2021 is provisional
Motor vehicle death rates declined by more than half between 1969 and 2014, falling from 27.7 to 11.1 deaths per 100,000 population. From 2015 to 2019, rates hovered around 12. Then, although travel declined across the world at the start of the pandemic, motor vehicle death rates in the U.S. increased two consecutive years, reaching 14.3 in 2021. Comparatively, peer nations have maintained lower motor vehicle fatality rates, with fewer increases since 2019.1,2,3

Non-white Americans saw the largest increases in motor vehicle death rates. Black populations saw a 37% increase in motor vehicle deaths per 100,000, with Hispanic populations seeing a 30% increase. In comparison, white and Asian populations had a much smaller increase 12% and 9%, respectively American Indian/Alaska Native (AIAN) populations historically have the highest rate of motor vehicle deaths, seeing a 32% increase from 2019 to 2021 and a rate of 34 deaths per 100,000 people in 2021. While studies traditionally point to alcohol and drug abuse as causes of high rates of motor vehicle fatalities, they tend to overlook the historical trauma and mistreatment of AIAN populations that are linked to these “diseases of despair” 4,5,6,7,8
Though the U.S. has made strides in creating safer motor vehicles and protecting those inside of them, transportation safety experts are concerned that not enough progress has been made to protect pedestrians and cyclists.9 When accounting for differing levels of travel by race, studies show that Black and Hispanic Americans who are walking or cycling are more likely to be killed in a traffic fatality than white Americans.10 This is particularly troubling as the higher risk for these physical activities could limit the health benefits for populations that would benefit the most.11 The Bipartisan Infrastructure Law includes efforts to enact policies that will improve roadway safety and infrastructure.12,13 Continued efforts to increase the safety of those inside and outside of vehicles are critical to reversing these trends.
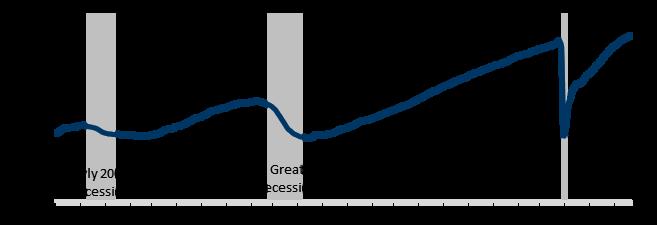
In December, U.S. jobs reached a record 153.7 million. About 250,000 new jobs were added every month during the last quarter of 2022.
Total jobs by month, U.S. Jan 2000 - Dec 2022
Source: Bureau of Labor Statistics. Note: Seasonally adjusted. Data for Nov 2022 and Dec 2022 are preliminary. While 22 million jobs were lost when Covid hit in 2020, they were all fully recouped by August 2022. By the end of 2022, the nation had reached a new record of 153.7 million jobs (1.2 million more than the pre-pandemic February 2020 level) and had an unemployment rate of 3.5% (equal to the pre-pandemic February 2020 level).1,2
But the U.S. workforce hasn’t grown enough to accommodate this job growth. In November 2022, there were 10.5 million job openings and only 6 million job seekers.3,4 A number of factors have contributed to a reduced American labor force. The country has seen 400,000 excess deaths among the working-age population in the last 3 years due to Covid as well as other causes such as overdoses, suicides, motor vehicle deaths, and pregnancy-related deaths (Motor Vehicle Deaths, Maternal Mortality).5,6 Long Covid has reduced the workforce by an estimated 1.3 to 4.3 million workers (Long Covid Estimates).7 Americans are retiring at higher than average rates and restrictions on immigration have saddled the country with a million worker deficit.8 Additionally, lack of child care kept a million parents of young children from looking for work in 2022.9
Together, the Bipartisan Infrastructure Law and the Inflation Reduction Act are predicted to create over 2 million new jobs each year for 10 years.10,11 Ensuring that Americans are healthy and have the child and elder care they need to be able to take advantage of these jobs will be important for ensuring a sufficient supply of workers. In addition, these new jobs will encompass a large variety of occupations.12 Helping workers build the skills necessary to fill these jobs and to transition from old industries to new industries will require substantial retooling of current workforce development systems, ramping up paid apprenticeships, and a host of new approaches to rapidly onboard new workers.13,14,15
Quits
Dec
rate by industry, U.S.
2000 - Nov 2022
Source: Bureau of Labor Statistics Notes: The quits rate is the number of quits during the entire month as a percent of total employment Quits include employees who left voluntarily except retirements or transfers to other locations. Data is seasonally adjusted. Nov 2022 data is preliminary.

Enabled by a strong economy and a tight labor market, more than 4 million workers quit jobs in November 2022 in pursuit of better jobs. The job quits rate was highest in leisure and hospitality (5.4% in November) and in retail (3.9% in November) where wages are typically low A groundswell of grassroots activism has led to increased worker organizing across Starbucks and Apple stores, as well as Amazon warehouses.1 In addition to higher wages, greater union membership could contribute to more stable employment and reduced churn in the labor market over time.2
But these gains could be undercut as the Federal Reserve works to tame inflation by dramatically increasing interest rates with the intention of reducing demand and increasing unemployment.3 When unemployment increases, low-wage workers historically bear the brunt of job losses. Moreover, recent inflation has been driven by several factors including supply chain breakdowns and corporate profits surging – neither of which will be corrected through rising interest rates (Corporate Profits).4 The Inflation Reduction Act and the CHIPS and Science Act aim to reduce inflation by addressing supply chain issues, while containing key healthcare costs.5 Inflation grew more slowly in the last half of 2022 and actually decreased in December 2022 to an annual rate of 6.5% — down from a high of 9.1% in June 2022.6,7
Corporate profits and employee wage & salary compensation, U.S. Indexed to 1954
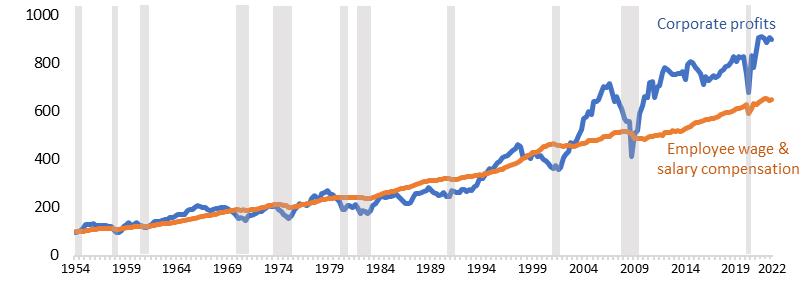
Sources: Federal Reserve Bank of St Louis and Bureau of Economic Analysis (BEA) Notes: Corporate profits (also known as “profits from current production”) are before tax and include the inventory valuation adjustment and capital consumption adjustment Both corporate profits and employee wage & salary compensation are adjusted for inflation using the GDP implicit price deflator, and indexed to 100 in 1954. Gray bars= recessions.
Historically, corporate profits and employee compensation have tended to fall during recessions and rebound afterward, with corporate profits swinging more widely than employee compensation. But since 2000, the growth in corporate profits has greatly outstripped growth in employee compensation.1 Experts attribute these unprecedented increases to increased “corporate market power.” As corporations have consolidated and purchased smaller companies, they have less competition, which allows them to demand higher prices of consumers. This, in turn, contributes to inflation.2
Average hourly earnings have nudged upward from $31.38 in December 2021 to $32.82 in December 2022.3 But corporate profits have surged growing from a then record-high of $2.5 trillion in Q3 2020 to $3.0 trillion in Q3 2022.4 If the labor market continues to be tight, and workers continue to push for higher wages, weak competition among corporations will allow companies to pass on these costs by raising prices further to maintain high profit margins.
Recent inflation has been driven by several factors, including rising wages, corporate market power, and supply chain disruptions.5 Policymakers interested in reining in inflation while minimizing the ill effects of increasing unemployment among low-wage workers can focus on measures that increase competition, thereby curbing corporations’ ability to raise prices.6 ounty-level disasters county (parish) has experienced 12 or more FEMA-declared disasters since March 2020.
75% of Southerners live in counties that have experienced disasters in the last 3 years compared to 64% of non-Southerners.


As a result, federal spending on disaster relief more than doubled in 2020 and 2021 compared to 2018 or 2019.2 But the time- and document-intensive FEMA application process has been shown to increase inequity because it is too burdensome for smaller/rural municipalities and people with low-incomes.3 Moreover, the supply of available housing diminishes, and housing costs (including insurance) increase after disasters.4
The previous section examined how the pandemic has affected the lives and livelihoods of Americans. The next section moves from damage assessment to tracking measures that will be important as we continue to recover from the Covid crisis.
This Prosperity section examines measures of high-functioning governments and civic institutions that are essential for community well-being and prosperity. Importantly, this section ends with metrics that assess how people are doing during the pandemic across geography, race, and sex.

With substantial new federal funding being distributed to local and state governments and families, tracking these funding streams and their impact will be essential going forward. This section examines key assessments of the accuracy of demographic data used to distribute funding. We also include a measure of the reliability of electrical infrastructure in each state. This section ends with indicators on diversity in the 118th U.S. Congress, and the number of candidates elected to the U.S. House of Representatives who denied the validity of the 2020 election.
Indicators in this section
● Average annual duration of electric power interruptions, by state
● U.S. Census Bureau Population Estimates Program
● Demographics of 118th Congress compared to U.S. population
● 2020 election deniers in the U.S. House of Representatives
Louisiana customers averaged 80 hours of power interruptions in 2021, compared to 7 hours for the average U.S. customer.
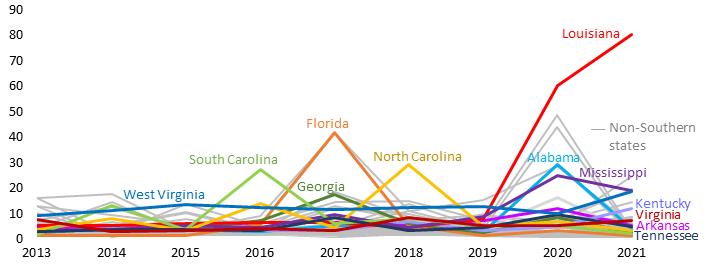
Average annual duration of electric power interruptions, by state Hours per customer
Source: U S Energy Information Administration Notes: "Momentary" interruptions that last 5 minutes or less are generally omitted. Data reported by utilities using IEEE standard as well as any other method.
Winter Storm Elliott, which struck much of the country in December 2022, left hundreds of thousands of Southern homes without power and was a stark reminder of the fragility of America’s power grids.1 Extreme weather events tend to cause the longest interruptions.2 And as weather events become larger, affecting a wide swath of the country, the nation’s balkanized power grid means energy cannot travel to affected areas from unaffected areas.3 A more unified system would make the U.S. energy infrastructure more resilient. Such a system will also be critical for ensuring new sources of renewable energy generated in one part of the country can be transmitted to parts of the country with less wind and solar energy supplies.4 The Inflation Reduction Act includes funding to increase the development of U.S. electricity transmission infrastructure.5 From 2013 to 2021, Louisiana had the highest cumulative hours (183) of power interruptions of all states, and West Virginia had the third highest hours of interruptions (111).
Greater security for electric utilities is also needed. A December shooting attack on a North Carolina electrical substation left tens of thousands of people without power for nearly a week. The Department of Homeland Security has warned that domestic terrorists consider the U.S. power grid to be an attractive target due to lax security regulations.6
U.S. Census Bureau Population Estimates Program
Full-time equivalent staff and annual budget (2022 dollars, in millions)
Source: U S Census Bureau, Intercensal Estimates budgets, as compiled by Ron Prevost, Ph D , Research Professor, Massive Data Institute, Georgetown University Notes: Years represent fiscal years FTE= Full-time equivalent

Each year, the Census Bureau produces a series of population estimates through the Population Estimates Program, an update of the once-every-ten-year population counts for states, cities and counties. These estimates are used in data products like the American Community Survey and help determine the distribution of $1.5 trillion in population-based federal aid.1
Improving the Population Estimates Program could mitigate issues in the 2020 Census, which undercounted people of color, the very young, and the population of 6 states, according to the Census Bureau’s own measures of accuracy. (Populations of 8 states, white people, and older Americans were overcounted.) These measures found the 2020 Census missed close to 5% of people of Hispanic origin (triple the rate in 2010), children up to age 4 (the most in 50 years), and residents of Tennessee and Arkansas.2 These miscounts leave some communities receiving less than their fair share of population-based funding.
Census Bureau Director Robert Santos has appointed a team to investigate improving the estimates.3 Professor Ron Prevost of the Massive Data Institute at Georgetown, a member of the Census Scientific Advisory Committee, researched one potential obstacle: The estimates budget, down 20% since 2003, and staffing levels, down 33%.
Demographics of 118th Congress compared to U.S. population
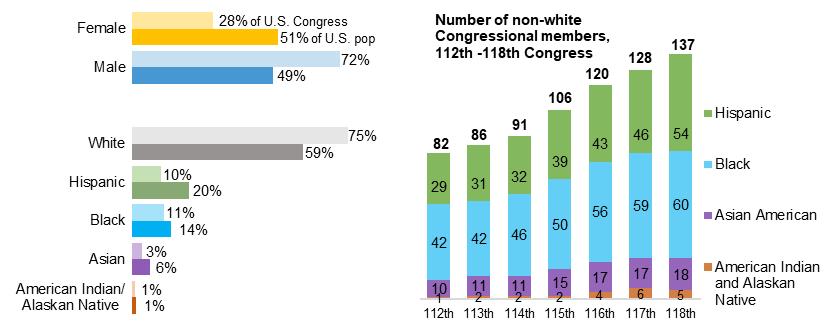
Source: Pew Research Center and Census Bureau Notes: Data reflects the 534 voting members of the 118th Congress as of Jan 3, 2023 Data does not include non voting delegates or commissioners White population is non-Hispanic. Members with more than one racial/ ethnic identity are counted in each applicable group.
The 118th Congress, convened on January 3rd, is the most racially and ethnically diverse Congress in American history, with more than a quarter of current members of Congress identifying as non-White and/or Hispanic. This continues a trend of increasingly racially and ethnically diverse representation in Congress, with the 118th Congress being the seventh Congress to break the record set by the one before it. The vast majority (80%) of racial and ethnic minority members in the new Congress are Democrats, while 20% are Republicans similar to the previous Congress.1 Additionally, 129 women hold seats in Congress more than ever before and there are a record-breaking 13 lesbian, gay, or bisexual members of Congress.2,3
Despite these gains, Congress still lacks the diversity of the country’s population. Women make up 51% of the U.S. population but hold only 28% of the seats in Congress. 10% of the members of Congress are Hispanic, compared to 20% of the nation’s population. Black and Asian representation in Congress both lag by 3 percentage points. Additionally, this Congress is, on average, one of the oldest in the last century with a median age of 63.9 years in the Senate and 57.5 years in the House.4
49% of Southerners and 22% of non-Southerners have a “2020 election denier” representing them in the U.S. House of Representatives.
Percent of U.S. House of Representatives seats held by a “2020 election denier”
Source: FiveThirtyEight, House.gov. Notes: “2020 election denier” is defined as someone who has fully denied the results of the 2020 election, having clearly stated (in media interviews, public debates, campaign materials, social media and/or through direct outreach from FiveThirtyEight) that the 2020 election was stolen from Donald Trump or taken legal action to overturn the results
Despite there being no evidence of widespread fraud in the 2020 election and expert consensus that it was secure, more than 300 candidates across the country who ran for election last November denied the results of the 2020 election, all Republicans.1,2,3 Polling shows that concern over the “future of democracy” was among the top reasons voters turned out to cast their ballots and election deniers lost in a number of key battleground races particularly for offices with a responsibility to administer or oversee elections.4,5 However, at least 125 election deniers were elected or re-elected to the House of Representatives. In the current Congress, 48% of Southerners are represented by a 2020 election denier, as are 22% of non-Southerners.
These claims by candidates at the national, state, and local levels are a continuation of the surge of misinformation and disinformation since 2020 especially on the topics of election integrity and the Covid pandemic. This misinformation can have a significant impact on public confidence in the political system. A 2022 survey found that 64% of Americans believe that U.S. democracy is in crisis and is at risk of failing.6
Beyond governments, American society has always depended on a wide array of civic institutions to provide critical information to constituents, hold governments accountable, and offer support to families and workers to be healthy, educated, and productive. This section examines civic institutions and whether they are fair, effective, and sufficiently available.
This section of Pandemic to Prosperity examines local news and internet access to assess communities’ ability to receive critical information and remain connected in a world that is dramatically more digital than just three years ago. We also look at the availability of health insurance to identify gaps in resources critical for helping Americans be healthy and productive.
Indicators in this section
● Lack of health insurance coverage, by county
● News deserts, by county
● Lack of internet access, by county Pandemic

In states that have not implemented Medicaid expansion, 18% of the population lacks health insurance, compared to only 10% in states
2017-21 (5-yr average)

munity Survey 2017-21 and Kaiser Family Foundation Note: South Dakota edicaid expansion. Wisconsin has partially expanded Medicaid (under a der 100 percent federal poverty level, but did not adopt the ACA ance are less likely to get the medical care they need. When they w-up care prescribed for them, and those that have chronic til they appear in emergency rooms. In 2010, the Affordable educe the number of uninsured people across the country ell as through new subsidies for health insurance tial new federal subsidies, 11 states (7 of them in the South) xpansion. In many counties in these non-expansion states, 30, is uninsured. Hospitals in communities with high rates of financially strapped and high uninsurance rates have led to many the South.1,2 Texas (one of the 11 states that has not adopted ed rate in the U.S. at 24% during 2017-21. Florida, Georgia, and Mississippi also had very high uninsured rates, of 19%, 18%, and 18%, respectively Those uninsured individuals that do get medical treatment are likely to incur medical debt (Medical Debt).
75% of Southern counties (50% of non Southern counties) have one or viving trusted local news. In alled the Gulf State Newsroom Journalism Sustainability Act, Southern states (GA, MS, NC, employment at local news


21% of Southern counties have poor internet access (defined as one-quarter of households without internet) compared to only 6% of


2017-21 (5- e)
Expanding

scatt well positioned to deliver essential services including broadband to underserved communities, but due to lobbying efforts from private telecom companies, many states have passed laws preempting localities from building and operating their own internet infrastructure.2
At the end of the day, governments and institutions are responsible for ensuring the well-being of the communities they serve. This section examines key metrics of economic well-being including current data on employment rates by race and ethnicity, medical debt, child poverty, and food and housing insecurity It includes key measures of health: working-age death rates, maternal mortality rates, and anxiety and depression levels.
Indicators in this section

● Child poverty rates, by state
● Working-age death rates from external causes, by state
● Pregnancy related death rates, by race/ethnicity
● Employment rate, by race/ethnicity
● Medical debt, by state
● Renters with severe housing cost burdens, by county
● Likelihood of eviction or foreclosure, by state
● Food insecurity, by state
● Symptoms of anxiety or depression, by state
19% of Southern children live in poverty, compared to 16% of children outside the South. 10 Southern states have passed laws preempting localities from passing increased minimum wage ordinances.
Child poverty rates, 2021
P under 18 years old living below the poverty level
The Congressional Budget Office found that 500,000 children could be lifted out of poverty if the U.S. minimum wage were lifted to $15.1 Yet at $7.25/hr the federal minimum wage remains less than half of that target. Thirty states have set a minimum wage above $7.25 but only three non-Southern states plus D.C. have a minimum wage as high as $15 (effective Jan 1, 2023). Those states that have increased their minimum wage have an average minimum wage of only $12.45/hr. In addition, 26 states have passed laws that prohibit localities from passing minimum wage ordinances higher than the state minimum wage – effectively barring localities from setting a minimum wage as high as $15/hr.2,3
28% of Mississippi children and 27% of Louisiana children live below the poverty level the highest rates of child poverty in the nation. Mississippi and Louisiana are among the 20 states that do not have a statewide minimum wage that is higher than the federal minimum of $7.25 per hour Mississippi and Louisiana are also two of the 26 states that preempt local governments from establishing higher minimum wages locally that would help alleviate poverty within their communities.4
Working-age death rates from external causes were 33% higher in Southern states compared to non-Southern states. Working-age deaths from external causes per 100,000 population, 2021 opula
Source: CDC Wonder, NCSL, and EPI Notes: PSL= paid-sick leave External causes of death include: suicide (X66-X84, Y87 0), homicide (X86-X99, Y00-Y09, Y87 1), drug poisoning (X40–44, X60-X64, X85, Y10-Y14), acute alcohol poisoning (X45, X65, Y15), and transport accidents (V01-V99, Y85). Data is provisional and age-adjusted.
Since 2010, working-age mortality rates have been increasing, largely due to drug overdoses, alcohol poisoning, suicide, homicide, and traffic accidents (Motor Vehicle Deaths). In 2021, working-age death rates from “external causes” were 33% higher in Southern states than elsewhere in the U.S. Researchers have found that paid sick leave reduces deaths from these “external causes.”
The U.S. is the only wealthy country that does not mandate paid sick leave for workers.1 Paid sick leave reduces the spread of infections at workplaces and increases worker retention. Workers without paid sick leave are less productive and more likely to be injured at work. Moreover, workers without paid sick leave experience greater financial stress, and subsequently are more likely to overdose on drugs and to commit suicide.2,3 More than 35 U.S. cities or counties have passed paid sick leave ordinances, but several states have stepped in to outlaw such local ordinances.4 In 2010, only 1 state (Georgia) prohibited localities from mandating paid sick leave. By 2019, 23 states had passed laws that preempted localities from mandating paid sick leave.5 Every southern state (except Virginia and West Virginia) has preempted localities from passing paid sick leave ordinances and does not mandate it statewide effectively prohibiting paid sick leave across the state.

Pregnancy-related deaths spiked during the pandemic. The mortality rate for Black women
is more than 2 times the rate for white women.
Maternal mortality rates by race/ethnicity, U.S. Pregnancy-related deaths per 100,000 live births

Sources: CDC Provisional Mortality Statistics (deaths) and CDC Natality Information (births) and GAO Notes: Rates based on fewer than 20 deaths are suppressed (not available) because of reliability and confidentiality. A maternal death is defined as the death of a woman while pregnant or within 42 days of termination of pregnancy, from any cause related to or aggravated by the pregnancy or its management, but not from accidental or incidental causes.
Giving birth can be life-threatening and pregnancy-related deaths are more common in the U.S. than in any other developed country. In 2020, the U.S. had 24 maternal deaths for every 100,000 live births more than 3 times the rate of other high income countries.1 Provisional data for 2021 shows that maternal deaths per 100,000 live births in the U.S. spiked to 33. Among maternal deaths, racial disparities persist. Pregnancy-related deaths in the U.S. were 2.6 times more likely for Black people (70) than for white people (27) during 2021. Black women have historically faced racial discrimination, bias, and inequity in health care systems, for pregnancy-related and other care.
2,3,4,5,6,7
According to GAO estimates, 25% of pregnancy-related deaths that occurred in 2020 and 2021 listed Covid as a contributing cause of death. Covid complications were a driver of the spike in maternal deaths, with experts expressing the need for more research on the impact of Covid-19 in pregnant people.8,9,10 Black and Hispanic communities were disproportionately impacted by Covid, facing barriers to quality health care, economic and community safety, transportation and more.11,12,13
Maternal morbidity — short- or long-term health problems related to pregnancy, birth, or postpartum period is largely overlooked in the U.S. It affects 50,000-60,000 people annually, with similar racial, regional, and age disparities as maternal death rates.14, 15 Among efforts to reduce maternal health disparities, the 2021 American Rescue Plan Act included a 12-month postpartum coverage extension option that expanded Medicaid postpartum coverage from 60 days to 12 months after giving birth.16,17 27 states have implemented the extension, 9 of which are Southern states (FL, GA, KY, LA, NC, SC, TN, VA, WV).18
At 60.1%, the Dec. employment rate is 1 percentage point below the pre-pandemic February 2020 level. But employment rates vary from a low of 58.9% for Black adults to a high of 63.5% for Hispanic adults.
Employment rate (age 16+) by race/ethnicity, U.S.
Jan 2008 - Dec 2022
Source: Bureau of Labor Statistics Note: The employment rate is officially known as the “employment-population ratio.” Here it is calculated for the population 16 years and older. Data is seasonally adjusted.
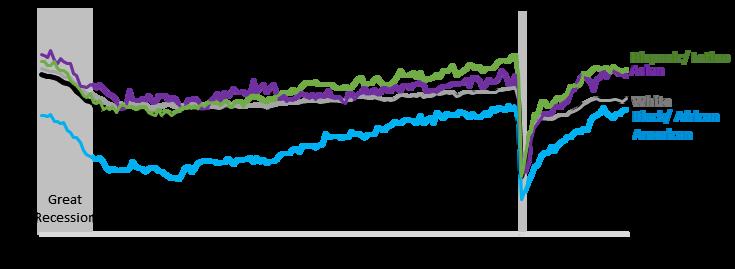
While jobs have surpassed pre-pandemic levels, the share of the population age 16+ with employment remains 1 percentage point below February 2020. Several factors may be contributing to fewer people seeking employment, including lack of available and affordable child care, Americans retiring in higher than projected numbers, and an estimated 1.3 to 4.3 million Americans sidelined by Long Covid (Long Covid Estimates).1,2,3
Annual wage growth in December (4.5%) did not keep up with inflation (6.5%).4,5 Meanwhile, corporate profits have skyrocketed growing from a then record-high of $2.5 trillion in Q3 2020 to $3.0 trillion in Q3 2022 — indicating that corporations have capacity to pay higher wages and draw workers in from early retirement, without contributing to inflation.6,7,8
About 17% of Southerners hold medical debt in default, compared to 11% of Americans outside the South. Share of individuals with medical debt in collections
Source: Urban Institute and Kaiser Family Foundation Note: Universe is people with a credit bureau record Debt in collections includes past-due credit lines that have been closed and charged-off on the creditor’s books as well as unpaid bills reported to the credit bureaus that the creditor is attempting to collect South Dakota has adopted but not yet implemented Medicaid expansion.
Based on February 2022 credit bureau data, about 17% of Southerners had medical debt in collections compared to only 11% for non-Southerners. Most states in the deep South have failed to implement Medicaid expansion or were late to implement it, thus contributing to higher medical debt for their residents.1 In fact, 8 of the 10 states with the highest shares of residents with medical debt were Southern: West Virginia (24%), South Carolina (22%), North Carolina (20%), Louisiana (18%), Arkansas (18%), Tennessee (18%), Georgia (17%), and Kentucky (17%).
Medical debt often means families forgo medical care or make tough tradeoffs between paying for food, rent, or medical expenses, worsening both housing and food insecurity (Likelihood of Eviction or Foreclosure, Food Insecurity).2,3 Seven Southern states (AL, GA, FL, MS, NC, SC, and TN) can reduce medical debt levels by adopting Medicaid expansion. Southern states and localities can go further by paying off residents’ medical debt. The New Orleans City Council has set aside $1.3 million of its federal American Rescue Plan funds to erase $130 million in medical debt for New Orleans residents. The money would go to RIP Medical Debt, a national nonprofit that buys medical debt in collections and then forgives the debt.4

25% of U.S. renters pay the majority of their household income on housing costs In Louisiana and Florida it’s 29% of renters
Income

white renters are considered cost burdened.6 Evidence of housing discrimination in the U.S. still remains. A 2018 study found that Black households were more likely to pay higher rent prices than their white counterparts for identical housing in the same neighborhoods.7

35% of Americans who are late on rent/mortgage said they feared losing their home. In MS, WV, and FL, it is about 50%.
Likelihood of eviction or foreclosure, Dec 9-19, 2022
Percent of adults living in households not current on rent or mortgage where eviction or ery likely” or “somewhat likely”
As housing prices have increased, so has the fear of losing one’s home. 35% of Americans who are past-due on rent or mortgage fear that eviction or foreclosure is likely. Among Southern states, fears are particularly high in Mississippi (50%), West Virginia (50%), Florida (47%), and South Carolina (44%).

Growing housing prices are a chronic problem across the U.S., made worse by the pandemic. Mortgage interest rates grew by a higher margin in 2022 than in any other year on record — with rates having doubled by the end of the year.1 Rent increased by 14% from 2021 to 2022, with Florida, Tennessee and North Carolina having among the highest increases.2 More than 1 in 4 Southern renters have to spend the majority of their household income on rent and utilities (Severe Housing Cost Burden).
Respondents to a Southern Economic Advancement Project (SEAP) survey in Alabama, Georgia, and Mississippi said affordable housing was their community’s greatest challenge.3 Across Southern states, only 1% of American Rescue Plan funds have been dedicated to housing as of December 2022, compared to 11% across the rest of the nation.4
20% of
Mississippians,
16%
of Kentuckians, and 15% of Georgians

reported their household went hungry in December.
Food insecurity, Dec 9-19, 2022
P who report their household sometimes or often went hungry in last 7 days
In December 2022, 11% of Americans reported that their household did not have enough food. In the South, 13% of households sometimes or often went hungry Food insecurity was most severe in Mississippi (20%), Kentucky (16%), Texas (15%), Georgia (15%), Louisiana (14%), and West Virginia (14%).
Several coinciding factors have made it difficult for Americans to have accessible and affordable food options. The annual cost of groceries increased by 12% as of December 2022, meaning a $100 weekly grocery bill from November 2021 would cost $112 in November 2022— a monthly increase of $48.1 The USDA predicts that food prices will continue to grow at above average historical rates in 2023, though more slowly than in 2022.2 While SNAP benefits for 2023 increased by 12.5% to adjust for the rising cost of living, the USDA announced that emergency SNAP benefits would end after the February 2023 allotment.3,4 More and more Americans are turning to food banks for help, many of which struggle to keep up with the increased demand, operating on limited supplies and tight budgets.5,6,7,8 As families continue to experience food insecurity, experts advise policymakers to consider its negative impacts on healthcare outcomes and spending (Medical Debt).9,10
34% of Americans report symptoms of anxiety or depression, up from 11% in 2019. The South had 4 of 5 states with the highest rates.

Symptoms of anxiety or depression, Dec 9-19, 2022 of adults who experienced symptoms of anxiety or depression in the last two weeks
Source: CDC and Census Bureau’s Household Pulse Survey Notes: This indicator is based on self-report of the frequency of anxiety and depression symptoms, derived from responses to the first two questions of the eight-item Patient Health Questionnaire (PHQ-2) and the seven-item Generalized Anxiety Disorder (GAD-2) scale.
The percent of adults in the U.S. reporting symptoms of anxiety and depression has tripled from 11% in 2019 to 34% in December 2022. 4 out of the 5 states with the highest rates were in the South: 40% in Louisiana, 39% in West Virginia, 38% in Kentucky, and 38% in Mississippi. Though pandemic concerns have eased, Americans face a growing mental health crisis.
Economic, racial, political, and cultural tensions were exacerbated by the pandemic, leaving Americans with higher levels of psychological distress.1,2 LGBT adults consistently experience higher rates of anxiety and depression compared to non-LGBT adults.3 The mental health of Black, Hispanic, and Asian adults has also worsened throughout the pandemic, relative to white adults.4 Several factors, such as anti-transgender legislation, mass shootings, and increases in hate crimes have many feeling unsafe and anxious.5,6,7
As mental health worsens, mental health providers are in high demand. 60% of psychologists have full caseloads, and nearly half report feeling burned out.8 Policies that target specific stressors could help ease this burden. For example, a recent study found that the expanded Child Tax Credits helped lower anxiety symptoms for low-income families, and increased mental health benefits for Black and Hispanic adults (Child Poverty).9
References
Foreword https://wonder.cdc.gov/mcd-icd10-provisional.html
1. “About Provisional Mortality Statistics, 2018 through Last Month”. CDC.
Covid-associated hospitalizations per 100,000 population by age, U.S.
1 “COVID-19 Integrated Country View” CDC https://covid cdc gov/covid-data-tracker/#county-view?list select state=all states&list select county=all counties&data-type=Risk&metric-cases=Cases 7 day count change&null=Risk
2 “Nucleic Acid Amplification Tests (NAATs)” CDC https://www cdc gov/coronavirus/2019-ncov/lab/naats html https://thehill.com/policy/healthcare/3803161-what-we-know-about-the-xbb-1-5-covid-variant-sweepingthe-northeast/ https://www.everydayhealth.com/coronavirus/xbb-1-5-is-now-the-top-covid-19-subvariant-in-the-us/
3. “What we know about the XBB.1.5 COVID variant sweeping the Northeast”. Choi. The Hill. January, 2023.
4 “XBB 1 5 on Track to Become the Top COVID-19 Subvariant in the U S ” Rauf Everyday Health January, 2023.
5 “COVID Data Tracker” CDC https://covid cdc gov/covid-data-tracker/#variant-proportions
6 “What we know and don’t know about the XBB 1 5 COVID subvariant” Scribner Axios December, 2022 https://www.axios.com/2022/12/31/xbb15-covid-variant-symptoms-new-england-omicron
7 “COVID-19 Vaccinations in the United States” CDC https://covid cdc gov/covid-data-tracker/#vaccinations vacc-people-booster-percent-pop65
8. “Effectiveness of Bivalent mRNA Vaccines in Preventing Symptomatic SARS-CoV-2 Infection – Increasing Community Access to Testing Program, United States, September-November 2022”. Link-Gelles, Ciesla, Fleming-Dutra, et al CDC November, 2022 https://www cdc gov/mmwr/volumes/71/wr/mm7148e1 htm#suggestedcitation
9. “Effectiveness of the Bivalent mRNA Vaccine in Preventing Severe COVID-19 Outcomes: An Observational Cohort Study” Arbel, Peretz, Sergienko, Friger, Beckenstein, Yaron, Hammerman, Bilenko, and Netzer https://papers ssrn com/sol3/papers cfm?abstract id=4314067 https://www al com/news/2023/01/alabama-sees-spike-in-covid-hospitalizations-as-new-xbb15-variant-p ushes-into-state html https://www wwltv com/article/news/health/coronavirus/covid-hospitalizations-up-in-the-state-by-almost -60-percent-from-last-month/289-4118957a-1404-4879-b3bd-3933a7bdf221
10. “Alabama sees spike in COVID hospitalizations as new XBB.1.5 variant pushes into state”. Archibald. January, 2023. AL.com.
11. “COVID hospitalizations up in the state by almost 60 percent from last month”. Farris. 4WWL. January, 2023.
12. “Florida COVID hospitalizations skyrocket as case counts become unreliable”. Persaud. The Palm Beach Post January, 2023 https://www palmbeachpost com/story/news/local/2023/01/07/covid-case-counts-unreliable-as-florida-h ospitalizations-skyrocket/69780829007/
Life expectancy at birth by race/ethnicity, U.S.
1 “New Report Confirms U S Life Expectancy has Declined to Lowest Level Since 1996” CDC December, 2022. https://www.cdc.gov/nchs/pressroom/nchs press releases/2022/20221222.htm
2. “CHANGES IN LIFE EXPECTANCY BETWEEN 2019 AND 2021 IN THE UNITED STATES AND 21 PEER COUNTRIES” Masters, Aron, and Woolf medRxiv June, 2022 https://www medrxiv org/content/10 1101/2022 04 05 22273393v4 https://www cfr org/in-brief/us-life-expectancy-decline-why-arent-other-countries-suffering-same-proble m
3. “U.S. Life Expectancy Is in Decline. Why Aren’t Other Countries Suffering the Same Problem?” Klobucista. Council on Foreign Relations. September, 2022.
4. “Provisional Life Expectancy Estimates for 2021”. Arias, Tejada-Vera, Kochanek, and Ahmad. CDC. August, 2022 https://www cdc gov/nchs/data/vsrr/vsrr023 pdf https://www.kff.org/report-section/key-facts-on-health-and-health-care-by-race-and-ethnicity-health-stat us-outcomes-and-behaviors/
5 “Key Facts on Health and Health Care by Race and Ethnicity” Hill, Artiga, and Haldar Kaiser Family Foundation. January, 2022.
6 “Implicit Bias and Racial Disparities in Health Care” Bridges American Bar Association https://www.americanbar.org/groups/crsj/publications/human rights magazine home/the-state-of-healt hcare-in-the-united-states/racial-disparities-in-health-care/
7 “Why life expectancy in the US is falling” Shmerling Harvard Medical School October, 2022 https://www health harvard edu/blog/why-life-expectancy-in-the-us-is-falling-202210202835 https://time com/6219765/native-americans-life-expectancy/
8. “Why Native Americans Are Dying Sooner”. Gounder. Time. October, 2022.
9 “Mortality in the United States, 2019” Kochanek, Xu, and Arias CDC December, 2020 https://www.cdc.gov/nchs/products/databriefs/db395.htm https://www cdc gov/nchs/products/databriefs/db427 htm#section 4
10. “Mortality in the United States, 2020”. Murphy, Kochanek, Xu, and Arias. CDC. December, 2021.
11 “Mortality in the United States, 2021” Xu, Murphy, Kochanek, Arias CDC December, 2022 https://www.cdc.gov/nchs/products/databriefs/db456.htm#Key finding
12 “Inflation and the Labor Market” Powell Board of Governors of the Federal Reserve System November, 2022 https://www federalreserve gov/newsevents/speech/powell20221130a htm
Long Covid estimates, Dec 9-19, 2022
1 “Long COVID: Household Pulse Survey” CDC June, 2022 https://www.cdc.gov/nchs/covid19/pulse/long-covid.htm
2 “Immunological dysfunction persists for 8 months following initial mild-to-moderate SARS-CoV-2 infection” Phetsouphanh, Darley, Wilson, Howe, Munier, Patel, Juno, Burrell, Kent, Dore, Kelleher, and Matthews. Nature Immunology. January, 2022. https://www.nature.com/articles/s41590-021-01113-x
3. “Persistent Exertional Intolerance After COVID-19, Insights From Invasive Cardiopulmonary Exercise Testing” Singh, Joseph, Heerdt, Cullinan, Lutchmansingh, Gulati, Possick, Systrom, and Waxman January, 2022. https://journal.chestnet.org/article/S0012-3692(21)03635-7/fulltext https://www science org/doi/10 1126/science abm2052 https://www medrxiv org/content/10 1101/2022 02 01 22269999v1
4. “Nervous system consequences of COVID-19”. Spudich, Nath. Science.org. January, 2022.
5. “The Investigation of Pulmonary Abnormalities using Hyperpolarised Xenon Magnetic Resonance Imaging in Patients with Long-COVID” Grist, Collier, Walters, Chen, Eid, Laws, Matthews, Jacob, Cross, Eves, Durant, Mcintyre, Thompson, Schulte, Raman, Robbins, Wild, Fraser, and Gleeson. MedRxiv. February, 2022.
6 “Incidence, co-occurence, and evolution of long-COVID features: A 6-month retrospective cohort study of 273,618 survivors of COVID-19”. Taquet, Dercon, Luciano, Geddes, Husain, and Harrison. PLoS Medicine. September, 2021 https://journals.plos.org/plosmedicine/article?id=10.1371/journal.pmed.1003773#pmed.1003773.s003
7 “What Causes Long COVID Symptoms? NYU Langone Researchers Net $52 Million Federal Grant to Find Out” Katz, Horwitz, and Troxel NYU Langone https://nyulangone.org/news/what-causes-long-covid-symptoms-nyu-langone-reSearchers-net-52-millionfederal-grant-find-out#:~:text=Studies%20show%20that%20up%20to,issues%2C%20anxiety%2C%20and% 20depression. https://jamanetwork com/journals/jama/fullarticle/2797443 https://theconversation com/long-covid-stemmed-from-mild-cases-of-covid-19-in-most-people-accordingto-a-new-multicountry-study-195707
8 “Estimated Global Proportions of Individuals With Persistent Fatigue, Cognitive, and Respiratory Symptom Clusters Following Symptomatic COVID-19 in 2020 and 2021”. JAMA Network. October, 2022.
9 “Long COVID stemmed from mild cases of COVID-19 in most people, according to new multicountry study”. Hanson, Vos. The Conversation. January, 2023.
10 “Years into the pandemic, scientists are still trying to understand long COVID” Tanner PBS December, 2022 https://www.pbs.org/newshour/health/years-into-the-pandemic-scientists-are-still-trying-to-understand-l ong-covid https://corporate dukehealth org/news/scientists-find-key-reason-why-loss-smell-occurs-long-covid-19#:~ https://www nature com/articles/s44161-022-00177-8
11. “Scientists Find Key Reason Why Loss of Smell Occurs in Long COVID-19”. Duke Health. December, 2022.
:text=DURHAM%2C%20N C %20%E2%80%93%20The%20reason%20some,led%20by%20Duke%20Health% 20report.
12 “Apparent risks of postural orthostatic tachycardia syndrome diagnoses after COVID-19 vaccination and SARS-Cov-2 Infection”. Kwan, Ebinger, Wei, et al. Nature Cardiovascular Research. December, 2022.
13. “Millions suffer from long Covid – and it costs them $9,000 a year in healthcare expenses, on average”. Iacurci CNBC December, 2022 https://www cnbc com/2022/12/01/long-covid-costs-patients-an-average-9000-a-year-in-medical-expens es.html https://www kff org/policy-watch/what-are-the-implications-of-long-covid-for-employment-and-health-co verage/
14 “What are the Implications of Long COVID for Employment and Health Coverage?” Burns Kaiser Family Foundation. August, 2022.
15. “How is treatment for long COVID covered by health insurance?” Norris. HealthInsurance.Org. September, 2022 https://www.healthinsurance.org/faqs/how-is-treatment-for-long-covid-covered-by-health-insurance/
16 “People With Long Covid Face Barriers to Government Disability Benefits” Ladyzhets Kaiser Health News
November, 2022 https://khn org/news/article/long-covid-barriers-government-disability-benefits/
17. “Data-driven identification of post-acute SARS-CoV-2 infection subphenotypes”. Zhang, Zang, Xu, et al. Nature Medicine https://www nature com/articles/s41591-022-02116-3
18. “New study involving Alabama patients sorts long COVID into four types”. Whites-Koditschek. Alabama com January, 2023 https://www al com/news/2023/01/new-study-involving-alabama-patients-sorts-long-covid-into-four-type s.html
19 “One billion days lost: How COVID-19 is hurting the US workforce” Berdan, Charumilind, Craven, Lamb, and Singhal McKinsey & Company January, 2023 https://www.mckinsey.com/industries/healthcare-systems-and-services/our-insights/one-billion-days-losthow-covid-19-is-hurting-the-us-workforce
Motor vehicle deaths per 100,000 population, U.S.
1 “Motor-Vehicle Deaths in the U S Compared to the World” National Safety Council https://injuryfacts nsc org/international/motor-vehicle-deaths-in-the-u-s-compared-to-the-world/
2. “The Exceptionally American Problem of Rising Roadway Deaths”. Badger, Parlapiano. The New York Times. November, 2022 https://www.nytimes.com/2022/11/27/upshot/road-deaths-pedestrians-cyclists.html?action=click&modu le=Well&pgtype=Homepage§ion=US%20News
3. “Road injury crashes, fatalities and injuries”. International Transport Forum. https://stats oecd org/Index aspx?DataSetCode=ITF ROAD ACCIDENTS#
4 “Why Native Americans Are Dying Sooner” Gounder Time October, 2022 https://time com/6219765/native-americans-life-expectancy/ https://tpcjournal nbcc org/examining-the-theory-of-historical-trauma-among-native-americans/
5. “Examining the Theory of Historical Trauma Among Native Americans”. Brown-Rice. The Professional Counselor. October, 2014.
6 “An Analysis of Traffic Fatalities by Race and Ethnicity” Governors Highway Safety Association June, 2021 https://www.ghsa.org/sites/default/files/2021-06/An%20Analysis%20of%20Traffic%20Fatalities%20by%20 Race%20and%20Ethnicity 0 pdf https://academic.oup.com/epirev/article/34/1/73/495638
7 “Motor Vehicle Deaths Among American Indian and Alaska Native Populations” Pollack, Frattaroli, Young, Dana-Sacco, Gielen. Oxford Academic. November, 2011.
8 “Tribal Road Safety: Get the Facts” CDC https://www cdc gov/transportationsafety/native/factsheet html
9 “Race, Class and Traffic Deaths” Leonhardt The New York Times August, 2022 https://www.nytimes.com/2022/08/23/briefing/traffic-deaths-class-race-covid.html
10. “Disparities in Activity and Traffic Fatalities by Race/Ethnicity”. Raifman, Choma. American Journal of Preventive Medicine June, 2022 https://www ajpmonline org/article/S0749-3797(22)00155-6/fulltext
11 “Fact Sheet: Health Disparities by Race and Ethnicity” Russell Center for American Progress December, 2010. https://www.americanprogress.org/article/fact-sheet-health-disparities-by-race-and-ethnicity/
12 “President Biden’s Bipartisan Infrastructure Law” The White House https://www whitehouse gov/bipartisan-infrastructure-law/#roadsandbridges https://www.nhtsa.gov/bipartisan-infrastructure-law
13. “Bipartisan Infrastructure Law”. U.S. Department of Transportation.
Total jobs by month, U.S.
1 “Civilian Labor Force Level” FRED https://fred stlouisfed org/series/CLF16OV
2 “Unemployment Rate” FRED https://fred stlouisfed org/series/UNRATE
3. “Unemployment Level”. FRED. https://fred.stlouisfed.org/series/UNEMPLOY https://www bls gov/news release/jolts nr0 htm https://www.federalreserve.gov/newsevents/speech/powell20221130a.htm https://wonder cdc gov/mcd-icd10-expanded html https://www mckinsey com/industries/healthcare-systems-and-services/our-insights/one-billion-days-losthow-covid-19-is-hurting-the-us-workforce
4. “Job Openings and Labor Turnover Summary”. U.S. Bureau of Labor Statistics”. January, 2023.
5 “Inflation and the Labor Market” Powell Board of Governors of the Federal Reserve System November, 2022.
6. “About Multiple Cause of Death, 2018-2021, Single Race”. CDC.
7 “One billion days lost: How COVID-19 is hurting the US workforce” Berdan, Charumilind, Craven, Lamb, and Singhal. McKinsey & Company. January, 2023.
8. “Inflation and the Labor Market”. Powell. Board of Governors of the Federal Reserve System. November, 2022 https://www federalreserve gov/newsevents/speech/powell20221130a htm https://www census gov/data/experimental-data-products/household-pulse-survey html https://peri.umass.edu/publication/item/1633-job-creation-estimates-through-proposed-inflation-reducti on-act
9. “Measuring Household Experiences during the Coronavirus Pandemic”. U.S. Census Bureau. January, 2023.
10 “Job Creation Estimates Through Proposed Inflation Reduction Act” Pollen, Lala, Chakraborty University of Massachusetts Amherst Political Economy Research Institute. August, 2022.
11 “15 Million Infrastructure Jobs Georgetown University Center on Education and the Workforce https://cew.georgetown.edu/cew-reports/infrastructure/
12. “Inflation Reduction Act Benefits: Good Paying Jobs and Revitalized U.S. Manufacturing”. Spengeman. Forbes September, 2022 https://www forbes com/sites/energyinnovation/2022/09/28/inflation-reduction-act-benefits-good-payin g-jobs-and-revitalized-us-manufacturing/?sh=7820165f6ff9
13 “The Insightful Leader Live: What You Need to Know about the New Climate Bill Kellogg Insight October, 2022 https://insight kellogg northwestern edu/webinars/the-insightful-leader-live-new-climate-bill https://www brookings edu/blog/the-avenue/2021/01/29/biden-needs-to-create-an-infrastructure-talent -pipeline-not-just-more-jobs/
14. “Biden needs to create an infrastructure talent pipeline, not just more jobs”. Kane. Brookings. January, 2021.
15. “Telecommunications Workforce: Additional Workers Will Be Needed to Deploy Broadband, but Concerns Exist About Availability” U S Government Accountability Office December, 2022 https://www gao gov/assets/gao-23-105626 pdf
Quits rate by industry, U.S.
1. “The Fed May Finally Be Winning the War on Inflation. But at What Cost?” Steinberger. The New York Times Magazine January, 2023 https://www.nytimes.com/2023/01/10/magazine/inflation-federal-reserve.html
2 “Unions are having a moment Here’s how that can be good for labor and business ” Katz The Scheinman Institute April, 2022 https://www.ilr.cornell.edu/scheinman-institute/blog/outreach/unions-are-having-moment-heres-how-ca n-be-good-labor-and-business
3. “Federal Funds Effective Rate”. FRED. https://fred.stlouisfed.org/series/FEDFUNDS https://www americanprogress org/article/wages-and-employment-do-not-have-to-decline-to-bring-dow n-inflation/
4 “Wages and Employment Do Not Have To Decline To Bring Down Inflation” Schweitzer, Khattar Center for American Progress. September, 2022.
5. “FACT SHEET: The Inflation Reduction Act Supports Workers and Families”. The White House. August, 2022 https://www.whitehouse.gov/briefing-room/statements-releases/2022/08/19/fact-sheet-the-inflation-red uction-act-supports-workers-and-families/
6 “Consumer Price Index” U S Bureau of Labor Statistics https://www.bls.gov/cpi/#:~:text=News%20Releases,-CPI%20for%20all&text=In%20December%2C%20the %20Consumer%20Price,over%20the%20year%20(NSA)
7. “Consumer Price Index up 7.1 percent over the year ended November 2022”. U.S. Bureau of Labor Statistics December, 2022 https://www bls gov/opub/ted/2022/consumer-price-index-up-7-1-percent-over-the-year-ended-novemb er-2022.htm
Corporate profits and employee wage & salary compensation, U.S.
1. “Corporate profits versus labor income”. FRED. August, 2018.
https://fredblog.stlouisfed.org/2018/08/corporate-profits-versus-labor-income/?utm source=series page &utm medium=related content&utm term=related resources&utm campaign=fredblog https://www imf org/en/Publications/Staff-Discussion-Notes/Issues/2021/03/10/Rising-Corporate-Market -Power-Emerging-Policy-Issues-48619
2 “Rising Corporate Market Power: Emerging Policy Issues” Akcigit, Chen, Diez, Duval, Engler, Fan, Maggi, Tavares, Schwarz, Shibata, and Villegas-Sánchez. International Monetary Fund. March, 2021.
3 “Average Hourly Earnings of All Employees, Total Private” FRED https://fred.stlouisfed.org/series/CES0500000003
4 “Corporate Profits with Inventory Valuation Adjustment (IVA) and Capital Consumption Adjustment (CCAdj)”. FRED. https://fred.stlouisfed.org/series/CPROFIT
5 “Why Market Power Matters for Inflation” Konczal Roosevelt Institute September, 2022 https://rooseveltinstitute org/publications/why-market-power-matters-for-inflation/
6. “The Fed May Finally Be Winning the War on Inflation. But at What Cost?” Steinberger. The New York Times Magazine January, 2023 https://www nytimes com/2023/01/10/magazine/inflation-federal-reserve html
Number of FEMA county-level disasters
1 “Billion-Dollar Weather and Climate Disasters” National Centers for Environmental Information https://www.ncei.noaa.gov/access/billions/ https://www usaspending gov/federal account/070-0702
2. “Disaster Relief Fund, Federal Emergency Management Agency, Homeland Security”. USA Spending.
3 “As Disaster Costs Rise, So Does Inequality” Howell, Elliott SOCIUS December, 2018 https://journals.sagepub.com/doi/full/10.1177/2378023118816795
4. “Natural Disasters and Housing Markets. The Tenure Choice Channel”. Dillon-Merrill, Ge, and Gete. December, 2018 https://www google com/url?q=https://www aeaweb org/conference/2019/preliminary/paper/YZ56fSb6 &sa=D&source=docs&ust=1673914838206677&usg=AOvVaw2FR0pHH383oDHw5mOIK0OX
Average annual duration of electric power interruptions
1. “Millions without power as winter storm batters U.S. with blizzards, freezing rain”. Williams. PBS. December, 2022 https://www pbs org/newshour/nation/millions-without-power-as-winter-storm-batters-u-s-with-blizzards -freezing-rain
2. “U.S. electricity customers averaged seven hours of power interruptions in 2021”. U.S. Energy Information Administration November, 2022 https://www eia gov/todayinenergy/detail php?id=54639 https://lailluminator.com/2022/12/31/as-another-winter-storm-strains-the-electric-grid-its-time-to-fix-tra nsmission-experts-say/
3 “After strain from another winter storm, experts say it’s time to fix the electric grid” Zullo Louisiana Illuminator. December, 2022.
4 “A national US power grid would make electricity cheaper and cleaner” Roberts Vox June, 2020 https://www.vox.com/energy-and-environment/2020/6/20/21293952/renewable-energy-power-nationalgrid-transmission-microgrids
5 “Electricity Transmission Provisions in the Inflation Reduction Act of 2022” Congressional Research Service. August, 2022. https://crsreports.congress.gov/product/pdf/IN/IN11981
6. “North Carolina Attack Shows Fragility of U.S. Power Grids, Experts Say”. Saul. Insurance Journal. December, 2022 https://www insurancejournal com/news/national/2022/12/07/698270 htm
U.S. Census Bureau Population Estimates Program
1 “Counting for Dollars 2020: The Role of the Decennial Census in the Geographic Distribution of Federal Funds” The George Washington Institute of Public Policy April, 2020 https://gwipp.gwu.edu/counting-dollars-2020-role-decennial-census-geographic-distribution-federal-fund s
2. “Census Bureau Releases Estimates of Undercount and Overcount in the 2020 Census. U.S. Census Bureau. March, 2022 https://www.census.gov/newsroom/press-releases/2022/2020-census-estimates-of-undercount-and-over count html
3 “Briefing on the Base Evaluation and Research Team” Hartley, Perry U S Census Bureau https://www2.census.gov/about/partners/cac/sac/meetings/2022-09/presentation-briefing-on-base-eval uation-and-research-team pdf
Demographics of 118th Congress compared to U.S. population
1 “U S Congress continues to grow in racial, ethnic diversity” Schaeffer Pew January, 2023 https://www.pewresearch.org/fact-tank/2023/01/09/u-s-congress-continues-to-grow-in-racial-ethnic-dive rsity/
2 “New Records for Women in the U S Congress and House” De Simone Center for American Women and Politics November, 2022 https://cawp.rutgers.edu/news-media/press-releases/new-records-women-us-congress-and-house https://www pewresearch org/fact-tank/2023/01/11/118th-congress-breaks-record-for-lesbian-gay-and-bi sexual-representation/ https://www nbcnews com/data-graphics/118th-congress-age-third-oldest-1789-rcna64117
3. “118th Congress breaks record for lesbian, gay and bisexual representation”. Schaeffer. Pew. January, 2023.
4. “The 118th Congress is the third oldest since 1789”. Murphy. NBC News. January, 2023.
Percent of U.S. House of Representatives seats held by a “2020 election denier”
1 “No evidence for systematic voter fraud: A guide to statistical claims about the 2020 elections” Eggers, Garro, and Grimmer PNAS November, 2021 https://www pnas org/doi/10 1073/pnas 2103619118 https://www cisa gov/news/2020/11/12/joint-statement-elections-infrastructure-government-coordinatin g-council-election
2. “JOINT STATEMENT FROM ELECTIONS INFRASTRUCTURE GOVERNMENT COORDINATING COUNCIL & THE ELECTION INFRASTRUCTURE SECTOR COORDINATING EXECUTIVE COMMITTEES”. CISA. November, 2020.
3. “Democracy on the ballot–How many election deniers are on the ballot in November and what is their likelihood of success?” Kamarck, Eisen Brookings October, 2022 https://www brookings edu/blog/fixgov/2022/10/07/democracy-on-the-ballot-how-many-election-denier s-are-on-the-ballot-in-november-and-what-is-their-likelihood-of-success/?utm campaign=Brookings%20Br ief&utm medium=email&utm content=228994851&utm source=hs email
4 “VoteCast: Inflation top concern, but democracy a worry too” Boak, Fingerhut AP News November, 2022 https://apnews com/article/2022-midterm-elections-abortion-biden-inflation-cf4dffe87a7c2fd1bdd58df0 346e15dc
5. “Election Deniers Lost Key Races for federal and State Offices in the 2022 Midterm Elections”. Bedekovics, Maciolek Center for American Progress November, 2022 https://www americanprogress org/article/election-deniers-lost-key-races-for-federal-and-state-offices-inthe-2022-midterm-elections/
6 “Seven in ten Americans say the country is in crisis, at risk of failing” Newall, Jackson, and Diamond Ipsos January, 2022 https://www ipsos com/en-us/seven-ten-americans-say-country-crisis-risk-failing
Lack
of health insurance coverage by county, 2017-21 (5-yr average)
1. “Key Facts about the Uninsured Population”. Tolbert, Orgera, and Damico. Kaiser Family Foundation. November, 2020 https://www kff org/uninsured/issue-brief/key-facts-about-the-uninsured-population/#:~:text=When%20t hey%20are%20hospitalized%2C%20uninsured,rates%20than%20those%20with%20insurance.&text=Resea rch%20demonstrates%20that%20gaining%20health,effects%20of%20having%20been%20uninsured
2. “181 rural hospitals have closed since 2005 see the states that have been impacted”. Givens. Sidecar Health December, 2021 https://sidecarhealth.com/blog/181-rural-hospitals-have-closed-since-2005-see-the-states-that-have-been -impacted/
Counties with no or only one newspaper (“news
deserts”)
1 “The State of Local News” Abernathy Northwestern Local News Initiative June, 2022 https://localnewsinitiative.northwestern.edu/research/state-of-local-news/report/
2 “‘News Deserts’ Could Impact Midterm Elections” Panditharatne Brennan Center For Justice October, 2022 https://www.brennancenter.org/our-work/analysis-opinion/news-deserts-could-impact-midterm-elections
3 “Battleground States See the Most Voting Misinformation” Alba The New York Times November, 2020 https://www.nytimes.com/2020/11/02/technology/battleground-states-see-the-most-voting-misinformati on html https://www nytimes com/2022/10/12/business/media/midterms-foreign-language-misinformation html https://www vox com/the-highlight/23329139/latino-voters-misinformation-2022
4. “Misinformation Swirls in Non-English Languages Ahead of Midterms”. Hsu. The New York Times. October, 2022.
5. “Latino voters are being flooded with even more misinformation in 2022”. Paz. Vox. September, 2022.
6. “U.S. election misinformation limited, not stopped, on social media -experts”. Dang, Dave. Reuters. November, 2022 https://www reuters com/technology/twitter-social-platforms-could-see-spike-election-misinformation-20 22-11-09/
7 “Phantom Candidates and Ghost Newspapers” Waldman The Bulwark January, 2023 https://www.thebulwark.com/phantom-candidates-and-ghost-newspapers/?utm source=Poynter+Institut e&utm campaign=1a70c6de56-DATE+Local+Edition COPY 01&utm medium=email&utm term=0 26742 a15dc-1a70c6de56-428537627
8. “George Santos Is in a Class of His Own. But Other Politicians Have Embellished Their Resumes, Too”. Vigdor The New York Times December, 2022 https://www.nytimes.com/2022/12/28/us/politics/george-santos-resume-lies-politicians.html
9 “The Gulf States Newsroom Builds Connections for Better Journalism” Sirianni NPR March, 2022 https://www.npr.org/sections/npr-extra/2022/03/15/1086474553/the-gulf-states-newsroom-builds-conn ections-for-better-journalism
10 “Summary: H R 3940 117th Congress (2021-2022)” Congress Gov https://www.congress.gov/bill/117th-congress/house-bill/3940
11 “Rebuilding Local News” Rebuild Local News https://www rebuildlocalnews org/solutions/our-plan/
Lack of internet access by county, 2017-21 (5-yr average)
1 “Infrastructure Investment and Jobs Act Implementation” Federal Register January, 2022 https://www.federalregister.gov/documents/2022/01/10/2022-00221/infrastructure-investment-and-jobs -act-implementation
2. “How the Federal Government Can Support Cities and Counties Limited by State Preemption Laws: The Case of Municipal Broadband” Treskon Urban Institute July, 2021 https://www.urban.org/urban-wire/how-federal-government-can-support-cities-and-counties-limited-stat e-preemption-laws-case-municipal-broadband
Child poverty rates, 2021
1 “The Effects on Employment and Family Income of Increasing the Federal Minimum Wage” Congressional Budget Office July, 2019 https://www cbo gov/system/files/2019-07/CBO-55410-MinimumWage2019 pdf
2. “Workers’ rights preemption in the U.S.”. Economic Policy Institute. https://www.epi.org/preemption-map/
3 “Minimum Wage Tracker” Economic Policy Institute https://www epi org/minimum-wage-tracker/#/min wage/ https://www epi org/publication/preemption-in-the-south/
4. “Preempting progress”. Blair, Cooper, Wolfe, and Worker. Economic Policy Institute. September, 2020.
Working-age deaths from external causes per 100,000 population, 2021
1. “Contagion Nation 2020: United States Still the Only Wealthy Nation without Paid Sick Leave”. Rho, Fremstad, and Gaby-Biegel Center for Economic and Policy Research March, 2020 https://cepr net/report/contagion-nation-2020-united-states-still-the-only-wealthy-nation-without-paid-si ck-leave/#:~:text=Many%20mandate%20employers%20to%20cover,%2C%20and%20the%20United%20Kin gdom).
2 “The Truth About Paid Sick Leave Law in the USA: The Good, the Bad, and the Ugly” Factorial November, 2021 https://factorialhr.com/blog/paid-sick-leave-law/#:~:text=Paid%20sick%20days%20dramatically%20reduce ,may%20incapacitate%20many%20more%20employees
3 “U S State Preemption Laws and Working-Age Mortality” Wolf, Montez, and Monnat American Journal of Preventive Medicine August, 2022 https://www ajpmonline org/article/S0749-3797(22)00330-0/fulltext https://www pewtrusts org/en/research-and-analysis/blogs/stateline/2018/09/24/as-more-cities-push-for -paid-sick-leave-states-push-back https://www.epi.org/preemption-map/
4. “As More Cities Push for Paid Sick Leave, States Push Back”. Alvarez. Pew. September, 2018.
5. “Workers’ rights preemption in the U.S.”. Economic Policy Institute.
Pregnancy-related death rates, by race/ethnicity, U.S.
1 “Health and Health Care for Women of Reproductive Age” Gunja, Seervai, Zephyrin, and Williams The Commonwealth Fund. April, 2022.
https://www commonwealthfund org/publications/issue-briefs/2022/apr/health-and-health-care-womenreproductive-age
2. “Health Equity Among Black Women in the United States”. Chinn, Martin, and Redmond. Journal of Women’s Health. February, 2021. https://www.ncbi.nlm.nih.gov/pmc/articles/PMC8020496/
3 “Implicit Bias and Racial Disparities in Health Care” Bridges American Bar Association https://www americanbar org/groups/crsj/publications/human rights magazine home/the-state-of-healt hcare-in-the-united-states/racial-disparities-in-health-care/
4 “How Our Health Care System Treats Black Mothers Differently” Seervai The Commonwealth Fund October, 2019 https://www commonwealthfund org/publications/podcast/2019/oct/how-our-health-care-system-treatsblack-mothers-differently
5 “Racial Misconceptions in Healthcare Are Killing Black Women” Blount, Biggers Healthline October, 2022 https://www healthline com/health/racial-misconceptions-in-healthcare-are-killing-black-women https://www.cdc.gov/healthequity/features/maternal-mortality/index.html
6. “Working Together to Reduce Black Maternal Mortality”. CDC. April, 2022.
7 “The Article That Could Help Save Black Women's Lives” Stallings Oprah com https://www oprah com/health wellness/the-article-that-could-help-save-black-womens-lives#ixzz5VRnk BHiz
8 “Outcomes Worsened and Disparities Persisted During the Pandemic” U S Government Accountability Office October, 2022 https://www gao gov/assets/gao-23-105871 pdf
9. “All-Cause Maternal Mortality in the US Before vs During the COVID-19 Pandemic”. Thoma, Declercq. Jama Network. June, 2022. https://jamanetwork.com/journals/jamanetworkopen/fullarticle/2793640 https://apnews com/article/coronavirus-pandemic-science-health-health-statistics-00f3a7a2ecf362d06d6 b3131a2bf5cf2 https://www kff org/coronavirus-covid-19/issue-brief/tracking-social-determinants-of-health-during-the-c ovid-19-pandemic/ https://www kff org/policy-watch/health-disparities-symptom-broader-social-economic-inequities/
10. “Pregnancy-related deaths climbed in pandemic’s first year”. Tanner. AP News. February, 2022.
11. “Tracking Social Determinants of Health During the COVID-19 Pandemic”. Drake, Rudowitz. Kaiser Family Foundation. April, 2022.
12. “Health Disparities are a Symptom of Broader Social and Economic Inequities”. Artiga. Kaiser Family Foundation. June, 2020.
13 “Separate and unequal: Structural racism and infant mortality in the US” Wallace, Crear-Perry, Richardson, Tarver, and Theall. Health Place. May, 2017. https://pubmed.ncbi.nlm.nih.gov/28363132/
14 “Severe Maternal Morbidity in the United States: A Primer” Declercq, Zephyrin The Commonwealth Fund October, 2021 https://www.commonwealthfund.org/publications/issue-briefs/2021/oct/severe-maternal-morbidity-unit ed-states-primer
15 “Associations Between Comorbidities and Severe Maternal Morbidity” Brown, Adams, George, and Moore Obstetrics & Gynecology November, 2020 https://journals.lww.com/greenjournal/Abstract/2020/11000/Associations Between Comorbidities and Severe 5 aspx https://www.kff.org/racial-equity-and-health-policy/issue-brief/racial-disparities-in-maternal-and-infant-h ealth-current-status-and-efforts-to-address-them/ https://www.kff.org/medicaid/issue-brief/medicaid-enrollment-patterns-during-the-postpartum-year/
16 “Racial Disparities in Maternal and Infant Health: Current Status and Efforts to Address Them” Hill, Artiga, and Ranji. Kaiser Family Foundation. November, 2022.
17 “Medicaid Enrollment Patterns During the Postpartum Year” Corallo, Tolbert, Saunders, and Frederiksen Kaiser Family Foundation. July, 2022.
18 “Medicaid Postpartum Coverage Extension Tracker” Kaiser Family Foundation December, 2022 https://www kff org/medicaid/issue-brief/medicaid-postpartum-coverage-extension-tracker/
Employment rate by race/ethnicity, U.S.
1. “Inflation and the Labor Market”. Powell. Board of Governors of the Federal Reserve System. November, 2022 https://www federalreserve gov/newsevents/speech/powell20221130a htm https://www census gov/data/experimental-data-products/household-pulse-survey html
2. “Measuring Household Experiences during the Coronavirus Pandemic”. U.S. Census Bureau. January, 2023.
3 “One billion days lost: How COVID-19 is hurting the US workforce” Berdan, Charumilind, Craven, Lamb, and Singhal. McKinsey & Company. January, 2023.
4 “Consumer Price Index” U S Bureau of Labor Statistics https://www bls gov/cpi/#:~:text=News%20Releases,-CPI%20for%20all&text=In%20December%2C%20the %20Consumer%20Price,over%20the%20year%20(NSA). https://fred stlouisfed org/series/CES0500000003
5. “Average Hourly Earnings of All Employees, Total Private”. FRED.
6. “Corporate Profits with Inventory Valuation Adjustment (IVA) and Capital Consumption Adjustment (CCAdj)” FRED https://fred stlouisfed org/series/CPROFIT https://fred stlouisfed org/series/A053RC1Q027SBEA https://www georgetownpoverty org/wp-content/uploads/2022/03/ConcentratedPowerConcentratedHar m-March2022.pdf
7. “National income: Corporate profits before tax (without IVA and CCAdj)”. FRED.
8 “Concentrated Power, Concentrated Harm” Brumfield, Tesfaselassie, Geary, and Aneja Georgetown Law Center on Poverty and Inequality. March, 2022.
Share of individuals with medical debt in collections
1 “Medical Debt in the US, 2009-2020” Kluender, Mahoney, Wong, et al JAMA Network July, 2021 https://jamanetwork com/journals/jama/fullarticle/2782187
2. “Health Care Debt in the U.S.: The Broad Consequences Of Medical And Dental Bills”. Lopes, Kearney, Montero, Hamel, and Brodie Kaiser Family Foundation June, 2022 https://www.kff.org/report-section/kff-health-care-debt-survey-main-findings/
3 “Upended: How Medical Debt Changed Their Lives” Levey, Pattani Kaiser Health News August, 2022 https://khn org/news/article/diagnosis-debt-investigation-faces-of-medical-debt/
4. “New Orleans plans to erase up to $130M in residents’ medical debt. When will it happen and who will be affected?” Winfrey Verite News December, 2022 https://veritenews.org/2022/12/29/new-orleans-plans-to-erase-up-to-130m-in-medical-debt/
Severe housing cost burdens by county, 2017-21 (5-yr average)
1. “Rental Market Tracker: Rent Growth Slowed for Seventh Straight Month in December”. Katz. Redfin. January, 2023. https://www.redfin.com/news/redfin-rental-report-december-2022/
2 “Housing Cost Burden, Material Hardship, and WellBeing” Shamsuddin, Campbell Housing Policy Debate March, 2021 https://nlihc.org/sites/default/files/Housing-Cost-Burden-Material-Hardship-and-Well-Being.pdf
3. “The Rent Eats First – Rental Housing Unaffordability in the US”. Airgood-Obrycki, Hermann, and Wedeen. Joint Center for Housing Studies January, 2021 https://www jchs harvard edu/sites/default/files/research/files/harvard jchs rent eats first airgood-obr ycki hermann wedeen 2021.pdf
4 “Addressing the Affordable Housing Crisis Requires Expanding Rental Assistance and Adding Housing Units” Bailey Center on Budget and Policy Priorities October, 2022 https://www.cbpp.org/research/housing/addressing-the-affordable-housing-crisis-requires-expanding-ren tal-assistance-and
5 “Home prices are now rising much faster than incomes, studies show” Dickler CNBC November, 2021 https://www cnbc com/2021/11/10/home-prices-are-now-rising-much-faster-than-incomes-studies-show html
6 “Black and Hispanic Renters Face Greatest Threat of Eviction in Pandemic” Wedeen Joint Center for Housing Studies January, 2021 https://www jchs harvard edu/blog/black-and-hispanic-renters-face-greatest-threat-eviction-pandemic https://papers ssrn com/sol3/papers cfm?abstract id=3200655
7. “Racial Rent Differences in U.S. Housing Markets”. Early, Carrillo, and Olsen. June, 2018.
Likelihood of eviction or foreclosure, Dec 9-19, 2022
1 “Archive” Freddie Mac https://www freddiemac com/pmms/pmms archives
2. “Average rent increase in the U.S. in 2022”. Brozic, Depietro. Credit Karma. October, 2022. https://www.creditkarma.com/insights/i/average-rent-increase#key-findings-on-rent-increase
3 “Two years into the pandemic, Southern families’ struggle with housing weighs heavy as lawmakers begin ARP spending plans” The Southern Economic Advancement Project March, 2022 https://theseap.org/wp-content/uploads/2022/03/ARP-Survey-Release March 2022.pdf https://www cbpp org/research/state-budget-and-tax/resource-lists/fiscal-recovery-funds-in-the-america n-rescue-plan
4. “Fiscal Recovery Fund Spending by States, U.S. Territories”. Center on Budget and Policy Priorities.
Food insecurity, Dec 9-19, 2022
1. “Consumer Price Index Summary”. U.S. Bureau of Labor Statistics.
https://www bls gov/news release/cpi nr0 htm
2 “Food Price Outlook, 2022 and 2023” U S Department of Agriculture https://www.ers.usda.gov/data-products/food-price-outlook/summary-findings/#:~:text=In%202022%2C %20all%20food%20prices,between%207.0%20and%208.0%20percent.
3 “SNAP – Fiscal Year 2023 Cost-of-Living Adjustments” U S Department of Agriculture August, 2022 https://www fns usda gov/snap/fy-2023-cola https://www fns usda gov/snap/changes-2023-benefit-amounts https://www.palmbeachpost.com/story/news/local/2022/12/13/food-banks-cope-high-costs-fewer-donati ons-demand-help-rises/10790279002/ https://www.bizjournals.com/atlanta/news/2023/01/10/3-actionable-steps-to-help-reduce-food-insecurit y html https://www usatoday com/story/news/nation/2022/11/23/us-food-banks-pantries-struggle/1067143200 2/ https://www.wvxu.org/local-news/2022-12-19/freestore-foodbank-food-distribution-event-inflation
4. “Changes to SNAP Benefit Amounts - 2023”. U.S. Department of Agriculture.
5 “‘A worse crisis for us’: Prices up, donations down as food banks struggle to feed the needy” Norman Palm Beach Post. December, 2022.
6 “3 actionable steps to help reduce food insecurity in Georgia” Csukas Atlanta Business Chronicle January, 2023.
7 “Food banks are struggling this holiday season as inflation creates 'perfect storm'” Thornton USA Today November, 2022.
8. “As higher costs hit Americans, it's hitting food banks, too”. Rinehart. WVXU. December, 2022.
9 “Families with food insecurity have greater health care expenditures” Wright Atrium Health Wake Forest Baptist January, 2023 https://www eurekalert org/news-releases/975918
10. “Food Insecurity Was Associated With Greater Family Health Care Expenditures In The US, 2016–17”. Palakshappa, Garg, Peltz, Wong, Cholera, and Berkowitz Health Affairs January, 2023 https://www healthaffairs org/doi/10 1377/hlthaff 2022 00414
Symptoms of anxiety or depression, Dec 9-19, 2022
1 “A Path Forward” Blanding, Dehler Vanderbilt University November, 2022 https://news.vanderbilt.edu/2022/11/07/a-path-forward-amid-an-unprecedented-mental-health-crisis-va nderbilt-research-provides-new-insights-possible-solutions/ https://www pewresearch org/fact-tank/2022/12/12/at-least-four-in-ten-u-s-adults-have-faced-high-levels -of-psychological-distress-during-covid-19-pandemic/ https://www.census.gov/library/stories/2022/12/lgbt-adults-report-anxiety-depression-at-all-ages.html https://pubmed ncbi nlm nih gov/35318615/
2 “At least four-in-ten U S adults have faced high levels of psychological distress during COVID-19 pandemic”. Pasquini, Keeter. Pew. December, 2022.
3 “Mental Health Struggles Higher Among LGBT Adults Than Non-LGBT Adults in All Age Groups” Marlay, File, and Scherer. U.S. Census Bureau. December, 2022.
4 “Racial and Ethnic Disparities in Mental Health and Mental Health Care During The COVID-19 Pandemic” Thomeer, Moody, and Yahirun. National Library of Medicine. March, 2022.
5. “Anxiety, Depression Among LGBT Adults Worsened During COVID-19 Pandemic”. Gonzales. SHRM.
January, 2023 https://www shrm org/resourcesandtools/hr-topics/behavioral-competencies/global-and-cultural-effectiv eness/pages/anxiety-depression-among-lgbt-adults-worsened-during-covid-19-pandemic.aspx
6 “This record-breaking year for anti-transgender legislation would affect minors the most” Krishnakumar https://www.cnn.com/2021/04/15/politics/anti-transgender-legislation-2021
CNN. April, 2021.
7 “FBI Releases 2021 Hate Crime Statistics” U S Department of Justice https://www justice gov/hatecrimes/hate-crime-statistics https://www apa org/pubs/reports/practitioner/2022-covid-psychologist-workload
8. “Psychologists struggle to meet demand amid mental health crisis”. American Psychological Association.
9. “Effects Of The 2021 Expanded Child Tax Credit On Adults’ Mental health: A Quasi-Experimental Study”. Batra, Jackson, and Hamad Health Affairs January, 2023 https://www.healthaffairs.org/doi/full/10.1377/hlthaff.2022.00733#:~:text=We%20found%20that%20the %20expanded,financial%20hardship%20and%20mental%20health

