

Pathways to Prosperity LOUISIANA
FEBRUARY 2025
This page is left intentionally blank
Executive Summary
Since 2020, Louisiana’s leaders have become increasingly concerned about the state’s population loss.1, 2 While Louisiana has experienced more than its fair share of disasters, these are not the main drivers of out-migration. The main reason Americans move long distances is for economic opportunity, and since 2000, Louisiana has had among the lowest job growth rates in the nation at 2 percent.
Job growth and decline, by state 2000 compared to 2024 (annual averages)
Source : Bureau of Labor Statistics . Note: 2024 data is averaged for January 2024–November 2024.
Louisiana’s economy is currently dominated by legacy industries like oil & gas, shipping, and tourism that maximize profitability through efficiencies in other words, they’re hiring fewer workers.3 Reversing slow job growth will require leaders to execute on an aggressive new vision of the future one that builds on Louisiana’s strengths to secure significant market share in new growth industries. At the same time, Louisiana must strategically invest in its capacity to withstand and respond to shocks and disasters.
Louisiana has the chance to seize a rare opportunity. Louisiana can deploy once-in-ageneration taxpayer dollars from the Bipartisan Infrastructure Law and the Inflation Reduction Act, combined with billions in fines received following the 2010 BP oil spill, to not only minimize the impacts of increasingly severe weather on Louisianans, but to also serve as the catalyst that diversifies Louisiana’s economy by adding specializations with growing global demand water management, lower carbon fuel production
and renewable energy.4, 5, 6 As Louisiana’s leaders come together to invest these funds, a shared, evidence-based understanding of location-specific climate impacts and opportunities will be key to building resilience, protecting our culture, and securing Louisiana’s competitiveness on the national and global stage.
Extreme weather disasters. Since 2020, there have been 906 FEMA disaster declarations in Louisiana parishes, and 34 billion-dollar extreme weather disasters resulting in $20–$50 billion in damages per million residents the most of any state. Since 2020, Louisiana has also experienced more hours of power interruptions than any other state at 155. Since 1932, Louisiana has lost over 2,000 square miles of land, and the majority of properties in Louisiana’s southern parishes on which sits much of Louisiana’s oil & gas infrastructure face a major risk of flooding in the next 30 years. The state will lose up to 3,000 more square miles of land over the next 50 years without aggressive action to restore and protect the coast.
Affordability. The average cost of flood insurance in Louisiana is expected to increase by 87 percent until full-risk prices are reached at a median cost of $1,470 for single-family homes. The number of policies in-force fell from nearly 500,000 in 2021 to 435,466 in 2024 leaving many homeowners financially vulnerable. Moreover, 1 in 3 Louisianans who rent spend more than half their income on housing costs.
Extreme heat and health. Since 2021, the number of extreme heat days in Louisiana has nearly doubled. Heat-related deaths jumped from 15 in 2020 to 88 in 2023. Exposure to extreme heat increases the risk of pregnancy-related deaths which, at 42 per 100,000 live births in Louisiana, is more than twice as high as the national rate. Drug overdose deaths, which are also more likely on extremely hot days, increased from 1,896 in 2020 to 2,224 in 2023. In 2016, Louisiana made Medicaid coverage more widely available such that the share of working-age adults without
health insurance, at 12 percent, is now significantly lower than surrounding Southern states. This is an important step in improving Louisianans’ life expectancy, which at 72.2 is the fourth lowest in the nation.
Democracy. Only 36 percent of Louisiana voters cast a vote for governor in the state’s 2023 election. And nearly half of Louisiana’s state legislators took office without any votes because their seat was uncontested. Legislators with no opponent are less likely to respond to constituents or actively contribute to the legislative process. A responsive and representative government is essential for promoting civic participation that will be critical for addressing the complexities of compounding disasters.
Emissions reduction and economic growth. Louisiana is unusual in that the majority of its emissions come from industry rather than transportation. As such, Louisiana has the potential to secure market dominance by investing in technological advancements that reduce industrial greenhouse gas emissions. Although large facility polluters are concentrated in the River Parishes, 50 of Louisiana’s 64 parishes have a large facility polluter, creating opportunities for emissions reduction in nearly every parish. Investments in lower carbon energy production and water management will create well-paying jobs that require collaboration between employers and education providers to upskill workers. Efforts to expand internet access especially in rural areas where 1 in 5 households lack any kind of connectivity will increase employment opportunities for many overlooked communities. And boosting the capacity of minority-owned businesses to participate in procurement opportunities and gain access to capital will widen the pool of potential job creators and strengthen supply chains.
Louisiana has ranked low on many indicators of well-being for decades.7, 8, 9 The proliferation of extreme weather events hitting the state is
compounding the suffering of many Louisianans. The state’s leadership on Medicaid and internet expansion will contribute to the foundation workers need to pursue their ambitions and provide for their families. And grassroots initiatives, such as the installation of “Community Lighthouses” in places of worship across the state, can strengthen the state’s resilience and social cohesion. To further reduce the impacts of extreme weather and sea level rise, the state will need to target mitigation activities in the most unprotected areas. Simultaneously, the state can reestablish competitiveness, reverse population loss, and protect our culture by aggressively investing in growing economic opportunities associated with water management and lower carbon energy.
Pathways to Prosperity: Louisiana provides the most up-to-date data on climate impacts, adaptation efforts, and opportunities to strengthen resilience and sow prosperity statewide. These 24 one-pagers covering key indicators are designed to help civic leaders develop a shared evidencebased understanding of Louisiana-specific climate and resilience trends, as they work to gain consensus, set priorities and form partnerships that support the effective and efficient deployment of federal, state and local funds and taxpayer dollars. The intent of this report is to serve as a baseline whose metrics will be updated on a regular basis to measure Louisiana’s progress toward prosperity.

Extreme weather impacts
The effects of extreme weather are being widely felt across Louisiana. This section provides the most up-to-date available data on the direct impacts of extreme weather shocks on lives and property in Louisiana.
In later sections of this report, these indicators serve as context for a unique analysis of the interactions between extreme weather shocks, mitigation and adaptation, and our civic health.
INDICATORS IN THIS SECTION:
• FEMA disaster declarations, by parish/county
• Billion-dollar weather and climate disasters
• Coastal land loss
• Flood risk, by parish
• Extreme heat days, by parish/county
• Heat-related deaths
1.1 EVERY LOUISIANA PARISH HAS EXPERIENCED AT LEAST 13 FEMA DISASTER DECLARATIONS SINCE 2020 – FOUR TIMES MORE THAN THE NATIONAL AVERAGE. ALL TOTAL, LOUISIANA HAS HAD OVER 900 DISASTER DECLARATIONS SINCE 2020.
Number of FEMA disaster declarations by parish/county Jan 1, 2020 – November 13, 2024

Source : FEMA
Notes : Includes all county-level disaster declarations (except COVID-19). For example: Dam/levee breaks, droughts, earthquakes, fires, floods, hurricanes, landslides, severe storms, tornadoes, and water crises.
Louisiana has had the most FEMA-declared disasters since 2020, with every parish experiencing at least 13. Marginalized groups, including rural and low-income communities, often bear the brunt of climate impacts as they are more likely to reside in areas prone to extreme weather events. 10, 11 Despite federal disaster relief spending more than doubling since 2020, compared to 2017–2019, the FEMA application process with its demanding documentation and lengthy timelines exacerbates inequities by posing significant challenges for smaller rural municipalities and low-income individuals. 12, 13 Additionally, disasters reduce the availability of housing while driving up costs, including insurance rates (Flood insurance , Unaffordable housing). And hurricanes and other disasters may lead to heat-related deaths. After Hurricane Ida, 9 of 26 storm-related deaths were caused by excessive heat during the extended power outage (Heat-related deaths). 14
1.2 BILLION-DOLLAR WEATHER DISASTERS IN THE U.S. ARE INCREASING IN SIZE AND IMPACT. SINCE 2020, LOUISIANA HAS EXPERIENCED BY FAR THE MOST DAMAGES WITH AT LEAST $20 BILLION PER MILLION RESIDENTS.
Billion-dollar weather and climate disaster events, U.S. (inflation-adjusted)
Annual cost by type of disaster, 1980–2024

Source : NOAA
Cost per million residents, 2020–24

Notes : Adjusted for inflation using the Consumer Price Index (CPI). Due to an inherent delay in the accounting of damages, the 2024 number will increase in subsequent updates. Data includes events with less than $1 billion in damage at the time of the event, but which exceed $1 billion in damages after adjusting for inflation. These billion-dollar events account for >80 percent of the damage from all U.S. weather and climate events. No state had between $10B and $20B in damages per million from 2020–2024.
The number of U.S. weather disasters causing at least a billion dollars in damages has tripled in recent years from an annual average of seven such large-scale disasters each year between 1980 and 2019 to an average of 22 such disasters annually from 2020 to 2024. Since 2020, every state has experienced one or more disasters with damages exceeding $1 billion, but Louisiana has experienced by far the largest damages per capita at over $20 billion per million residents.
According to the National Climate Assessment, without substantial efforts to reduce global greenhouse gas emissions and adapt to our changing climate, the frequency and magnitude of extreme weather disasters will accelerate, leading to massive property and infrastructure losses and slowing economic growth (FEMA disaster declarations). 15 Even with significant reductions in greenhouse gas emissions, the impacts of extreme weather events are expected to worsen over the next decade, with the increasing likelihood of compound events where two or more disasters occur simultaneously. 16
1.3 BETWEEN 1,100 AND 3,000 ADDITIONAL SQUARE MILES OF COASTAL LOUISIANA WILL BE LOST OVER THE NEXT 50 YEARS WITHOUT EXTENSIVE PROTECTION AND RESTORATION EFFORTS.
Projected coastal land mass change, Louisiana At year 50, higher environmental scenario, without action

Source : 2023 Louisiana Coastal Master Plan
Notes : In this higher environmental scenario, Louisiana would experience sea level rise of up to 2.5 ft over the next 50 years. Without action = without projects in the “2023 Coastal Master Plan”.
Louisiana lost over 2,000 square miles of land between 1932 and 2015, due largely to reduced sediment deposits prevented by Mississippi River levees, canal cutting for industry, and the accelerating impacts of subsidence and sea level rise. Projections indicate that without intervention, an additional 3,000 square miles of land will be lost over the next 50 years, leaving many Louisiana parishes increasingly vulnerable to storm surge flooding and associated economic damages. The “2023 Louisiana Coastal Master Plan” aims to mitigate and adapt to these challenges, with 77 restoration and risk reduction projects to safeguard hundreds of square miles of land and significantly reduce the economic toll of flooding. Designing and constructing these projects require years of planning and implementation, and the “2023 Louisiana Coastal Master Plan” carefully prioritizes them to maximize the benefits of finite resources. Sustained commitment to funding and executing the “2023 Louisiana Coastal Master Plan” will be essential to safeguarding Louisiana communities, defending critical oil & gas infrastructure, and protecting our way of life. 17
1.4 IN LOUISIANA’S SOUTHERN PARISHES, MORE THAN HALF OF ALL PROPERTIES ARE AT MAJOR OR EXTREME RISK OF FLOODING WITHIN THE NEXT 30 YEARS.
Share of properties at major to extreme risk for flooding, by Louisiana parish
Based on 30-year cumulative flood likelihood and projected depth of flooding

Source : First Street Foundation-Flood Model (FSF-FM).
Notes : Properties at “major” to “extreme” risk of flooding have at least an 80 percent cumulative probability of being flooded within 30 years (at least a 5 percent chance in any given year). The FSF-FM incorporates flood protection measures (e.g. levees, flood walls, retention ponds, marsh/wetland restoration), multiple types of flooding risks (e.g. tides, rain, riverine and storm surges), as well as future environmental considerations.
For the number and percent of properties at major risk of flooding in each parish, be sure to check out the downloadable excel tables accompanying this report at datacenterresearch.org
Nearly 1 million Louisiana properties (42 percent) are at major or extreme risk of flooding within the next 30 years. This flood risk is greatest among the southern parishes of Ascension, Cameron, Iberia, Jefferson, Lafourche, Orleans, Plaquemines, St. Bernard, St. Charles, St. James, St. John the Baptist, St. Mary, Terrebonne and Vermillion parishes where more than half of all properties are at major risk of flooding. Northern parishes face less risk. For example, the share of properties at major risk of flooding in Bossier, Caddo, Claiborne, DeSoto, East Feliciana, Franklin, Jackson, Lincoln, Morehouse, and Red River parishes is lower than the national average of 15 percent. Meanwhile, the cost of flood insurance will increase by thousands of dollars once full-risk pricing is completely implemented. 18 Enhancing flood resilience through measures such as elevating buildings and critical infrastructure, and investing in wetland and barrier island restoration will be essential to reduce flood risks.
1.5 THE NUMBER OF EXTREME HEAT DAYS ARE INCREASING NATIONWIDE. THE AVERAGE NUMBER OF EXTREME HEAT DAYS IN LOUISIANA PARISHES CLIMBED FROM 47 IN 2021 TO 82 IN 2023.
Number of extreme heat days (100°F Heat Index) by parish/county May 2023 – September 2023

Source : CDC / NASA
Notes : Data not available for Hawaii or Alaska.
2024 was the hottest year on record surpassing 2023. 19 Hot and humid days are especially lethal because humidity impairs the body’s ability to cool itself 20 (Heat-related deaths). Vulnerable groups, including older adults, young children, pregnant individuals, people who are overweight, and those with pre-existing conditions such as diabetes or heart disease face an increased risk of severe organ damage, or even death, on extreme heat days 21 (Pregnancy-related deaths). The average number of extreme heat days experienced by Louisianans climbed from 47 in 2021 to 63 in 2022 to 82 in 2023 the equivalent of nearly three full months of extreme heat.
Air conditioning (AC) is vital for protecting at-risk populations during extreme heat events, while weatherization helps lower energy costs. However, lower-income households are less likely to have AC, even in the South, where it is more common. These families often reside in older buildings with poor insulation. In Louisiana, the issue extends to correctional facilities, where none of the eight Louisiana Department of Corrections prisons are fully air-conditioned. 22 The Inflation Reduction Act and the Bipartisan Infrastructure Law provide significant funding for home weatherization, but weatherization funds are most often accessed by homeowners. 23 To enhance community resilience, it will be crucial to ensure that renters also have access to homes that shield them from extreme heat and high utility costs (Energy cost burden).
1.6 HEAT-RELATED
DEATHS
IN LOUISIANA HAVE SKYROCKETED SINCE 2020 – FROM AN ANNUAL AVERAGE OF 12 OVER THE PREVIOUS TWO DECADES TO AN ANNUAL AVERAGE OF 44 SINCE 2020.
Heat-related deaths, Louisiana 2000–2023
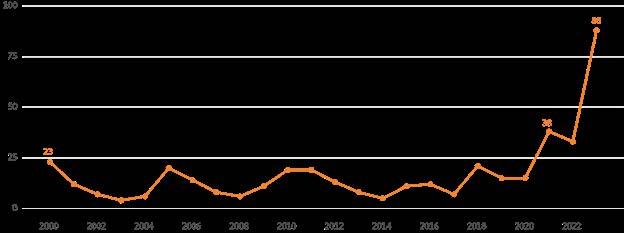
Source : CDC Wonder
Notes : Includes deaths for which heat was listed as either the underlying or contributing cause of death. Deaths are identified using ICD–10 underlying/contributing cause-of-death codes: P81.0, T67, and X30.
Over the past 30 years, heat has caused nearly twice as many deaths as flooding in the United States. 24 In 2023, 88 Louisianans died from heat-related causes up from 15 in 2020.
Infants and children, pregnant women, and older adults are among the most vulnerable to extreme heat exposure 25 (Pregnancy-related deaths). However, in Louisiana, working-age men are most likely to seek medical attention for heat-related illnesses due to physically demanding outdoor work requirements in agriculture, construction, oil & gas, and transportation. By 2090, total labor hours in Louisiana are anticipated to shrink due to increasing extreme heat days. 26

Government
This section tracks measures of key climate mitigation and resilience initiatives. It also highlights metrics of a functioning democracy which is crucial for fostering active civic engagement and learning, especially when dealing with the complexity and vastness of climate change.
INDICATORS IN THIS SECTION:
• Greenhouse gas emissions, by economic sector
• Large facility polluters
• Electric power interruptions, by state
• Home energy cost burden, by parish
• Unaffordable housing, by parish
• Cost of flood insurance, by parish/county
• Flood insurance policies, by parish
• Lack of health insurance, by parish/county
• Lack of internet, by parish
• Voter turnout, by parish
• Uncontested seats in the Louisiana legislature
2.1 FROM 1990 TO 2022, INDUSTRY ACCOUNTED FOR NEARLY 60 PERCENT OF ALL EMISSIONS IN LOUISIANA.
Louisiana greenhouse gas emissions by economic sector Emissions in million metric tons of carbon dioxide equivalent

Source : U.S. EPA
Notes : Types of gases include carbon dioxide, methane, nitrous oxide, hydrofluorocarbons, perfluorocarbons, sulfur hexafluoride, and nitrogen trifluoride.
In contrast to the U.S., where transportation accounts for the largest share (28 percent) of greenhouse gas emissions, in Louisiana the largest share of greenhouse gas emissions (GHG) comes from industry which produced fully 58 percent of all emissions in the state in 2022. This distinctive profile positions Louisiana to be a national leader in industrial decarbonization.
Global investors and customers are increasingly asking suppliers to provide documented emissions reductions. 27 At the same time, the Inflation Reduction Act includes substantial funding for GHG emission reductions. For example, a Louisiana collaboration of universities, state agencies, and private sector partners was awarded the largest National Science Foundation grant ever ($160M) to support innovations and technology commercialization in sustainable energy source development and emissions reductions. 28
Reducing greenhouse gas emissions will not only help address climate-related risks but also will create numerous new job opportunities (Employment rates), and it will decrease air pollutants that lead to serious illnesses and premature death 29 (Large-facility polluters).
2.2
LARGE FACILITIES IN LOUISIANA’S
RIVER PARISHES PRODUCED 38 MILLION METRIC TONS OF GREENHOUSE GASES IN 2023.
Greenhouse gas emissions from large facilities in Louisiana, 2023 Emissions in metric tons of carbon dioxide equivalent

Source : U.S. EPA
Notes : : Types of gases include carbon dioxide, methane, nitrous oxide, hydrofluorocarbons, perfluorocarbons, sulfur hexafluoride, and nitrogen trifluoride.
In Louisiana, industry is responsible for 58 percent of all emissions in the state (Greenhouse gas emissions). Cutting greenhouse gas emissions will not only reduce climate-related risks but also reduce air pollutants that contribute to severe health issues and premature death. Public health research has shown that low-income communities are disproportionately exposed to air pollutants. 30
The River Parishes between Baton Rouge and New Orleans account for 25 percent of the petrochemical production in the United States, a result of the oil & gas boom during World War II. 31, 32 The Environmental Protection Agency requires facilities to report their greenhouse gas emissions if they exceed 25,000 metric tons of greenhouse gas per year. 33 In 2023, CF Industries Nitrogen in Ascension Parish had the most emissions in Louisiana estimated at 9,475,266 metric tons of greenhouse gas followed by Sabine Pass Long Terminal in Cameron Parish with 6,261,721 metric tons. Comparing to a typical car which emits about five metric tons per year, these top two polluters in Louisiana annually emit the equivalent of 1,895,053 and 1,252,344 cars respectively. This is an exponential amount of air pollution in a localized region in a single year. 34 The level of industrial emissions produced in the state is so profound that Louisiana has the opportunity to lead the nation in emissions reduction by advancing technologies and innovation that dramatically reduce industry’s contribution to America’s carbon footprint.
For the large polluters in each parish, be sure to check out the downloadable excel tables accompanying this report at datacenterresearch.org.
2.3 SINCE 2013, LOUISIANA HAS EXPERIENCED 198 HOURS OF POWER INTERRUPTION – THE MOST OF ANY STATE – THREE TIMES MORE THAN THE NATIONAL AVERAGE.
Average annual duration of electric power interruptions, by state Hours per customer

Source : U.S. Energy Information Administration
Notes : : “Momentary” interruptions that last five minutes or less are generally omitted. Data reported by utilities using IEEE standard as well as any other method.
Extreme climate events are increasing the number and duration of power outages. 35 Power disruptions often occur during the hottest or coldest times of the year, leaving residents without essential heating or cooling (Heat-related deaths). Power outages also contribute to a surge in carbon monoxide poisonings. 36 From 2013 to 2023, Louisiana had the highest cumulative hours (198) of power interruptions of all states, followed closely by Maine (195). West Virginia had the third highest hours at a distant 142. A grassroots initiative has emerged to provide emergency electricity in Louisiana. Churches and community centers across the state are being equipped as “Community Lighthouses” with solar panels and battery storage to provide surrounding residents with electricity for cooling and medical devices during prolonged power outages. 37 This effort has secured $250 million in federal funds. Louisiana will also receive over $100 million in federal funds to help strengthen power lines, but will need substantially more. 38, 39 The state has approved Entergy Louisiana’s plan to invest $2 billion in fortifying the electric grid and increase ratepayer bills to cover the cost 40, 41 (Home energy burden).
2.4
LOW-INCOME LOUISIANANS PAY A DISPROPORTIONATE SHARE OF THEIR INCOME ON HOME ENERGY — 9 PERCENT COMPARED TO 6 PERCENT NATIONALLY.
Home energy burdens among low-income households, by Louisiana parish
Average percent of income spent on home energy costs, 2018–22 (5-year average)

Source : U.S. Department of Energy
Notes : “Energy burden” is defined as the percentage of gross household income spent on home energy costs. “Low-income household” is defined as below 80 percent of the area median income, as defined by the U.S. Department of Housing and Urban Development.
Households earning below 80 percent of area median income pay more than 13 percent of their income for energy costs in East Carroll, Madison, Richland, Webster, Franklin and Winn parishes. Low-income Concordia Parish households (with an average household income of $17,757) pay a whopping 16 percent for energy, or $2,850 per year on average. In fact, in every parish across the state, low-income households pay a higher share of their income on home energy than low-income households nationally (6 percent), with the exception of only St. Charles and Cameron Parishes. Louisiana boasts low electric costs per kilowatthour relative, but home utility bills can be much higher due to added fixed fees such as new storm fees, grid reliability fees, and new power plants costs.42, 43, 44, 45, 46
Improved home insulation and more efficient appliances can reduce electricity consumption by up to one-third.47 Weaving together Weatherization Assistance Program funds to install insulation, and update appliances and heating/cooling systems, with FEMA funds to raise homes and state funds for fortifying roofs can ensure taxpayers’ money is used most efficiently and effectively.48, 49
2.5 NEARLY 1 IN 3 LOUISIANANS WHO RENT SPEND THE MAJORITY OF THEIR INCOME ON HOUSING.
Severe housing cost burdens by Louisiana parish, 2019–23 (5-year average)
Percent of renter households paying half or more of household income on housing costs

Source : Census Bureau’s American Community Survey 2019-23
To see the number and percent of renter households paying more than half their income for housing, be sure to check out the downloadable excel tables accompanying this report at datacenterresearch.org.
Across the U.S., 26 percent of renters pay the majority of their income for housing costs including rent and utilities. In Louisiana, 31 percent of renters or 151,000 households spend most of their income on housing. The share of these “severely cost burdened” renters is highest in Cameron Parish (77 percent) and East Carroll Parish (55 percent). Fully 31 parishes across the state have a higher share of severely cost burdened renters than the national average. For families spending a significant portion of their income on rent, there is often little left for essentials such as clothing, food, utilities, or emergency savings, making these families less resilient. Additionally, many homes lack the necessary protections to withstand recurring severe weather (Flood risk). Thus, climate disasters often cause significant property damage, decreasing the supply of housing and driving prices upward.
Policy solutions for climate-resilient housing often overlook renters, as many government incentives, such as tax credits, are designed for homeowners. To foster resilient communities, Louisiana will need to prioritize the rental community which represents one-third of all homes in the state. 50, 51
2.6 ONCE FULL-RISK PRICES ARE COMPLETELY IMPLEMENTED, THE MEDIAN COST OF FLOOD INSURANCE IS PROJECTED TO INCREASE BY 87 PERCENT IN LOUISIANA COMPARED TO 64 PERCENT ACROSS THE U.S.
Median annual cost of full-risk flood insurance (Risk Rating 2.0) by parish/county
Single-family home policyholders in the National Flood Insurance Program

Source : FEMA
Notes : The full-risk cost of insurance is what policyholders will pay at their full actuarial rate under National Flood Insurance Program’s pricing approach (Risk Rating 2.0). Cost of insurance is defined as all premiums, fees, assessments and surcharges for a policy.
In 2021, the National Flood Insurance Program (NFIP), which is run by FEMA, began raising policy rates to more accurately reflect each property’s flood risk. By law, NFIP rates cannot increase by more than 18 percent per year, so some policyholders are on a “glide path” to their full-risk cost of insurance. Once the new price structure is fully implemented, the median cost of insurance for single family homeowners in Louisiana is projected to be $1,470 14 percent higher than the national median. The median annual cost will exceed $2,000 in Iberia, Assumption, Calcasieu, St. John and Jefferson parishes. And it will exceed $3,000 in Lafourche, Vermilion, and Terrebonne parishes. But homeowners in Plaquemines, Cameron and St. Mary parishes will pay the most. They’ll pay more than $4,000 per year for flood insurance.
To see the what the median full-risk price of flood insurance will be in single-family homes in each parish, be sure to check out the downloadable excel tables accompanying this report at datacenterresearch.org.
Moreover, according to the Insurance Information Institute, Louisiana consistently ranks among the four states with the highest homeowner’s insurance costs. 52, 53 High and rising insurance costs raise the overall cost of living and can depress home values and new property development. It can also leave homeowners with properties worth less than their outstanding mortgages. 54
2.7 FROM 2021 TO 2024, THE NUMBER OF FLOOD INSURANCE POLICIES ACROSS THE STATE SHRANK BY 12 PERCENT.
Percent change in number of flood insurance policies in-force, by Louisiana parish 2021–2024

Source : FEMA / NFIP
Note: Includes all residential and commercial NFIP policies in-force as of May 2021 and Oct 2024.
For the number of flood insurance policies in force in each parish, be sure to check out the downloadable excel tables accompanying this report at datacenterresearch.org.
The National Flood Insurance Program (NFIP) mandates that homes and businesses in FEMA-designated flood-prone areas with government-backed mortgages carry NFIP insurance. Additionally, other properties can opt to purchase NFIP insurance voluntarily. 55 As flood insurance costs increase, many policyholders without mortgages including poorer families with heirs properties are dropping their coverage, leaving them more financially vulnerable. 56 Louisiana had 60,000 fewer policies inforce in October 2024 compared to May 2021. St. Mary, Cameron, St. James, Morehouse, Madison, West Feliciana, and Iberia parishes have 25 percent fewer flood insurance policies in-force. Concordia Parish has 38 percent fewer policies, while Winn Parish has 52 percent fewer policies. Because NFIP is run by the federal government, data about the cost and number of policies in force is publicly available. Data on homeowners’ insurance comes from private companies and is not publicly available. Recently, Congress investigated the extent to which large insurers are refusing to renew homeowners’ insurance policies and found that 1 in 56 homeowners’ policies in Louisiana were dropped between 2018 and 2023. This rate was second only to Florida where 1 in 33 policies were not renewed. 57
2.8 IN LOUISIANA, ABOUT 12 PERCENT OF WORKING-AGE ADULTS LACK HEALTH INSURANCE, WHICH IS ON PAR WITH THE NATIONAL AVERAGE.
Lack of health insurance coverage by parish/county, 2019–23 (5-yr average)
Percent of population age 19–64

Source : Census Bureau’s American Community Survey 2019–23 and Kaiser Family Foundation
Notes : North Carolina has high uninsured rates because Affordable Care Act (ACA) Medicaid expansion started Dec. 1, 2023. Wisconsin has relatively low uninsured rates (despite not adopting ACA Medicaid expansion) because Wisconsin has partially expanded Medicaid, under a Medicaid waiver, to include all adults under 100 percent federal poverty level. 58
The effects of climate change are closely tied to poorer health outcomes. 59 From 2016 to 2020, heat-related weather events led to an estimated 290,000 excess hospital visits each summer, costing approximately $1 billion annually 60 (Heat-related deaths). Uninsured Americans are disproportionately affected, as limited access to healthcare often force them to forgo treatment for pre-existing conditions. 61 In 2010, the Affordable Care Act significantly reduced the number of uninsured individuals nationwide through Medicaid expansion and subsidies for health insurance “marketplaces”.
Unlike most Southern states, Louisiana adopted Medicaid expansion and subsequently has enjoyed higher than average rates of health insurance coverage. In Louisiana, about 12 percent (or 300,000) of working-age adults lack health insurance, compared to 23 percent in Texas, 18 percent in Georgia and Florida, 17 percent in Mississippi, and 15 percent in Alabama, Tennessee, and South Carolina. States can leverage Medicaid coverage to mitigate climate risks specific to their area. For example, Oregon has used Medicaid funds to cover air filters, air conditioners, and generators. 62
For the number of working age adults without health insurance in each parish, be sure to check out the downloadable excel tables accompanying this report at datacenterresearch.org.
2.9 OVER 220,000 LOUISIANA HOUSEHOLDS HAVE NO INTERNET — NOT EVEN A CELLULAR DATA PLAN. A DISPROPORTIONATE SHARE (19 PERCENT) OF THESE HOMES ARE IN RURAL PARISHES.
Lack of internet access by Louisiana parish, 2019–23 (5-year average)
Percent of households without internet access

Source : Census Bureau’s American Community Survey 2019–23
Note: “Lacking internet access” means the household has no internet subscription, no cellular data plan, and no access to the internet without a subscription (such as through property-wide Wi-Fi service in an apartment building).
More than 1 in 10 Louisianans have no internet access at home not even a cellular plan. This issue is particularly pronounced in Bienville, Claiborne, Franklin, Red River, St. Helena, Tensas, Union, Washington, Webster, and West Carroll parishes where at least 1 in 4 households lack internet. Expanding broadband, particularly through discounted plans, increases employment rates and earnings for low-income households.63 It also increases access to virtual healthcare which could improve health outcomes for rural Louisiana where two hospitals have closed since 2005 and 24 more are at risk of closing. 64, 65
The state established the Louisiana Office of Broadband Development in 2020 and dedicated $140 million in American Rescue Plan funds to expanding access in 48 parishes. This positioned the state well for quickly securing approval for its plan to deploy more than $1.3 billion from the Bipartisan Infrastructure Law to bring internet access to more rural and low-income areas of the state. Additionally, the state was ranked #1 by the American Enterprise Institute for the efficiency and transparency of its distribution plan. 66, 67
2.10 LOUISIANA’S 2023 ELECTION SAW THE LOWEST VOTER TURNOUT IN A DECADE. IN MORE THAN 80 PERCENT OF PARISHES, FEWER THAN HALF OF REGISTERED VOTERS PARTICIPATED.
Voter turnout, by Louisiana parish
Percent of registered voters that participated in the October 2023 primary

Source : Louisiana Secretary of State
The 2023 Louisiana election, which included key races for governor, lieutenant governor, treasurer, secretary of state, attorney general, and all 144 legislative seats, saw historically low voter turnout. Only 36 percent of registered voters participated in the October primary, with turnout dropping to just 23 percent in the November general election. The timing of elections plays a crucial role in voter participation, and turnout typically peaks during presidential election years. However, Louisiana stands out as one of only five states that holds state elections in off-years, which significantly dampens turnout.68 Research indicates that off-year elections not only depress turnout but can also favor large interest groups, undermine representation, and skew public policy away from the broader electorate’s preferences.69, 70, 71
Voter turnout in Louisiana was also likely negatively impacted by factors such as partisan districting and a high number of noncompetitive elections (Uncontested elections). Experts and community leaders point to rising apathy and distrust in government as key contributors to the ongoing disengagement among voters, further complicating efforts to increase participation and ensure a representative democratic process.72
2.11 IN
THE
2023 ELECTION, 46 PERCENT OF LOUISIANA’S STATE LEGISLATURE SEATS HAD ONLY ONE CANDIDATE.
Uncontested state legislature seats, Louisiana 2023
Senate

Source : Louisiana Secretary of State
House

Notes : Under Louisiana’s majority-vote system all candidates running for a state legislative office appear on the same ballot in the primary, regardless of their partisan affiliations, and can win the election outright by winning a simple majority of all votes cast in the primary. For this reason, a seat was considered “uncontested” if only a single candidate ran for the seat in the primary.
Uncontested elections, meaning elections with only one candidate option, are widespread in the United States, particularly at the state level.73 In the 2023 Louisiana state legislative election, 68 out of 144 seats went uncontested 20 in the state senate and 48 in the state house of representatives.
Research shows state legislators elected in unopposed elections tend to perform more poorly, showing up to vote less often and introducing fewer bills compared to their colleagues elected in competitive contests.74 And research finds that lack of political competition may result in more poorly functioning legislatures that are less responsive to and less reflective of the citizens they serve including on key issues such as climate action.75 In Louisiana, the combination of low voter turnout and a high number of uncontested elections presents a challenge to creating a truly representative and effective legislature ( Voter turnout).
People
This section examines key metrics of employment, health, and resiliency to inform decisions on where to invest and what initiatives to prioritize.
INDICATORS IN THIS SECTION:
• Employment rates, by race/ethnicity and gender
• Employer firm ownership, by race/ethnicity
• Median household income, by race/ethnicity
• Poverty, by race/ethnicity
• Life expectancy, by state
• Drug overdose deaths
• Pregnancy-related deaths
3.1 IN 2023, 74 PERCENT OF WORKING-AGE WHITE MEN IN LOUISIANA HAD EMPLOYMENT — DOWN FROM 79 PERCENT IN 1980. AND ONLY 56 PERCENT OF BLACK MEN IN LOUISIANA HAD EMPLOYMENT IN 2023 — DOWN FROM 61 PERCENT IN 1980.
Employment rate, by race/ethnicity and gender
For the population 16–64 years old, Louisiana

Source : U.S. Census Bureau and IPUMS NHGIS .
Notes : * = Change overtime is not significant for Hispanic males for 2010–2023. Change over time is not significant for Black males, Hispanic females, and White females for 2000–2010.
Employment rates represent the percentage of the working-age population engaged in paid work, including self-employment. These rates reveal the proportion of individuals who are unemployed as well as those who have exited the labor force entirely, such as “discouraged workers”.76
From 1980 to 2023, employment rates for working-age women in Louisiana increased from 46 percent to 63 percent for Hispanic and Black women, and from 47 percent to 65 percent for White women. In contrast, working-age men in Louisiana suffered significant declines in employment from 1980 to 2010. Employment rates for White males declined from 79 percent to 72 percent. Only 61 percent of Black males had employment in 1980, falling to 50 percent by 2010. In 1980, 70 percent of Hispanic males had employment, falling to 66 percent in 2000, but recovering to 79 percent by 2023, boosted by post-Katrina rebuilding activities. Black and White men experienced recovery after 2010, but by 2023 their employment rates 74 percent for White men, and only 56 percent for Black men remained lower than in 1980. As Louisiana pivots to growing jobs in the emerging sectors of water management and lower carbon energy production, many new, well-paying employment opportunities will open up. Employers will need to work closely with education providers to design curriculum that builds the specific skills needed for each new job.77
3.2 THE
SHARE OF LOUISIANA’S EMPLOYER
FIRMS THAT ARE
MINORITY-
OWNED NUDGED UPWARD FROM 11.9 PERCENT IN 2017 TO 15.2 PERCENT IN 2021, BUT REMAINS LOW RELATIVE TO THEIR SHARE OF THE TOTAL
POPULATION
(41 PERCENT).
Share of employer firms, by race/ethnicity of owner
Louisiana

Source : Annual Business Survey
Notes : Race/ethnicity is determined by the majority business owner. Calculations based on number of firms that are classifiable by ethnicity.
The vast majority of firms across Louisiana (84 percent) and the U.S. (83 percent) are businesses that have no employees. Many of these are sole proprietorships or gig-workers.78 Firms with employees typically generate greater revenue. White-owned employer firms represent nearly 85 percent of all employer firms in Louisiana, significantly higher than their share of the state population (57 percent). The share of employer businesses that are Black-owned at 4.6 percent in 2021 is disproportionately low relative to their share of the Louisiana population (32 percent). Hispanic-owned employer firms at 3.1 percent, yet they made up 7 percent of the population. In contrast, Asian firms grew at 7.1 percent are well above their share of total population (1.8 percent).
Minority-owned employer businesses are particularly important as they are more likely to invest in their local communities, promoting further economic growth.79, 80 Connecting minority-owned businesses with, and building their capacity to compete for contracting opportunities will be important for maximizing the local benefits of new economic growth opportunities. 81, 82 Additionally, increasing their access to capital will be essential as well, as this is often a barrier to expansion for minority-owned firms. 83
3.3 HISPANIC INCOMES ARE 12 PERCENT LOWER AND BLACK INCOMES ARE 46 PERCENT LOWER THAN WHITE INCOMES IN LOUISIANA.
Median household income by race/ethnicity in 2023 dollars
Louisiana

Source : U.S. Census Bureau and IPUMS NHGIS .
Notes : * = Change in time is not significant for any race 1999–2023.
Household income is a fundamental indicator of a household’s ability to meet its needs and accumulate savings. Growth in household income not only reflects improvements in family well-being but also plays a critical role in driving overall economic expansion, increasing tax revenues, and sustaining local businesses. In the 1980s, Louisiana incomes plummeted. After adjusting for inflation, we see that Louisianans have still not fully recovered their 1979 purchasing power. White household income fell 8 percent from $77,289 in 1979 (in 2023 dollars) to $70,828 in 2023. Hispanic median household income fell less significantly (3 percent) from $64,408 in 1979 to $62,639 in 2023. Black median income is actually slightly higher (1 percent) than in 1979, but at $38,115 in 2023, is barely half of White household income in Louisiana.
3.4 POVERTY RATES FOR WHITE AND HISPANIC LOUISIANANS HAVE REMAINED RELATIVELY CONSTANT AT 13 PERCENT AND 20 PERCENT RESPECTIVELY. BUT FOR BLACK LOUISIANANS POVERTY SPIKED TO 46 PERCENT IN THE 1980S AND FELL TO 29 PERCENT BY 2023.
Poverty rate by race/ethnicity since 1979
Louisiana
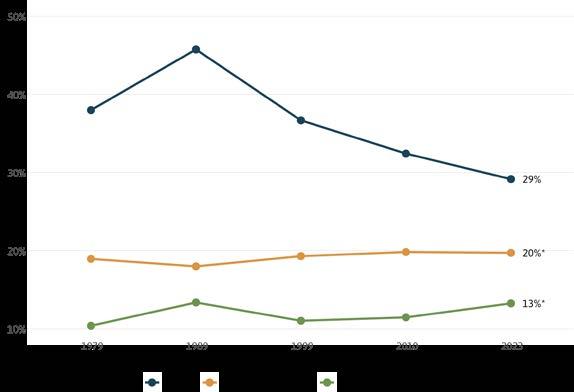
Source : U.S. Census Bureau and IPUMS NHGIS
Notes : * = Change in time is not significant for Hispanic for 1999–2023. Change in time is not significant for White for 1999–2010.
A high percentage of residents living below the poverty line suggests that the economy is failing to provide many with the resources necessary to meet their basic needs, such as food, housing, and transportation. The poverty rate for Black Louisianans spiked when the 1980s “oil bust” hit, jumping from 38 percent in 1979 to 46 percent in 1989. White Louisianans were less severely affected. The poverty rate for White Louisianans grew only slightly from 10 percent in 1979 to 13 percent in 1989. In 2023, the poverty rate for White Louisianans was 13 percent, while the poverty rate for Black Louisianans had fallen to 29 percent but remained more than double that of White Louisianans. The poverty rate among Hispanic Louisianans has remained relatively flat at roughly 20 percent.
3.5 AT 72.2 YEARS, LOUISIANA HAS AMONG THE LOWEST LIFE EXPECTANCY RATES OF ALL STATES. ONLY IN ALABAMA, WEST VIRGINIA, AND MISSISSIPPI IS LIFE EXPECTANCY LOWER AT 72, 71, AND 70.9 YEARS RESPECTIVELY.
Life expectancy at birth 2022

Source : CDC
Notes : Life expectancy at birth is the average number of years that a newborn would live if death patterns of the population at the time of their birth did not change during their lifetime. This means that any future changes to mortality rates would not be taken into account. Estimates for 2022 are provisional.
In Louisiana, life expectancy which is based on death patterns is only 72.2 years. This is among the lowest rates in the nation. Life expectancy for women in Louisiana is 75.9 years while life expectancy for men is only 68.8 years. The leading causes of death in Louisiana and in the United States are heart disease and cancer. But in recent years, drug overdoses (part of the “unintentional injury” category) have emerged as the third leading causes of death in Louisiana. Opioid overdoses are more likely during heat waves and may increase as summers grow hotter (Drug overdose deaths). Respiratory disease also ranks high among causes of death in Louisiana. 84 Our changing climate contributes to higher rates of death due to increases in poor air quality days and extreme heat days 85 (Extreme heat days , Heat-related deaths). Additionally, pregnancy-related deaths, which on average are twice as high in Louisiana than the U.S., will likely rise with more extreme heat days (Pregnancy-related deaths).
3.6 DRUG OVERDOSE DEATHS,
WHICH ARE MORE LIKELY IN THE FACE OF EXTREME HEAT AND OTHER NATURAL DISASTERS, EXPLODED FROM 188 IN 1999 TO 2,463 IN 2021, BEFORE DECREASING SLIGHTLY TO 2,224 BY 2023.
Drug overdose deaths, Louisiana
Rates per 100,000 population, 1999–2023

Source : CDC Wonder
Notes : 2023 is provisional. Drug overdose deaths are identified using ICD–10 underlying cause-of-death codes: X40–X44, X60–X64, X85, and Y10–Y14. Rates are age-adjusted.
Disasters can significantly disrupt the daily lives of Louisianans, impacting housing, health, and overall security. Research shows that opioid and substance abuse often increase in the aftermath of such events. 86, 87, 88 Moreover, substance use can impair the body’s ability to regulate temperature, and overdose deaths involving opioids are more common on hotter days. 89, 90
Drug overdose deaths in Louisiana rose dramatically over the last two and a half decades to a rate of 55.9 per 100,000 population in 2021 up from 4.3 in 1999. By 2023, the drug overdose death rate in Louisiana had declined slightly to 50.4 but remained more than 10 times higher than two and a half decades earlier. Additional funding for programs, such as the Substance Abuse Prevention and Treatment Block Grants, will be important for addressing the growing impact of increasing extreme heat days and disasters on the overdose crisis.91
3.7 IN 2023, LOUISIANA HAD 42 PREGNANCY-RELATED DEATHS PER 100,000 LIVE BIRTHS — MORE THAN TWICE AS HIGH AS THE NATIONAL RATE OF 19.
Pregnancy-related deaths per 100,000 live births 2003–2023
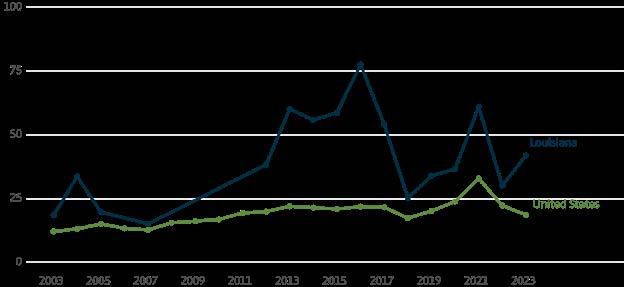
Source : CDC Wonder Mortality Data (deaths) and CDC Wonder Natality Data (births).
Notes : 2023 data is provisional (p). A pregnancy-related death is defined as a death while pregnant or within 42 days of termination of pregnancy, from any cause related to or aggravated by the pregnancy or its management, but not from accidental or incidental causes. Pregnancy-related deaths are identified using ICD–10 underlying cause-of-death codes: A34, O00–O95, and O98–O99.
Pregnant women and girls are among the most vulnerable in society, and research increasingly highlights their heightened risks due to our changing weather. For example, exposure to extreme heat during pregnancy increases the risk of preterm birth and low birth weight. Pregnant individuals have a naturally elevated core body temperature, and excessive heat can exacerbate health risks such as dehydration 92, 93 (Extreme heat days).
The pregnancy-related death rate in the U.S. at 19 deaths per 100,000 live births is higher than any other high-income country. In fact, half of high-income countries have between zero and six pregnancy-related deaths per 100,000 births.94 Louisiana ranks among the worst states in the nation in pregnancy-related deaths, with an average of 42 pregnancy-related deaths per 100,000 live births. In 2021, in the middle of the COVID-19 crisis, pregnancy-related deaths in the U.S. jumped to 33 deaths per 100,000 live births, but by 2023 returned to 19. In Louisiana, pregnancy-related deaths spiked to 61 per 100,000 live births in 2021, declined to 30 in 2022, but in 2023 resurged to 42. Practices such as offering tele-appointments and doctor’s appointments in the evening can help reduce the impacts of extreme heat on pregnant women and girls and reduce pregnancy-related deaths.95, 96, 97
Endnotes
1 Adelson, Jeff. 2024. “New Parish Census Estimates Show Widespread Population Loss across Louisiana.” The New Orleans Advocate. March 15, 2024. https://www.nola.com/news/politics/louisiana-population-falls-in-cities-rural-areas-data-show/ article_72e326a2-e231-11ee-bcc8-43800939b6fc.html
2 Plyer, Allison. “Is Louisiana Now Gaining Population?”. The Data Center. February 3, 2025. https://www.datacenterresearch. org/reports_analysis/is-louisiana-now-gaining-population/
3 Soraghan, Mike. 2024. “Oil and Gas Jobs Decline amid Record-Breaking Production.” E&E News by POLITICO. August 8, 2024. https://www.eenews.net/articles/oil-and-gas-jobs-decline-amid-record-breaking-production/
4 Upton, Gregory, E David, Dismukes, Owens, Chris Mclindon, David, E Dismukes, and Owens. n.d. “Gulf Coast Energy Outlook Energy Outlook 2025.” Accessed January 28, 2025. https://www.lsu.edu/ces/publications/2024/gulf-coast-energy-outlook2025-df-e-version.pdf
5 “Renewable Energy | Department of Energy and Natural Resources | State of Louisiana.” 2024. Louisiana.gov. https://www. dnr.louisiana.gov/page/renewable-energy
6 Lafutureenergy.org. 2025. https://lafutureenergy.org/
7 “Louisiana Moves up in National Rankings for Overall Child Well-Being | Louisiana Department of Children & Family Services.” 2024. www.la.gov. https://dcfs.la.gov/news/432
8 Staff Editorial. “Our Views: Louisiana Not Quite Dead Last on Rankings, but We Must Do Better for Our Children.” The New Orleans Advocate. June 29, 2021. https://www.theadvocate.com/baton_rouge/opinion/our_views/our-views-louisiana-notquite-dead-last-on-rankings-but-we-must-do-better-for/article_9e6ddc6a-d440-11eb-81ed-1bd1bbc500ce.html
9 Hilburn, Greg. “Louisiana Ranks as Worst State in Another Study, with Poverty, Poor Health among Factors.” Aol.com. August 12, 2024. https://www.aol.com/louisiana-ranks-worst-state-another-140117207.html
10 SAMHSA. 2017. “Greater Impact: How Disasters Affect People of Low Socioeconomic Status.” SAMHSA. https://www.samhsa. gov/sites/default/files/dtac/srb-low-ses_2.pdf
11 “National Climate Assessment.” National Climate Assessment. 2014. https://nca2014.globalchange.gov/highlights/regions/ rural-communities
12 “Disaster Relief Fund, Federal Emergency Management Agency, Homeland Security. FY 2025 Snapshot” n.d. www. usaspending.gov. https://www.usaspending.gov/federal_account/070-0702
13 Howell, J., & Elliott, J. R. (2018). “As Disaster Costs Rise, So Does Inequality.” Socius, 4 https://doi. org/10.1177/2378023118816795
14 La Dept. Of Health. “LDH: Hurricane Ida Storm-Related Death Toll Rises to 26.” n.d. www.ldh.la.gov. https://ldh.la.gov/ news/6308
15 U.S. Global Change Research Program. “Fifth National Climate Assessment.” https://nca2023.globalchange.gov/
16 Crimmins, Allison R, and Deepti Singh. “Focus on Compound Events.” Fifth National Climate Assessment. November 14, 2023. https://nca2023.globalchange.gov/chapter/focus-on-1/
17 “Louisiana’s Comprehensive Master Plan for a Sustainable Coast 4TH EDITION.” June 2023. https://coastal.la.gov/wpcontent/uploads/2023/06/230531_CPRA_MP_Final-for-web_spreads.pdf
18 Plunk, Elise. 2025. “Insurance Reform Worsens Affordability in Flood-Prone Louisiana.” Louisiana Illuminator. January 27, 2025. https://lailluminator.com/2025/01/27/insurance-flood/
19 World Meteorological Organization. “2024 Is on Track to Be Hottest Year on Record as Warming Temporarily Hits 1.5°C.” World Meteorological Organization. November 11, 2024. https://wmo.int/news/media-centre/2024-track-be-hottest-yearrecord-warming-temporarily-hits-15degc
20 Bohn, Katie. 2022. Review of Humans Can’t Endure Temperatures and Humidities as High as Previously Thought. Penn State University, March 1, 2022. https://www.psu.edu/news/research/story/humans-cant-endure-temperatures-and-humiditieshigh-previously-thought
21 “Picture of America: Heat-Related Illness.” cdc.gov. April 19, 2016. https://stacks.cdc.gov/view/cdc/142633
22 Review of Louisiana Dept. Of Corrections - Health Care Policy HCP8. August 21, 2018. https://www.documentcloud.org/ documents/24548847-louisiana-dept-of-corrections-health-care-policy-hcp8/
23 Mann, Rebecca, and Jenny Schuetz. 2022. Review of The U.S. Needs Better, More Accessible Home Weatherization Programs October 10, 2022. https://www.brookings.edu/articles/the-u-s-needs-better-more-accessible-home-weatherizationprograms/
24 U.S. Department of Commerce, NOAA. “Weather Related Fatality and Injury Statistics.” www.weather.gov. 2022. https://www. weather.gov/hazstat/
25 EPA. 2021. “Climate Change and Social Vulnerability in the United States. A Focus on Six Impacts” https://www.epa.gov/ system/files/documents/2021-09/climate-vulnerability_september-2021_508.pdf
26 Edwards, John. 2022. “LOUISIANA CLIMATE ACTION PLAN: CLIMATE INITIATIVES TASK FORCE RECOMMENDATIONS to the GOVERNOR STATE of LOUISIANA.” https://gov.louisiana.gov/assets/docs/CCI-Task-force/CAP/ClimateActionPlanFinal.pdf
27 Upton, Gregory, E David, Dismukes, Owens, Chris Mclindon, David, E Dismukes, and Owens. n.d. “Gulf Coast Energy Outlook 2025.” https://www.lsu.edu/ces/publications/2024/gulf-coast-energy-outlook-2025-df-e-version.pdf
28 “FUEL.” Fuelouisiana.org. 2024. https://fuelouisiana.org/
29 USGCRP. 2018. “Fourth National Climate Assessment.” Globalchange.gov 2: 1–470. https://nca2018.globalchange.gov/ chapter/13/
30 Idna G. Castellón, Cancer Alley and the Fight Against Environmental Racism , 32 Vill. Envtl. L.J. 15 (2021). Available at: https:// digitalcommons.law.villanova.edu/elj/vol32/iss1/2
31 James W, Jia C, Kedia S. “Uneven magnitude of disparities in cancer risks from air toxics”. Int J Environ Res Public Health 2012 Dec 3;9(12):4365-85. https://pmc.ncbi.nlm.nih.gov/articles/PMC3546767/
32 Maraniss, David, and Michael Weisskopf. “The Faces of Pollution: As Cancer, Miscarriages Mount, Louisiana Wonders If It Is a ‘National Sacrifice Zone.’” Los Angeles Times . January 24, 1988. https://www.latimes.com/archives/la-xpm-1988-01-24-mn37913-story.html
33 Younes, Lylla, Al Shaw, and Claire Perlman. “In a Notoriously Polluted Area of the Country, Massive New Chemical Plants Are Still Moving In.” ProPublica . October 30, 2019. https://projects.propublica.org/louisiana-toxic-air/
34 United States Environmental Protection Agency. “Greenhouse Gas Emissions from a Typical Passenger Vehicle.” U.S. EPA. August 23, 2024. https://www.epa.gov/greenvehicles/greenhouse-gas-emissions-typical-passenger-vehicle
35 Do, Vivian, Heather McBrien, Nina M Flores, Alexander J Northrop, Jeffrey Schlegelmilch, Mathew V Kiang, and Joan A Casey. “Spatiotemporal Distribution of Power Outages with Climate Events and Social Vulnerability in the USA.” Nature Communications 14, no. 1 (2023): 2470. https://doi.org/10.1038/s41467-023-38084-6
36 Worsham, Christopher, Jaemin Woo, Michael Kearney, Charles F Bray, and Anupam B Jena. 2022. “Carbon Monoxide Poisoning during Major U.S. Power Outages.” The New England Journal of Medicine 386 (2): 191–92. https://doi.org/10.1056/ nejmc2113554
37 Smith, Mike. “‘This Is an Inspiration’: Plans for Solar-Powered Hubs throughout Louisiana Take Big Step Forward.” The New Orleans Advocate. November 16, 2023. https://www.nola.com/news/environment/big-step-forward-for-louisianascommunity-lighthouses/article_beff7116-840e-11ee-8162-873115843c55.htm l
38 “40101d | Department of Energy and Natural Resources | State of Louisiana.” Louisiana.gov. 2024. https://www.dnr.louisiana. gov/page/40101d
39 Karlin, Sam. “As Louisiana Grapples with How to Bolster Its Electric Grid, Leaders Look to the Feds for Help.” The New Orleans Advocate. December 26, 2021. https://www.nola.com/news/as-louisiana-grapples-with-how-to-bolster-its-electricgrid-leaders-look-to-the-feds/article_8b4d0e18-6364-11ec-bed5-cf18aebef1b7.html
40 Karlin, Sam. “Entergy Louisiana Customers to Pay More to Fund $2B Grid-Hardening Plan. See Details.” The New Orleans Advocate. April 19, 2024. https://www.nola.com/news/business/entergy-louisiana-customers-to-fund-2b-grid-hardeningplan/article_44a85e86-fe7b-11ee-9971-1bcbef6a0f1a.html
41 Muller, Wesley. “Few of Entergy’s $1.9 Billion in Grid-Hardening Projects Include Underground Power Lines.” Louisiana Illuminator. April 24, 2024. https://lailluminator.com/2024/04/24/few-of-entergys-1-9-billion-in-grid-hardening-projectsinclude-underground-power-lines/
42 EIA. “EIA - Electricity Data.” Eia.gov. 2024. https://www.eia.gov/electricity/monthly/epm_table_grapher.php?t=epmt_5_6_a
43 Verite News and Michael Isaac Stein. “‘There’s No End in Sight’: Entergy Bills Rising at Historic Pace.” Louisiana Illuminator November 2, 2023. https://lailluminator.com/2023/11/02/entergy-bills/
44 Karlin, Sam. “Entergy Louisiana Customers Will Soon Pay Higher Rates. See How Much.” The New Orleans Advocate. August 14, 2024. https://www.nola.com/news/business/entergy-louisiana-customers-will-soon-pay-higher-rates/article_c54d4c625a6b-11ef-b87d-d3edf20981aa.html
45 Tong, James. “Tong and Wellinghoff: Why Fixed Charges Are a False Fix to the Utility Industry’s Solar Challenges.” Utility Dive February 13, 2015. https://www.utilitydive.com/news/tong-and-wellinghoff-why-fixed-charges-are-a-false-fix-to-the-utilityindu/364428/
46 Muller, Wesley. “Entergy Asking to Bill Customers a Storm Fee for Hurricane Francine Recovery.” Louisiana Illuminator January 8, 2025. https://lailluminator.com/2025/01/08/entergy-asking-to-bill-customers-a-storm-fee-for-hurricane-francinerecovery/
47 Review of Low-Income Household Energy Burden Varies among States — Efficiency Can Help in All of Them . 2018. www. energy.gov/. U.S. Department of Energy. December 2018
48 Corporation, Louisiana Housing. n.d. “Weatherization Assistance Program (WAP).” www.lhc.la.gov. https://www.lhc.la.gov/ weatherization
49 Martin, Carlos. “Harnessing the IIJA’s Weatherization Assistance Program to Leave No Household in the Cold.” Joint Center for Housing Studies of Harvard University. January 31, 2023. https://www.jchs.harvard.edu/blog/harnessing-iijasweatherization-assistance-program-leave-no-household-cold
50 Fernald, Marcia, ed. 2022. Review of America’s Rental Housing 2022. Joint Center for Housing Studies of Harvard University. https://www.jchs.harvard.edu/sites/default/files/reports/files/Harvard_JCHS_Americas_Rental_Housing_2022.pdf
51 Carlos Martin, Rachel Drew, Anthony Orlando, Jennifer Moody, Seva Rodnyansky, Brian An, Andrew Jakabovics, Noah Patton, and Manann Donoghoe. 2023. Review of Disasters and the Rental Housing Community. Brookings Metro https://www. brookings.edu/wp-content/uploads/2023/09/Disasters-and-the-Rental-Housing_final.pdf
52 “Average Homeowners Insurance Premiums Ranked By State, 2018.” Insurance Information Institute. 2018. https://www.iii. org/table-archive/74514
53 “Facts + Statistics: Homeowners and Renters Insurance”. Insurance Information Institute. 2024. https://www.iii.org/factstatistic/facts-statistics-homeowners-and-renters-insurance
54 “The 9th National Risk Assessment: The Insurance Issue.” First Street Foundation. September 20, 2023. https://report. firststreet.org/9th-National-Risk-Assessment-The-Insurance-Issue.pdf
55 Knowles SG, Kunreuther HC. “Troubled Waters: The National Flood Insurance Program in Historical Perspective”. Journal of Policy History. 2014;26(3):327-353. doi:10.1017/S0898030614000153
56 Kendall B. Bargeman. “The Heirs’ Property Dilemma: How Stronger Federal Policies Can Help Narrow the Racial Wealth Gap”. 27 N.C. BANKING INST. 320 (2023). https://scholarship.law.unc.edu/ncbi/vol27/iss1/15
57 Rojanasakul, Mira, and Christopher Flavelle. “See Where Home Insurance Policies Were Dropped in Your State.” The New York Times, December 18, 2024. https://www.nytimes.com/interactive/2024/12/18/climate/insurance-nonrenewal-ratespolicies-state-map.html
58 “Wisconsin and the ACA’s Medicaid Expansion.” n.d. Healthinsurance.org. https://www.healthinsurance.org/medicaid/ wisconsin/
59 United States Environmental Protection Agency. “Climate Change and Human Health.” www.epa.gov. March 20, 2022. https:// www.epa.gov/climateimpacts/climate-change-and-human-health
60 Steven Woolf, Joseph Morina, Evan French, Adam Funk, Roy Sabo, Stephen Fong, Jeremy Hoffman, Derek Chapman, and Alex Krist. “The Health Care Costs of Extreme Heat.” Center for American Progress. June 27, 2023. https://www.americanprogress. org/article/the-health-care-costs-of-extreme-heat/
61 “Climate Change and the Health of Socially Vulnerable People.” United States Environmental Protection Agency. March 21, 2022. https://www.epa.gov/climateimpacts/climate-change-and-health-socially-vulnerable-people
62 Shattuck, Paul, Corrie Haley, and Emily Cross. The Untapped Potential of Medicaid to Reduce Greenhouse Gas Emissions. The Commonwealth Fund. July 19, 2023. https://www.commonwealthfund.org/blog/2023/untapped-potential-medicaid-reducegreenhouse-gas-emissions
63 Zuo, George W. “Wired and Hired: Employment Effects of Subsidized Broadband Internet for Low-Income Americans.” American Economic Journal: Economic Policy, 13 (3): 447–82 (2021)
64 Deal, Meredith. “Healthcare’s Uneven Financial Performance: Large Hospitals Bounce Back While Rural Facilities Face Ongoing Vulnerability Concerns”. Chartis . September 20, 2024. https://www.chartis.com/insights/healthcares-unevenfinancial-performance-large-hospitals-bounce-back-while-rural
65 “Hundreds of Rural Hospitals Were at Immediate Risk of Closure before the Pandemic Hundreds More Rural Hospitals Are at High Risk of Closing in the Future.” n.d. https://ruralhospitals.chqpr.org/downloads/Rural_Hospitals_at_Risk_of_Closing.pdf
66 Muller, Wesley. “Louisiana Broadband Office Earns Top Ranking for Managing Biden Infrastructure Money.” Louisiana Illuminator. June 27, 2024. https://lailluminator.com/2024/06/27/louisiana-broadband-office-earns-top-ranking-formanaging-biden-infrastructure-money/
67 Muller, Wesley. “Louisiana Leads Nation in Broadband Expansion, but Some Don’t Dig the Success.” Louisiana Illuminator August 13, 2024. https://lailluminator.com/2024/08/13/louisiana-broadband/
68 Austin, Erik W., Jerome M. Clubb, William H. Flanigan, Peter Granda, and Nancy H. Zingale. “Electoral Participation in the United States, 1968-86.” Legislative Studies Quarterly 16, no. 1 (1991): 145–64. https://doi.org/10.2307/439972
69 Anzia, Sarah F. “Election Timing and the Electoral Influence of Interest Groups.” The Journal of Politics 73, no. 2 (2011): 412–27. https://doi.org/10.1017/s0022381611000028
70 Hajnal, Zoltan, and Jessica Trounstine. “Where Turnout Matters: The Consequences of Uneven Turnout in City Politics.” The Journal of Politics 67 (2): 515–35 (2005). https://doi.org/10.1111/j.1468-2508.2005.00327.x
71 Hartney, Michael T., and Sam D. Hayes. “Off-Cycle and out of Sync: How Election Timing Influences Political Representation.” State Politics & Policy Quarterly 21, no. 4 (March 30, 2021): 335–54. https://doi.org/10.1017/spq.2020.6
72 Service, LSU Manship School News. “Louisiana’s Low Voter Turnout Attributed to Apathy, Mistrust” Louisiana Illuminator December 27, 2023. https://lailluminator.com/2023/12/27/louisiana-voter/
73 Burden, Barry C., and Rochelle Snyder. “Explaining Uncontested Seats in Congress and State Legislatures.” American Politics Research 49 (3): 247–58 (2020). https://doi.org/10.1177/1532673x20960565
74 Konisky, David M., and Michiko Ueda. “The Effects of Uncontested Elections on Legislator Performance.” Legislative Studies Quarterly 36, no. 2 (2011): 199–229. http://www.jstor.org/stable/23053266
75 Konisky, David M., and Michiko Ueda. “The Effects of Uncontested Elections on Legislator Performance.” Legislative Studies Quarterly 36, no. 2 (2011): 199–229. http://www.jstor.org/stable/23053266
76 Black, Dan A., Natalia Kolesnikova, and Lowell J. Taylor. 2010. Review of African-American Economic Progress in Urban Areas: A Tale of 14 American Cities . Federal Reserve Bank of St. Louis. http://research.stlouisfed.org/wp/2010/2010-015.pdf
77 Kane, Joseph W. 2022. SEIZING the U.S. INFRASTRUCTURE OPPORTUNITY: INVESTING in CURRENT and FUTURE WORKERS. Brookings Metro https://www.brookings.edu/wp-content/uploads/2022/12/InfraJobsUpdate_final.pdf
78 “Nonemployer Firms.” n.d. www.fedsmallbusiness.org. https://www.fedsmallbusiness.org/categories/nonemployer-firms
79 Ganev, Veso. “Entrepreneurship as a Catalyst for Advancement.” August 8, 2023. The Harvard Business Services. https://www. delawareinc.com/blog/minority-owned-businesses-and-advancement/
80 Boston, T.D. “The Role of Black-Owned Businesses in Black Community Development.” January 1, 2006. https://www. researchgate.net/publication/290973214_The_role_of_black-owned_businesses_in_black_community_development
81 Propeller. 2023 Annual Report. 2023. https://drive.google.com/file/d/1OkeD0pxbiNpcl2skUhcyZYjtbk1UiNW-/view
82 “FUEL.” Fuelouisiana.org. 2025. https://fuelouisiana.org/about
83 Perry, Andre M, and Jonathan Rothwell. “Why Don’t More Americans Work for Black-Owned Firms? Implications for Increasing Well-Being.” Brookings . June 21, 2024. https://www.brookings.edu/articles/why-dont-more-americans-work-forblack-owned-firms-implications-for-increasing-well-being/
84 CDC. 2020. “Louisiana.” Www.cdc.gov. May 8, 2020. https://www.cdc.gov/nchs/pressroom/states/louisiana/la.htm
85 Wang, Chenghao, Jonas G. Miller, Robert B. Jackson, and Laura L. Carstensen, eds. 2022. Combating Climate Change in an Era of Longevity. American Society on Aging , June 22, 2022. https://generations.asaging.org/combating-climate-change-eralongevity
86 McCann-Pineo, Molly, Emanuela Taioli, and Rebecca M. Schwartz. “Exposure to Hurricane Sandy and Risk of Opioid Abuse.” Substance Use & Misuse 56 (8): 1241–45 (2021). doi:10.1080/10826084.2021.1912098
87 Shuler M, Suzuki S, Podesta A, Qualls-Hampton R, Wallington SF. “A Post-Hurricane Katrina Examination of Substance Abuse Treatment Discharges With Co-Occurring Psychiatric and Substance Use Disorders”. J Dual Diagn . 2017 AprJun;13(2):144-156. doi: 10.1080/15504263.2016.1277816. Epub 2017 Jan 3. PMID: 28045601
88 “Elevated Temperatures and Climate Change May Contribute to Rising Drug and Alcohol Disorders.” Columbia University Mailman School of Public Health. September 22, 2023. https://www.publichealth.columbia.edu/news/elevatedtemperatures-climate-change-may-contribute-rising-drug-alcohol-disorders
89 Sprague, Jon E., Christopher L. Riley, and Edward M. Mills. “Chapter 36 - Body Temperature Regulation and Drugs of Abuse.” Edited by Andrej A. Romanovsky. ScienceDirect. Elsevier. January 1, 2018. https://www.sciencedirect.com/science/article/ abs/pii/B9780444640741000367
90 Auger, Nathalie, Marianne Bilodeau-Bertrand, Maud Emmanuelle Labesse, and Tom Kosatsky. 2017. “Association of Elevated Ambient Temperature with Death from Cocaine Overdose.” Drug and Alcohol Dependence 178 (September): 101–5. https:// doi.org/10.1016/j.drugalcdep.2017.04.019
91 Review of POLICY BRIEF: DISASTERS and SUBSTANCE USE. 2020. National Association of State Alcohol and Drug Abuse Directors. https://nasadad.org/wp-content/uploads/2020/12/Policy-brief_-Disasters-and-Substance-Use.pdf
92 CDC. 2024. “Clinical Overview of Heat and Pregnancy.” Heat Health . 2024. https://www.cdc.gov/heat-health/hcp/clinicaloverview/heat-and-pregnant-women.html
93 Jiao A, Sun Y, Avila C, et al. “Analysis of Heat Exposure During Pregnancy and Severe Maternal Morbidity”. JAMA Netw Open 2023;6(9):e2332780. doi:10.1001/jamanetworkopen.2023.32780
94 Gunja, Munira, Evan Gumas, Relebohile Masitha, and Laurie Zephyrin. “Insights into the U.S. Maternal Mortality Crisis: An International Comparison.” The Commonwealth Fund. June 4, 2024. https://www.commonwealthfund.org/publications/ issue-briefs/2024/jun/insights-us-maternal-mortality-crisis-international-comparison
95 Ha S. “The Changing Climate and Pregnancy Health”. Curr Environ Health Rep. 2022 Jun;9(2):263-275. doi: 10.1007/s40572022-00345-9. Epub 2022 Feb 22. PMID: 35194749; PMCID: PMC9090695
96 CDC. “Clinical Overview of Heat and Pregnancy.” Heat Health . 2024. https://www.cdc.gov/heat-health/hcp/clinicaloverview/heat-and-pregnant-women.html
97 Summer Sherburne Hawkins. “Telehealth in the Prenatal and Postpartum Periods.” J Obstet Gynecol Neonatal Nurs ., June 2023. https://doi.org/10.1016/j.jogn.2023.05.113
ABOUT PATHWAYS TO PROSPERITY: LOUISIANA
Louisianans are increasingly experiencing the direct impacts of extreme weather events and sea level rise. For example, sea level rise is contributing to miles of land loss along the Louisiana coast, and the size and frequency of hurricanes hitting the state is increasing.
In 2007, Louisianans developed the country’s first Master Plan for Coastal Protection and Restoration. Billions of dollars have and will be spent on the coast over 50 years, including federal and state taxpayer dollars, and penalties from the 2010 BP oil spill. Such a massive investment of funds has the potential to catalyze the development of a new economic cluster focused on water management.
In 2022, the state approved a Climate Action Plan, developed with the input of government, private sector, academia, environmental and community advocates, and over 49 public meetings. The plan contains a balanced set of recommendations to limit the severity of severe weather impacts while positioning the state to be competitive in a low-carbon future. At the same time, massive once-in-a-generation federal investments through the Bipartisan Infrastructure Law and Inflation Reduction Act have come to states and localities (with potentially more on the way after review by the Trump Administration) to offset the harshest effects of severe weather and support the transition to a lower carbon future.
Pathways to Prosperity: Louisiana provides the most up-to-date data on severe weather impacts, mitigation and adaptation efforts, and opportunities to ensure all Louisianans are gainfully employed, healthy, and resilient. As leaders come together to deploy federal and state funds, Pathways to Prosperity: Louisiana provides easily accessible data and analysis that can support a shared, evidence-
based understanding of state-specific impacts and opportunities. These 24 one-pagers represent a comprehensive set of high-demand indicators that leaders can use to gain consensus, set priorities and forge partnerships. The Data Center partnered with the National Conference on Citizenship to assemble and analyze this unique set of metrics to provide an overview of extreme weather shocks, adaptation activities, economic opportunities, and civic health.
About The Data Center (datacenterresearch.org)
The Data Center, a project of Nonprofit Knowledge Works, is the most trusted resource for data about Southeast Louisiana. Founded in 1997, we provide fully independent research and analysis to offer a comprehensive look at issues that matter most to our region. With a mission of democratizing data, The Data Center has, and continues to be, an objective partner in bringing reliable, thoroughly researched data to conversations about building a more prosperous, inclusive, and sustainable region.
About the National Conference on Citizenship (NCoC.org) NCoC is committed to strengthening democracy by supporting local leaders and nonpartisan projects dedicated to citizen engagement and public service. Our vision is one of full participation in our democracy, and that in doing so our democracy reflects the combined voices, dreams, and actions of all who call our country home.
AUTHORS
Dr. Allison Plyer is the Chief Demographer for The Data Center of Southeast Louisiana. She is author of The New Orleans Index series, developed in collaboration with the Brookings Institution to analyze the state of the recovery post-Katrina and later to track the region’s progress toward prosperity. Dr. Plyer is co-author of the national Pathways to Prosperity report, developed in collaboration with the National Conference on Citizenship, which details both the impacts of increasingly severe weather and the potential for federal investments to target the inequities these impacts create and compound. Allison is an international expert in post-Katrina demographics and disaster recovery trends and frequently provides commentary on recovery and development to national news media. Allison received her Doctorate in Science from Tulane University, has an MBA from the Kellogg Graduate School of Management at Northwestern University, and a BA in religious studies from Vanderbilt University.
Taylor Savell is Program Manager and Senior Policy Analyst at the National Conference on Citizenship (NCoC). She is co-author of NCoC’s Pandemic to Prosperity and Pathways to Prosperity reports, contributing expertise and analysis of state level measures of functioning democracies. Additionally, her work focuses on 2020 Census issues such as data quality and the use of census
ACKNOWLEDGMENTS
The authors would like to thank Elaine Ortiz and Haleigh Tomlin who made essential contributions to the data analysis, and Lamar Gardere and Katrina Andry who provided critical feedback and editing. We would also like to acknowledge the following people for their valuable comments on earlier drafts of this report: Emilia Aguinaga, Logan
data for redistricting and federal funding. Prior to NCoC, Taylor worked at the Beeck Center for Social Impact and Innovation and co-authored the website USApportionment.org, which was the go-to resource for census watchers and journalists in the lead up to the release of the 2020 Census data for congressional apportionment. Taylor is a graduate of the Walsh School of Foreign Service at Georgetown University where she received her BS in International Politics.
Anissa Hyde is a Data Analyst at The Data Center of Southeast Louisiana with expertise in Louisiana’s integrated environmental issues including flooding, urban ecology, and coastal protection. Before joining The Data Center, Anissa engineered core data to measure population response to major hurricanes in the Southeast as a research assistant at Louisiana State University winning first place at LSU’s Graduate Student Oral Symposium. Her master’s thesis describes a novel technique using flood insurance coverage to help explain neighborhood level flood exposure patterns and was peer-reviewed and published in the Water journal. Anissa has a MS in Environmental Science from Louisiana State University’s College of the Coast and Environment, as well as a BS in Natural Resource Ecology and Management with a concentration in Conservation Biology.
Burke, Kelisha Garrett, Sarah Beth Gehl, Robert Habans, Ashley Herad, Liz Russell, and Ashley Shelton.
The Data Center wishes to thank the Foundation for Louisiana and Walton Family Foundation for their support of Pathways to Prosperity: Louisiana
Additional gratitude goes to the W.K. Kellogg Foundation, Kresge Foundation, J.P. Morgan Chase Foundation, United Way of Southeast Louisiana, RosaMary Foundation, and the Keller Family Foundation for their generous support of the work of The Data Center. National Conference on Citizenship wishes to thank the Annie E. Casey
FOR MORE INFORMATION
Allison Plyer
Chief Demographer
The Data Center allisonp@datacenterresearch.org
Foundation, Joyce Foundation, New Venture Fund, Rockefeller Brothers Foundation, David and Lucille Packard Foundation, Omidyar Network, Knight Foundation, Miami Foundation, European Climate Foundation, The League of Women Voters, and The Carter Center.