IDENTIFYING PARTICIPATION OPPORTUNITIES FOR AREA-ORIENTED INFRASTRUCTURE PLANNING
Project: Community Development Climate Adaptive Water Hubs
Document created on behalf of: Rijkswaterstaat
Created by: Naomi Bueno de Mesquita
Email: naomi.buenodemesquita@designacademy.nl
Design & Social Innovation Lectorate, Design Academy Eindhoven
Date: January 2025
Principal Researcher and Project Leader: Dr. Naomi Bueno de Mesquita
Research Associates: Lucas Zoutendijk (September 2023 - February 2024), Niene Boeijen (March 2024 - January 2025), and Anne Vader (September 2024 - January 2025)
Cover design: Lucas Zoutendijk
Book design: Toni Wagner
This document is distributed under the terms of the Creative Commons Attribution NonCommercial - NoDerivatives License (http://creativecommons.org/licenses/by-nc-nd/4.0/), which allows for non-commercial reuse, distribution, and reproduction in any medium, provided that the original work is properly cited and not altered, transformed, or used as a basis for other works.
Functionality
Description of Selected Categories
Action Arena Map
Conclusion and Further Research Bibliography
INTRODUCTION TO THE REPORT
This report outlines the research conducted by Design Academy Eindhoven from September 2023 to January 2025 for the GO-CAWH project, which is led by Rijkswaterstaat. In this project, Design Academy Eindhoven collaborated with the University of Groningen and Coöperatie Kloostersland. The document includes hyperlinks to background documentation from the three research associates, who contributed to this project at different stages.
Under the guidance of Dr. Naomi Bueno de Mesquita, a professor at Design Academy Eindhoven for the Research Group Design & Social Innovation, Lucas Zoutendijk worked on the project from September 2023 to February 2024. Niene Boeijen was active from March 2024 to January 2025, and Anne Vader from September 2024 to January 2025.
Given the complexity of the task and the various expertise of the research associates, the decision was made to present the richness of the entire research process. This approach honors the diverse perspectives of the involved researchers. The report provides insight into the value of design research in participatory processes between government and communities. It proposes how different research methods can be utilized in such processes, how to reconcile various perspectives, and where potentials lie in scaling up local initiatives.
A common territorial challenge in Northwestern Europe is restoring the imbalance between water supply from rivers and rainfall, and the demand for water from farmers, water boards, citizens, and businesses. Climate change increases water needs during dry periods, while heavy rainfall can temporarily cause a surplus. The overall aim of this project is to develop Climate Adaptive Water Hubs (CAWHs) in areas surrounding hard infrastructure, such as highways. These hubs offer smart, scalable, transferable, and adaptable solutions that assist in balancing the water system, paying attention to local demand and supply, capturing runoff from road water, creating buffers, maintaining water quality, supporting ecosystems, and managing extreme weather events such as floods, heavy rainfall, and drought.
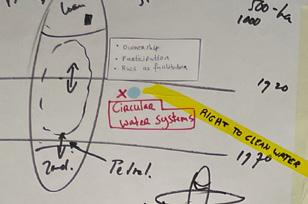
Community Development in Climate Adaptive Water Hubs (GOCAWH) is, alongside Rural Roadwater Rescue (RRR), part of a larger research trajectory, Sponge Works, for which funding is currently being sought. These sub-projects run partly in tandem and aim to develop a thorough and validated approach for community development surrounding circular water use, with the highway playing a central role as a water reservoir. In current practice, water is often drained away as quickly as possible, even in areas where there is a need for water due to drought. The question is whether highways and their immediate surroundings can be designed and managed in such a way that road water can contribute to the water needs of the nearby community during dry periods. This seeks to embrace an integrated area design approach.
RRR is a European cooperation project funded by Interreg that focuses on feasibility assessments, such as the quantity and quality of water. The goal is to address technological challenges surrounding climate-resilient water hubs. On the other hand, GO-CAWH, initiated by Rijkswaterstaat, specifically focuses on an integrated approach to the water transition, with social innovation at its core. The project builds on previous initiatives from Rijkswaterstaat, including Innova58 and „Ruimte voor de Rivieren“.
THE RESEARCH AREA
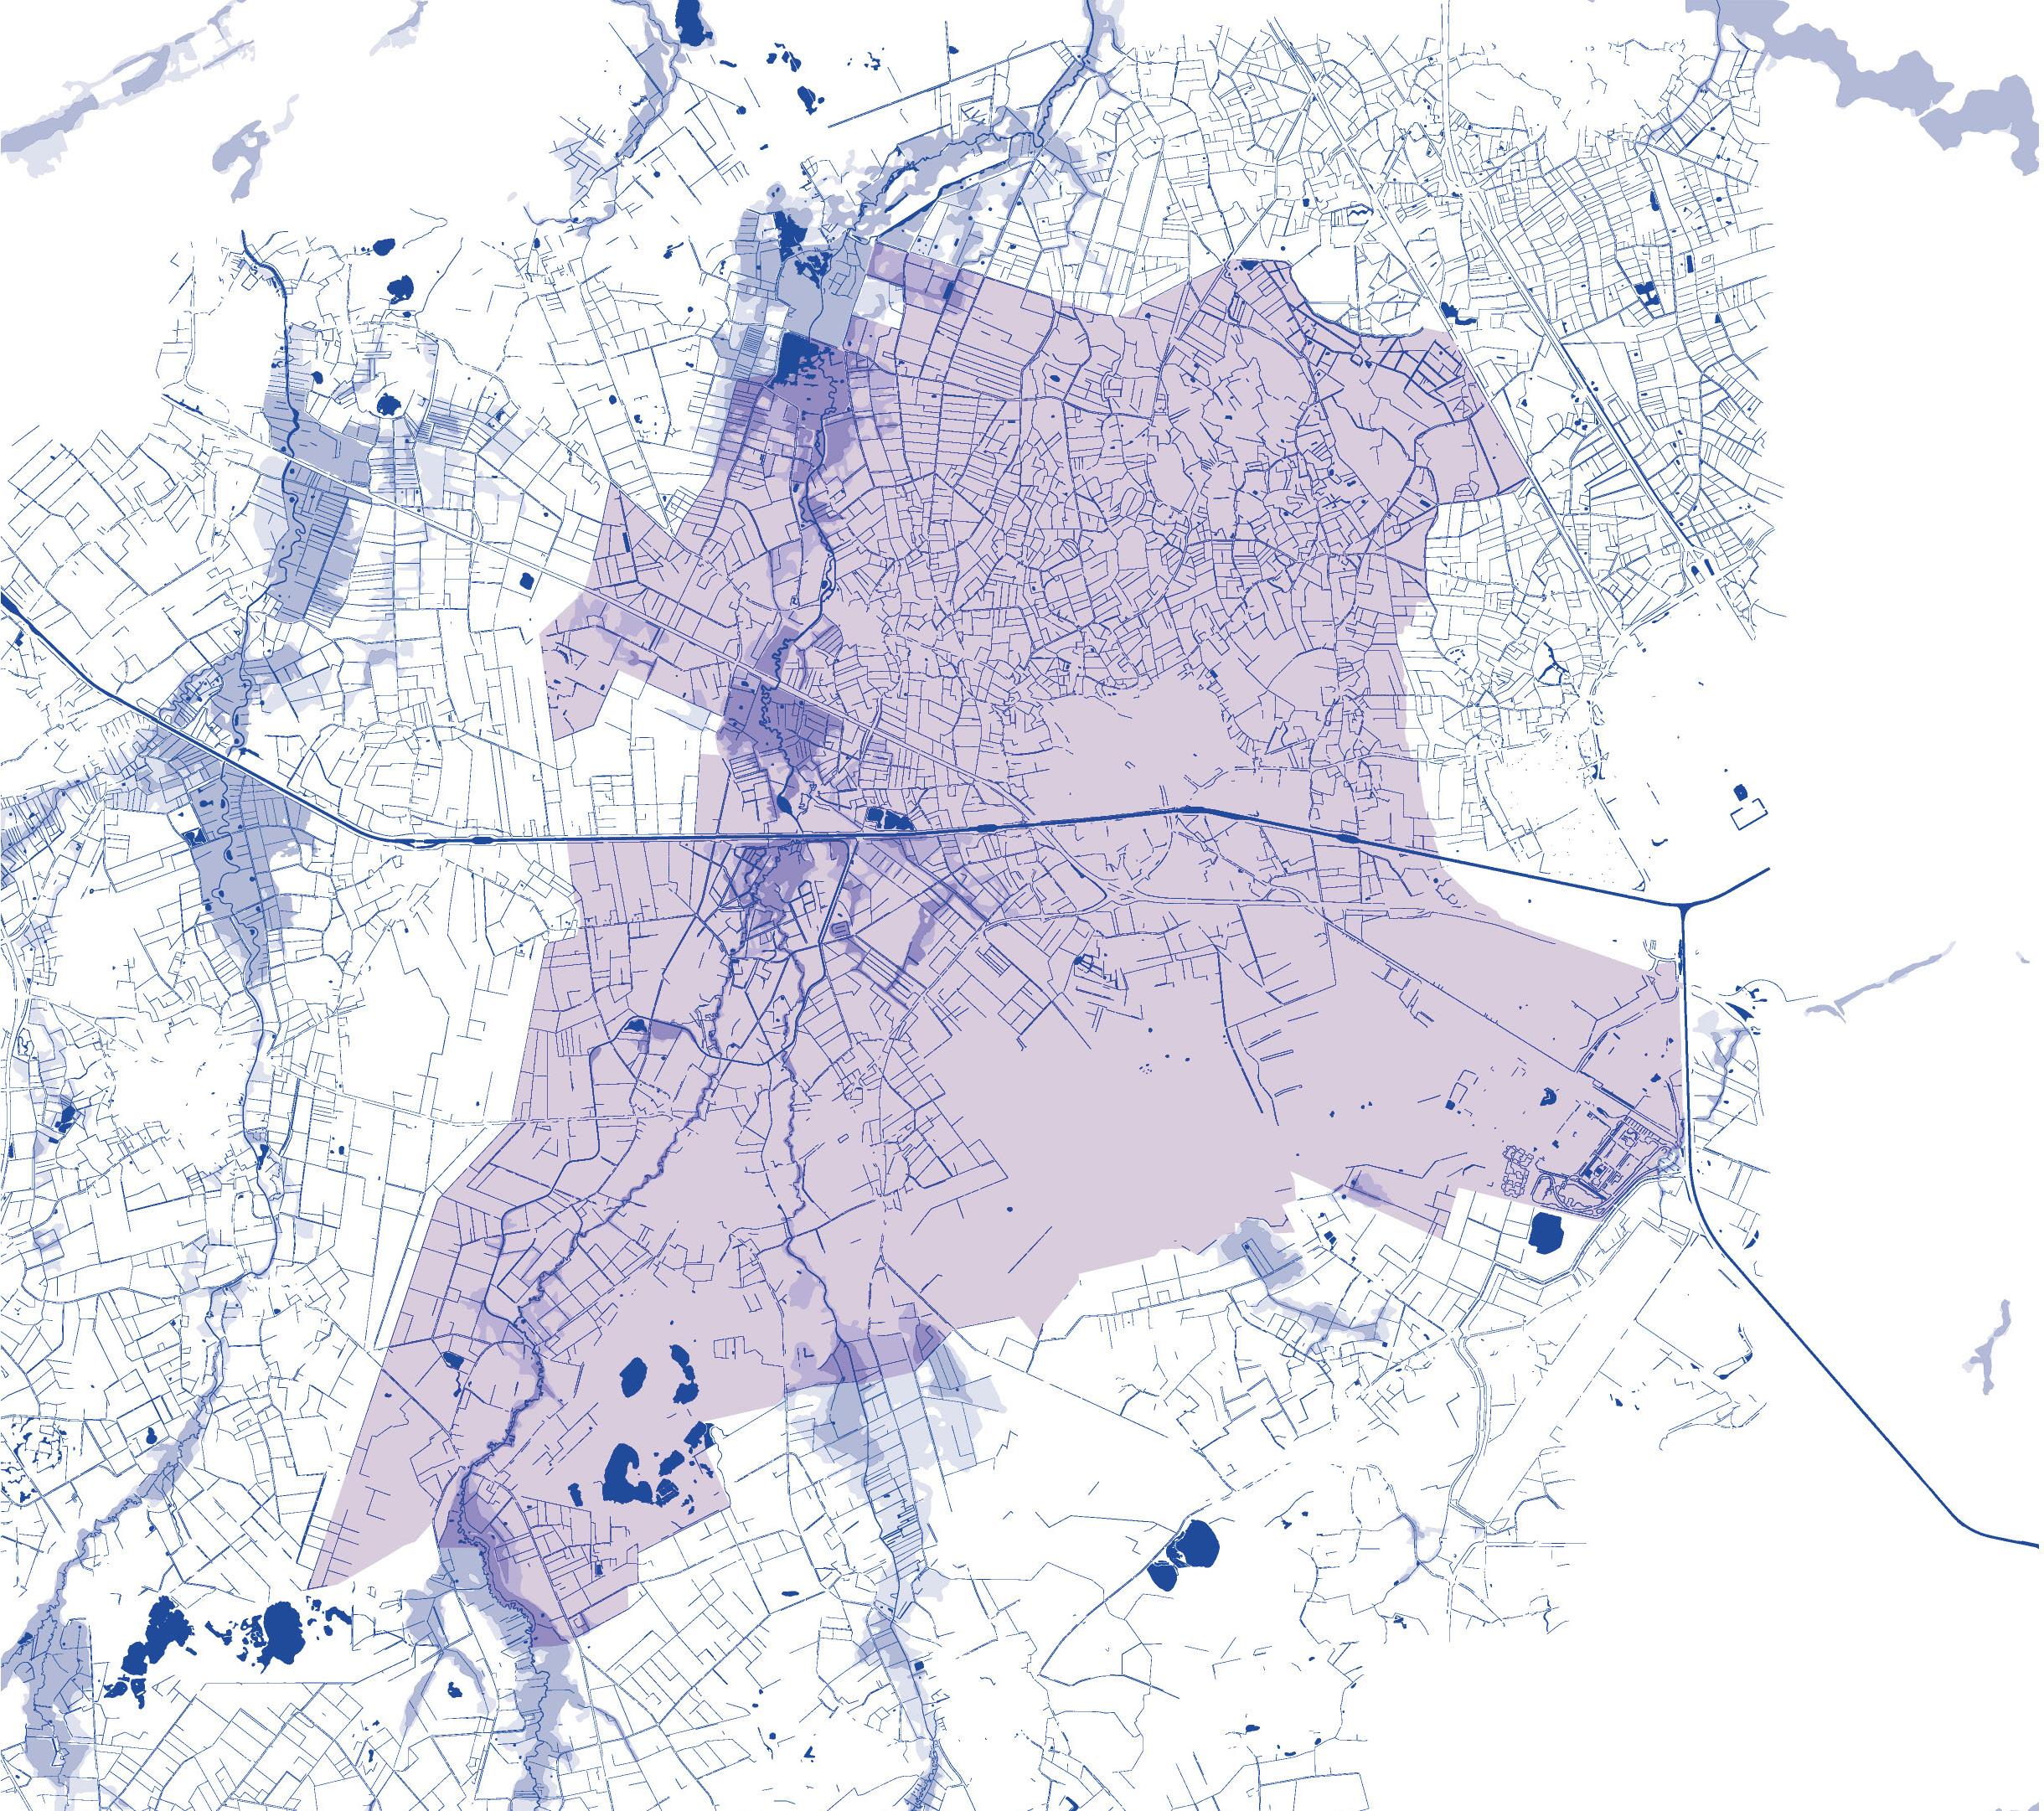
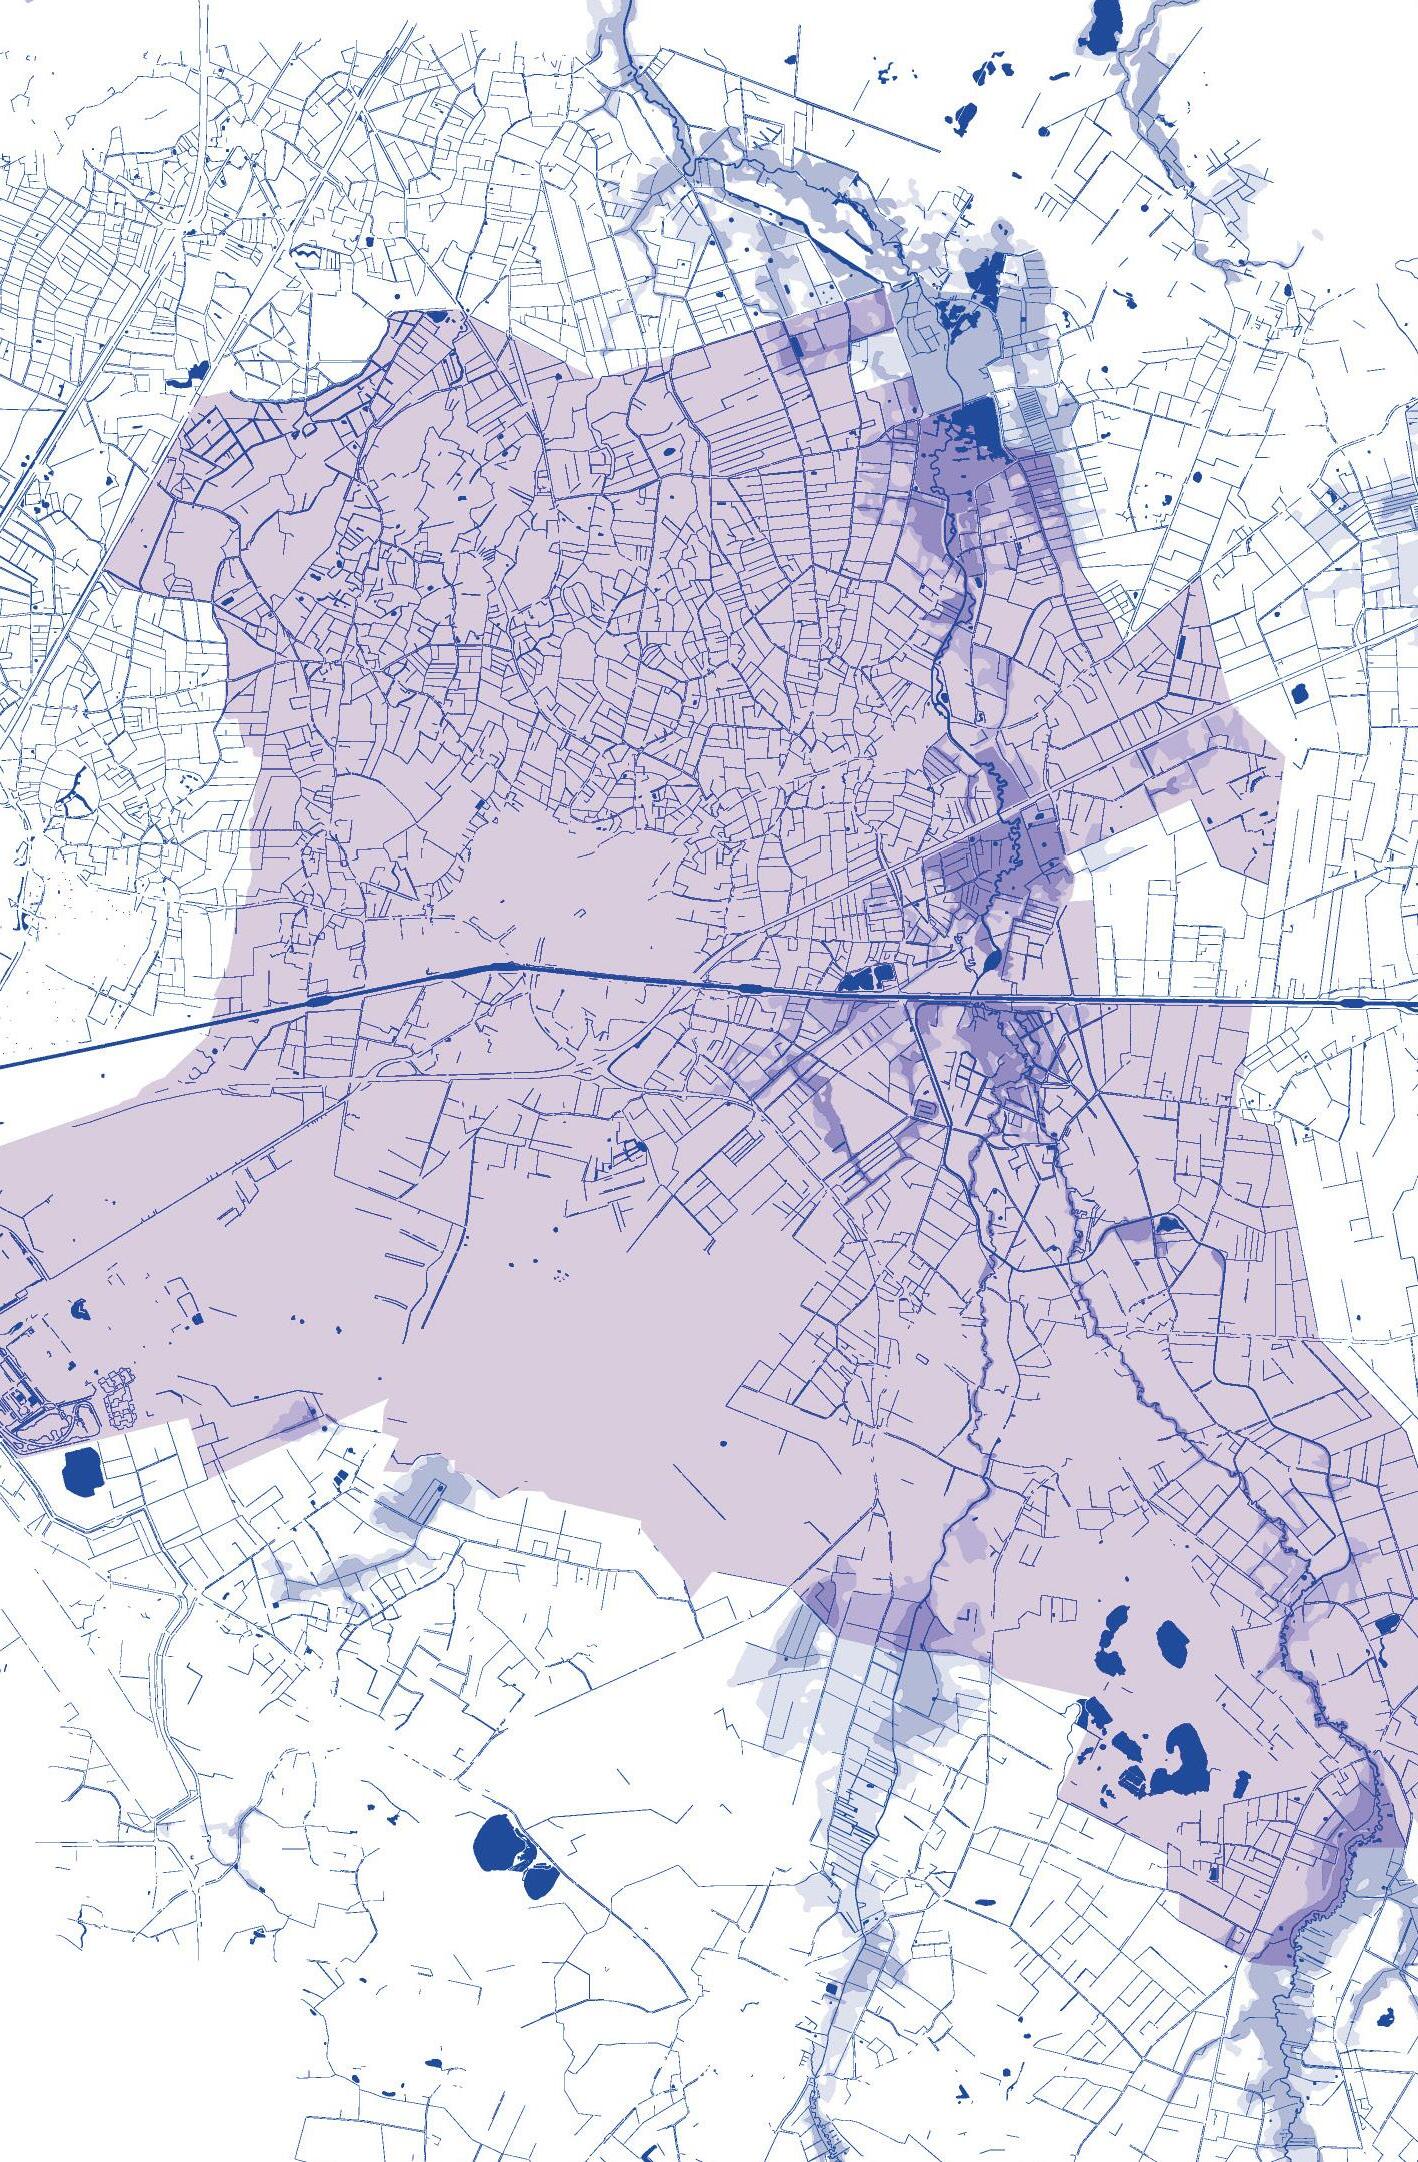
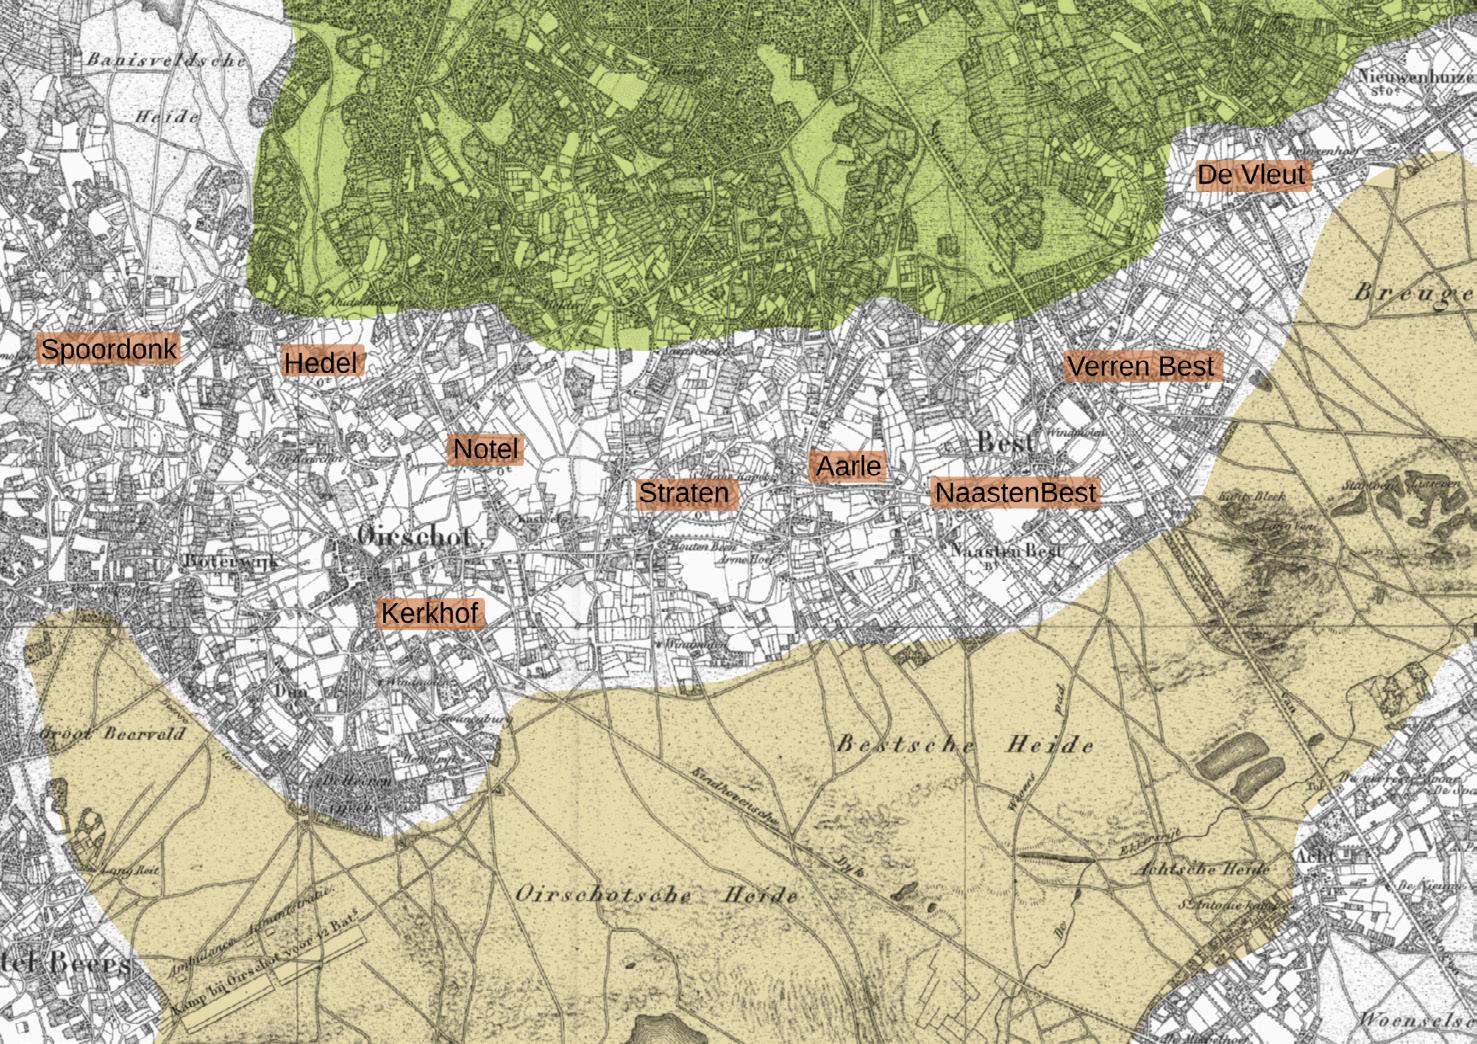
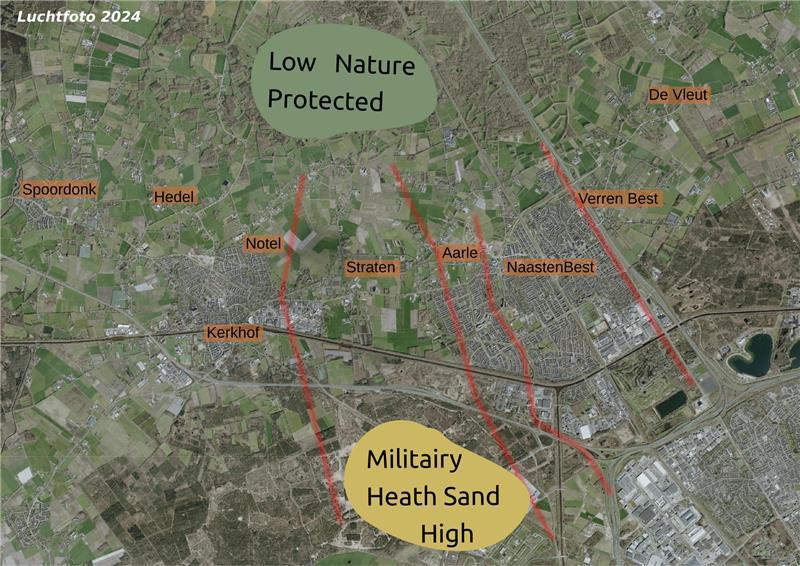
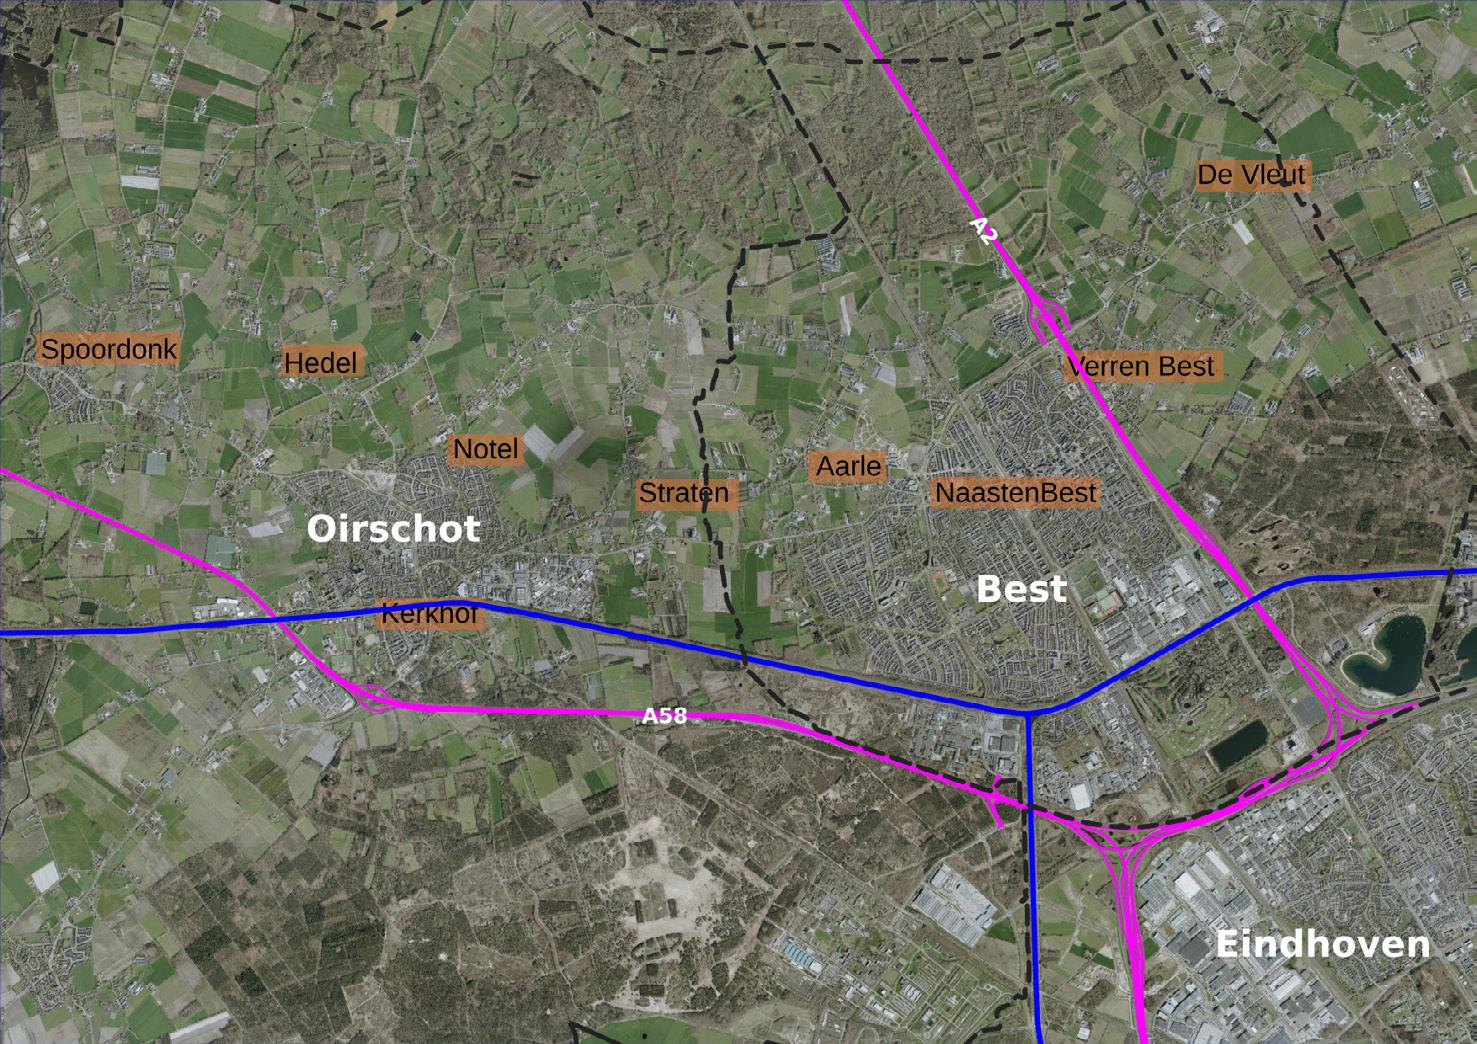
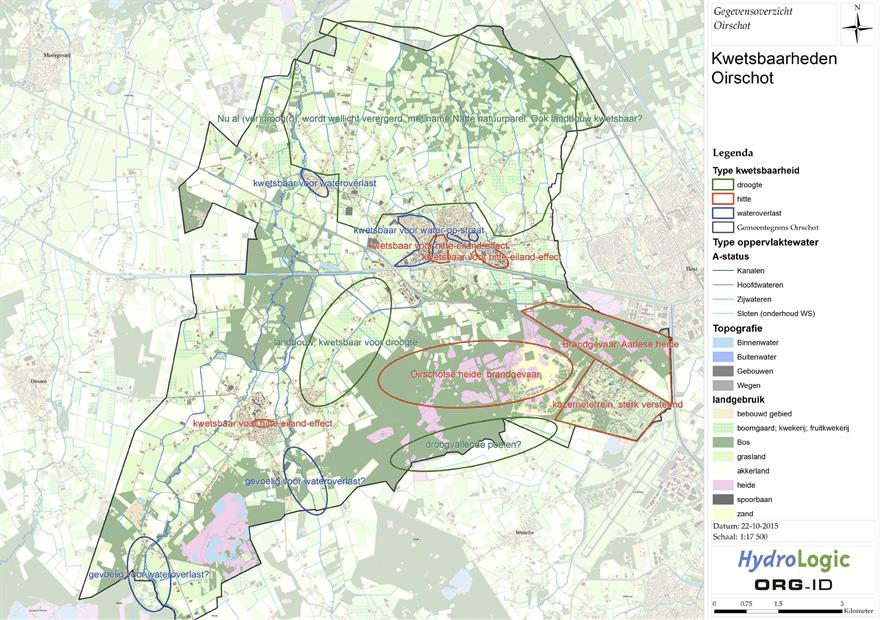
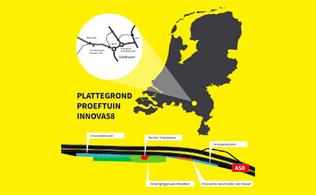
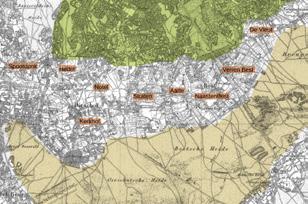
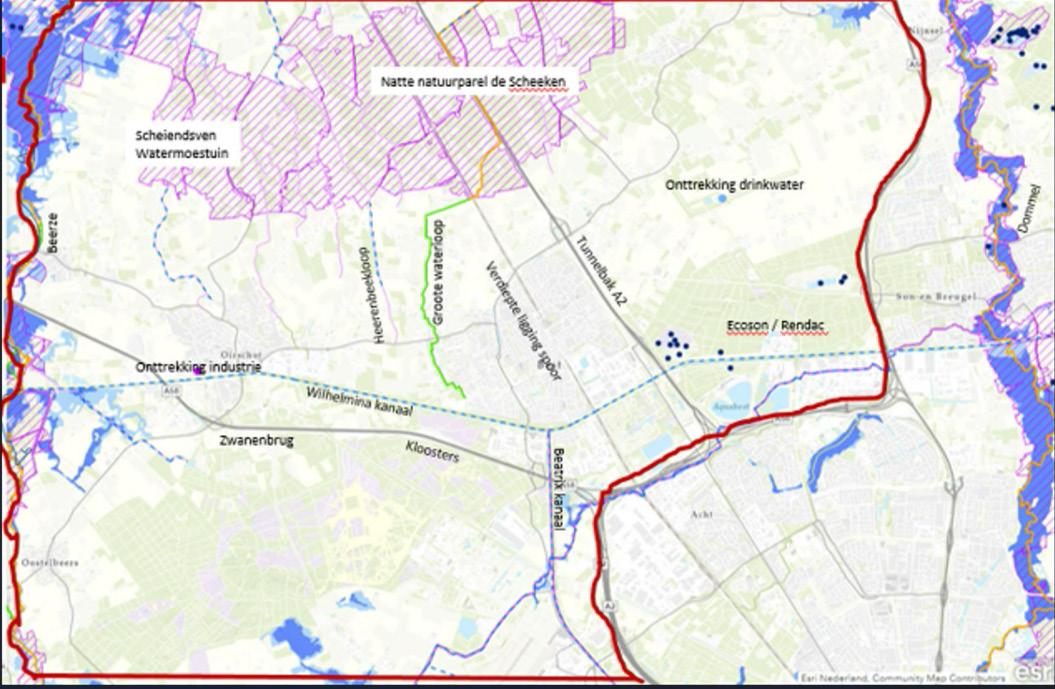
This project focuses specifically on the service area Kloosters, located in Oirschot along the A58 highway. This site was chosen due to previous research conducted in and around the area, the established relationship between our client, Rijkswaterstaat, and the region, as well as its historically integrated approach to land and water management, as evidenced by the herd paths (see Figure 1). However, with the construction of the highway and the canal that traverses the landscape (see Figure 2), the concept of the „herdgang“ (a selfsustaining rural community) has largely disappeared. This change has significantly increased the risk of waterlogging in the area, partly attributable to the highway‘s presence and the impacts of climate change (see Figure 3).
The extended research proposal aims to give the A58 an additional function, in which the water that falls on the highway is collected, filtered, and purified for reuse by water users in the nearby area. This initiative transforms the highway from a mere infrastructure element into a valuable community resource, highlighting the significance of collaborating with the local community during the water transition and redefining the highway‘s role. The research focuses on understanding the shared resources in the area and exploring the various perspectives of community participation in this process.
Figure 1: Historical map of Oirschot and its surroundings. Map created by Niene Boeijen.
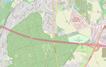
Figure 2: Map of Oirschot and its surroundings showing how the A58 highway and the canal traverse the landscape and the former herd paths. Map created by Niene Boeijen.
Figure 3: Risks and Vulnerabilities of Oirschot in Relation to Drought, Heat, and Waterlogging in 2015. Source: https://klimaatadaptatienederland.nl/. This visualization incorporates various sources, including HydroSHEDS, Natural Earth Data, and the EU Hydro River Network Database from Copernicus. Map created by Niene Boeijen.
FROM A REGIONAL TO AN INTERREGIONAL APPROACH
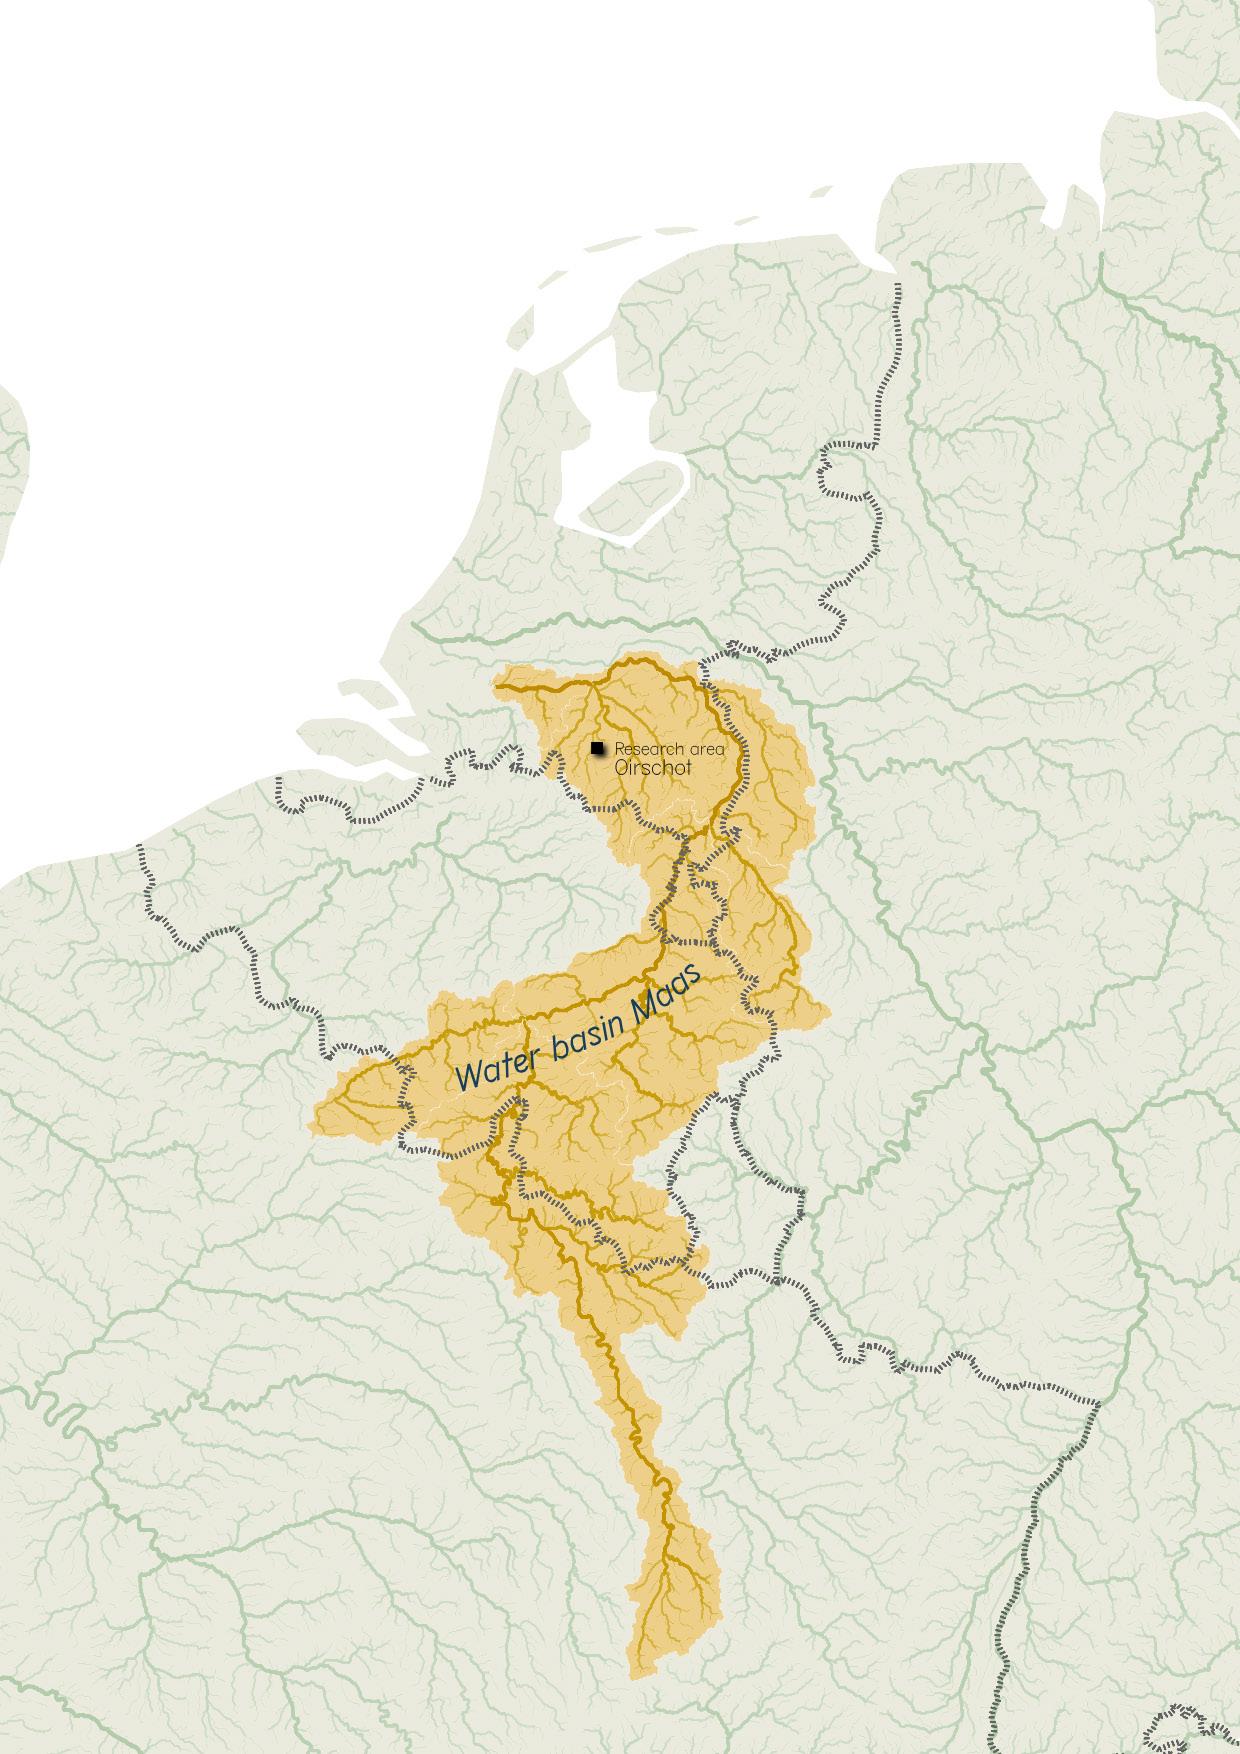
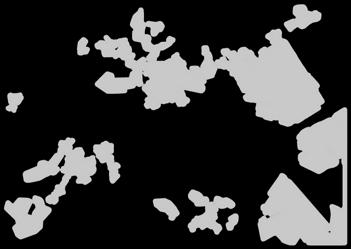
Both initiatives, Rural Road Water Rescue (RRR) and GO-CAWH, aim to establish a foundation for an interregional approach to a water transition where highways take centre stage, spanning five countries with a specific focus on Northwestern Europe. The map in Figure 4 illustrates the importance of an interregional and integrated approach to the water transition. The visualization of the research area shows that Oirschot is situated within the hydrological catchments of the Maas River. This means that Oirschot is connected to a landscape that extends across multiple countries and transcends borders. This connection emphasizes the interaction between various actors and ecosystems within the water management system. Figure 5 provides a clear overview of the water flow networks and aids in understanding the complex dynamics of water systems that connect multiple jurisdictions and communities.
For the GO-CAWH project, Rijkswaterstaat has brought together three parties: the University of Groningen (RUG), Faculty of Spatial Sciences; Coöperatie Kloostersland (CK); and the Design Academy Eindhoven (DAE), Lectorate Design & Social Innovation. RUG examines opportunities for collaboration among governmental actors surrounding Kloosters and the community, focusing on strategies to overcome institutional barriers. Coöperatie Kloostersland is deeply embedded in the local community, providing valuable insights into local challenges, needs, and knowledge. The Design Academy Eindhoven contributes expertise in participatory approaches to transition challenges, particularly in the use and design of maps as tools for inquiry and activation. Together, these three organizations have the essential components to establish the conditions for an integrated approach to designing a water hub.
Figure 4: Visualization of the research area as part of a much broader range of actors when examining the hydrological catchments. Oirschot is located in the Maas River basin, connecting it to a landscape that spans multiple countries and crosses borders. Data based on Hydrosheds Natural Earth and Copernicus EU Hydro. Map created by Niene Boeijen.
Figure 5: Oirschot is situated within the hydrological catchments of the Maas River. The map illustrates the complex dynamics of water systems that connect multiple jurisdictions and communities. Map created by Niene Boeijen.
AREA-ORIENTED PLANNING
The report „Gebiedsgericht werken“ (2022), prepared by Movaris on behalf of Rijkswaterstaat, highlights the importance of area-based working in government-initiated projects. It states that involving stakeholders at an early stage helps to optimize opportunities and minimize surprises. Conducting a stakeholder interest analysis should take place prior to the project phases, particularly in the planning and exploration phases, where there is room for integrating agreements. Rijkswaterstaat is encouraged to adopt an open attitude towards external demands, which can lead to win-win situations. Additionally, it is recommended to strengthen the relationship between the client and the contractor, to use a regional analysis as a basis for project definitions, and to promote the integration of asset and environmental management in project governance. Finally, the authors call for a better balance between culture, structure, and strategy to facilitate more effective learning and collaboration with external partners.
Two years after this report was drafted, the Environmental Act was incorporated into Dutch law, aiming for a significant simplification of environmental law by bundling dozens of laws and hundreds of regulations into one new law. This law seeks to reduce regulations regarding water, air, soil, nature, infrastructure, buildings, and cultural heritage. It is described as the largest legislative change since 1848. An integral part of this is the digital system for the Environmental Act, which makes information about the physical living environment accessible (Rijksoverheid, n.d.).
In our research, we have observed a shift in recent years where the environment and nature are receiving more attention in the decisionmaking processes of government agencies like Rijkswaterstaat. There is currently a great deal of enthusiasm among individuals and project teams in government agencies; however, the implementation of the Environmental Act still leaves much to be desired. There remains considerable uncertainty about how to involve the community and non-humans such as „nature“ in decision-making processes and how government agencies can adopt an open attitude towards an area.
There are many opportunities for participatory designers who are used to working in an embedded way with an area and its communities (Raviv, 2021). However, designers often lack familiarity with regulations and frequently encounter institutional barriers when it concerns scaling up. It would be beneficial if designers could better utilize and expand these rules to facilitate an area-oriented design process. Our research aims to take first steps in that direction.
THE ROLE OF MAPS IN AREAORIENTED PLANNING
In our research, we have studied the significance of visual methods, particularly maps, within area-oriented planning processes. Water imbalance inherently presents a complex issue that encompasses both social and environmental challenges and operates at various scales. Water occupies space, ranging from local areas to regional watersheds and national rivers, and even entire drainage basins covering whole continents.
Maps serve as crucial visual tools in development projects to support communication between residents, stakeholders, and government authorities. They reveal potential obstacles, conflicts, and disagreements. Often, conflicts become apparent through the use of maps, and there are many instances where the map itself becomes a „problem.“
Maps hold a certain power; what is depicted on the map is often perceived as the truth. When what appears on the map does not align with one’s own experiences, interests, or vision, it can be hurtful or frightening. The map and its creator may lose trust, and the map becomes a point of debate or conflict. The process and communication surrounding a map are also critical; if a map is created in advance without the collaboration of all participating actors, it is likely to be scrutinized more critically than if it is produced in agreement with those actors, serving as a form of documentation of consensus (Carton, 2007).
This has led to our exploration of visual methods, specifically how maps can be utilized in design processes within the context of a water transition. Additionally, we investigate whether certain map characteristics or visual methods can contribute to a more inclusive participatory design process.
To study the role of maps in the design process, we employ Linda Carton’s concept of „frames.“ In her 2007 thesis, Carton presents various frames as a lens through which to investigate the „affordances“ of maps in policy-making. These insights allow us to optimize the participatory process by enhancing our understanding of the underlying motivations and reasoning of different stakeholders. Here, we discuss how each „frame“ influences the design process:
ANALYTICAL FRAME:
This framework embodies a rational and data-driven approach to decision-making. In the integrated design process, this translates into the collection and organization of extensive datasets that can be analyzed using Geographic Information Systems (GIS). Within this framework, GIS experts play a crucial role by ensuring accurate and relevant data for the research questions at hand. The analytical framework promotes a clear understanding of the geographical and socio-economic characteristics, leading to evidence-based policy decisions through data.
DESIGN FRAME:
This framework emphasizes creativity and the exploration of possible futures. In participatory design processes, it encourages stakeholders to visualize abstract concepts and alternative scenarios through maps that highlight different possibilities. This framework facilitates the presentation of ideas in an engaging and imaginative manner, fostering dialogue about various options. It recognizes that effective mapping is not only about clarity, but also about inspiring stakeholders towards innovative approaches.
NEGOTIATION FRAME:
This framework is essential for framing the political dimensions of map usage. In the design process, maps function as communication tools and negotiation instruments among various stakeholders, each with their own objectives and worldviews. This framework highlights the role of maps in articulating perceptions, claims, and political agendas. It facilitates discussions on interests and aids in consensus-building, while also illuminating potential conflicts. Involving stakeholders within a negotiation framework promotes a more democratic approach to design by validating different perspectives and encouraging collaboration in decision-making.
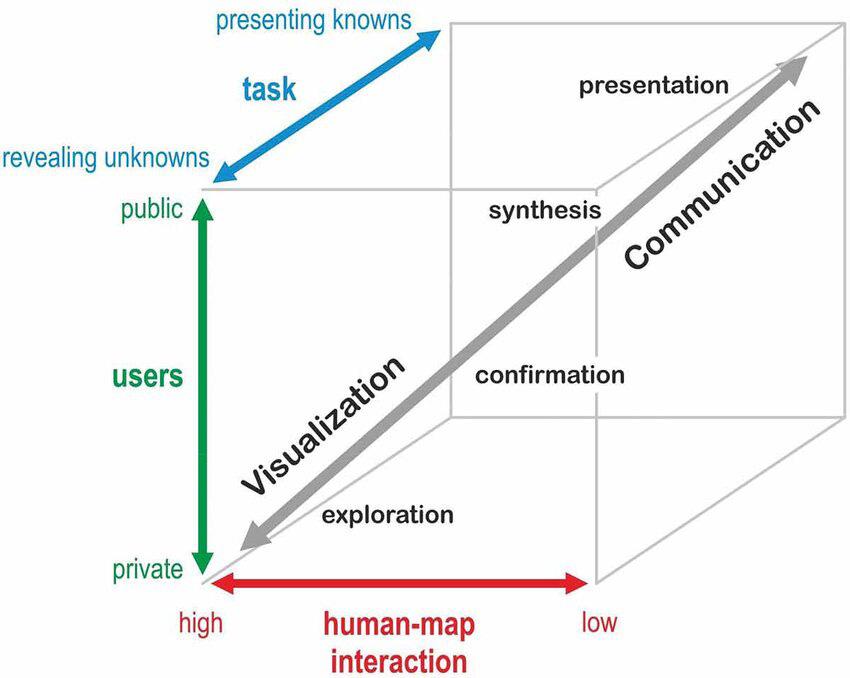
Another model utilized by Niene to analyze maps is Alan MacEachren’s Map Use Cube, which categorizes map interaction along three axes: X (Interactivity), Y (Knowledge), and Z (Audience) (see Figure 6). The core concept is that map usage can be visualized as a three-dimensional framework defined by three continua:
→ From private use (where an individual creates a map for personal needs) to public use (where pre-prepared maps are shared with a broader audience);
→ From exploring the unknown (where the user may seek to discover something „interesting“) to presenting known information (where the user looks for specific spatial data);
→ From high interaction (where the user can extensively manipulate the map, such as modifying a specific map, rapidly switching between available maps, or overlapping and merging them) to low interaction (where the user has limited options to adjust the presentation).
This conceptualization emphasizes the diverse ways in which maps can be utilized based on user needs and contexts (MacEachren, 1994, pp. 6-7).
Throughout the research, Niene analyzed all maps she encountered using the frameworks of Carton and MacEachren. She looked at the dominant framework, the intended dominant perspective (participatory, institutional, or community-oriented), the description, the intended purpose, the owner of the map, the phase in which the map was employed, and sometimes she added a critical note (see Table 1).
In her research, she attempted to determine the framework from which each visual or map encountered was developed, as indicated in the column „intended dominant frame.“ It should be noted that some visuals may have multiple purposes, or it may not always be clear from the context with what intent they were created. The same applies to the „intended dominant perspective.“ These perspectives have been defined by us. She also assigned a value to the visuals based on her own insights.
To create data visualizations or models from the table, it is important to choose fixed values; otherwise, it becomes challenging to compare or translate. Each filled value could be extensively discussed;
therefore, it is essential to view this as a first attempt. For further research, it would be valuable to discuss the categories with multiple individuals and to adjust the values or possibly add additional columns (attributes).
This analysis has informed Niene‘s research and design decisions in creating the participatory maps and the Action Arena Mapping tool. Additionally, Niene was able to provide Rijkswaterstaat with recommendations on how maps and visualizations can be effectively utilized for specific purposes and in a specific phase of the project.
research to analyze levels of interactivity.
Figure 6: Alan MacEachren‘s Map Cube (1994), adapted by Jakob Cyvin, Kristiana Midtaune, and Jan Rød (2022). This map cube was used in our
IMAGE
INTENDED DOMINANT FRAME
Negotiation
INTENDED DOMINANT PERSPECTIVE
Participatory
TITLE
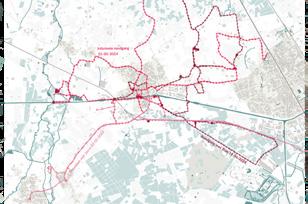
Personal collected tracks and POI
Participatory
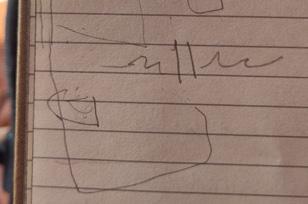
Sketch by Mrs O about childhood farm and the location of wild Orchids
DESCRIPTION
Institutional
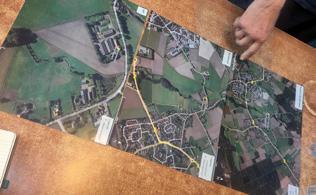
Personal maps of biological goat farmer
Collected GPS tracks during field visits, including poi, photographs and sound recordings on location. A sketch contains the farm where she grew up: The house, location of the field, forest and the route they walked. Indicating the location of Wild Orchids that used to grow there.
Maps printed by the farmer himself to help explain his farm, fields and location in the landscape to visitors. 3 own defined scales: Yard, Farm plot and Between the villages.
INNOVA58 project location of Rijkswaterstaat
Several visuals and location maps of the Innova58 project.
Institutional
Digital twin praatplaat - RWS
Participatory
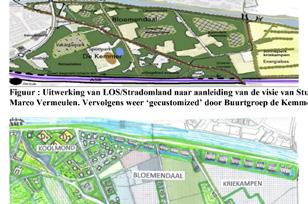
Gebiedsvisie 2020-2030 de Kemmer
Two designs, old and new. Visual for communicating about a digital twin which is in development for the Innova58 location.
Spatial plans developed by inhabitants of the Kemmer. Plans were not accepted. 95 pages plans with maps and visuals.
Historical map showing herdgang communities
Location of the historical communties (herdgangen) of Oirschot. From historical and archeological research in Aarle and Best.
Workshop delineating study area
OSM based background map on study ara , with „game“ rules to place the approaches of the 3 perspectives on the map with stickers and rope. Intended design for the background map is kept simple, with an emphasis on water related features and infrastructure for navigational purposes.
INTENDED PURPOSE
OWNER/CREATOR
Explore the study area and visualise all the visited locations and points of interest that spark some kind of interest or relevance to a water related problem or solution.
DAE - Niene Boeijen. Collected and created with the OSMand app
Complementary visuals for explaining the location and inherent workings of a biological goat farm within the context of the landscape.
Drawn by Mrs O on the street in a notebook
@1. Mai 2024
Exploration Identification Exchange
Shows clearly the area was visited by car, and therefore a singular point of view.
Show research location to interested parties and project collaborators.
By farmer himself, source: Google Earth
May 2024
Communicate to stakeholders and local communities (?) that a digital twin is being developed, wherein different water related solutions can be visualised and explored. Visual is supposed to be shown on exhibition at the Kloostersplaats pavilion. x
Rijkswaterstaat
Explain the historical context of the study area to stakeholders and project owners.
Created by Joost Fluitsma in opdracht van Rijkswaterstaat
Unknown, around 2023 x x 2023
Buurtgroep de Kemmer. C Ouwekerk
Intended map design for the background map is kept simple, with an emphasis on water related features and infrastructure for navigational purposes. To support the workshop purposes of locating water related problems, solutions and opportunities in the 3 perspectives.
From: Tussen Aarleseweg en Broekstraat with own adaptation by Niene Boeijen
2017 with adaptations in 2024
Exploration Identification Exchange
Exploration Exchange
Exchange Implementation
Exchange Implementation
Design
Identification
June 2024
Created by Niene Boeijen DAE
Identification
INTENDED DOMINANT FRAME
INTENDED DOMINANT PERSPECTIVE
TITLE DESCRIPTION
Developed map for exploratory research in Oirschot
GIS maps early stage of research
Simple overview map of Oirschot showing only the places, names and simple infrastructure elements. Highlighting the canal and highway in the center of the map. Used in field work to get participants to draw on the printed paper.
Set of multiple maps, showing different aspects of the municipality of Orischot. About demographics, natural aspects and water related data. Looking for stakeholders and interesting locations next to the canal. Also showing several interesting design proposals.
Toeristische kaart VVV in oirschot
A touristic map, with sketched on top of it by the VVV informant ( young local male) telling about nature and interesting spots to water related topics. For example, the canal new bridge, the not used harbour, which nature reserves are used by which towns (communities)
Use Case Description Proposal of study sites INTEREG project
Map sketch of Stan about Straten/Oirschot and Kloosters
Study area descriptions for workshops, including a OSM background map of a specific location. Usually low scale highway location. Sketch by Stan, showing the community Straten and how the canal and the highway cut through the historical perspective of the community.
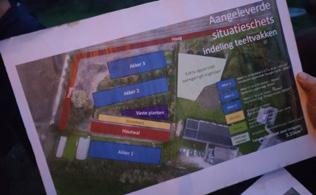
Schematic layout study area Kloosters and Innova58
Viuals from RWS explaining the location of Kloosters and the surroundings. Ownership, land use and historical context of prominent features/communities.
Actor mapping
Situatieschetsen Permacultuur tuin
Several self made maps showing the situation of the permaculture garden in development. Including watering system, design of the fields. Simple made map, no real mapping skills. (guess made with ppp on top of a aerial image of google)
Actor mapping done by Lucas
INTENDED PURPOSE OWNER/CREATOR DATE
Simple map showing the research area without distraction, so participants can visually talk about their water related stories.
Identifying stakeholders in the research area.
Created by Niene Boeijen DAE
The map intended for touristic information was here used as a explanatory tool to visually enforce the stories told. Locations where pinpointed to communicate what could be interesting. Which is compliant with a touristic map, which is usually used to highlight interesting aspects for a visitor with no background information about the area.
Getting all use cased defined and thinking about their scope and involved stakeholders, communities and spatial area.
Lucas DAE
DESIGN PHASE CRITICAL NOTE
Exploration
Identification Exchange
Did not work as intended. Map detail was not sufficient to recognise the surroundings. Map scale differs per story. Maybe a more interactive map, which is quickly adapted to once personal experiences might work better. Also the starting question was not well defined
Exploration
Identification
Exploration
Identification
DAE and RWS
Communicate a historical story about Straten and how the canal and the highway cut through this historic community.
Explain how the location of the resting place is interesting to the surrounding landscape. Explain the historical context and global development of the surrounings. With a focus on the location Kloostersplaats.
Stan RWS and local inhabitant
Identification
Exploration
Exploration Design
VVV Oirschot
THE PERCEPTION OF BORDERS
Places and borders are intertwined, with borders also serving as metaphorical constructs. They can represent psychological barriers or limitations that influence the inclusion of certain areas. The field research has helped us gain a better understanding of the perceptions of locations within this area.
Historically, the region has experienced various civilizations, from Roman times to the present. There are archaeological findings of Roman settlements and influences from diverse agricultural periods, as well as administrative boundaries that are still palpable in current communities, structures, and thought patterns. Our field research and the interviews conducted indicate, for example, that residents of Straten have little connection with residents of Aarle, despite the absence of a clear physical boundary between the two places.
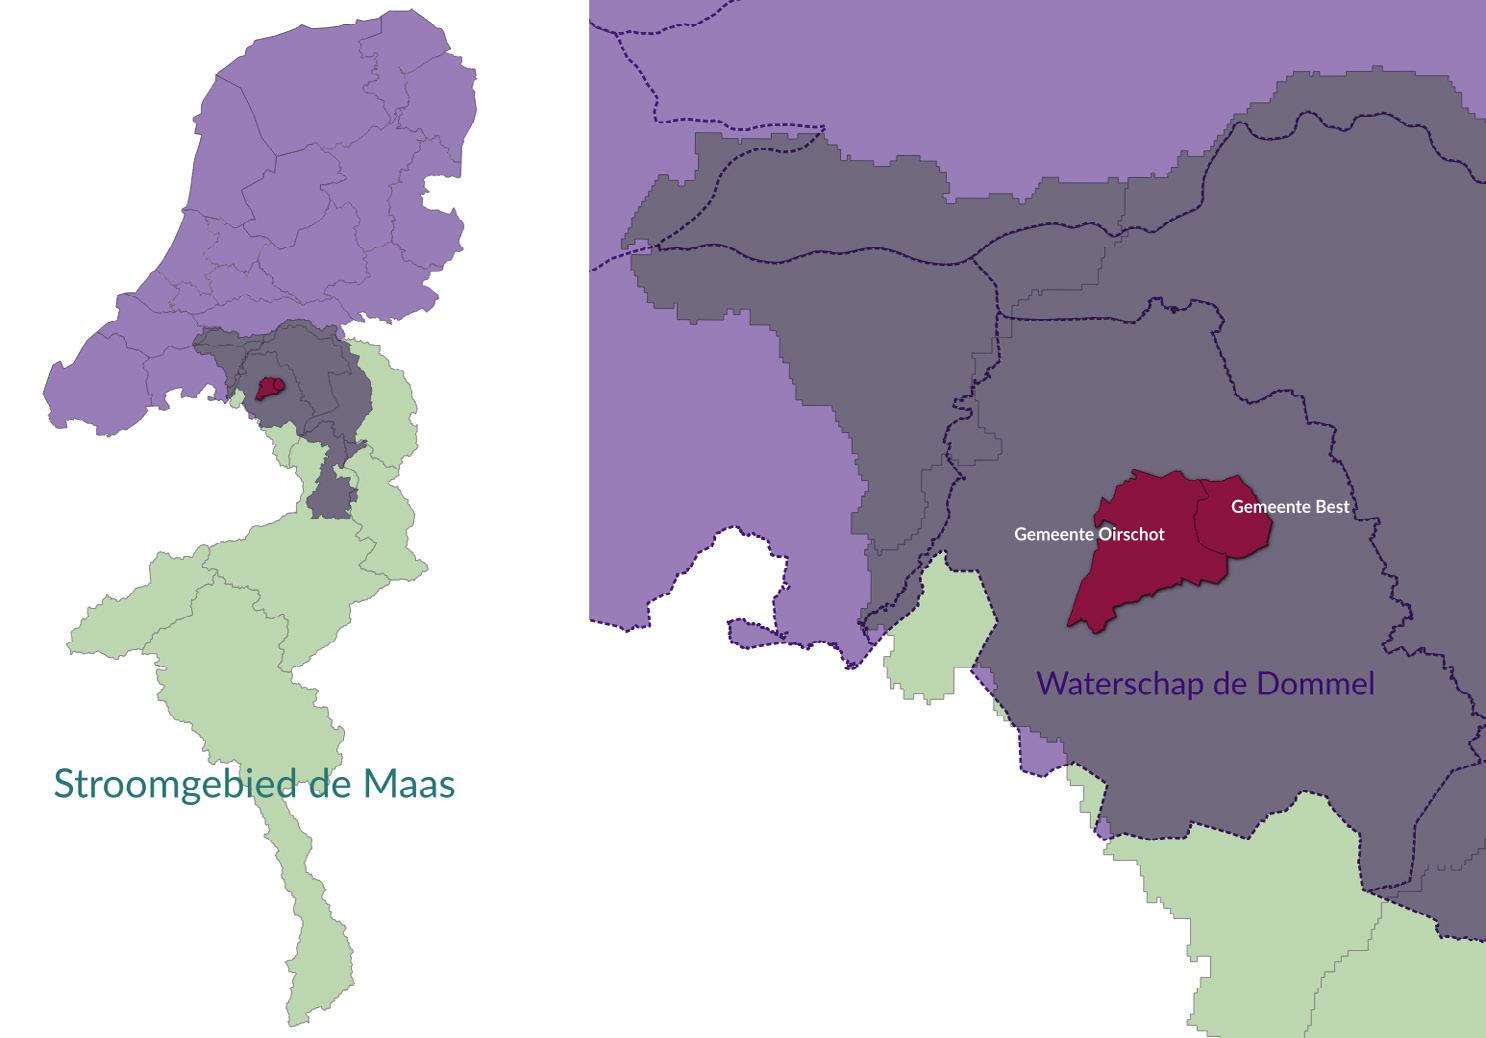
While the focus of this project lies on the A58 and the Wilhelmina Canal, the participatory perspective examines different scales and timeframes. This includes the local communities living along the canal, the entire municipality of Oirschot, and potentially extending to the municipality of Best and possibly Eindhoven. All these areas fall under the jurisdiction of the Dommel water authority. On a broader scale, this area is part of the Maas River basin, which spans multiple provinces and countries in Europe.
We have found that the local perspective and institutional perspective focus on areas that are more narrowly defined when viewed through a participatory lens. For instance, the local perspective focuses on the area from Kloosters to De Beerze, including Oostelbeers and Middelbeers. Although this may not make hydrological sense, it incorporates the residences of boundary spanners in the area and aligns with relevant municipal boundaries. Another boundary spanner focuses on Straten, influenced by their own history and neighborhood, while Aarle, despite its historical and topographical significance, is excluded. From a local perspective there seem to be arbirtrary reasons, often through own preferences, regareding what to include.
Also from an institutional perspective, it is often unclear where exactly the border should be drawn to determine what falls within the research area. In an interview with hydrologists from a company commissioned by the Dommel water authority (November 2023), the researchers presented a map outlining the limits of their study area, which focused on stakeholders involved in water exchange. When we inquired about the rationale behind these specific boundaries, it became evident that there was no clear criterion for determining
where the line was drawn; in fact, the boundary appeared to coincide with the edge of the computer screen (see Figure 7).
This ambiguity regarding area borders was repeatedly encountered in our research, including during the participatory mapping sessions we conducted with international partners in Lille and Karlsruhe. In preparation for the workshop in Lille, we asked the partners to define the borders of their research area using coordinates. This proved to be an impossible task, as it became clear that the area boundary depended on the perspective of the person we had asked, and each case contained multiple perspectives. These insights were extremely useful for our research, particularly in later understanding why the perception of borders is especially relevant from a participatory perspective.
Figure 7: In an interview with hydrologists from a company, the researchers displayed a map on which they had delineated the boundaries of their research area. The screenshot was taken during the conversation by Naomi Bueno de Mesquita.
PHASE 1: EXPLORATORY RESEARCH
In the exploratory phase, we correlated qualitative data with quantitative data and „hard data“ with „soft data“ (perceptions, experiences, etc.) in order to obtain a rich understanding of the area and the actors within it. Field research was conducted, and maps and visualizations were created using historical data, GIS data, open data, and other sources. This „mixed methods“ approach, often employed in design research, provides a broad range of insights about the area and highlights aspects that may be important to consider in later phases when incoporating other perspectives.
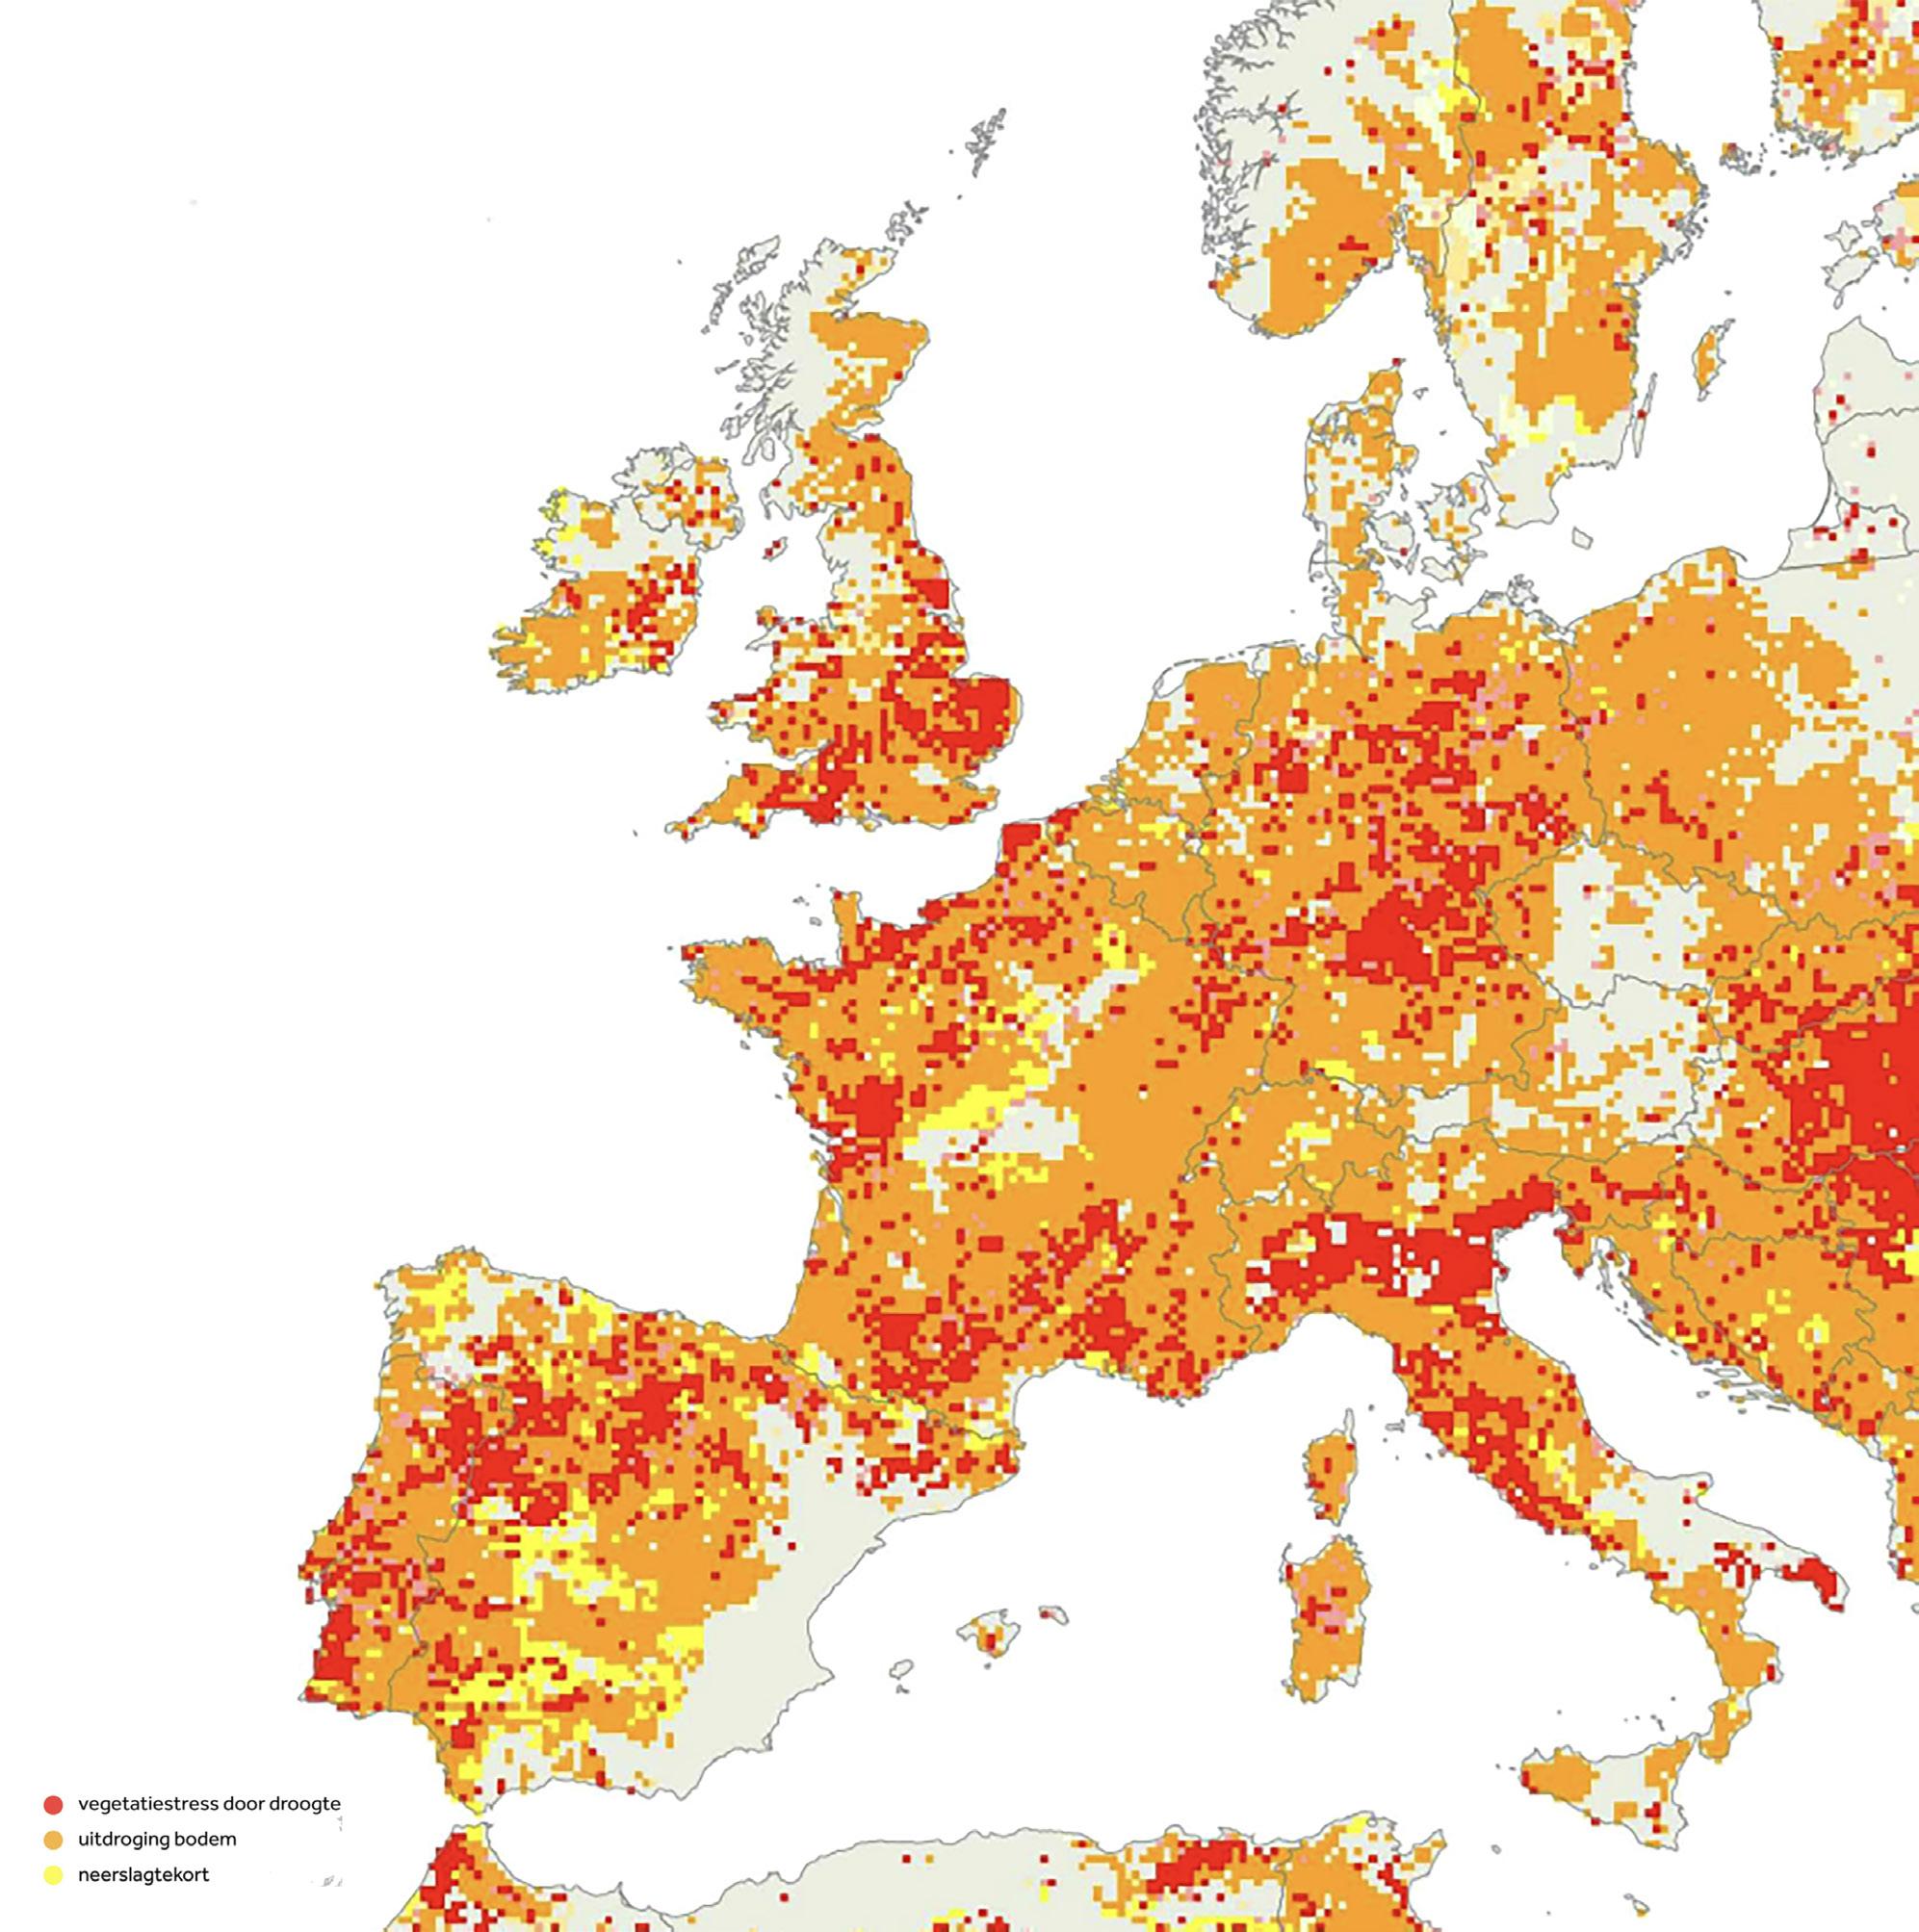
Figure 8: Drought Warning in Europe, July 21, 2022. Source: EDO European Drought Observatory.
Watergebruik in Nederland in 2021 (mln m )
Oppervlaktewater
Oppervlaktewater zoet
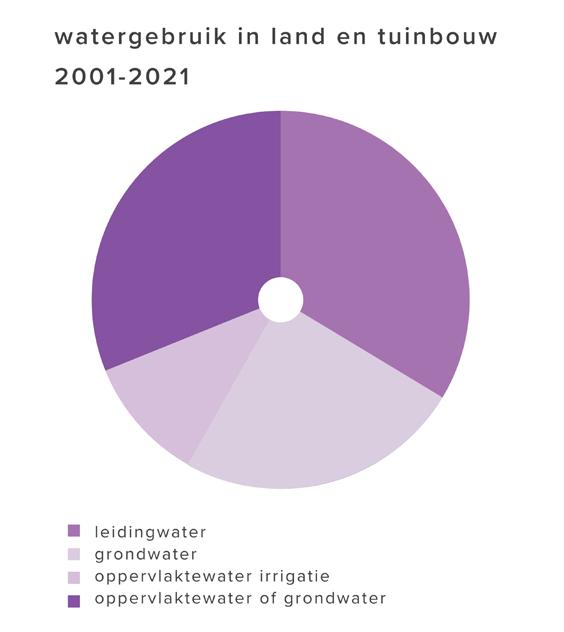
Figure 9: Water Consumption in the Netherlands in 2021. Source: Central Bureau of Statistics.
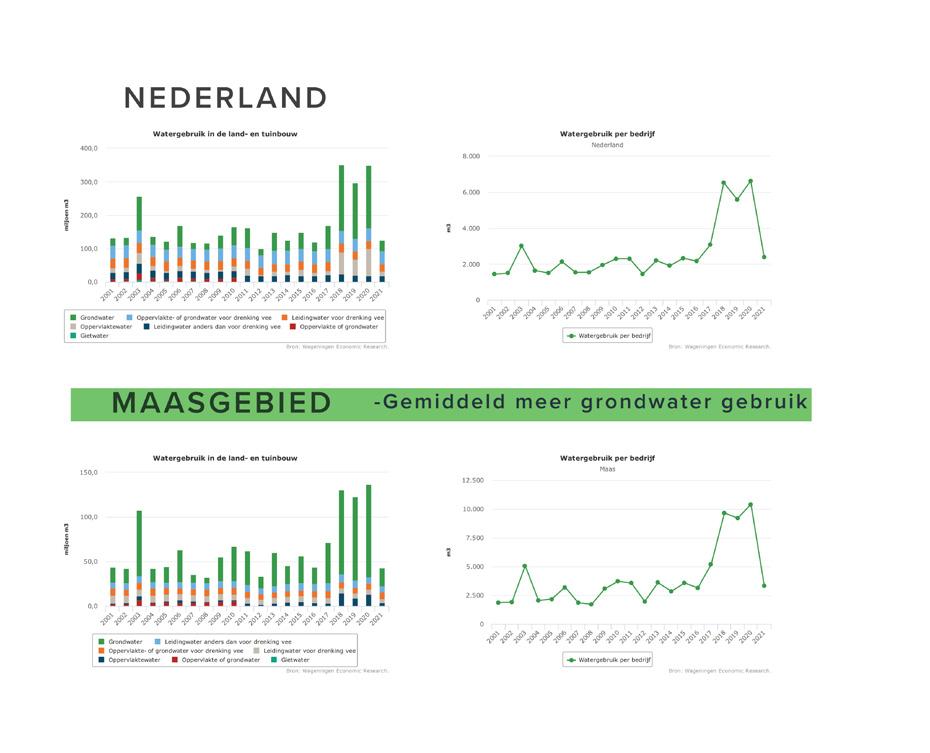
Figure 10: Water Consumption in Agriculture and Horticulture in the Netherlands in 2021. Source: Wageningen Economic Research.
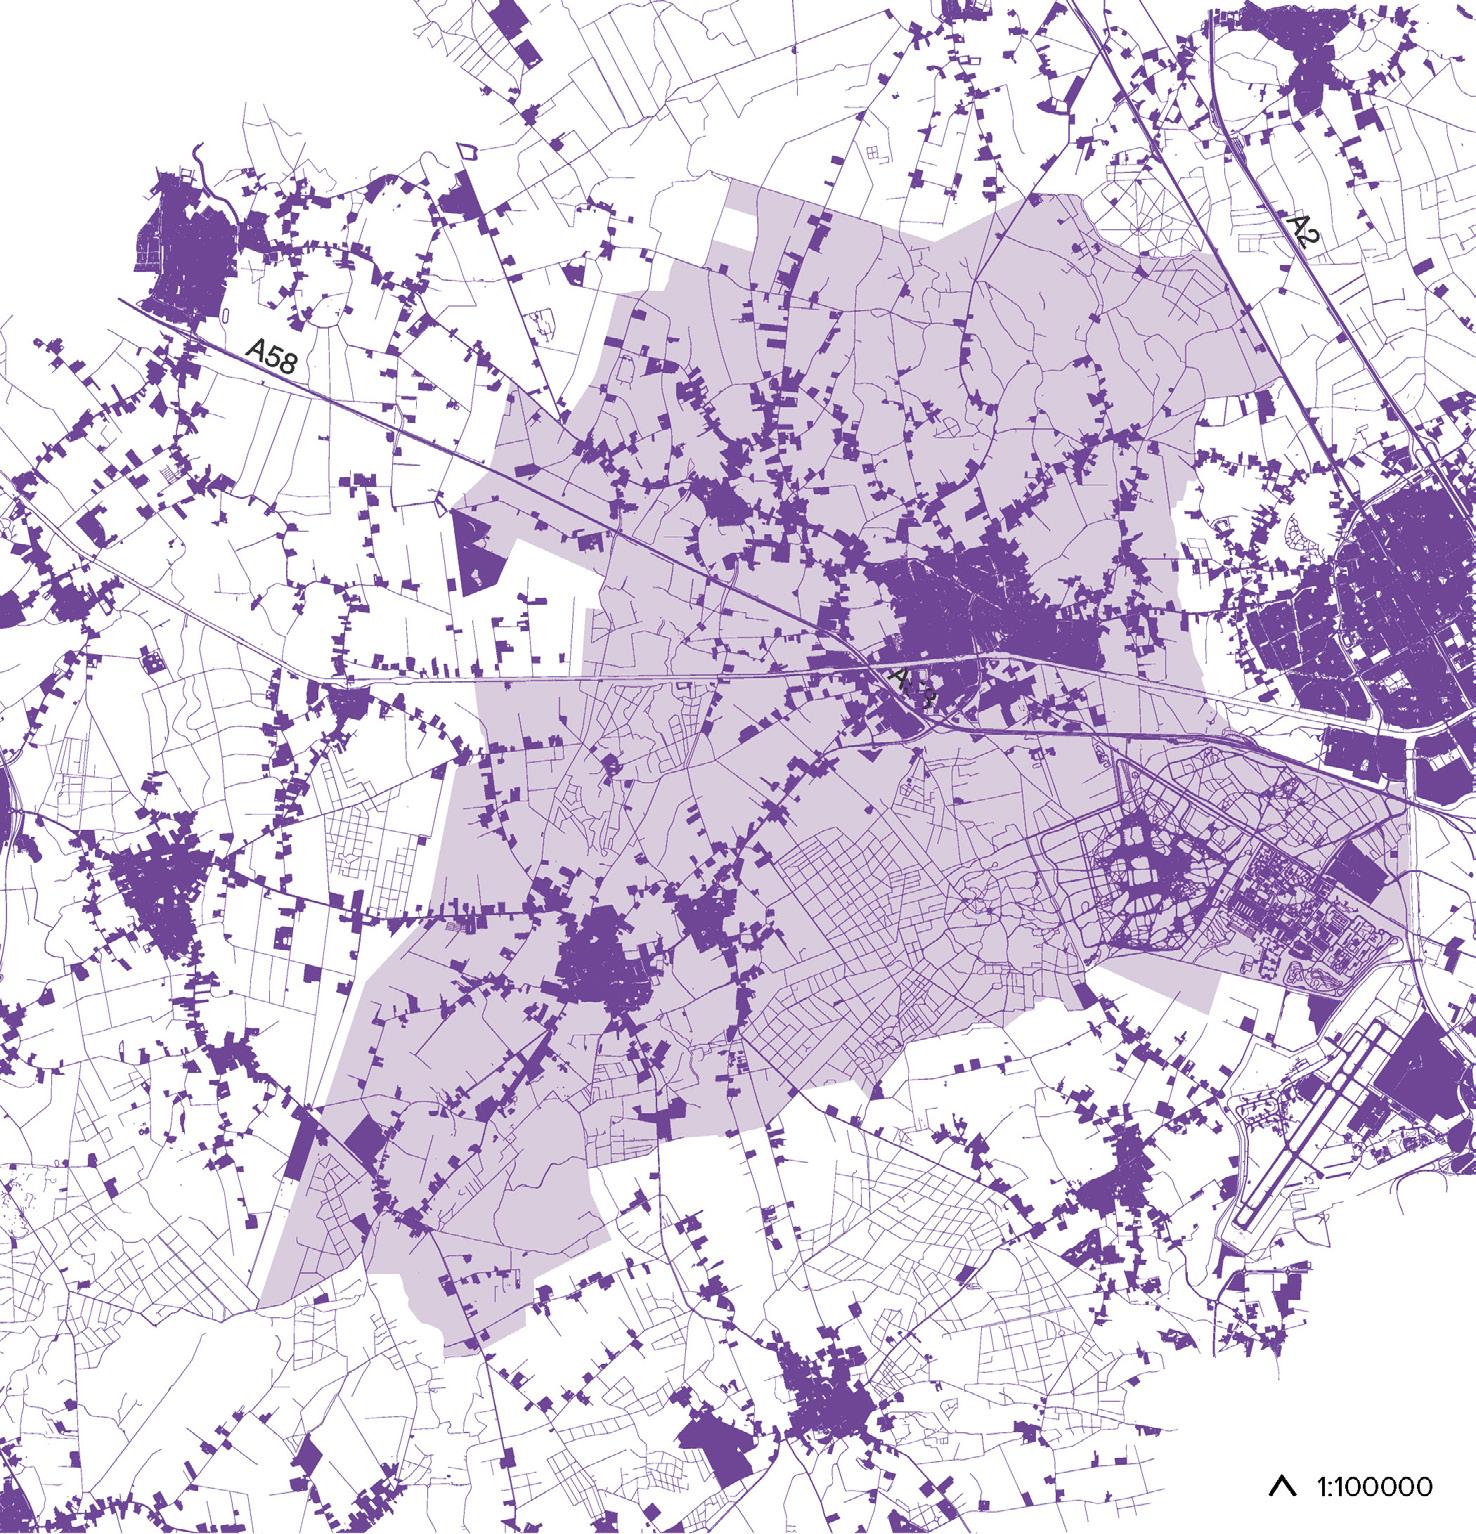
The map in Figure 11 shows the hard infrastructure (pavement, buildings, roads, supporting built elements) of the research area.
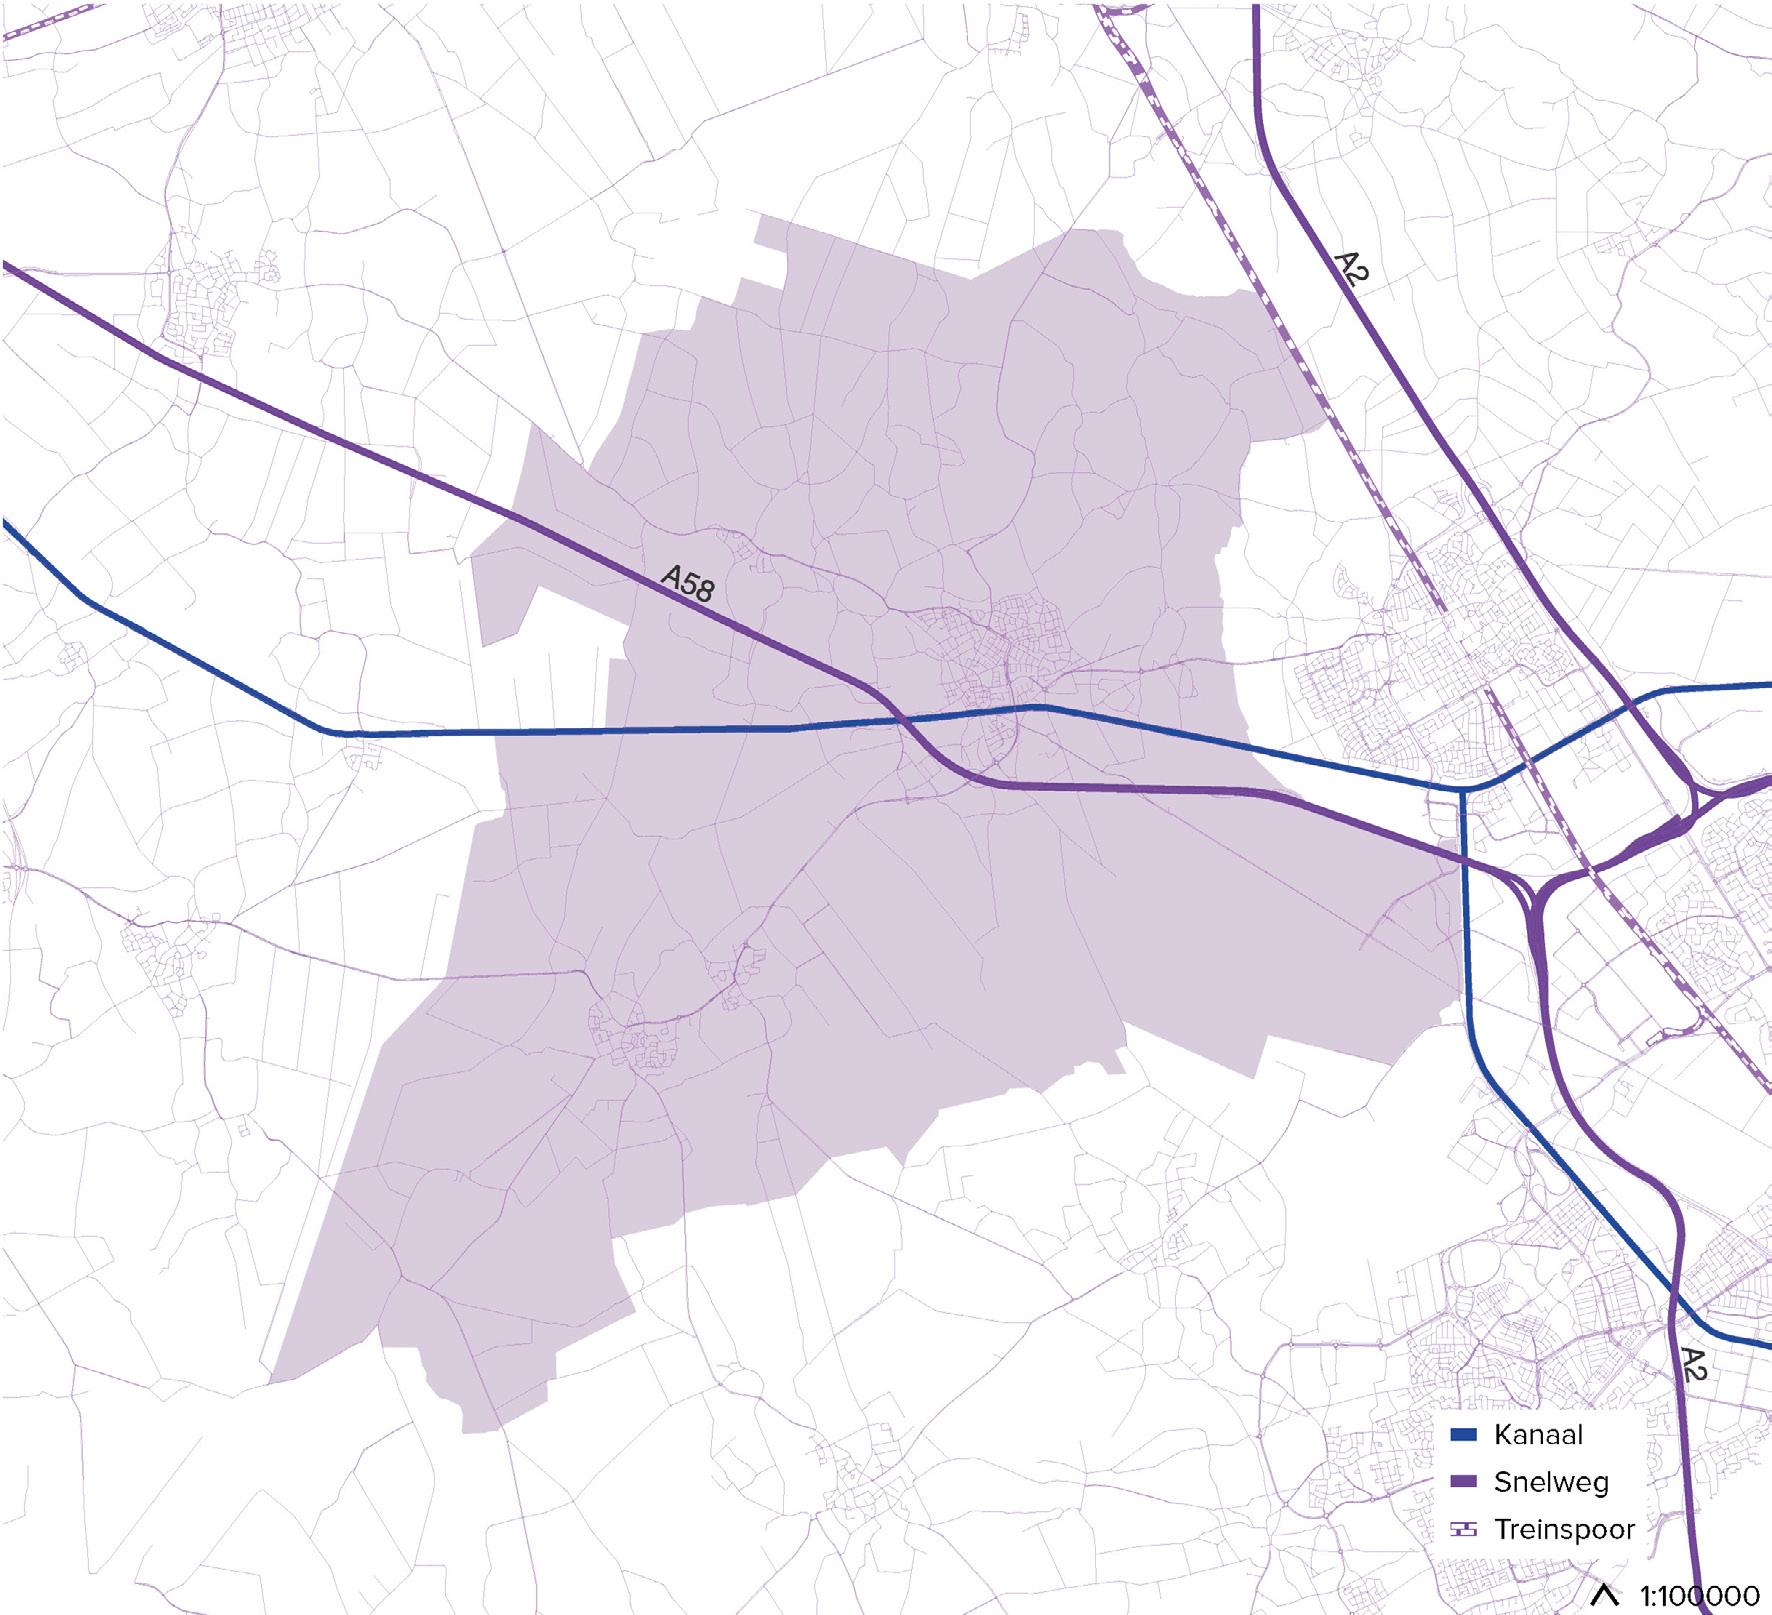
The map in Figure 12 illustrates the main axes that traverse the landscape: the highway, the canal, and the railway.
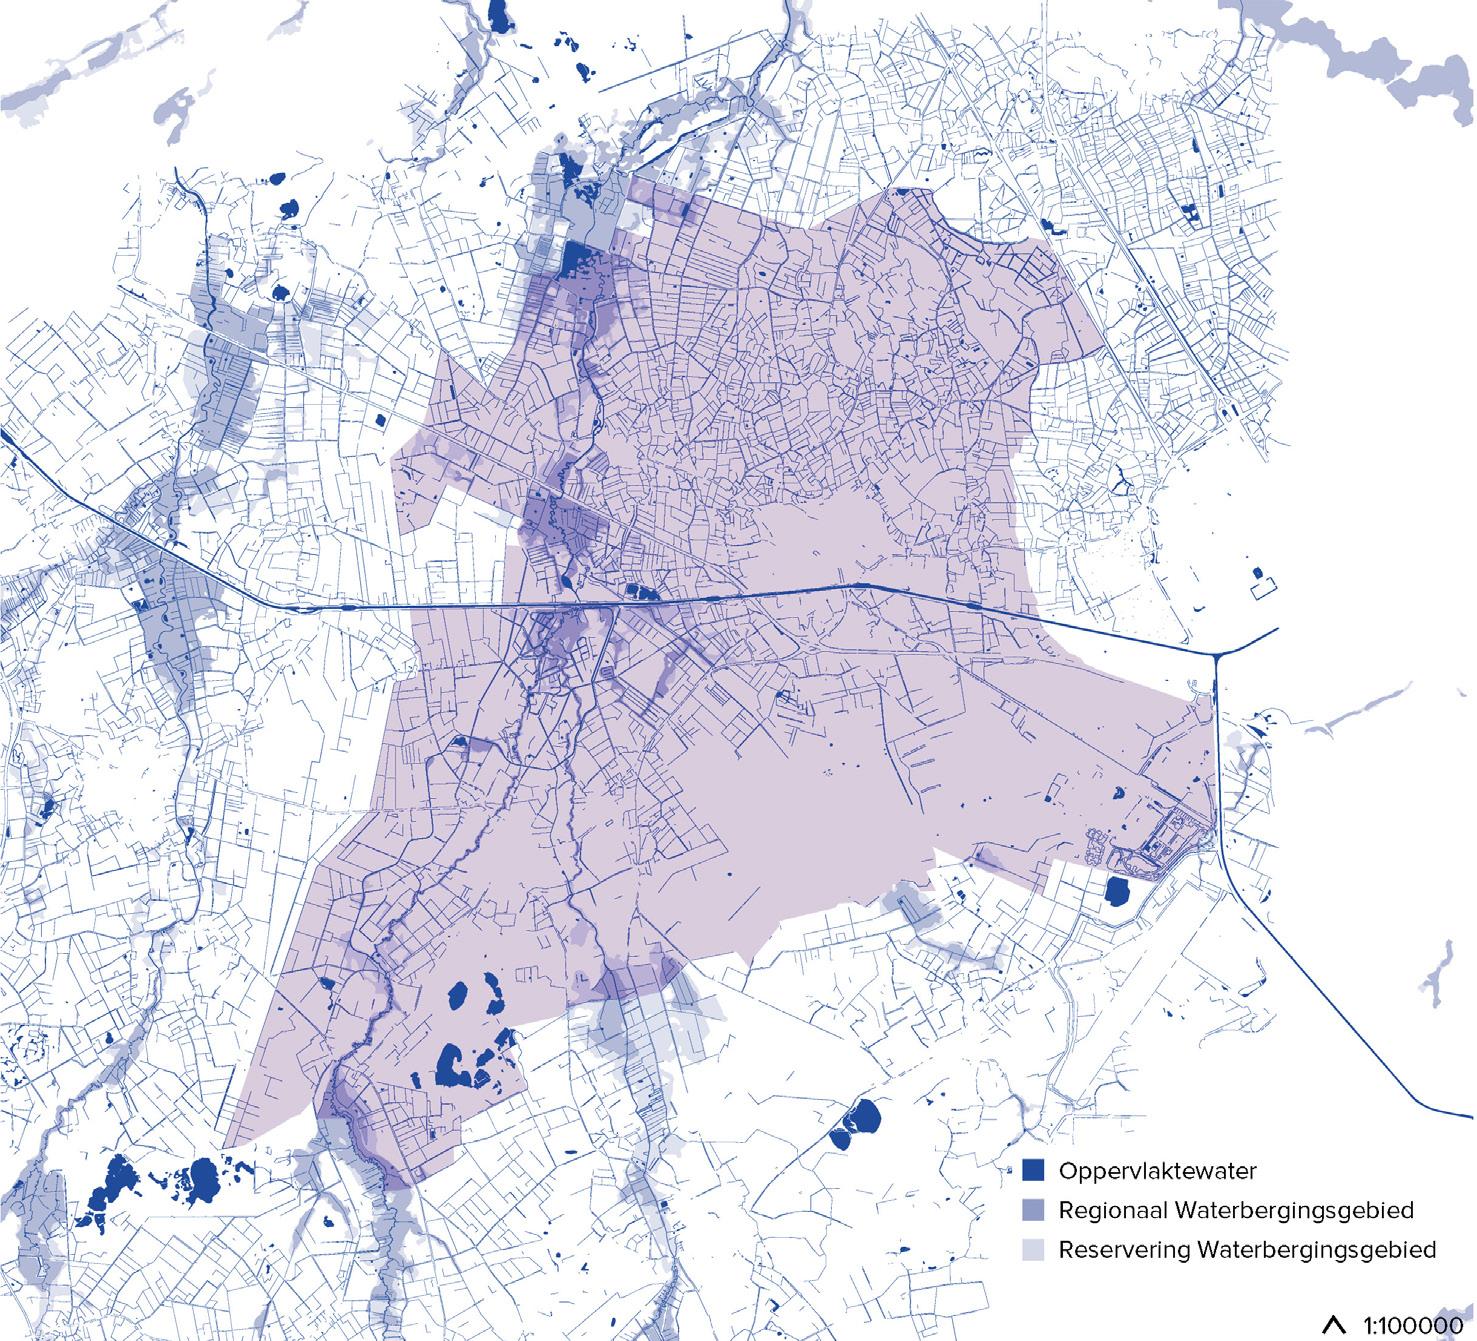
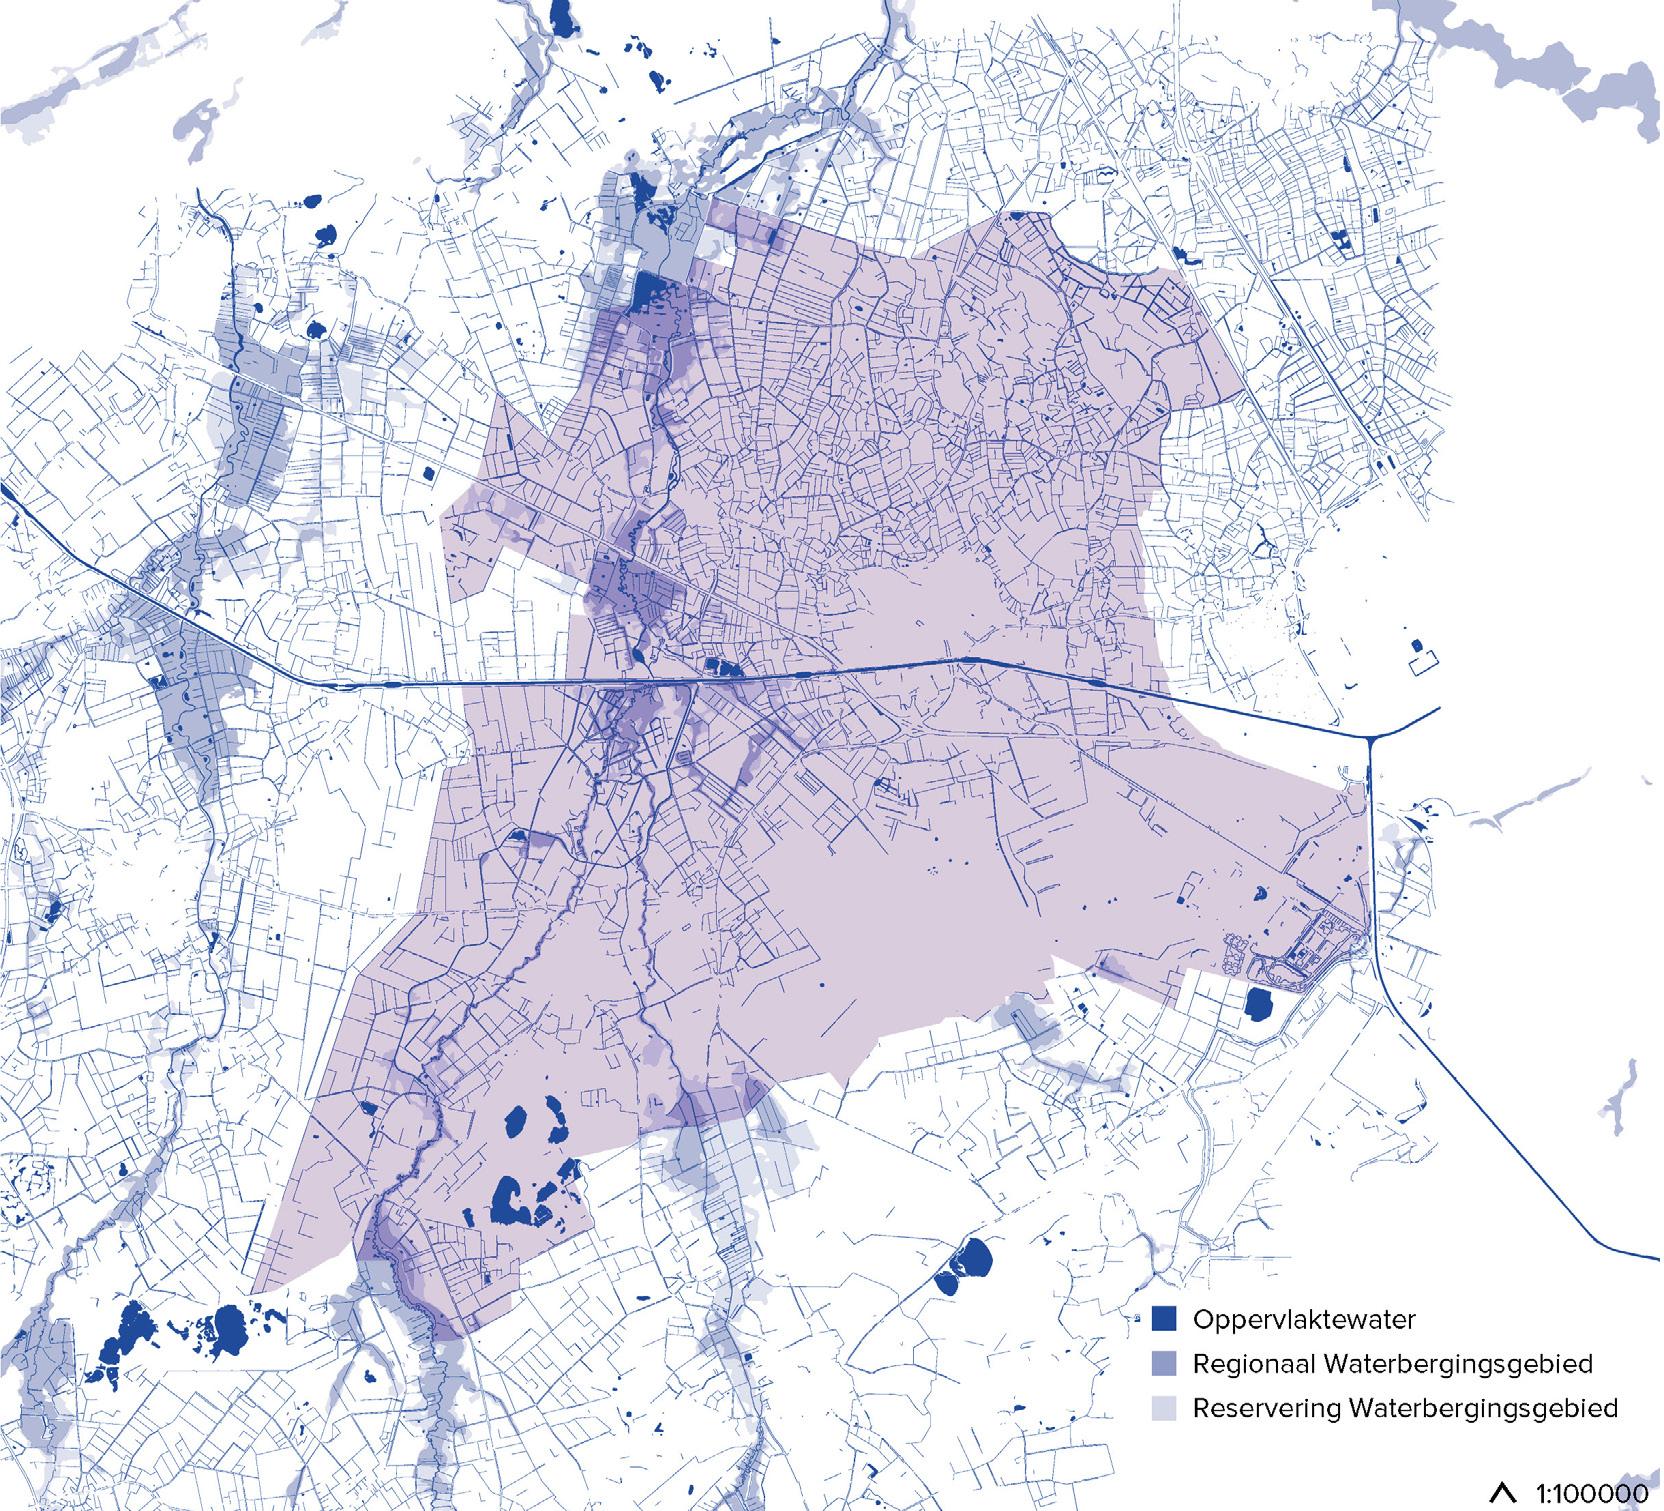
The map in Figure 13 depicts the surface water in the research area.
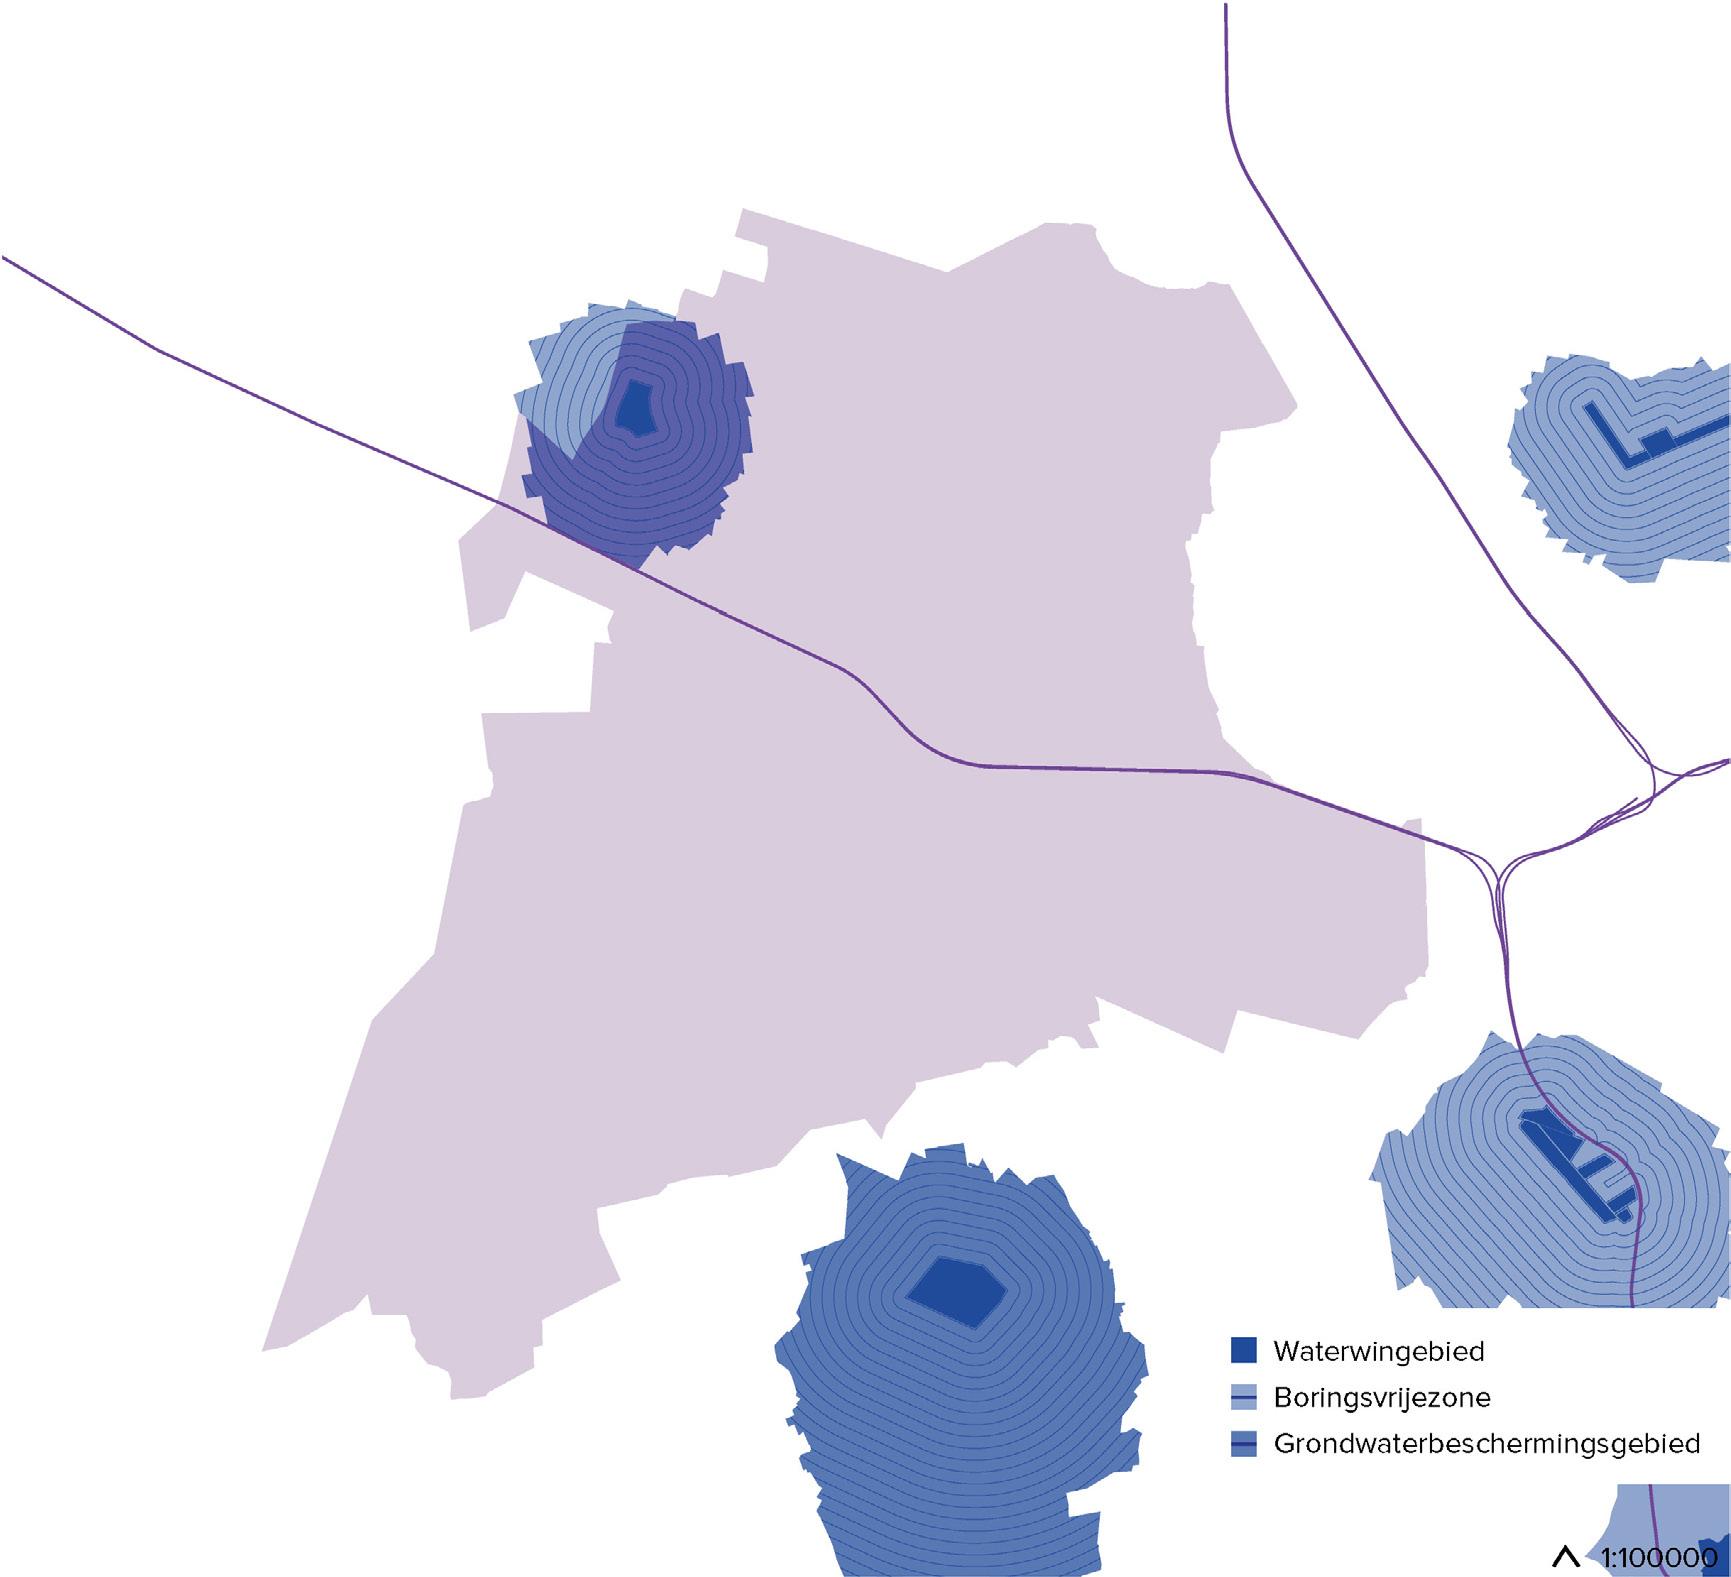
The map in Figure 14 shows the water protection areas.
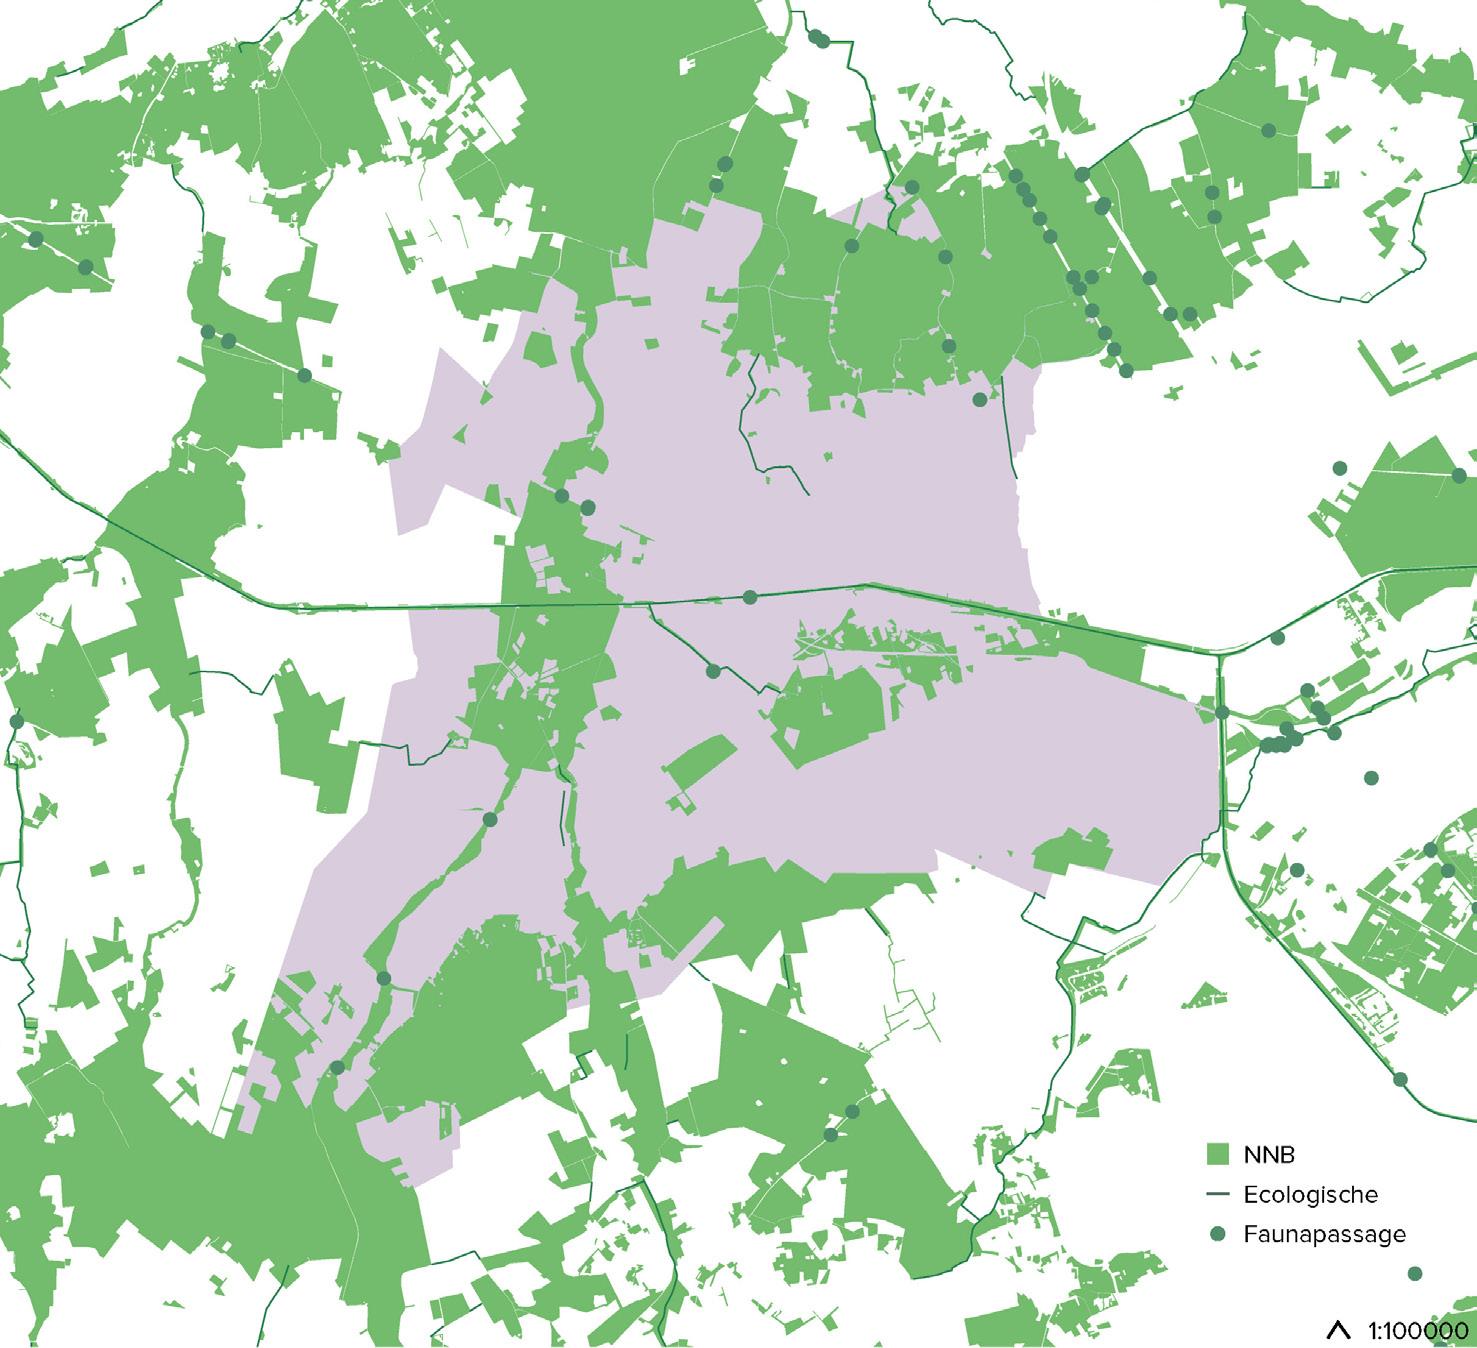
The map in Figure 15 presents the nature network in the research area. The nature network is a system of areas in the Netherlands where nature is prioritized.
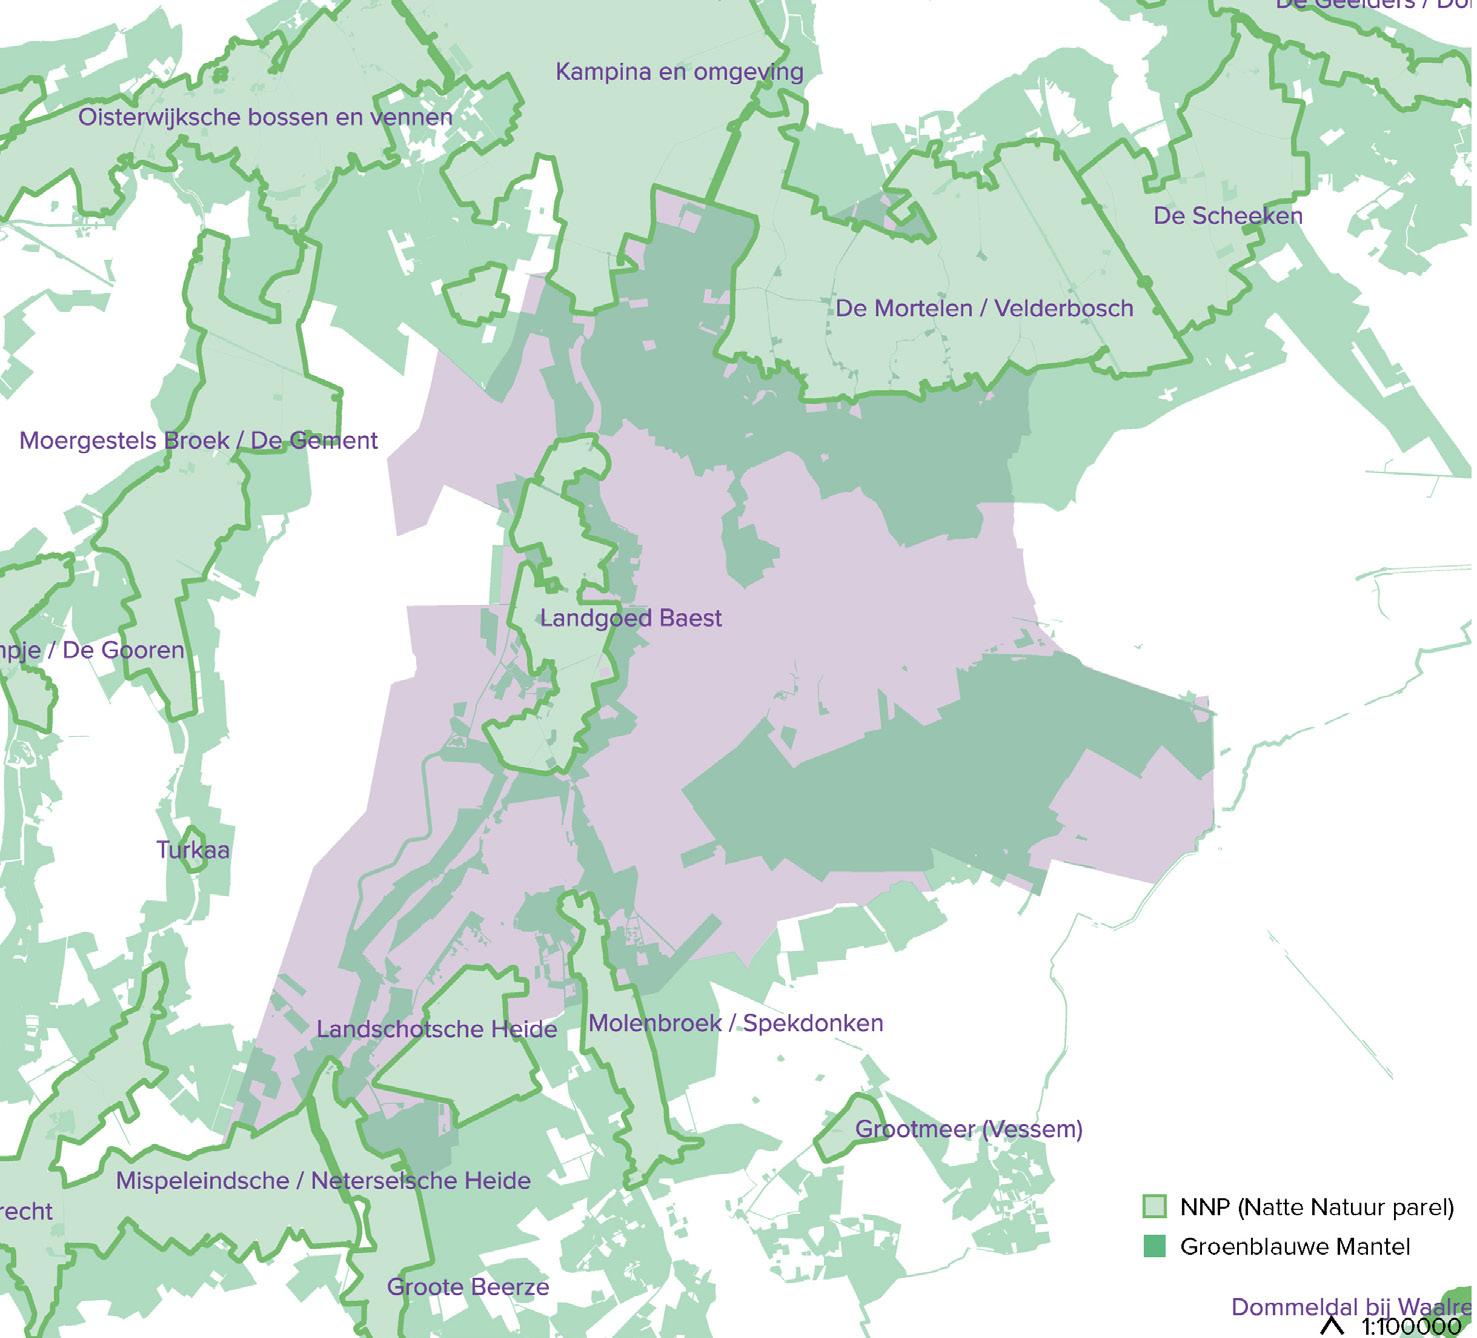
The map in Figure 16 shows the wet nature pearls. Wet nature pearls are the water-dependent parts of the NNB (Nature Network Brabant) that are part of a coherent complex of nature areas that strongly rely on high groundwater levels or springs. To enhance the robustness of the (water) system, areas have been included as connections between the Nature Network Brabant and the rural area—the Green-Blue Mantle.
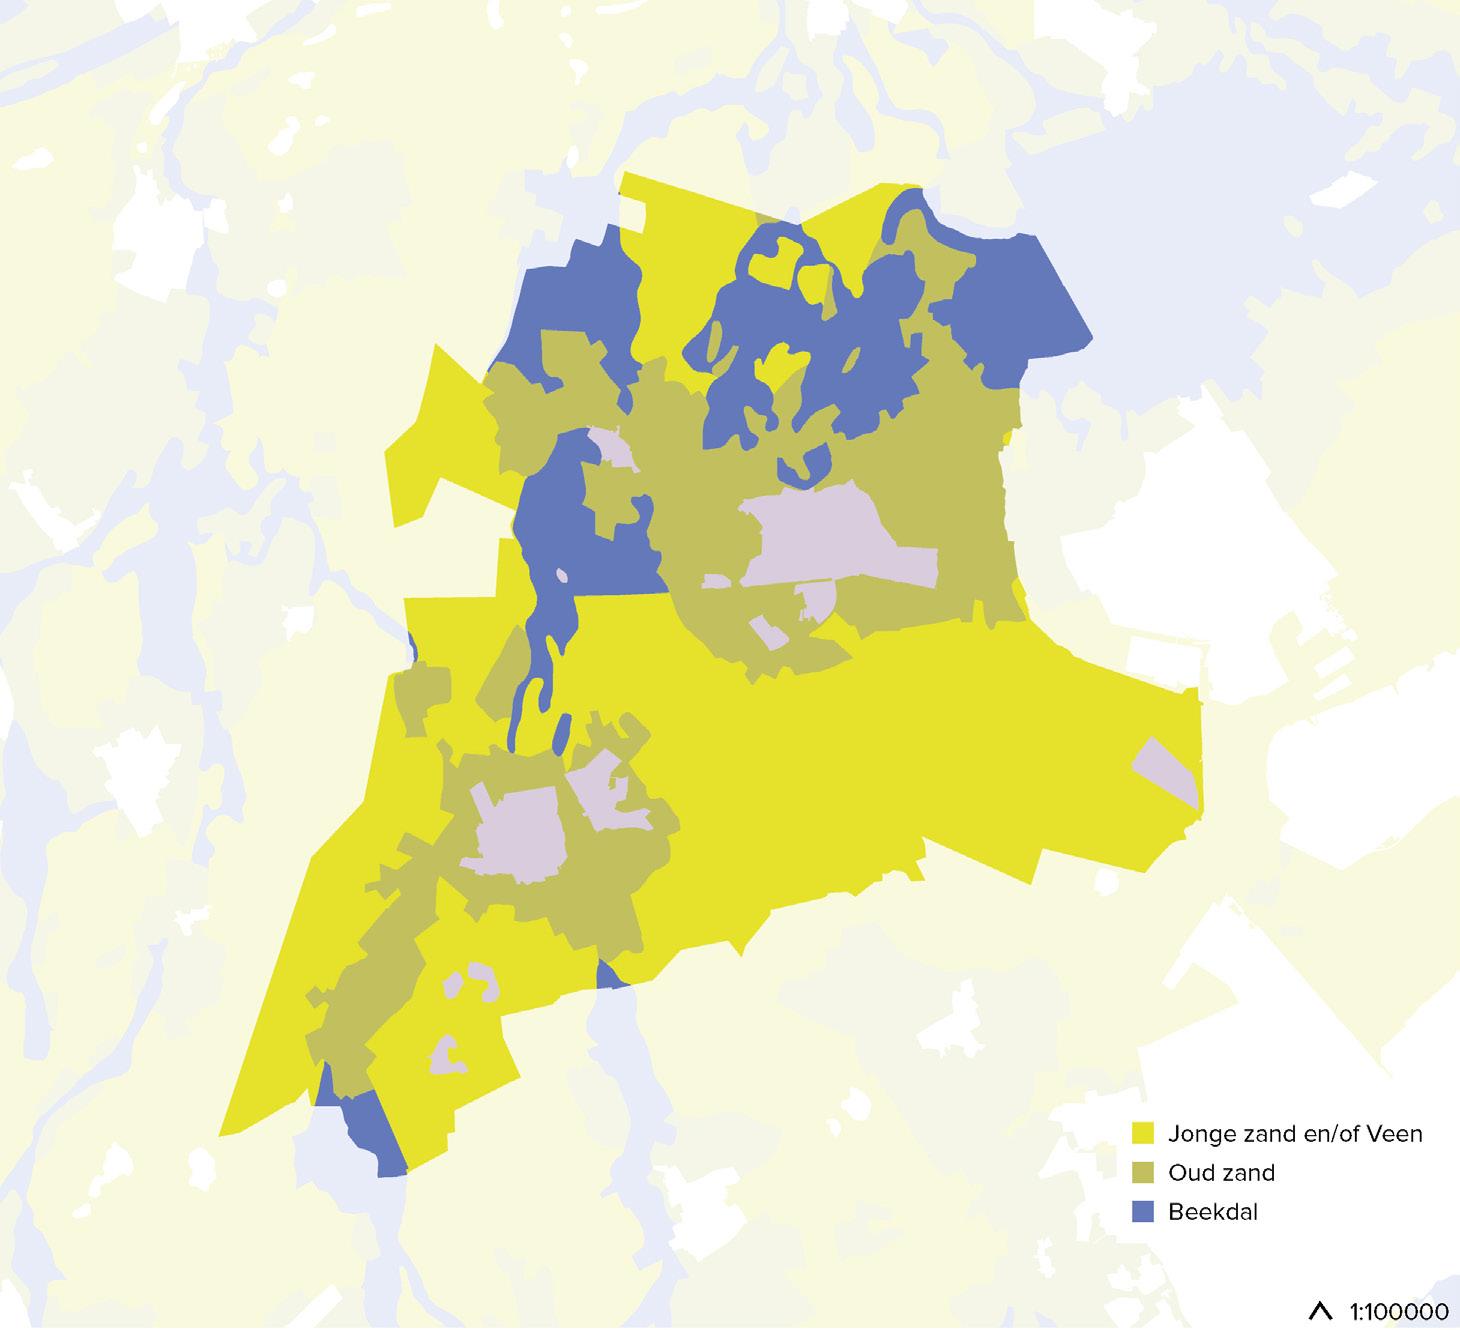
The map in Figure 17 illustrates the exploitation in the research area, consisting of young sand and/or peat, old sand, or river valley.
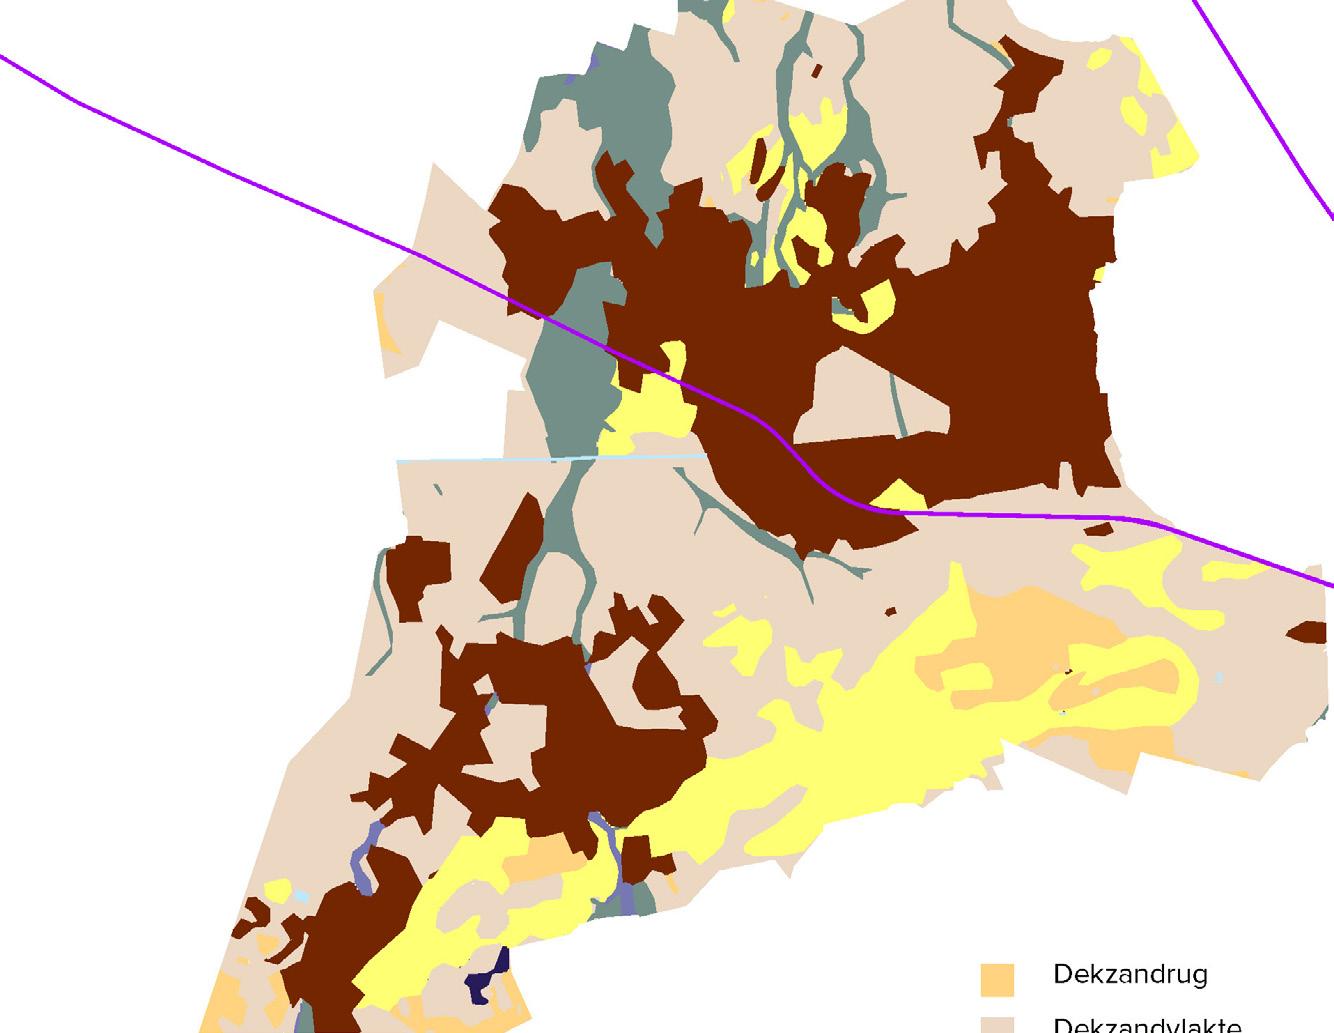
The map in Figure 18 shows the subsurface. The type of subsurface (cover sand ridge, cover sand plain, drifting sand dune, village green, river valley sand) influences factors such as water absorption and vegetation.
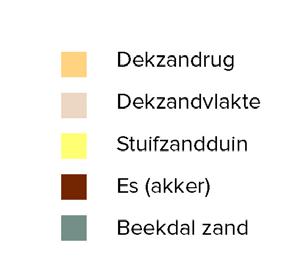
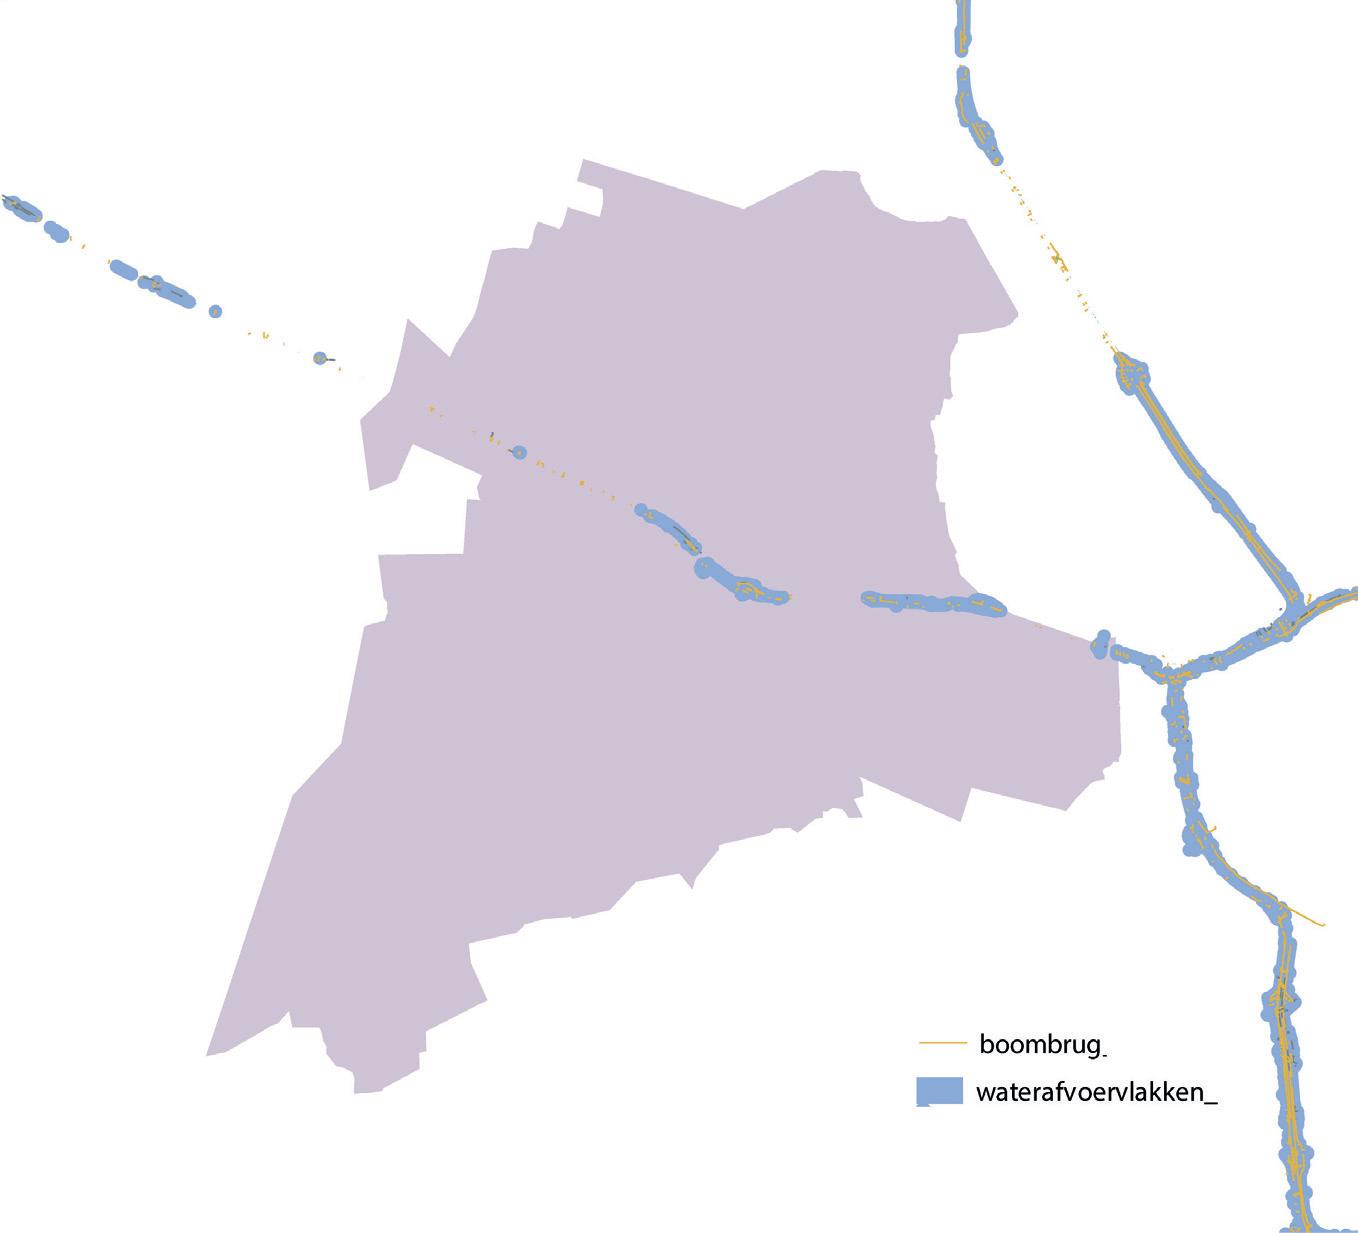
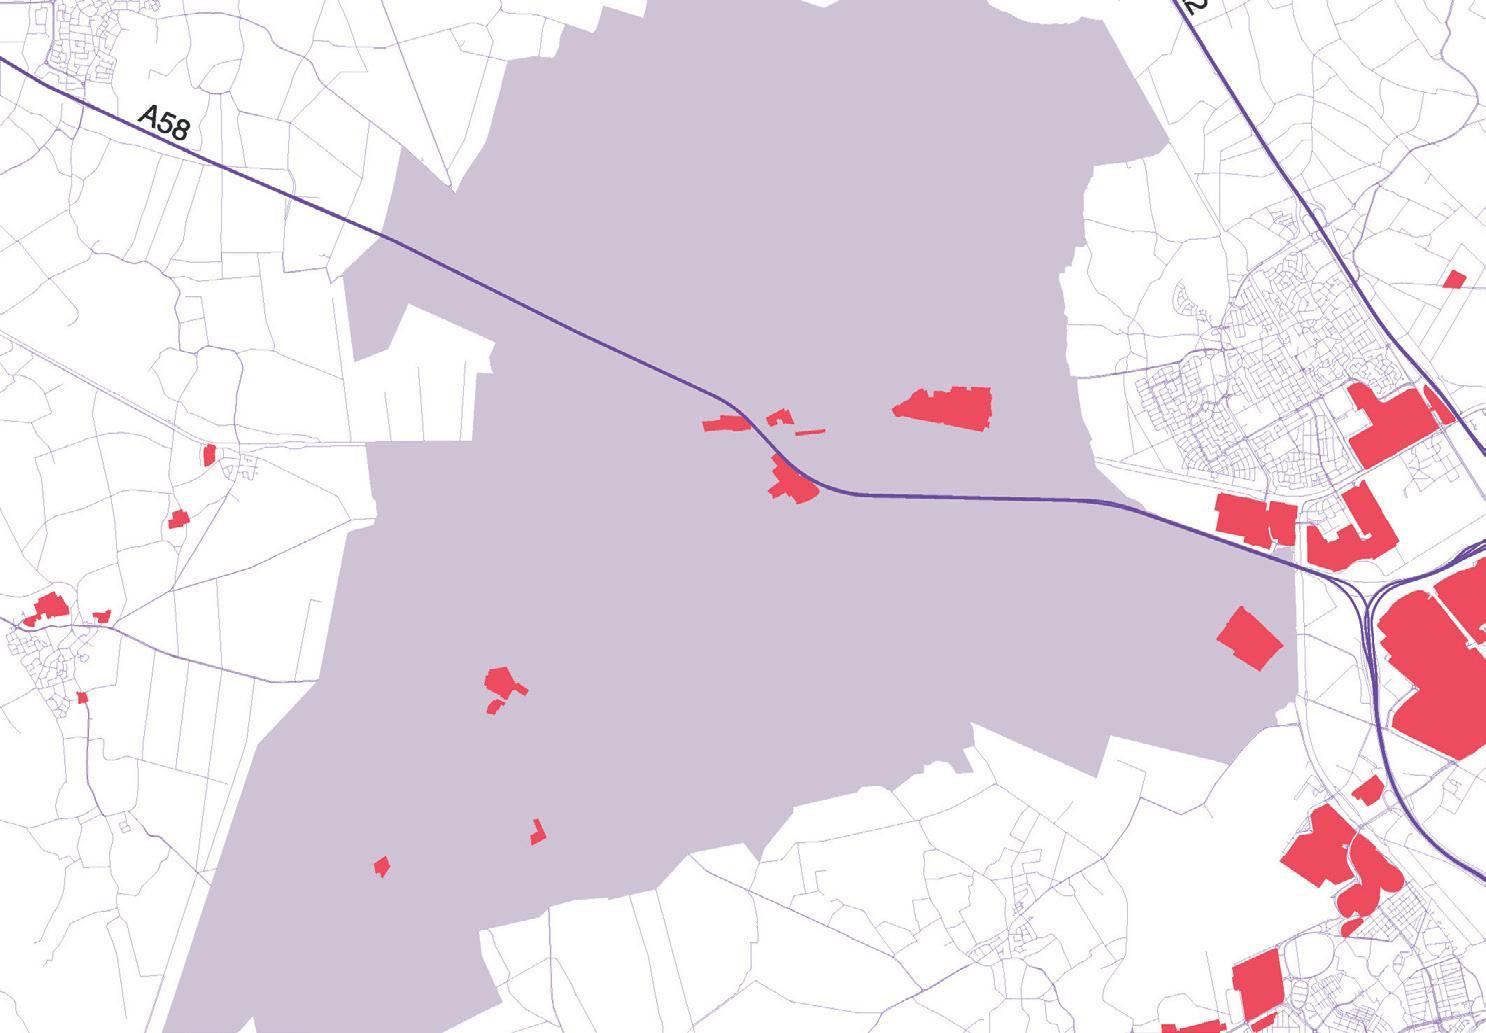
The map in Figure 19 depicts the water drainage, while Figure 20 shows where gardens and nature areas can be found in the research area.
The map in Figure 21 displays industrial estates.
The map in Figure 22 illustrates the number of trees per neighborhood, climate buffers, and neighborhood typology.
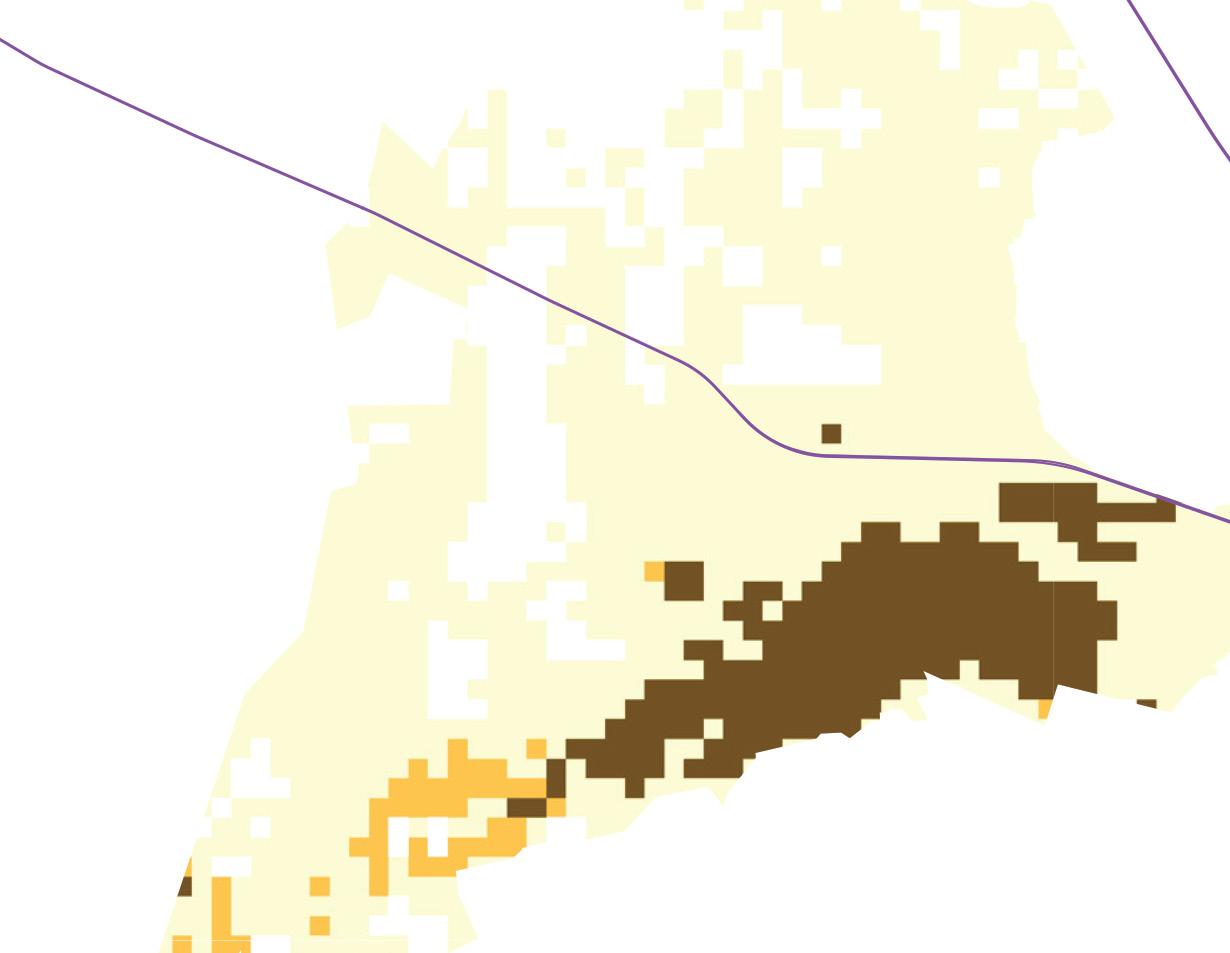
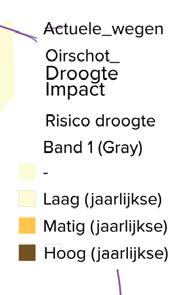
The map in Figure 23 provides insights into the drought impact on the area.
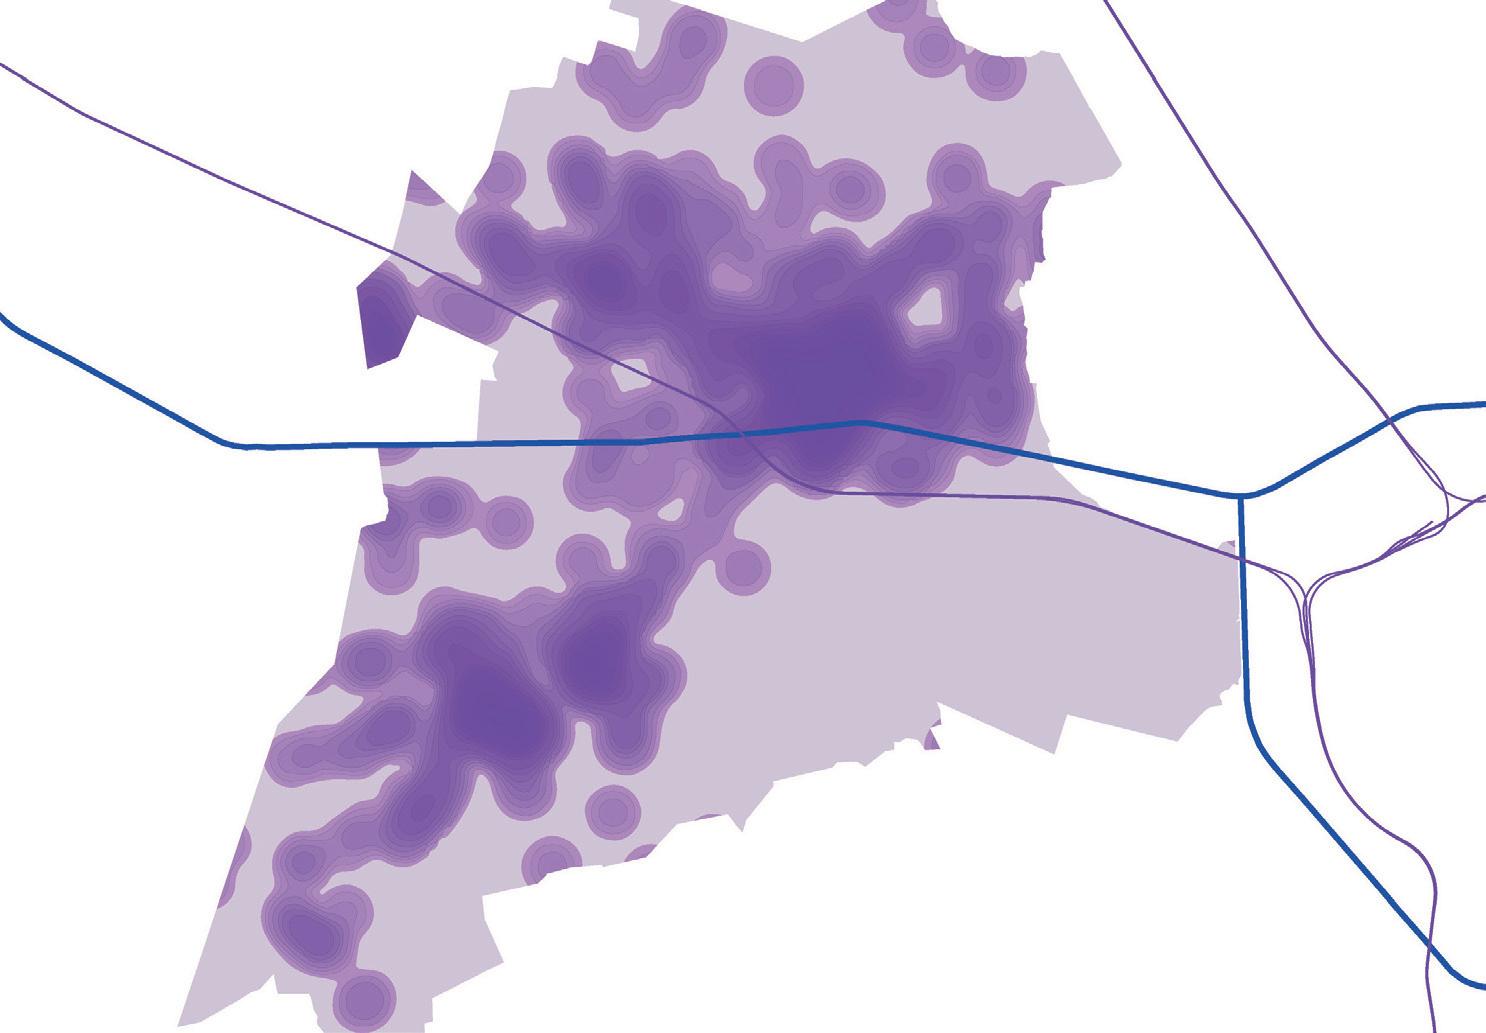
The map in Figure 24 shows a representation of where the highest concentration of residents is located, including a clear view of the military training area.
The map in Figure 25 is a heat map indicating the number of residents in the area.
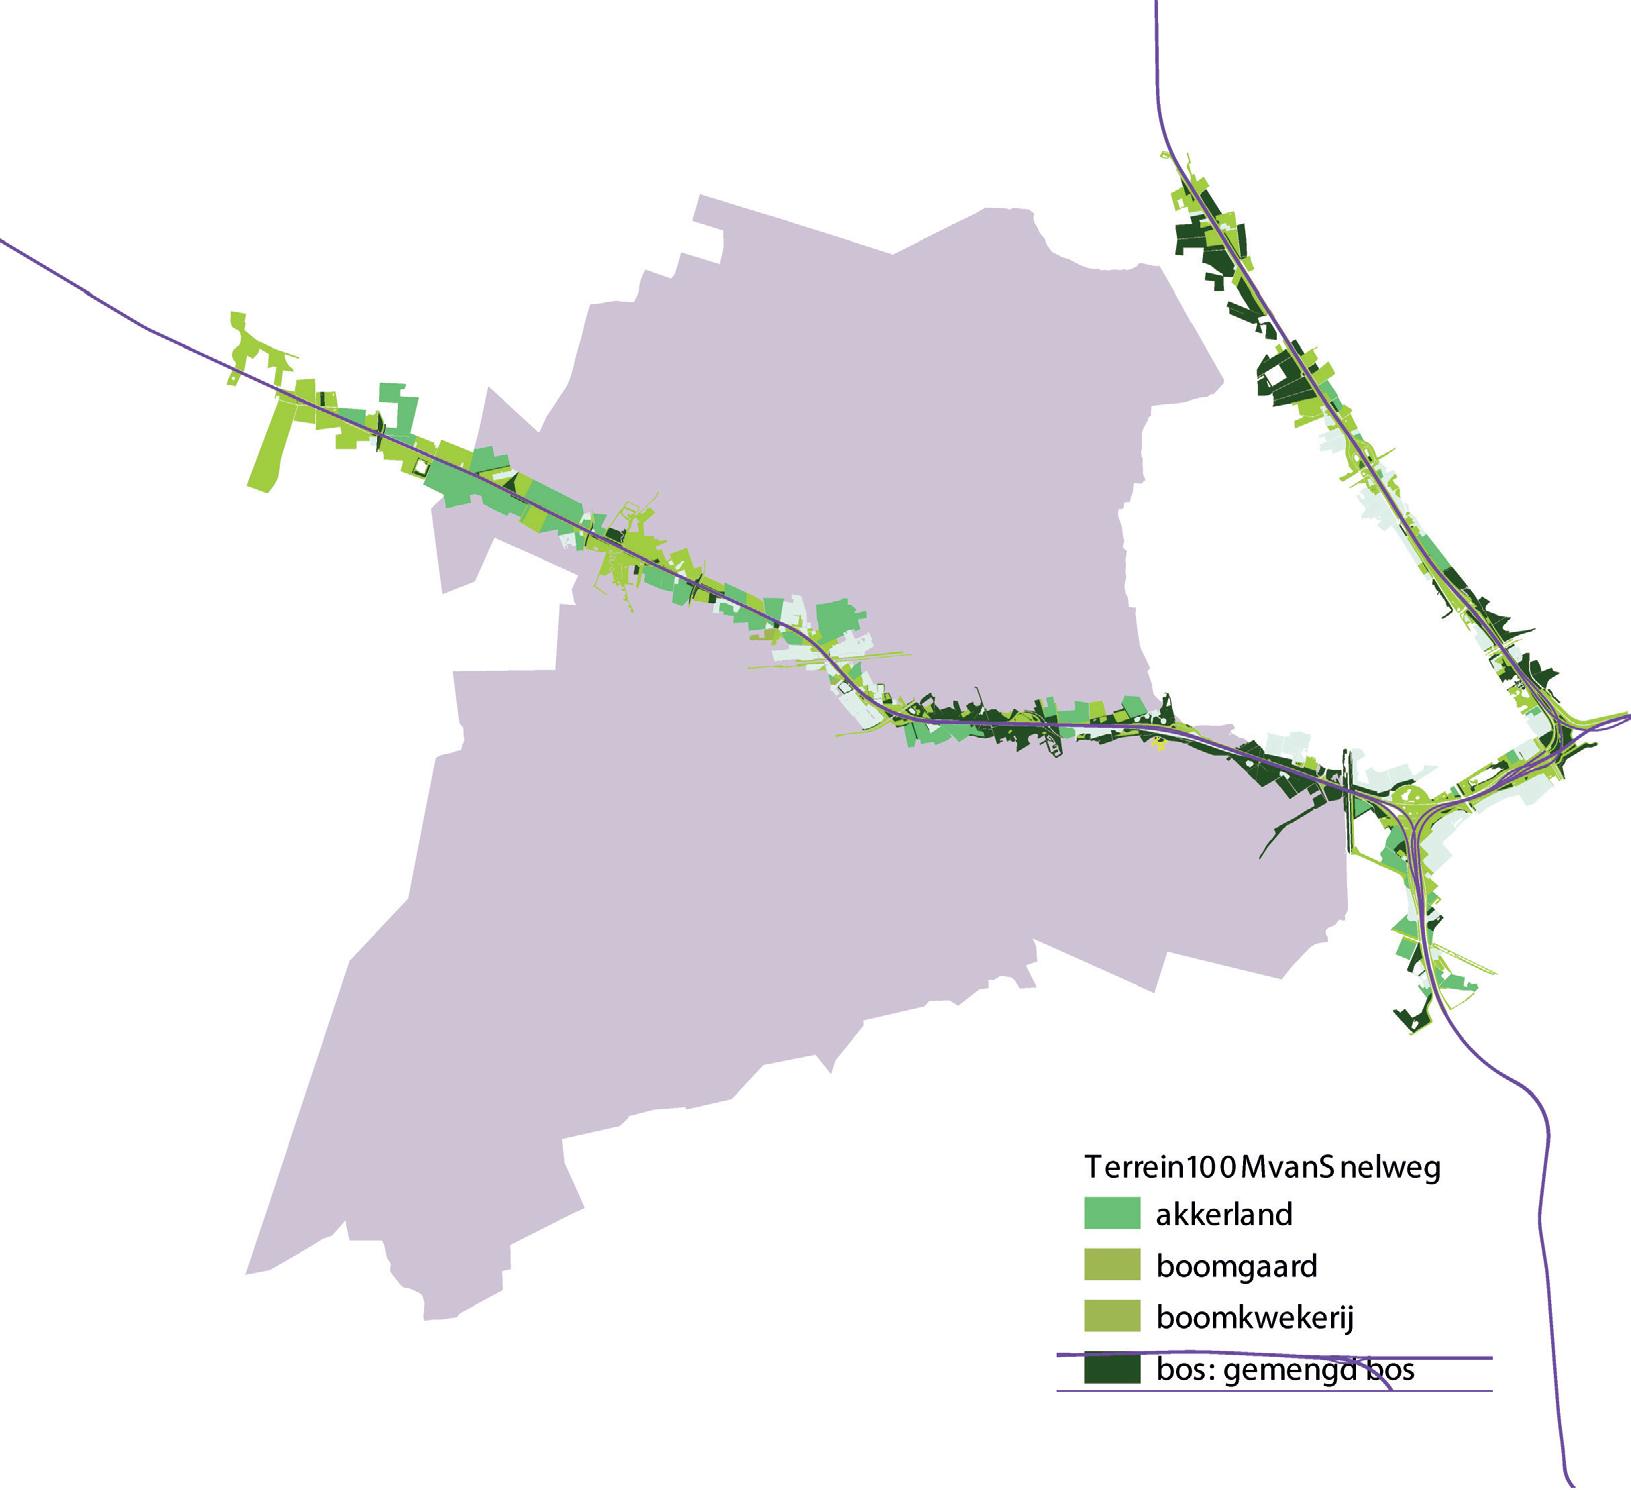
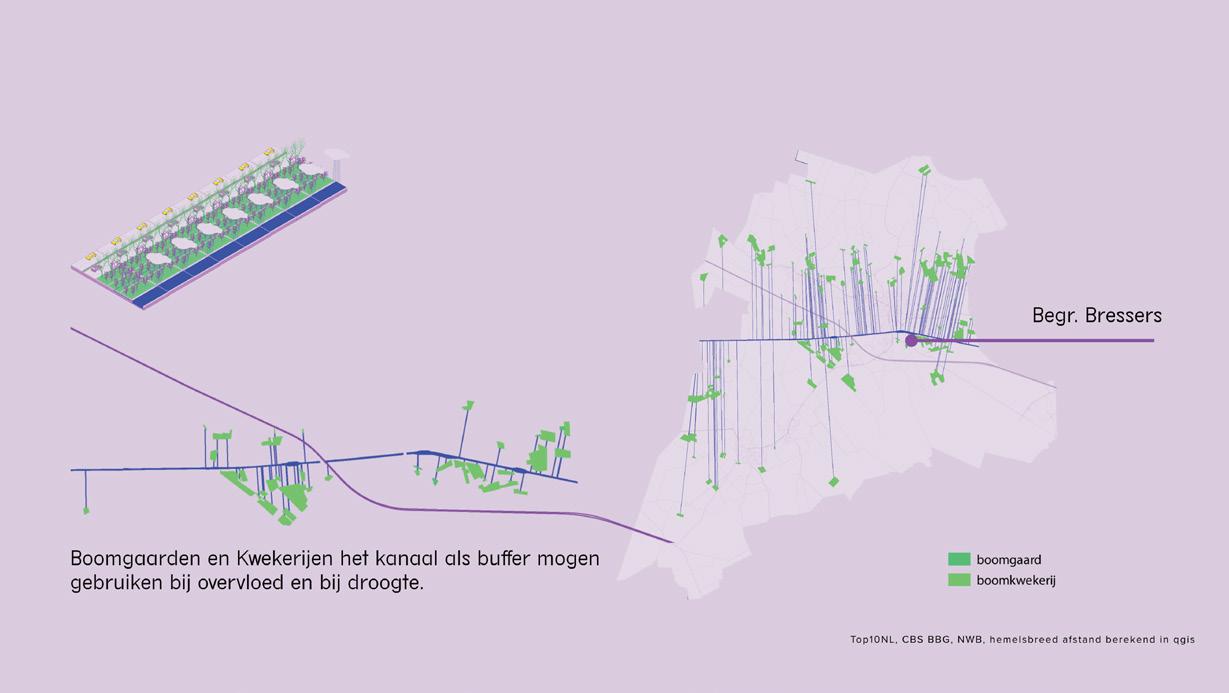
The map in Figure 26 shows land and agricultural activities along the A58 (within a distance of 100 meters), distinguishing between arable land, orchards, nurseries, and forests.
The map in Figure 27 depicts the location of the two highway islands.
https://data.overheid.nl/dataset/5471-natuurbeheerplan--natte-natuurparels. Map created by Lucas Zoutendijk.
Academy Eindhoven, 31 January 2025
Figure 17: Exploitation in the Oirschot area. Source: Province of Brabant. Map created by Lucas Zoutendijk.
Figure 18: Subsurface in the Oirschot area. Source: Province of Brabant. Map created by Lucas Zoutendijk.
Figure 20: Gardens in the area. Map created by Lucas Zoutendijk.
22: Green versus gray, climate buffers, and neighborhood typology. Maps created by Lucas Zoutendijk.
Figure
Figure 21: Industrial estates in the area. Map created by Lucas Zoutendijk.
23: Maps providing insights into the drought impact of the area. Maps created by Lucas Zoutendijk.
24: Heat map of the number of residents. Map created by Lucas Zoutendijk.
Figure
Figure
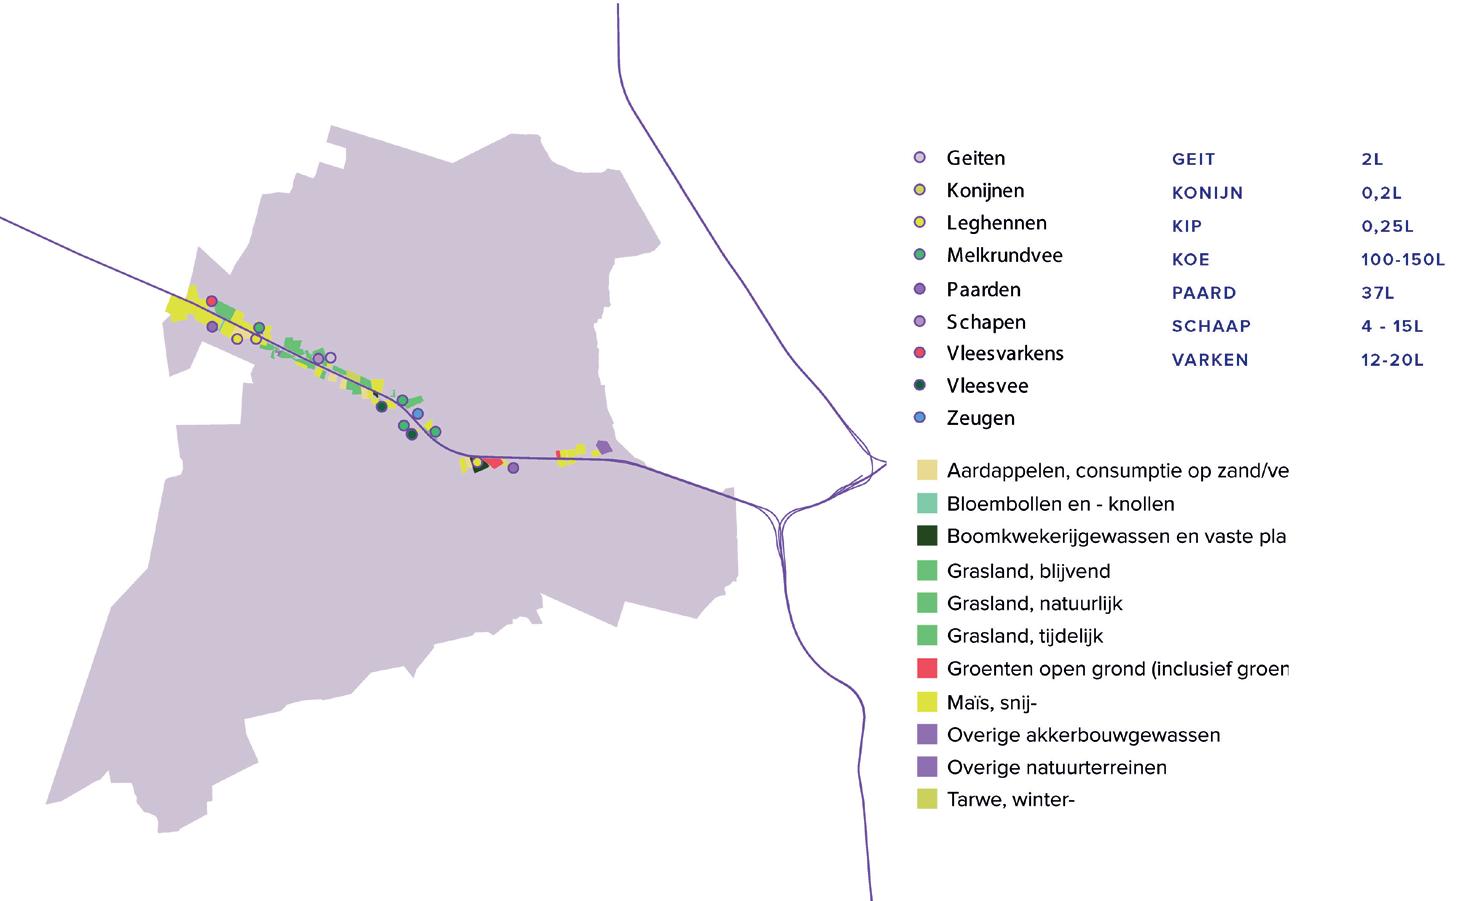
Figure 26: Types of crops along the highway and water usage by livestock species. Source: Agricultural Area Netherlands, Climate Effects Atlas (Agricultural Areas), Province of North Brabant (Livestock Farming). Map created by Lucas Zoutendijk.
Figure 27: Location of highway islands. Map created by Lucas Zoutendijk.
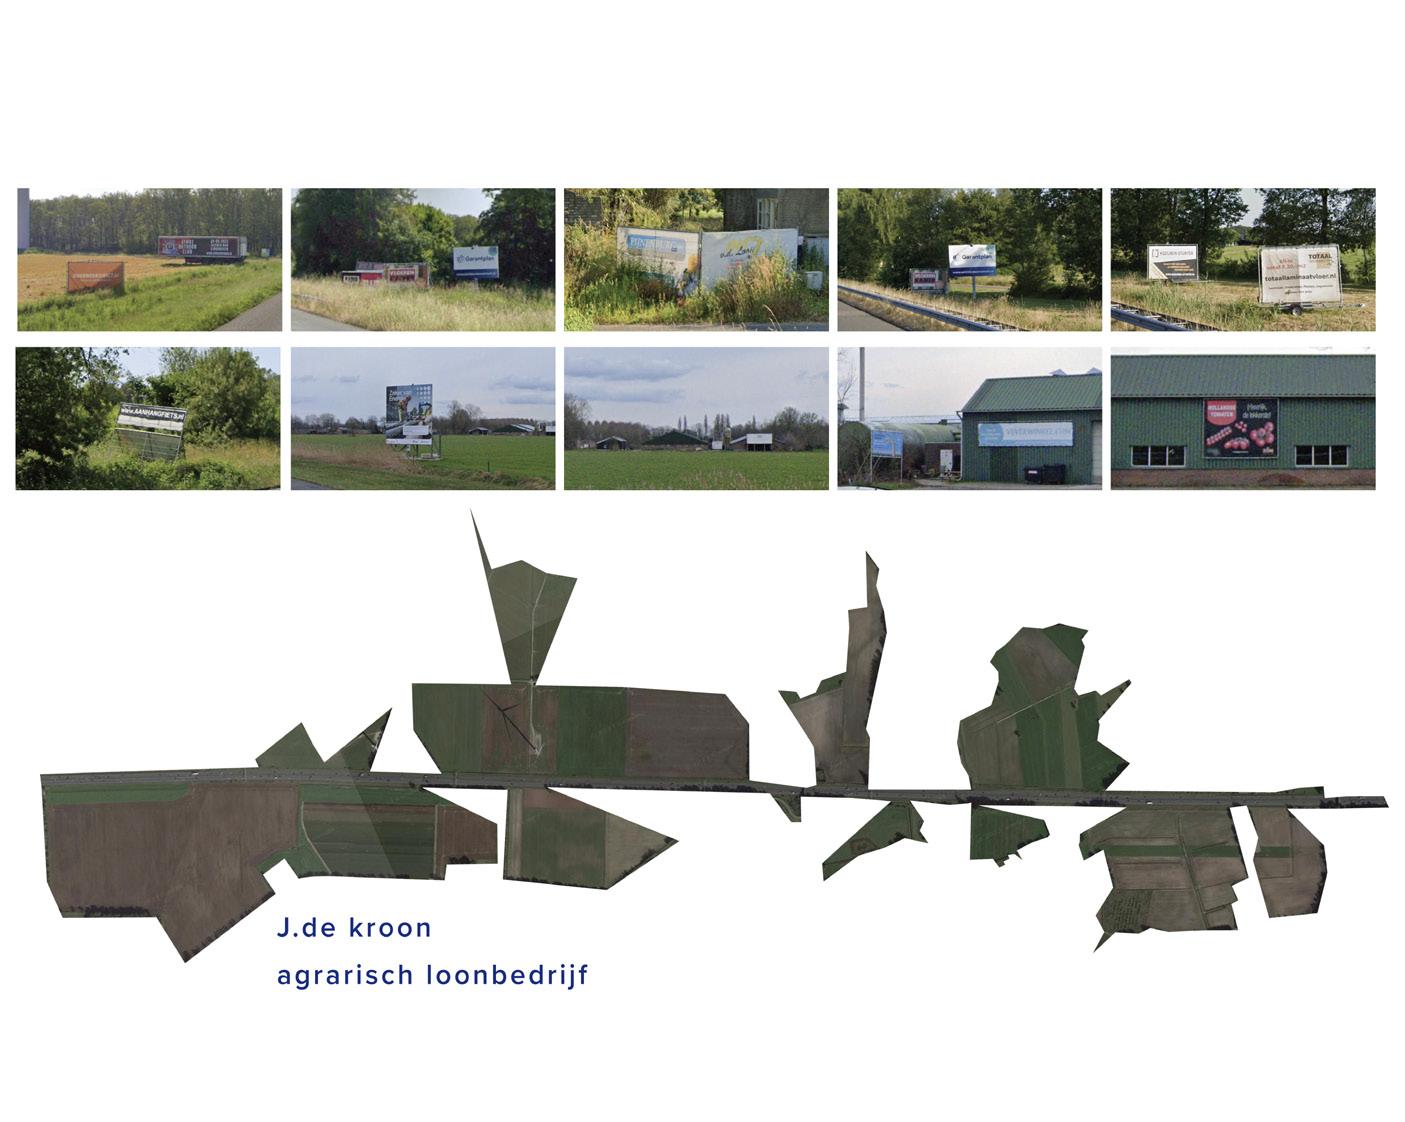
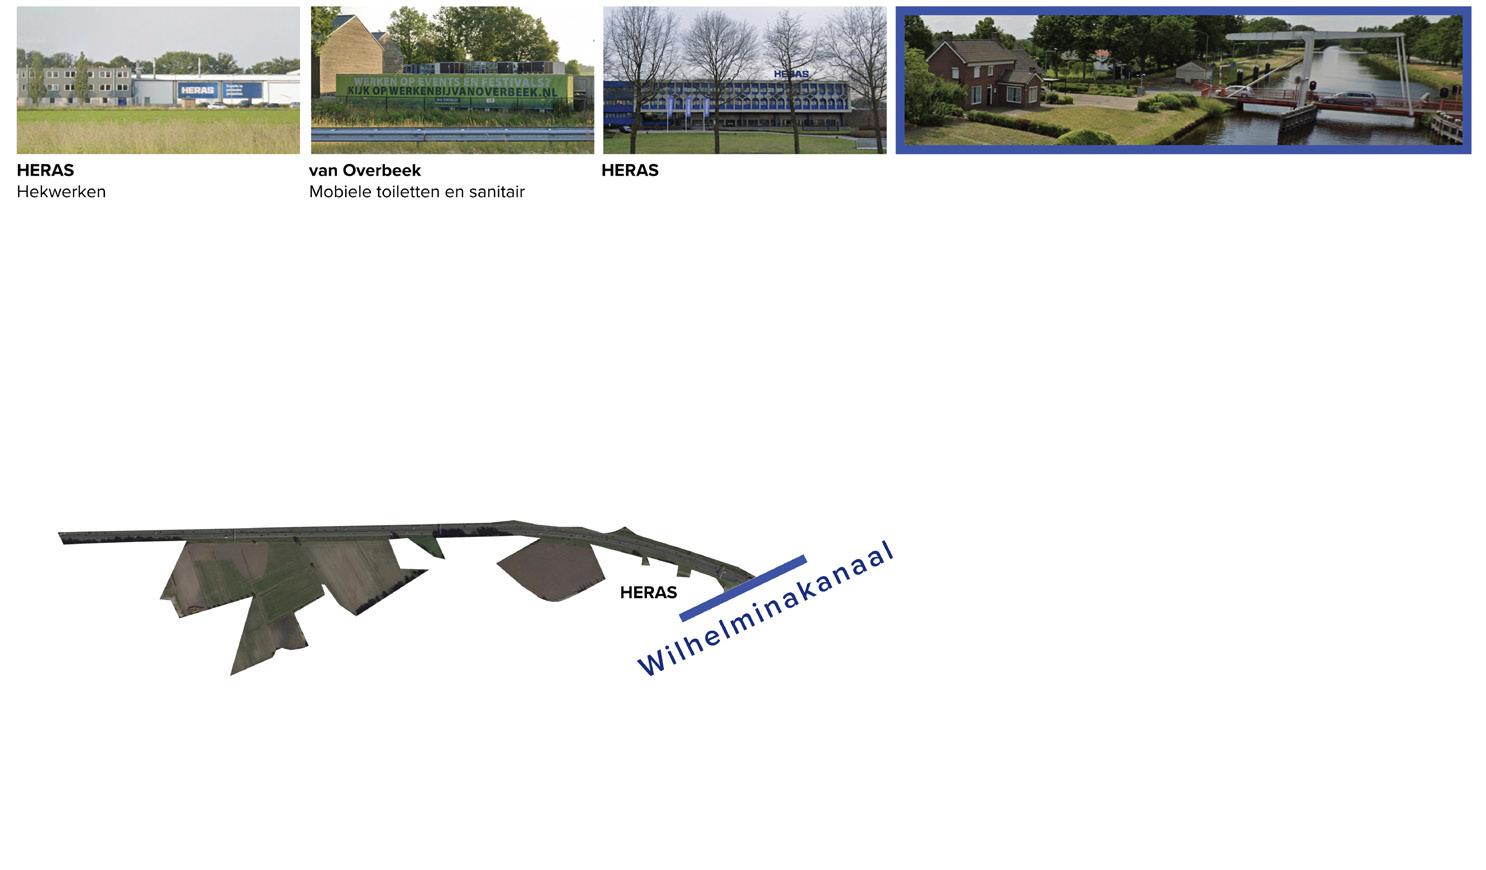
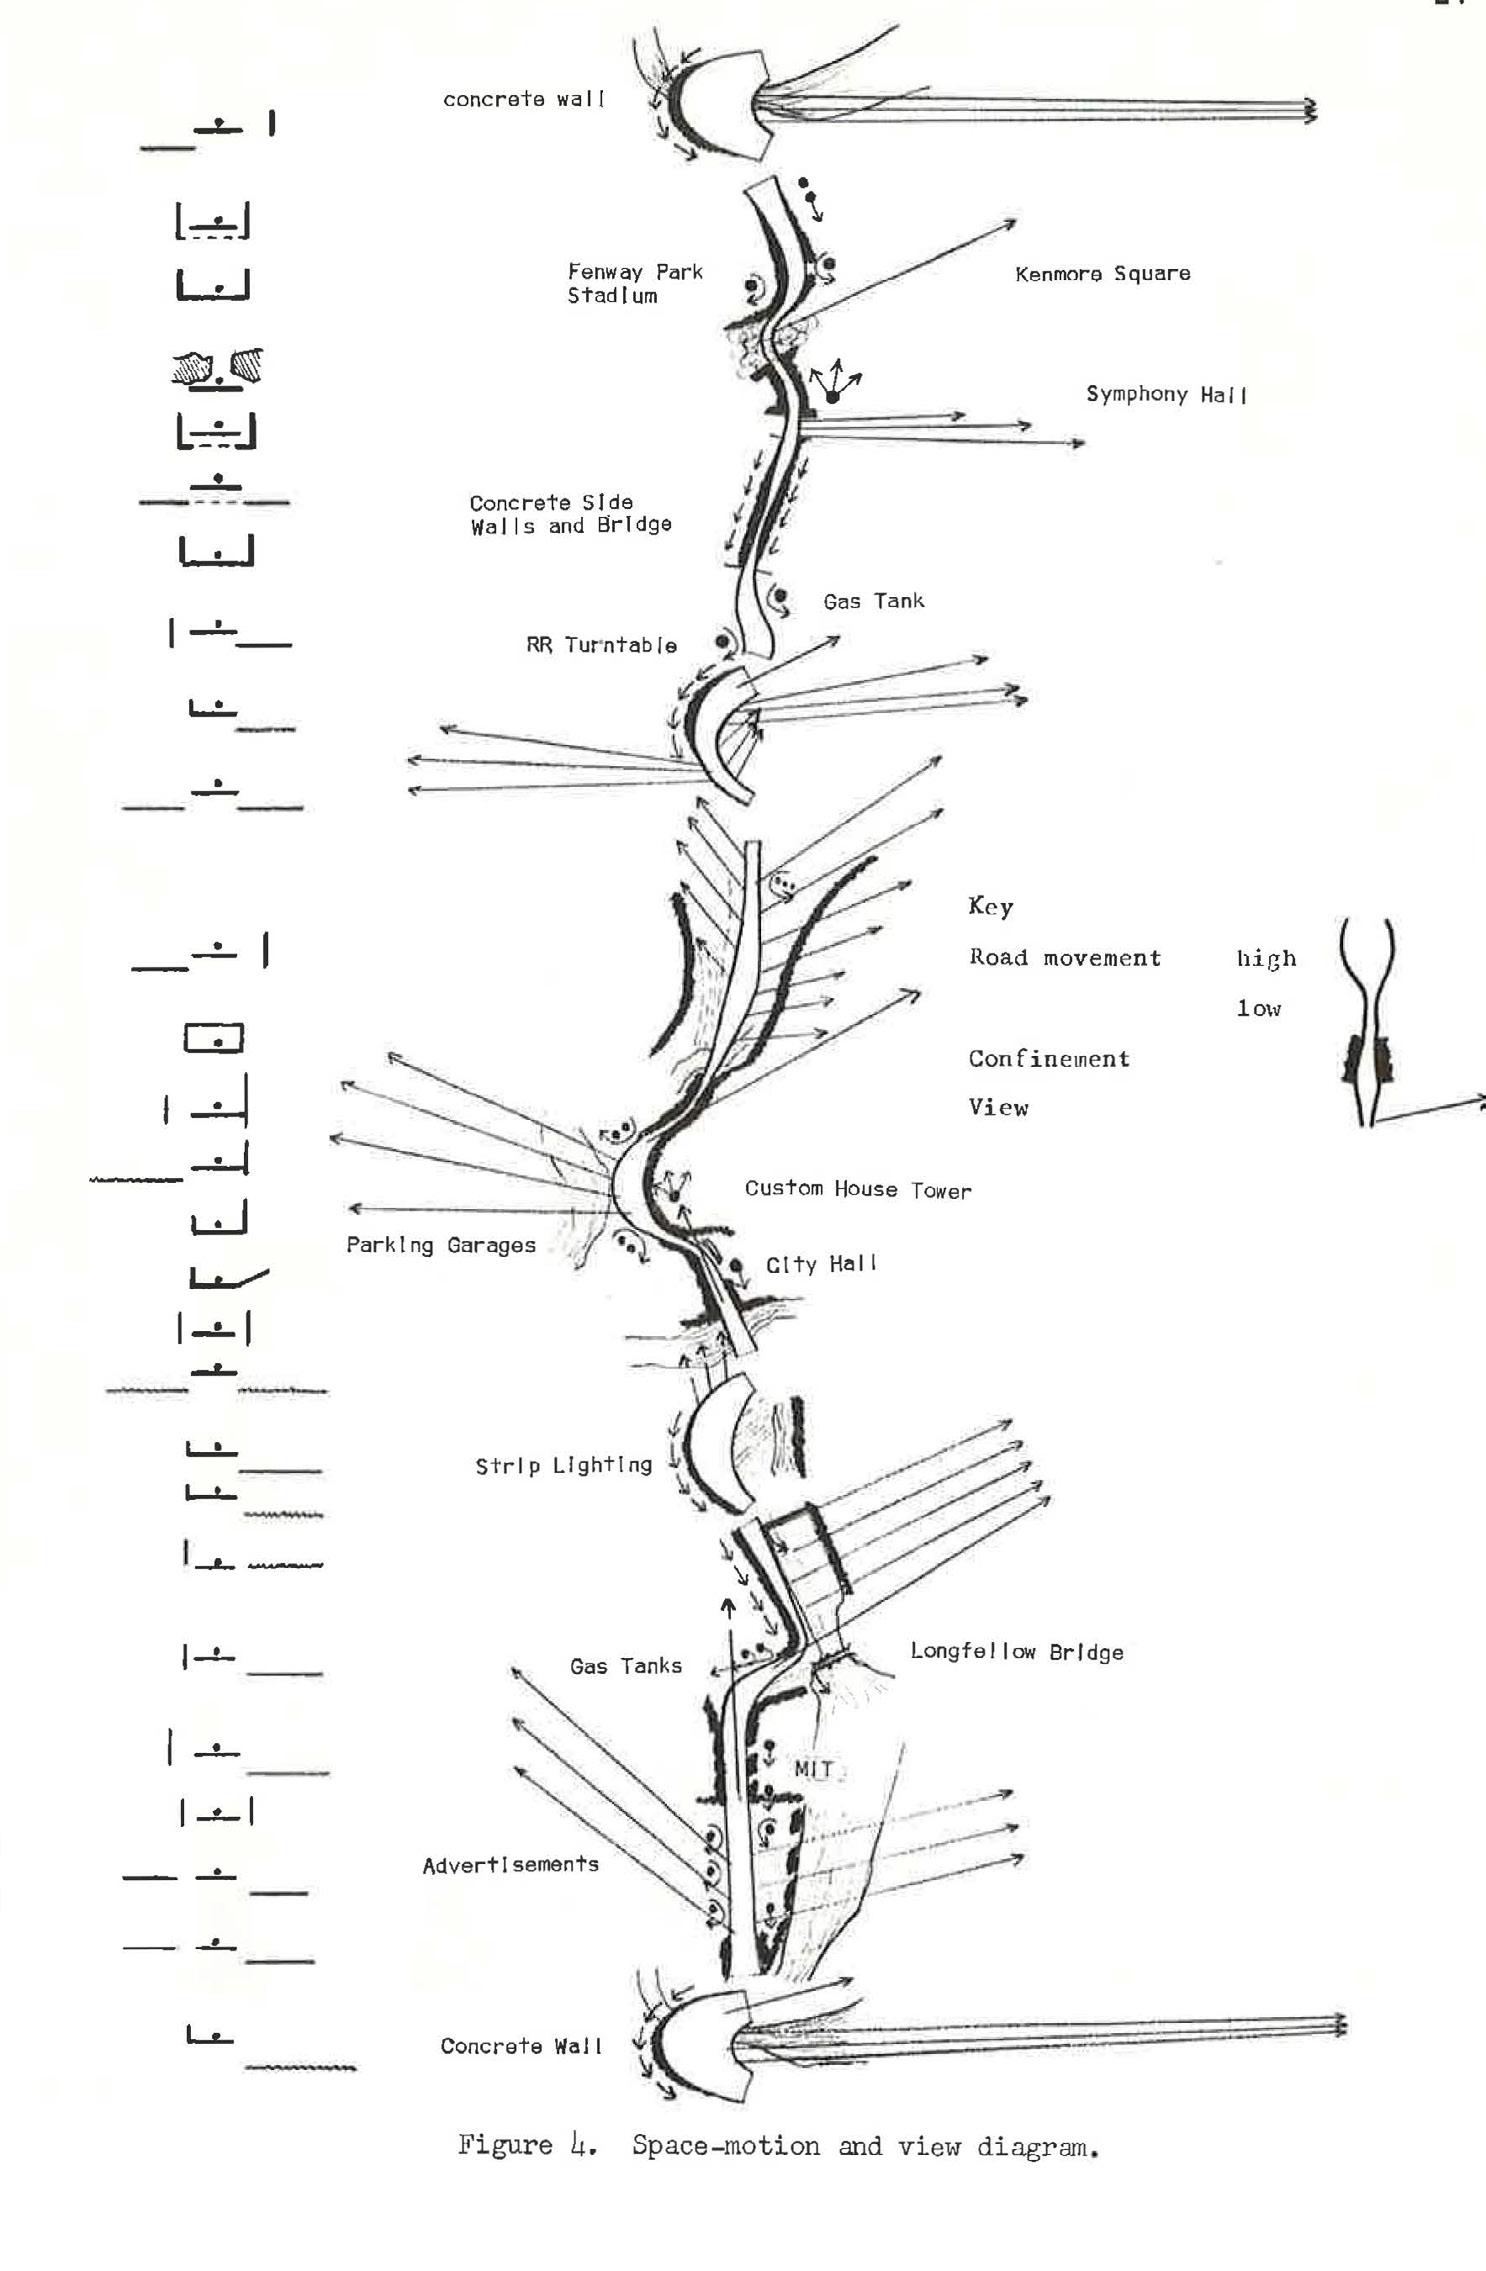
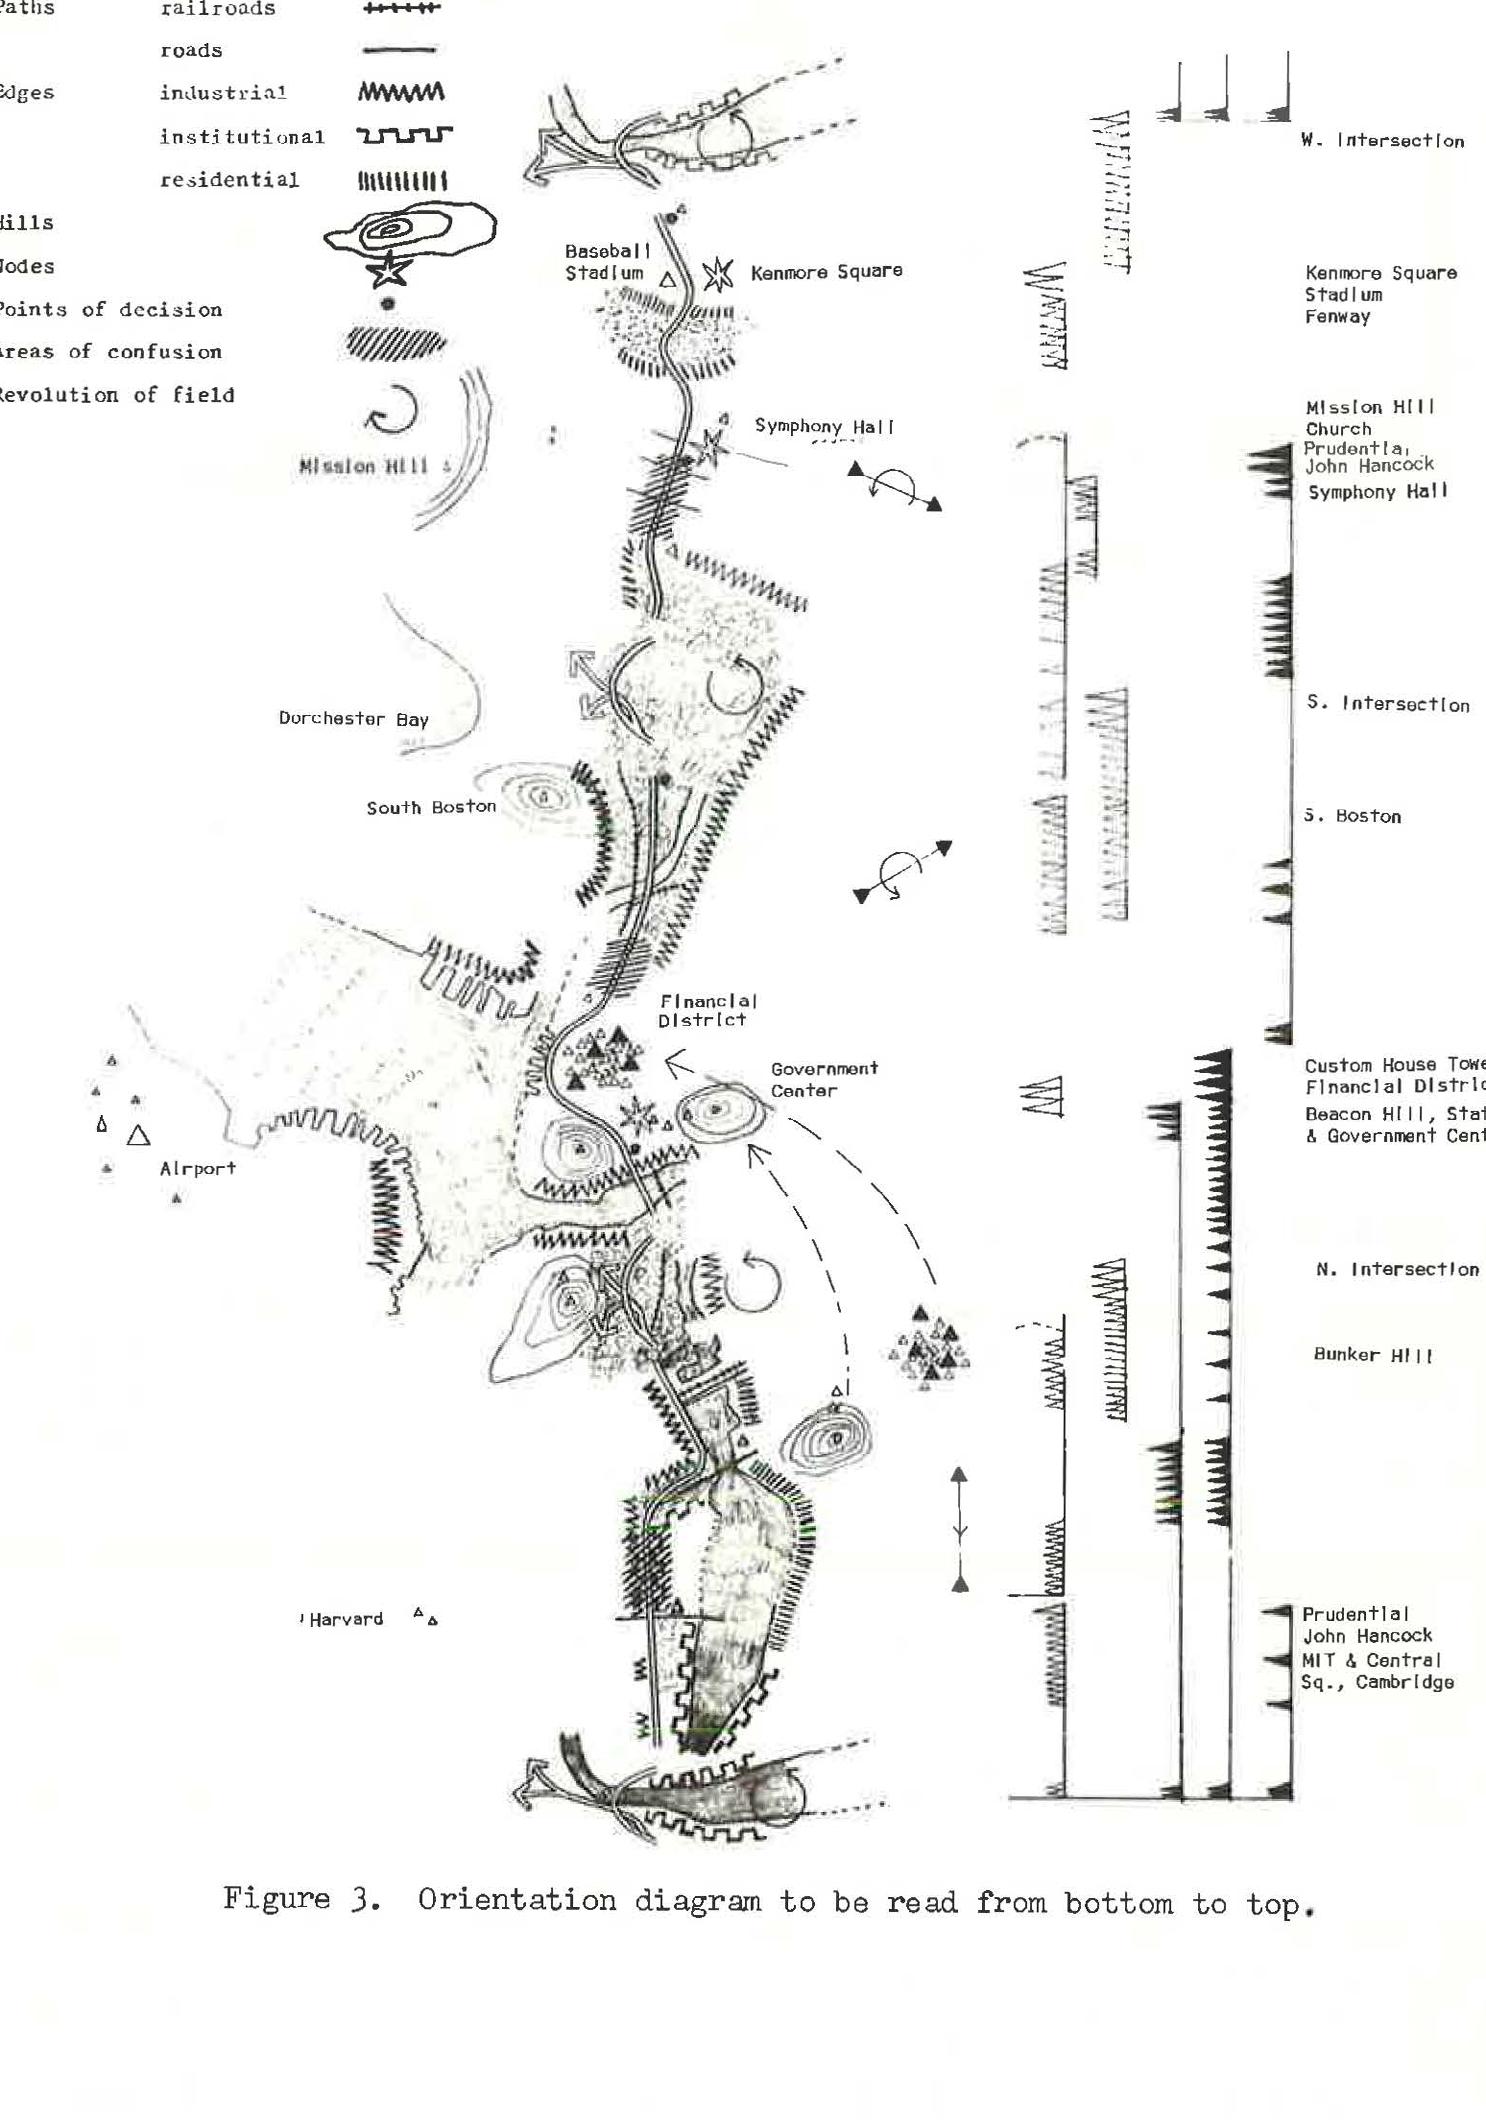
To gain an impression of the experience of the highway, Lucas also mapped vision lines (Figures 28 to 30) from the highway, utilizing Google Earth and Google Street View from May and June 2023. This idea is inspired by the research „The View from the Road“ on soft data and the experience of public space by Donald Appleyard, Kevin Lynch, and John Myer (1965) (see Figures 31 and 32).
Figure 28: Vision lines from the A58. Predominantly arable farming, livestock farming, and billboards. Source: Google Earth and Google Street View. Visualization by Lucas Zoutendijk.
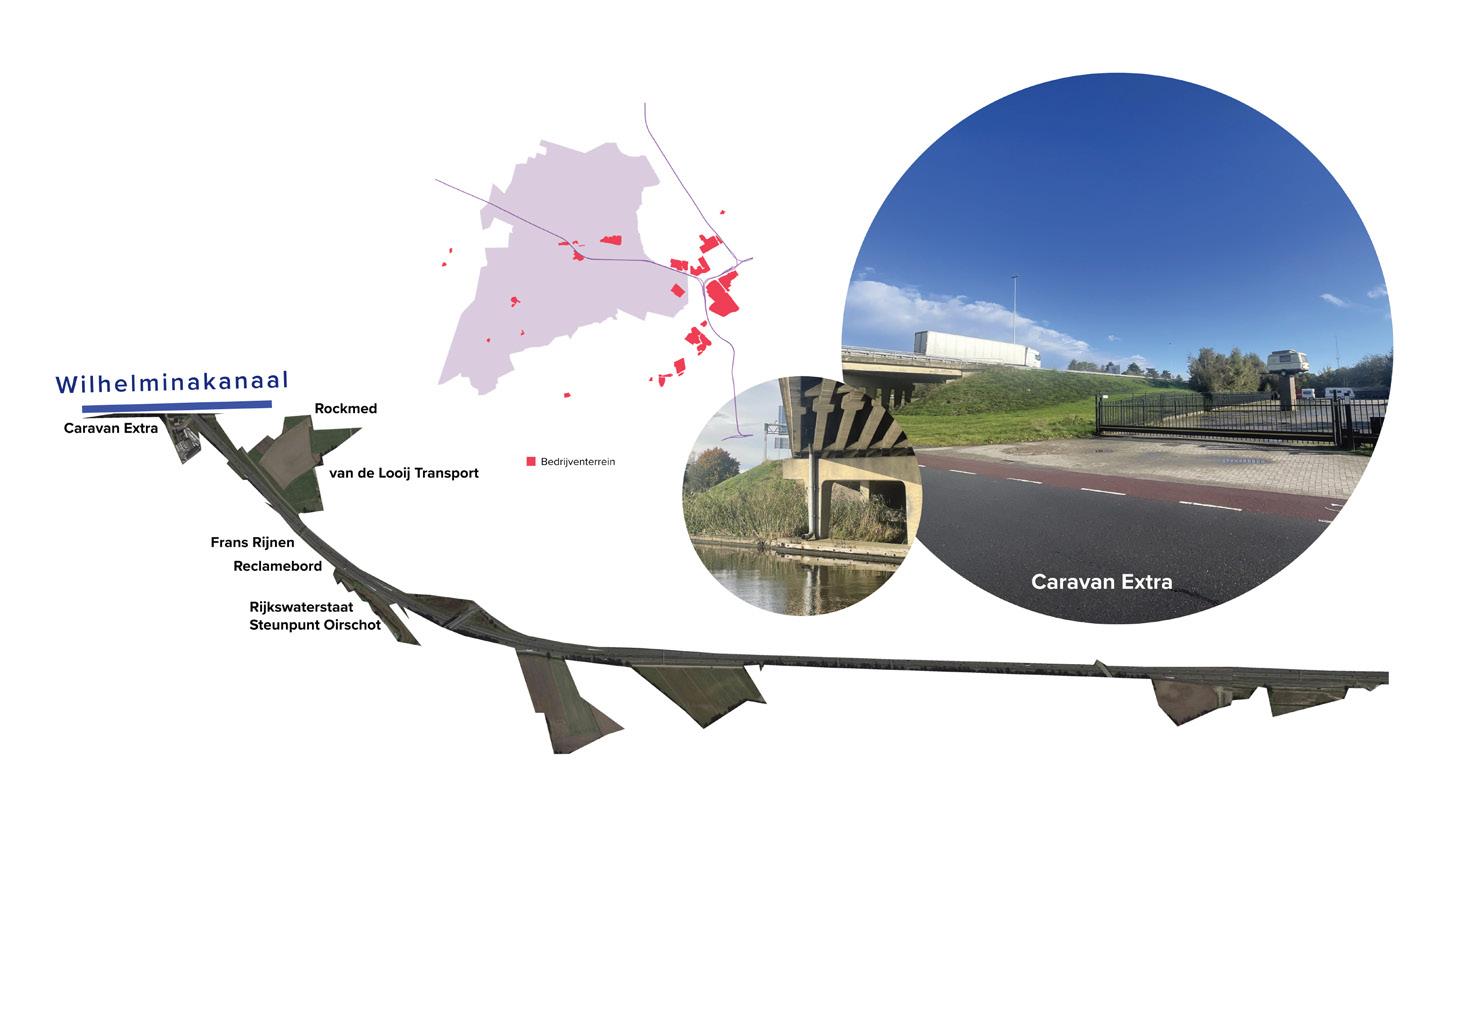
Figure 29: Vision lines from the A58 towards the Wilhelmina Canal. Industrial estates begin to come into view more prominently. Source: Google Earth and Google Street View. Visualization by Lucas Zoutendijk.
Figure 30: Vision lines from the highway starting at the Wilhelmina Canal. Increasingly larger industrial estates and overpasses come into view. Source: Google Earth and Google Street View. Visualization by Lucas Zoutendijk.
January 2025
Figure 31: Space-Movement and Sight Diagram. Source: The View from the Road by Donald Appleyard, Kevin Lynch, and John Myer.
Figure 32: Orientation Diagram that should be read from bottom to top. Source: The View from the Road by Donald Appleyard, Kevin Lynch, and John Myer.
Through this exploration using visual methods, we have been able to identify several interesting locations and actors. We conducted an inventory of actors connected to the issue of water imbalance through: spatial relationships (water direction, water flows, and water as transport); consumption relationships (personal use/households, industry, and cleaning); and dependency relationships. These actors include those experiencing water shortages, such as certain farmers and the military training area, those who see water as a barrier or view it as a connecting factor. An actor may fall into multiple categories; for example, a farmer who also has a dependency relationship with water. In the field research that we will present later, we will adjust the scope as needed in collaboration with actors in the area.
APPLICATION OF DIGITAL METHODS IN PARTICIPATORY RESEARCH
Traditionally, infrastructure projects initiated by government agencies rely on participatory techniques such as newsletters, reports, interviews, workshops, and focus groups. These techniques are often applied according to the participation ladder, which ranges from informing to the transfer of power (van Zutphen, 2019). However, these techniques often fall short in capturing insights related to the experiences or perceptions of citizens or in identifying existing initiatives.
Participatory methods are generally viewed as tools for collaboration and decision-making, but they can also be relevant for understanding what is important to citizens and for identifying small-scale initiatives that can be considered. Digital scraping is particularly interesting in this regard. This method can be used to analyze the discourse surrounding specific themes, thereby enhancing the context and relevance of participatory processes. When it comes to digital methods and related tools, the focus is on examining the discourse of residents about certain topics, whether or not connected to events or places (Digital Methods Initiative, 2014). Although research into social media data is widely used in the Digital Humanities, it remains relatively unexplored territory within the field of participatory design, especially in area-oriented planning.
In the book Participatory Design Theory: Using Technology and Social Media to Foster Civic Engagement (2018), Saba Golchehr and Naomi
Bueno de Mesquita presented the potential of digital methods for participatory research through their own case study. In our research within this project, we also applied a digital scraping tool that provides valuable insights into locations and individuals that may be relevant for visits and interviews, particularly when local intermediaries are still unknown. Our research has shown that it is beneficial to continue using this tool even after the initial field studies, allowing search terms to become contextually more relevant.
There remains significant potential in the use of digital methods in an integrated area project, both in the data collection phase and in the community development phase. There are undiscovered platforms and social networking services that can facilitate active virtual interactions while also supporting strong connections to physical locations. These opportunities provide valuable prospects for designers focused on engaging communities for sustainable participation.
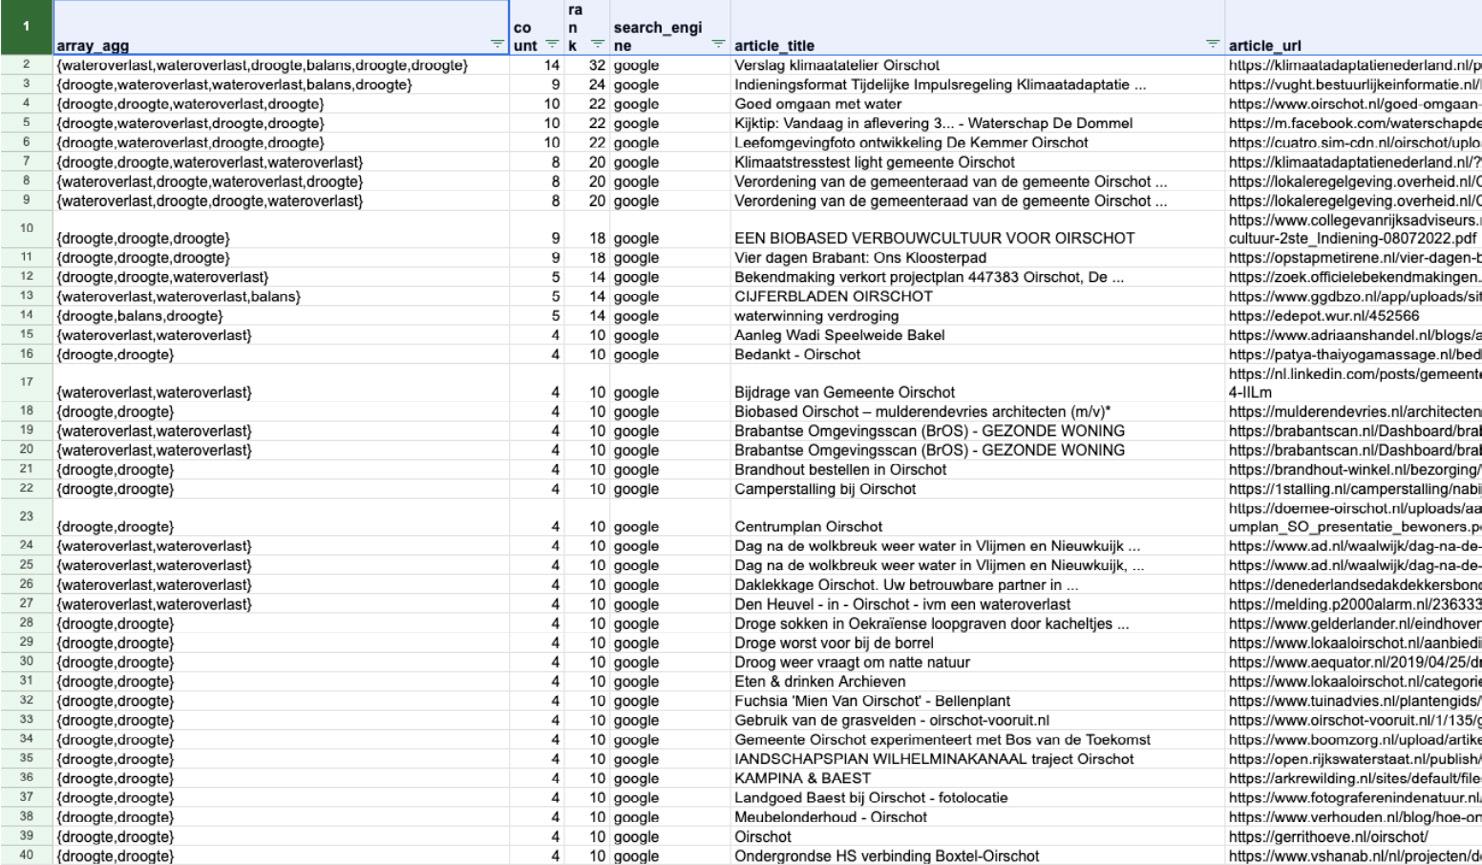
DIGITAL SCRAPING
Digital scraping allows us to gather data from online sources, aiding in the identification of water-related initiatives in and around our research area. This method can uncover important themes and initiatives that might otherwise go unnoticed or be more challenging to identify through other means.
The Source Distance Research method (see Figure 33) involves investigating the presence and ranking of specific sources in Google‘s search results using tools like Google Scraper and IssueDramaturg. In the first iteration, three search queries were conducted: „Oirschot water,“ „Spoordonk water,“ and „Beerze water,“ analyzing results from Google, Bing, and DuckDuckGo. This process led to the creation of a list of water-related keywords and initiatives, and discussions with a boundary spanner helped confirm the relevance and uncover new information. A critical observation was that certain perspectives are underrepresented in Google search results, which affects the relevance of information.
In a second iteration, we developed an extensive list of water-related keywords focused on specific issues such as flooding and drought. The search queries resulted in unique websites that were ranked
based on their frequency. The research employed search settings to locate local initiatives and themes.
In the third iteration, the focus broadened to include solutions and perspectives related to water retention and climate change. We conclude that using Google Scraping in the exploratory phase provides valuable insights and the opportunity to discover broader themes and initiatives, leading to a better understanding of the water management challenges in the region. However, this process also raises questions about the interpretation of personal data.
This method offers valuable suggestions for locations and individuals of interest to visit, especially when local intermediaries are still unknown. We have concluded that it is beneficial to continue using this tool even after the initial field studies, as this enables search terms to be better aligned with the context of the research. This facilitates the establishment of relevant connections and the formulation of more targeted questions, ultimately enhancing the effectiveness of subsequent research.
Figure 33: Small part of the list of the scraping conducted with corresponding results. Screenshot taken by Niene Boeijen
FIELD RESEARCH
PARTICIPATORY ACTION RESEARCH
Informed by the preliminary research with GIS and open data, Lucas defined four categories of actors that can play an important role in the water transition: farmers, businesses, residents, and nature. Additionally, he conducted an inventory of actors in the area concerning their quantity and dependence on water, which resulted in a comprehensive list of actors. Although these steps do not yield an exact priority list where certain actors stand out clearly above others, they do provide insights into the communities within the various themes and the „stake“ these parties have in a water transition.
Depending on that „stake,“ Lucas chose to select an appropriate tool for the interviews, such as an eliciting tool or speculative scenario. The interaction design process, unlike the scientific trajectory, focuses more on designing the methodology of interaction and is thereby more interventionist in nature. While a design researcher investigates a phenomenon, the research object is also shaped and directed in consultation with, for example, the local community. This approach— often referred to as Participatory Action Research—is particularly interesting in a context where direction is given to a more desired future and to „empowering“ local communities within it.
Lucas conducted interviews with the following parties: a plant nursery, a car wash, and an organic farmer.
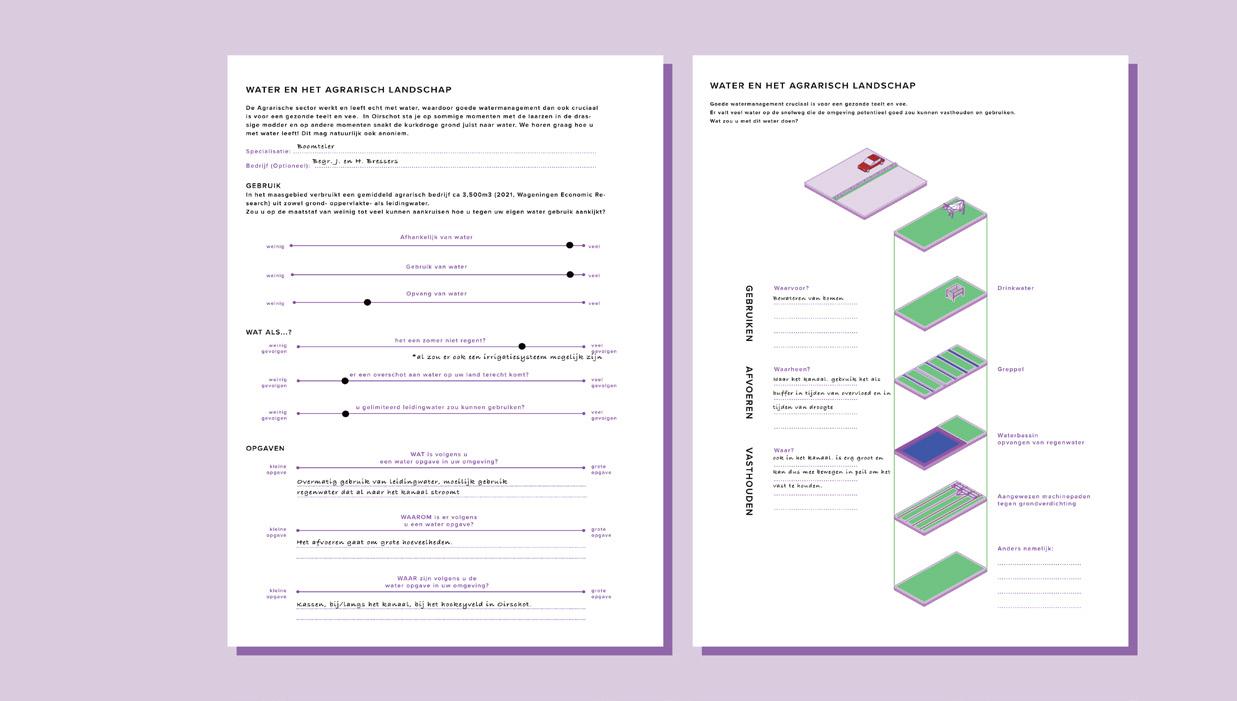
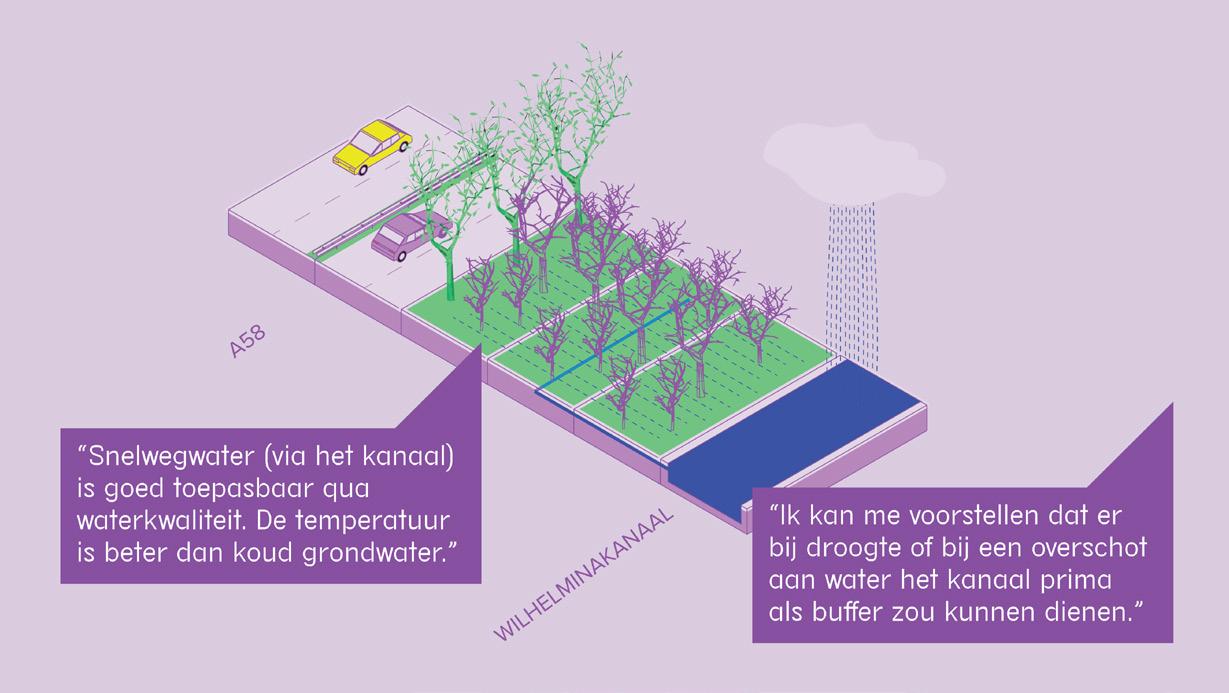
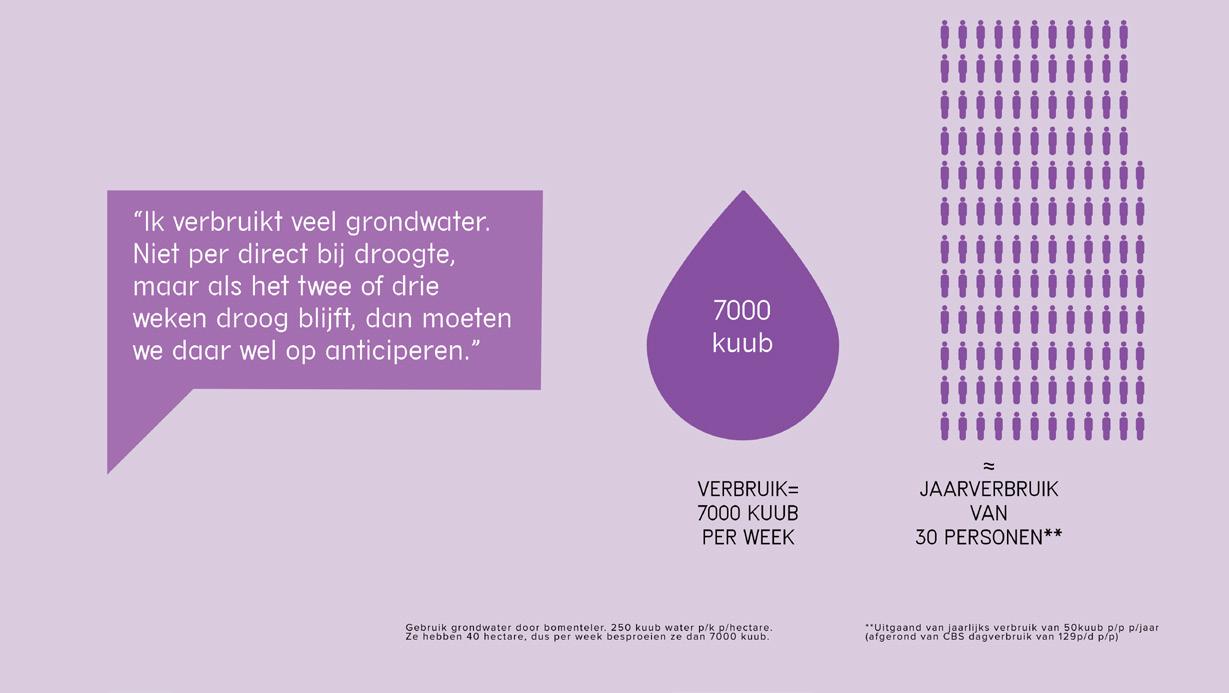
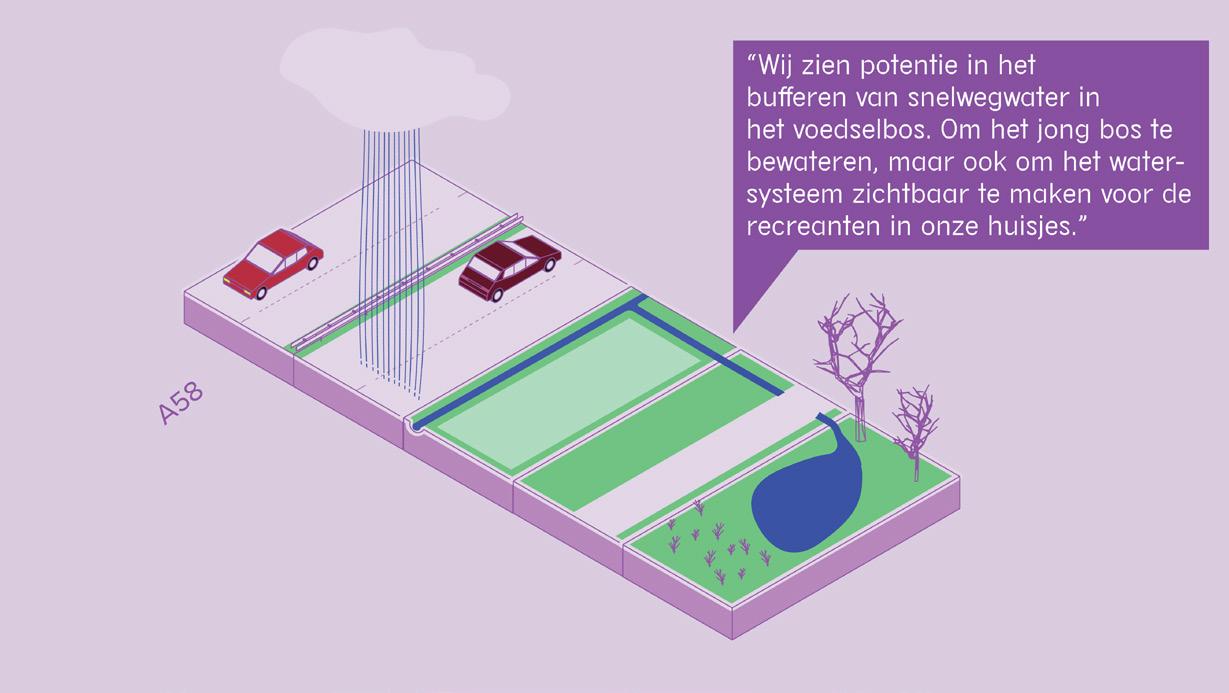
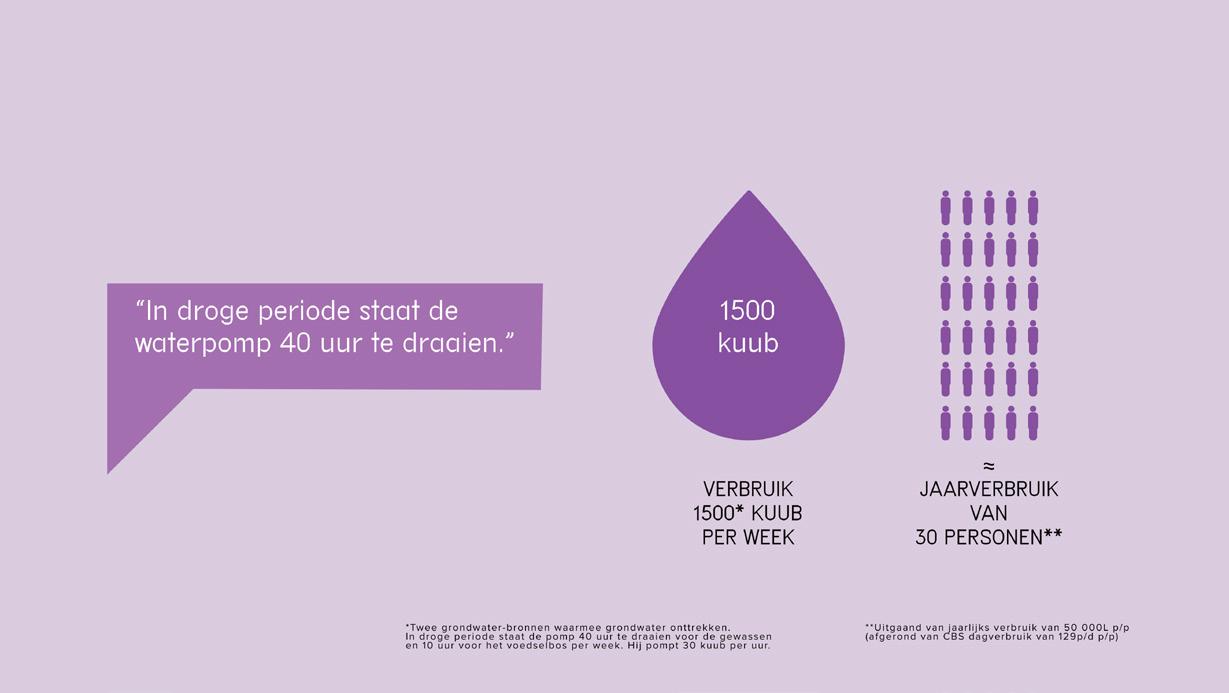
Due to its physical proximity to the highway and the canal, a plant nursery likely requires irrigation for the trees, although this water is not intended for consumption. The nursery consumes significant amounts of groundwater during dry periods, approximately 7,000 cubic meters per week (equivalent to the annual consumption of 30 people), drawn directly from the subsoil. During times of water surplus, the excess water from his plot drains into the canal through underground drainage pipes. Despite the substantial water usage, there is less urgent need to irrigate the trees. In scenarios of drought and water shortages, the trees do not die immediately; they simply grow very little, keeping the circumference of the tree trunk unchanged. This has negative long-term implications for the nursery‘s operations, although not immediately during dry periods. Furthermore, this party stands out because there are minimal requirements for water quality (in contrast to the stringent standards for irrigating crops intended for consumption). Consequently, using water from the highway to irrigate
the trees is a feasible option.
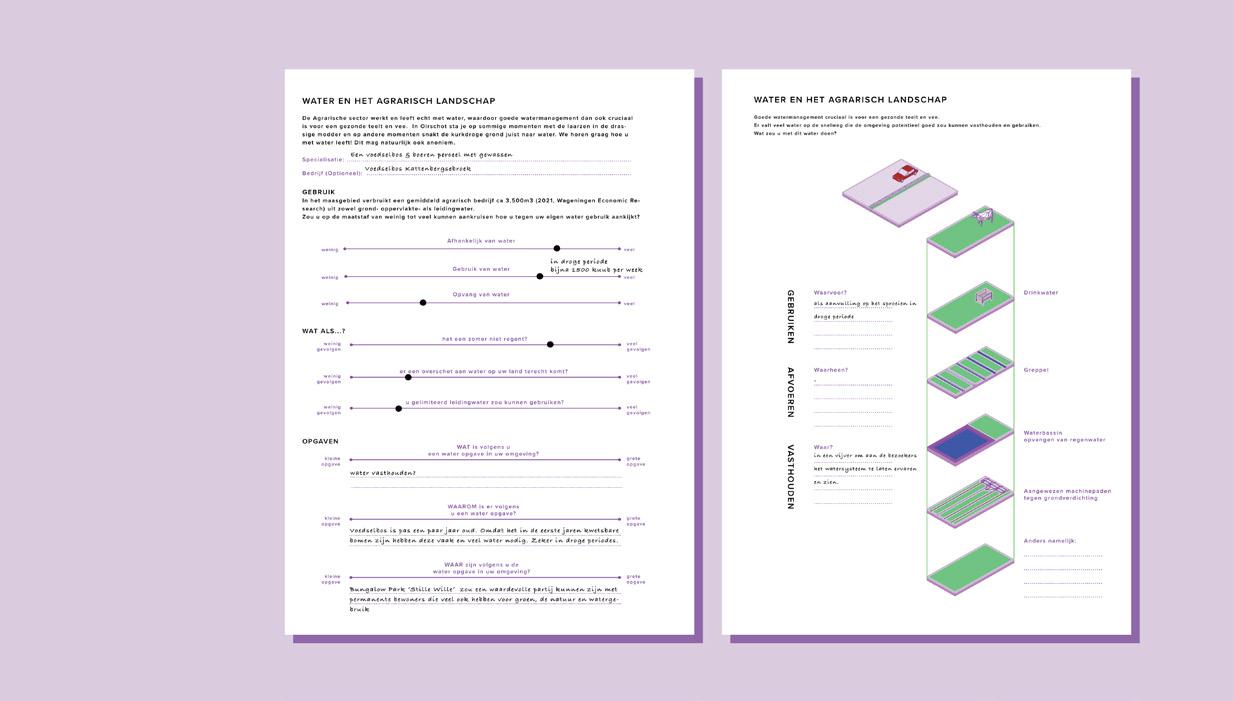
During the conversation with the nursery owner, an eliciting sheet was used (see Figures 34 to 37) to take him through a scenario and explore how he would respond to it. It became clear in the discussion that creating a water buffer or basin (above or below ground) would require vast quantities of water, which he did not envision immediately. However, he saw great potential in using the canal as a buffer. The water from the highway (along with other excess rain) could be stored in the canal, and during dry periods, he could use a pump to irrigate his nursery from the canal.
Figures 34 to 37: The eliciting sheet used by Lucas during the interview with the plant nursery. A „what if“ scenario was presented, and the nursery owner‘s response was subsequently recorded. This scenario was then developed into a visualization that could be used for further research.
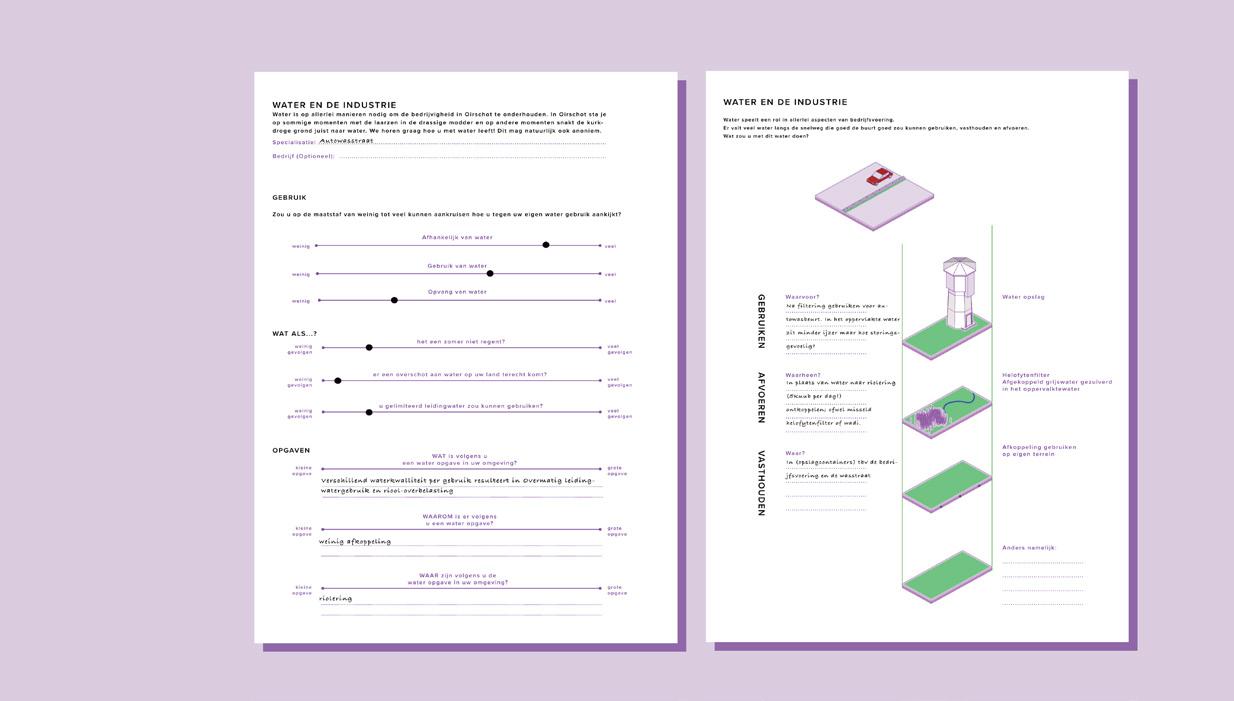
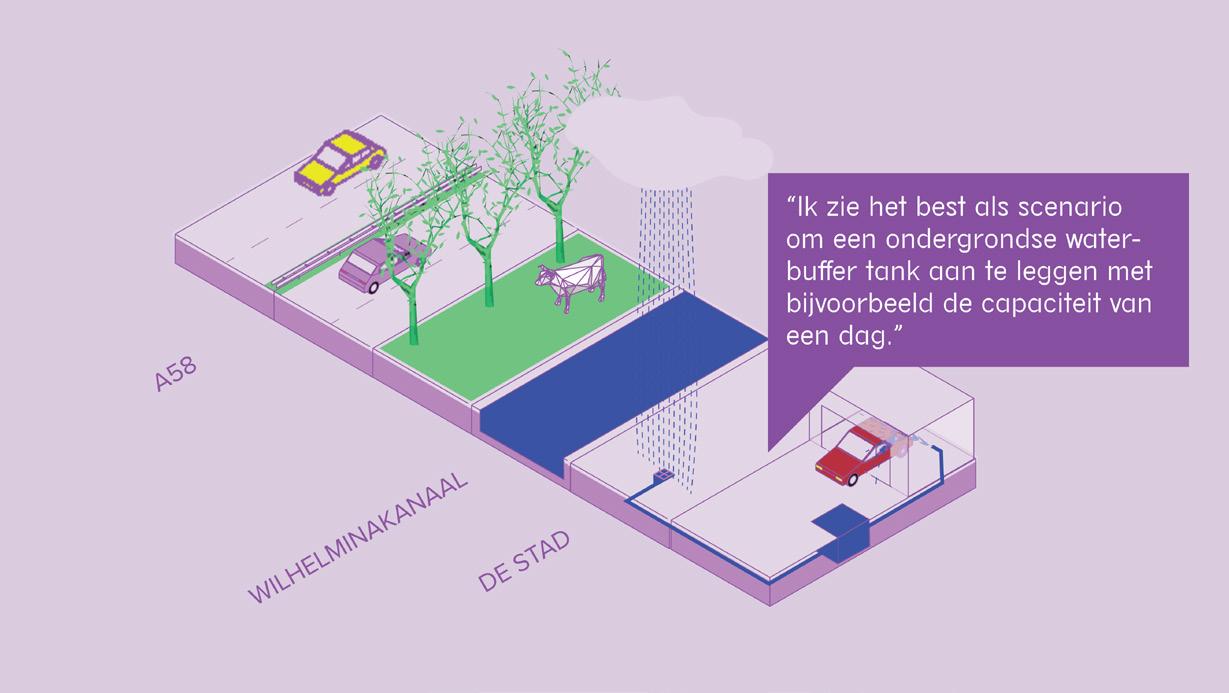
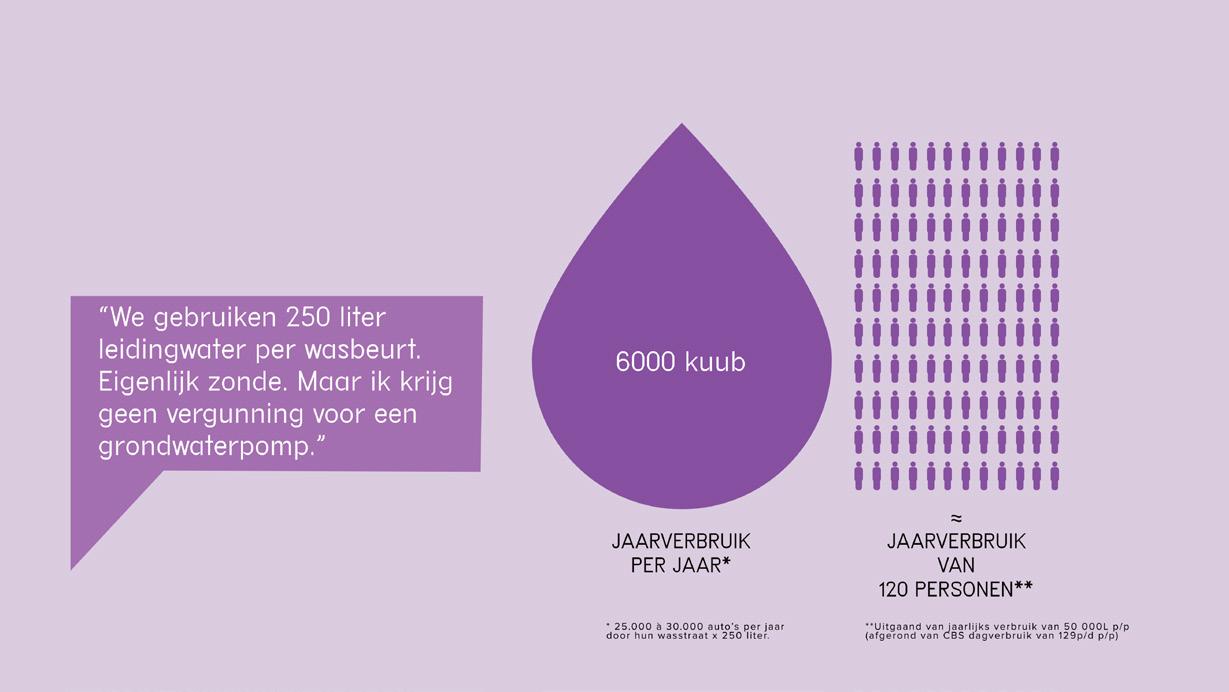
For the other interviews, Lucas used the same eliciting tool (see Figures 38 to 41). A car wash, located in one of the identified industrial areas, has a significant daily water consumption of 250 liters per wash, resulting in approximately 6,000 cubic meters of clean tap water used annually. The owner is open to new ideas, such as storing rainwater with an underground buffer for use in the car wash. There was also discussion about alternatives to prevent used water from entering the sewer system, which aligns with the idea of encouraging residents to disconnect downspouts and collect water in their gardens. This would reduce pressure on the sewer system. Additionally, there are opportunities to purify the used water with a natural filter of plants so that it can infiltrate and recharge the groundwater level. This actor could be of interest for our use case due to his substantial water usage without strict quality requirements.
Figures 38 to 41: Eliciting sheet used by Lucas during the interview with the owner of a car wash. A „what if“ scenario was presented, and the interviewee‘s response was subsequently recorded. This scenario was then developed into a visualization that could be used for further research.
An interview with an organic farmer (see Figures 42 to 45) led to the following insights: This farmer is heavily reliant on groundwater for his eight scattered plots in the Oirschot region. Since he cultivates above-ground crops intended for human consumption, the water quality requirements are strict. The groundwater is regularly sampled and tested by an external entity. The farmer expresses skepticism about using water from the highway, as he suspects it may be too contaminated. He considers it most beneficial for all highway water to be retained locally and allowed to infiltrate into the ground, which would not only purify the water but also replenish the groundwater level. Further exploration in later interviews with new eliciting tools could be valuable in challenging and potentially modifying the assumption regarding contaminated highway water.
Figures 42 to 45: Eliciting sheet used by Lucas during the interview with the organic farmer. A „what if“ scenario was presented, and the interviewee‘s response was subsequently recorded. This scenario was then developed into a visualization that could be used for further research.
ETHNOGRAPHIC RESEARCH
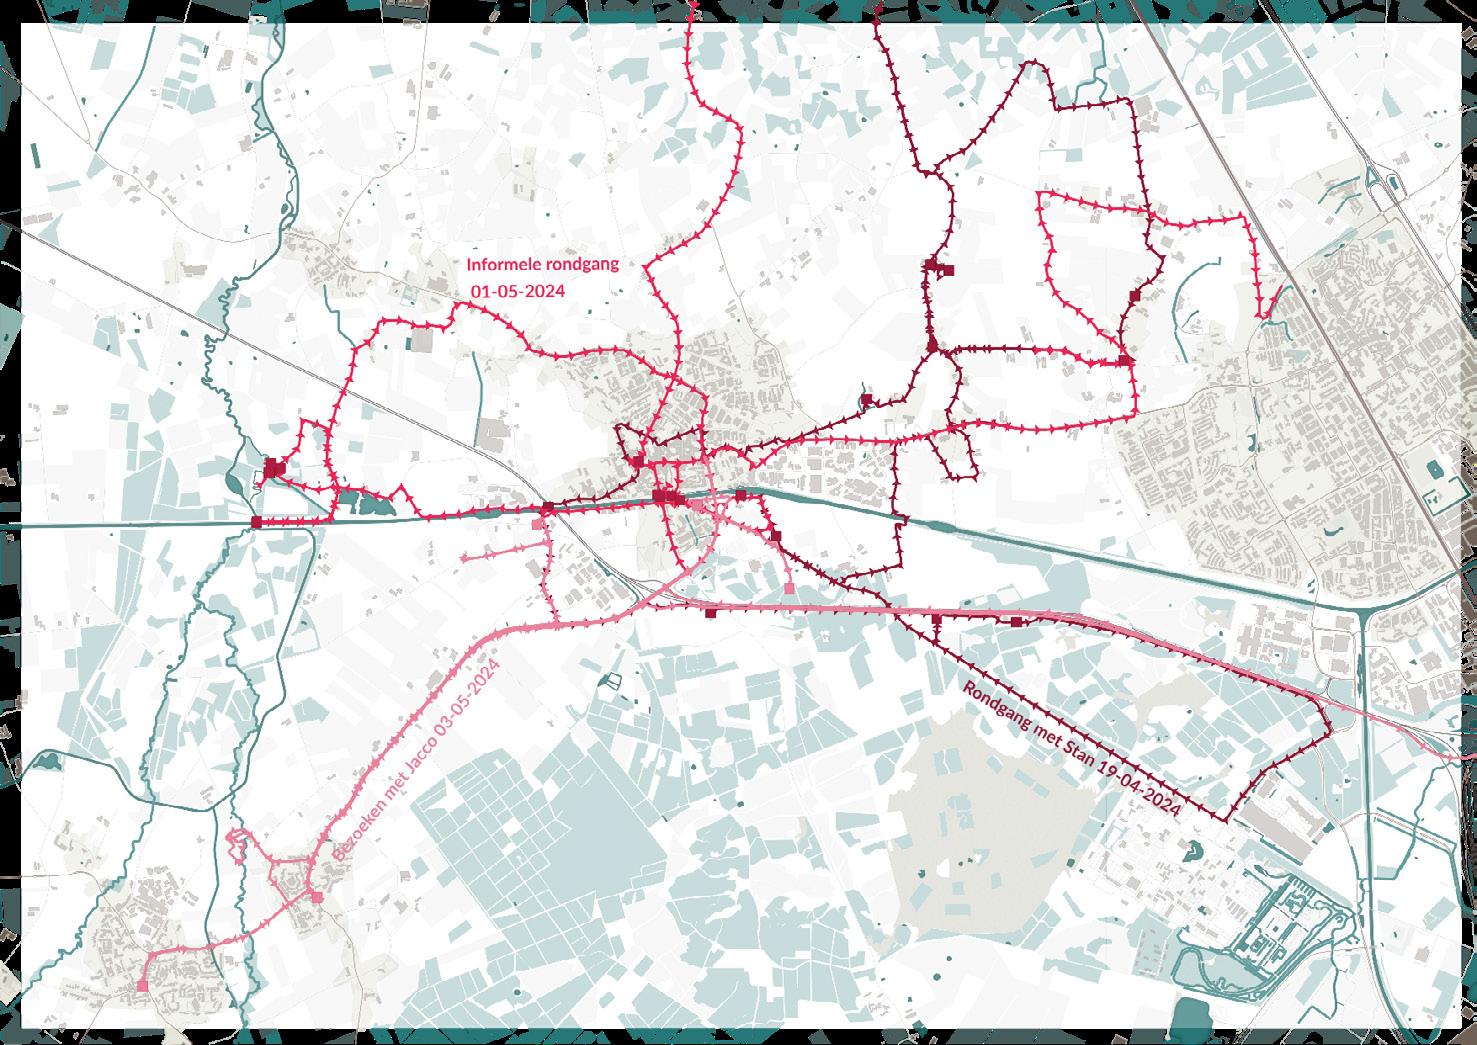
Research associate Niene Boeijen adopted a slightly different approach in the field research, taking a more ethnographic perspective. Prior to her exploration, she marked several locations for visit, including the canal, community center Aarle, Chapel de Heilige Eik, and waterway intersections. The choice of these places was largely based on desk research conducted using digital scraping. Additionally, she used the criterion of selecting locations where she had not previously engaged with boundary spanners in the area, allowing her the opportunity to gain new insights. Figure 46 shows the area where Niene conducted field research, both during her joint activities with boundary spanners and during her independent field research.
It is a warm day in May 2024. Niene ventures out alone, allowing herself to be guided by unexpected encounters and events in the area, without formulating questions in advance. She wears walking shoes, carries a camera, and has a notebook; this intentional choice in clothing/look is intended to raise people‘s curiosity about her activities, with the aim of encouraging them to approach her and initiate conversations.
Figure 46: Map highlighting the area where Niene conducted field research. Map created by Niene Boeijen.
Niene began her exploration at the information point in Oirschot, where she conducted an initial inventory of water- and nature-related themes in the area. During this stop, she was also pointed out the new bicycle bridge and the harbor location, both of which are important for further conversations and observations. She approached an 18-yearold boy at the tourist information point in the Market, located in the old town hall. When she asked him about water-related stories and issues, he first mentioned the lack of swimming locations nearby. When asked about the canal, he said, „Well, it’s just there,“ and noted that there is a triathlon held in the canal, near the new footbridge.
Additionally, the boy pointed out the landing stage at De Rijt and mentioned a rivalry between the neighborhoods above and below the canal. He had moved from the Oirschot neighborhood above the canal to a neighborhood below it. Although the rivalry is not strong, jokes are made about it. He couldn‘t precisely explain the cause of this rivalry but noted that the highway has a different impact than the canal. Furthermore, he reported issues with waterlogging, where streets flood and the parking garage even fills up. The nearby natural areas are wet and muddy but still accessible.
[ THE WATERANGEL ]
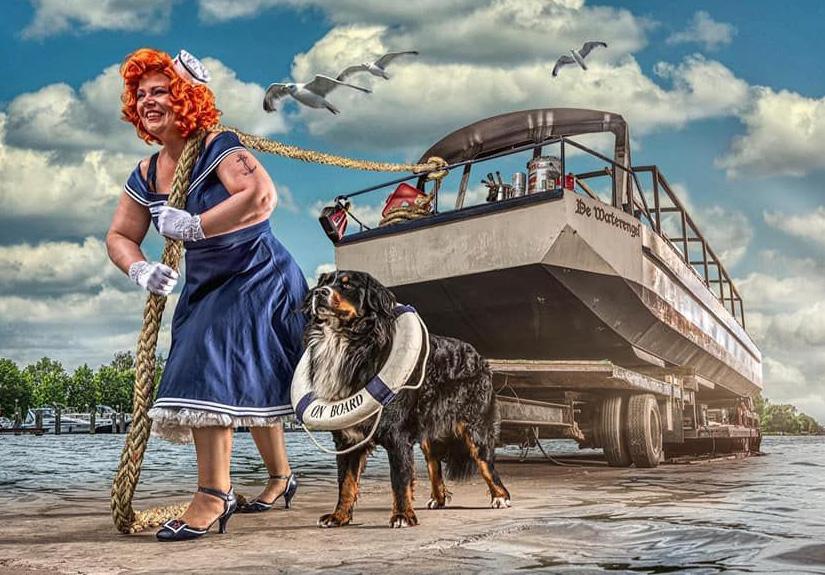
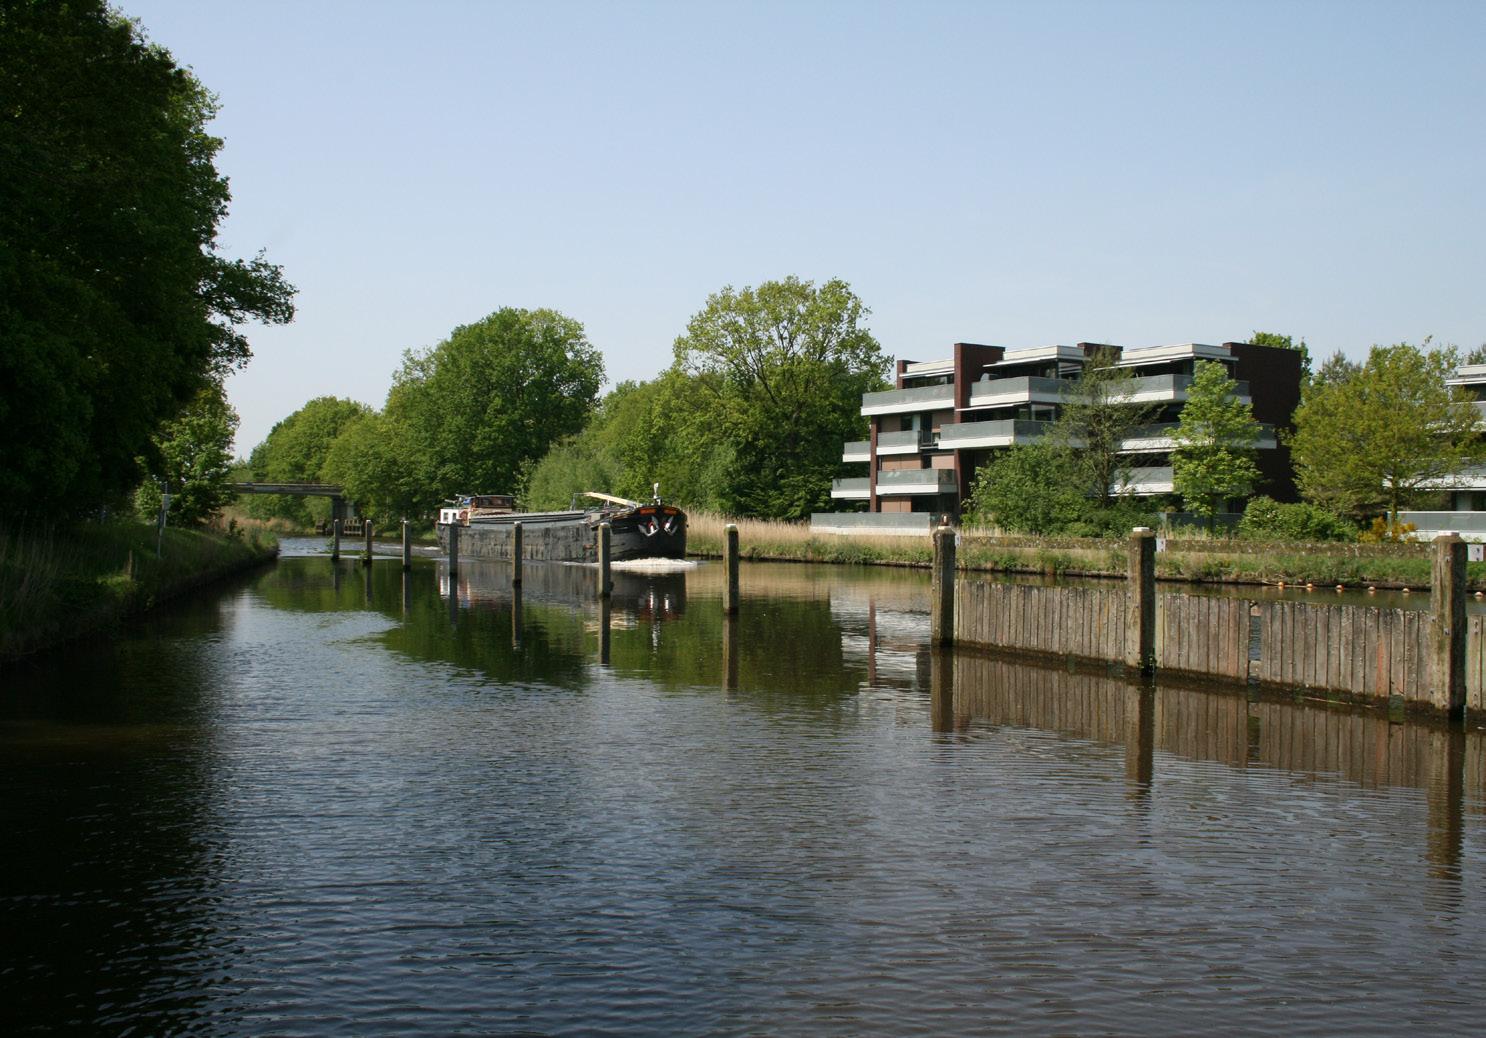
At the municipal harbor on the canal, along De Rijt, Niene met the initiator and owner of De Waterengel (see Figure 47), a wheelchairfriendly tour boat service. The woman mentioned that they recently obtained the permit to operate the harbor. However, the harbor, which was constructed by the municipality in 2009 with the intention of promoting more water recreation, is not optimal; it is neither deep nor wide enough and lacks essential facilities. Nevertheless, the harbor offers opportunities, especially now that the canal is gaining popularity. With De Waterengel, this woman can offer unique boat tours, including programs for people with dementia, which have garnered significant interest.
However, across from the harbor, there is a significant conflict with residents of De Heeren van Oirschot (see Figure 48), who are concerned about potential nuisances, despite the harbor existing before their apartments were built. Despite groundless objections, many parties and consultation procedures are involved, with the new municipal council supporting the plans. The situation illustrates both the potential of the canal for recreation and the resistance from local residents that complicates its use.
Figure 47: Image of owner Nancy van Heeswijk from the website of De Waterengel. Source: https://dewaterengel.nl/
Figure 48: Tour boat De Waterengel. Photo taken by Niene Boeijen.
[ FROGS AND ORCHIDS ]
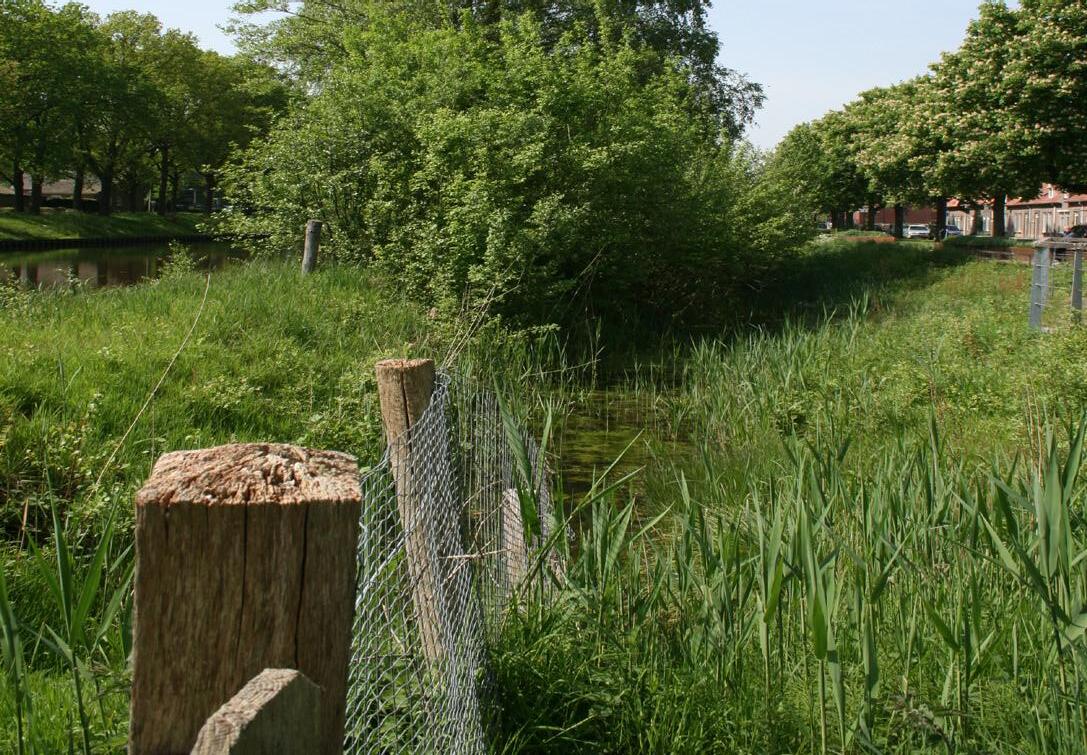
At the bicycle bridge, an elderly lady catches Niene‘s attention as she gazes at the water, expressing her concerns about the absence of frog spawn (see Figure 49), which, according to her, should have normally appeared by this time. She is not alone in her worries: the two residents whom Niene decides to ask follow-up questions to live nearby and keep a close watch on the ponds next to the canal, a place that was once teeming with lively frogs but now seems to be increasingly empty due to drought and the disruption caused by the new bicycle bridge. The stories they share are filled with frustration and sadness; frogs and wild orchids, once abundantly present, are disappearing due to human intervention and unnatural conditions.
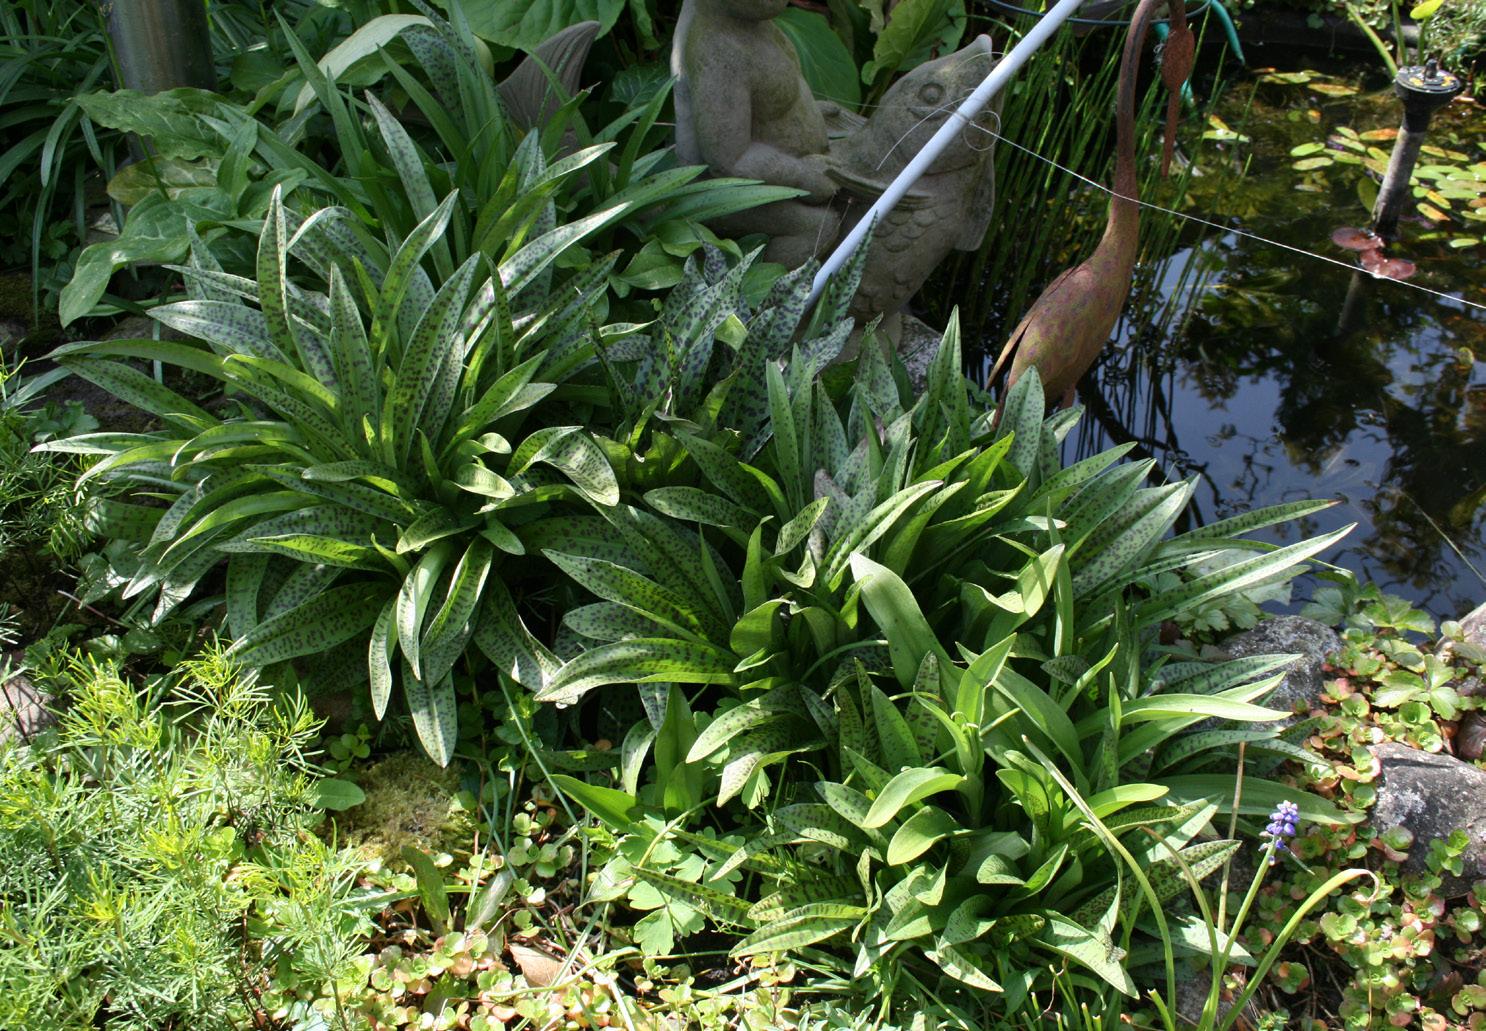
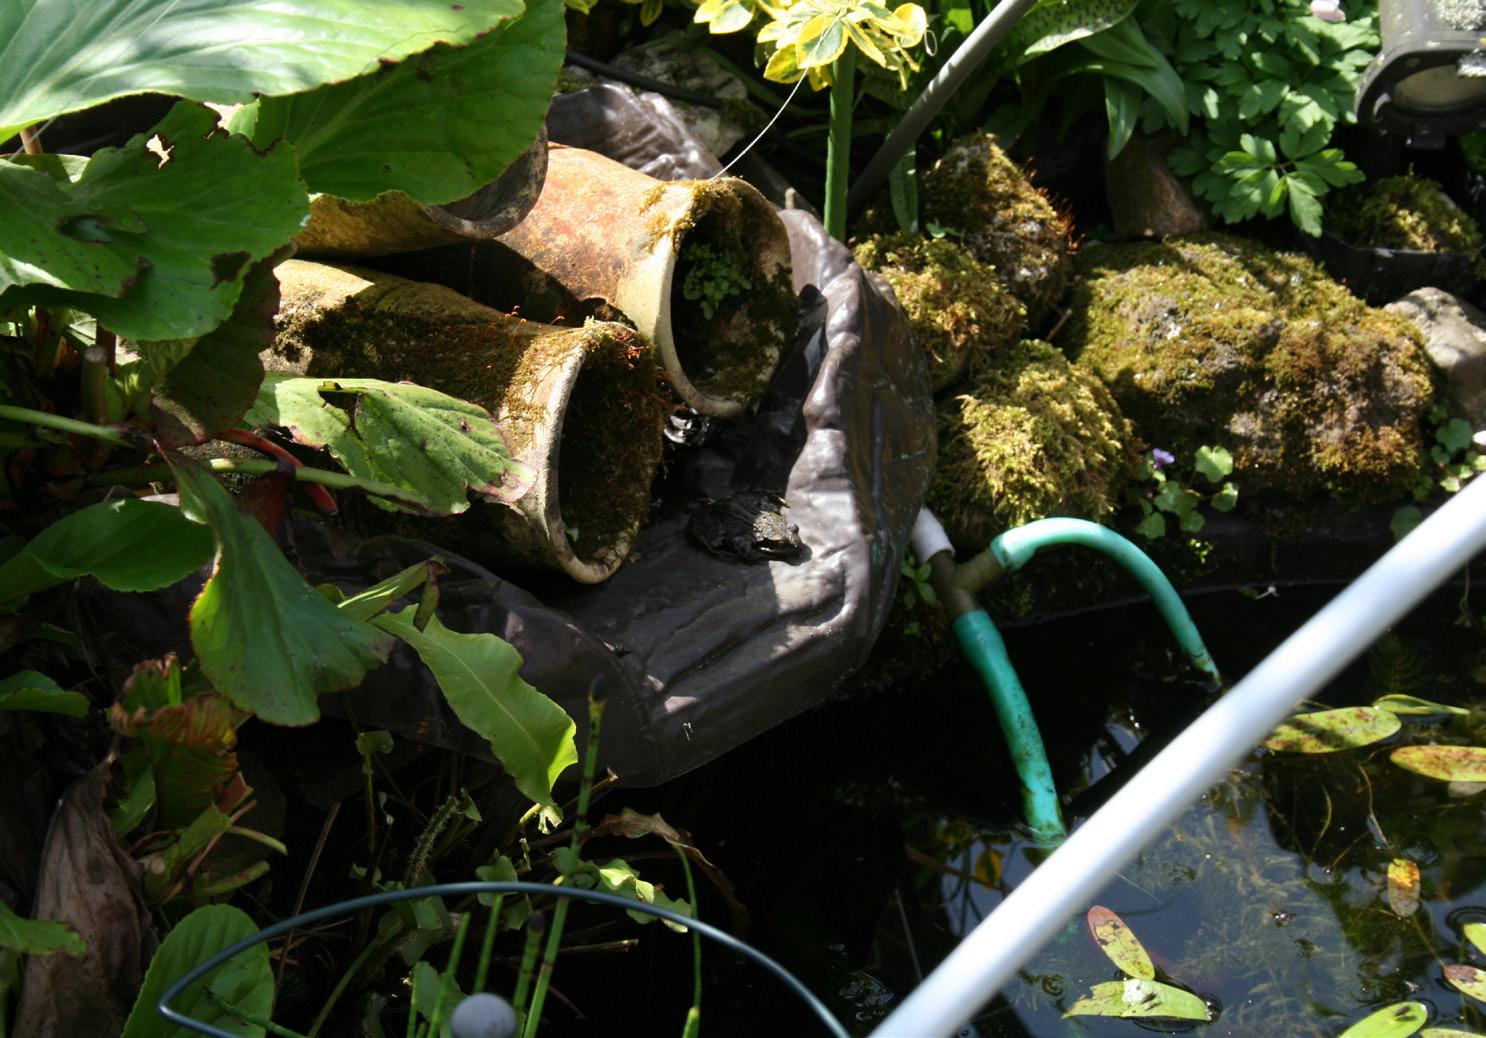
The lady nostalgically recounts her youth on Oude Grintweg, where wild orchids flourished, and her anger over the loss of these natural treasures is palpable. However, she has a glimmer of hope; one orchid from her old garden has been planted in her new home, which has now grown into a beautiful collection (see Figures 50 and 51). The gentleman has also attempted to propagate orchids, but the construction of the bicycle bridge has had a devastating impact there as well. Their stories reflect a deep-rooted connection to nature but also a growing discontent with the changes threatening local ecosystems. The elderly, with their rich local knowledge, share their experiences and memories, but they face limitations in navigating a world that increasingly overlooks their familiar reference points.
Figure 49: The spot where Niene spoke with the elderly lady. Photo taken by Niene Boeijen.
Figures 50 and 51: Photos of the orchids and frogs that the residents have given a new place in their garden. Niene was invited by the resident. Photos taken by Niene Boeijen.
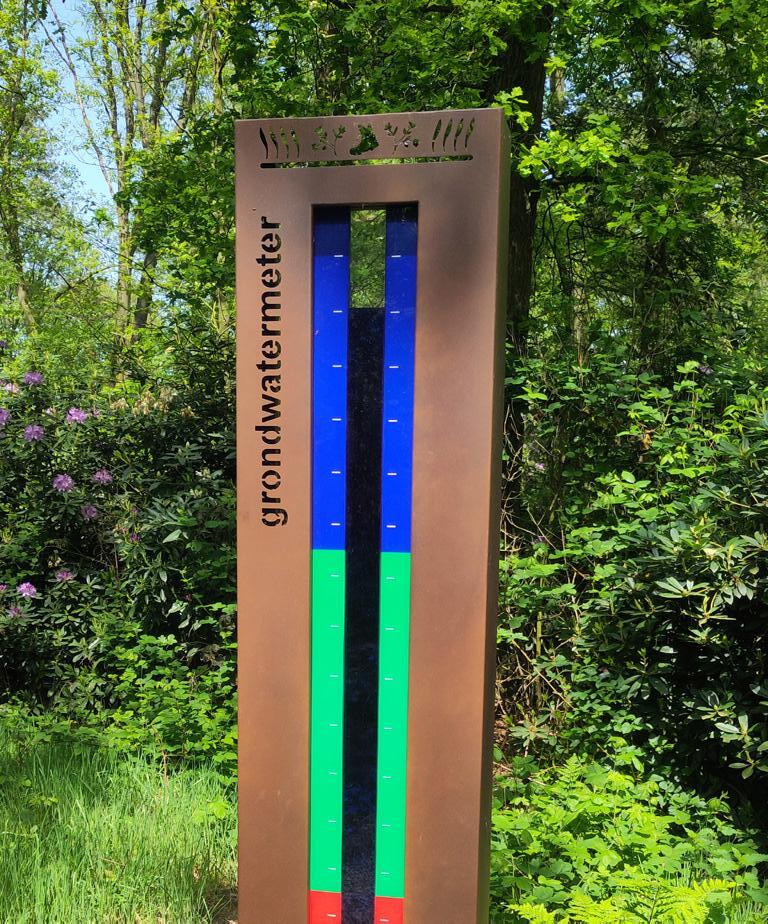
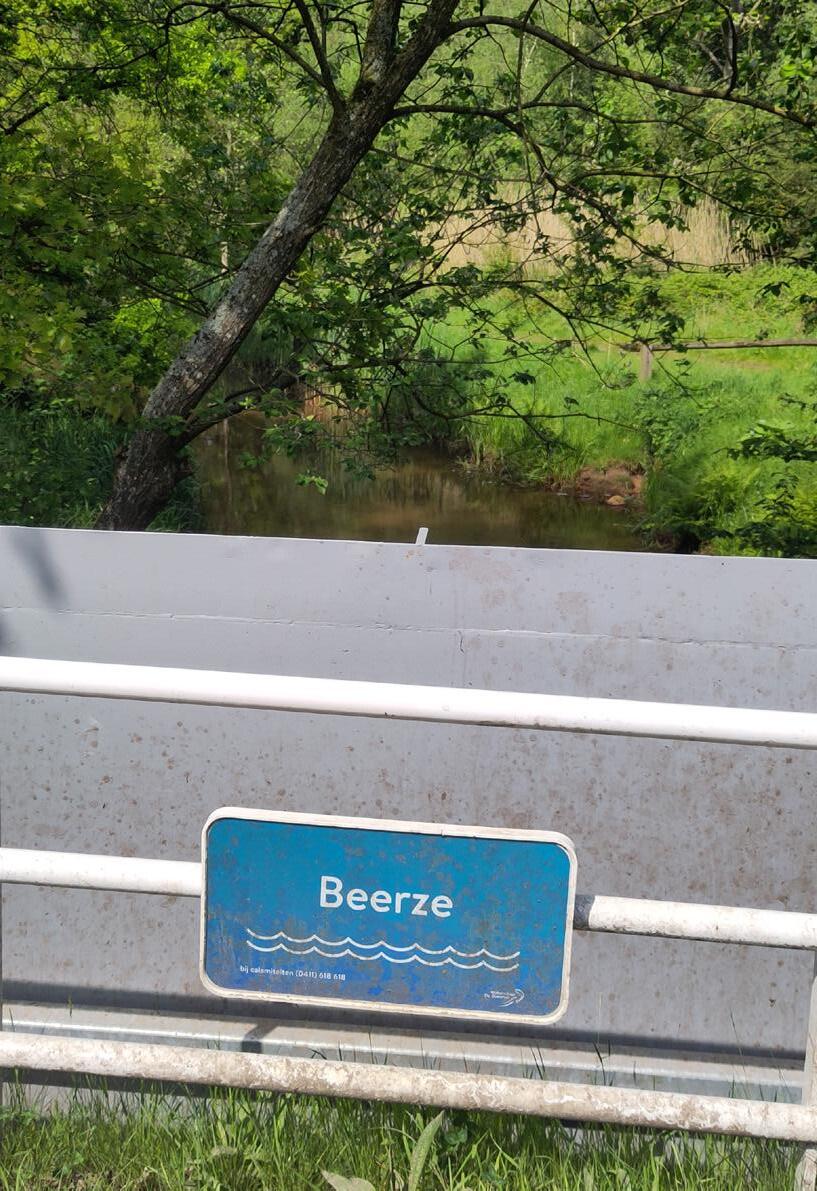
While walking through the area, Niene came across several interesting findings, including a groundwater meter (Figure 52) near the chapel where the first mass of the year took place, and a small sign indicating the location where the Beerze crosses the canal (Figure 53). The latter is a hydrologically interesting point that tells a story about the relationship between nature and human interventions. Where nature once sought its path freely, the landscape has now been altered by human actions, leading to an unnatural flow of water. Despite the bustle of cyclists on the path along the canal, this spot seems largely unnoticed; the Beerze is often overlooked, even though it forms a valuable connection between two bodies of water.
While sharing her experiences with a boundary spanner in the area, Niene noticed that he immediately understood what she meant, raising the question of whether more people are aware of this place and its significance. The absence of activities or notable features at first glance makes it easy to forget that this location was once an important natural ecosystem. The question of the value of this place lingers, prompting reflection on the impact of the altered watercourse on both the environment and the local community. The crossing of the Beerze is not only a physical point in the landscape but also a symbol of the complex challenges that arise when human development conflicts with natural processes. These elements could be utilized as a „conversation piece“ in further research.
Figure 52: A groundwater meter as a possible conversation piece?
Figure 53: The Beerze, a symbolic place of connection between two bodies of water.
ACTOR MAPPING
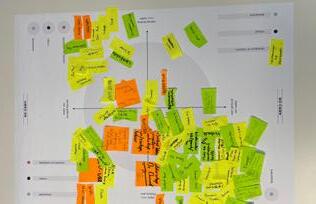
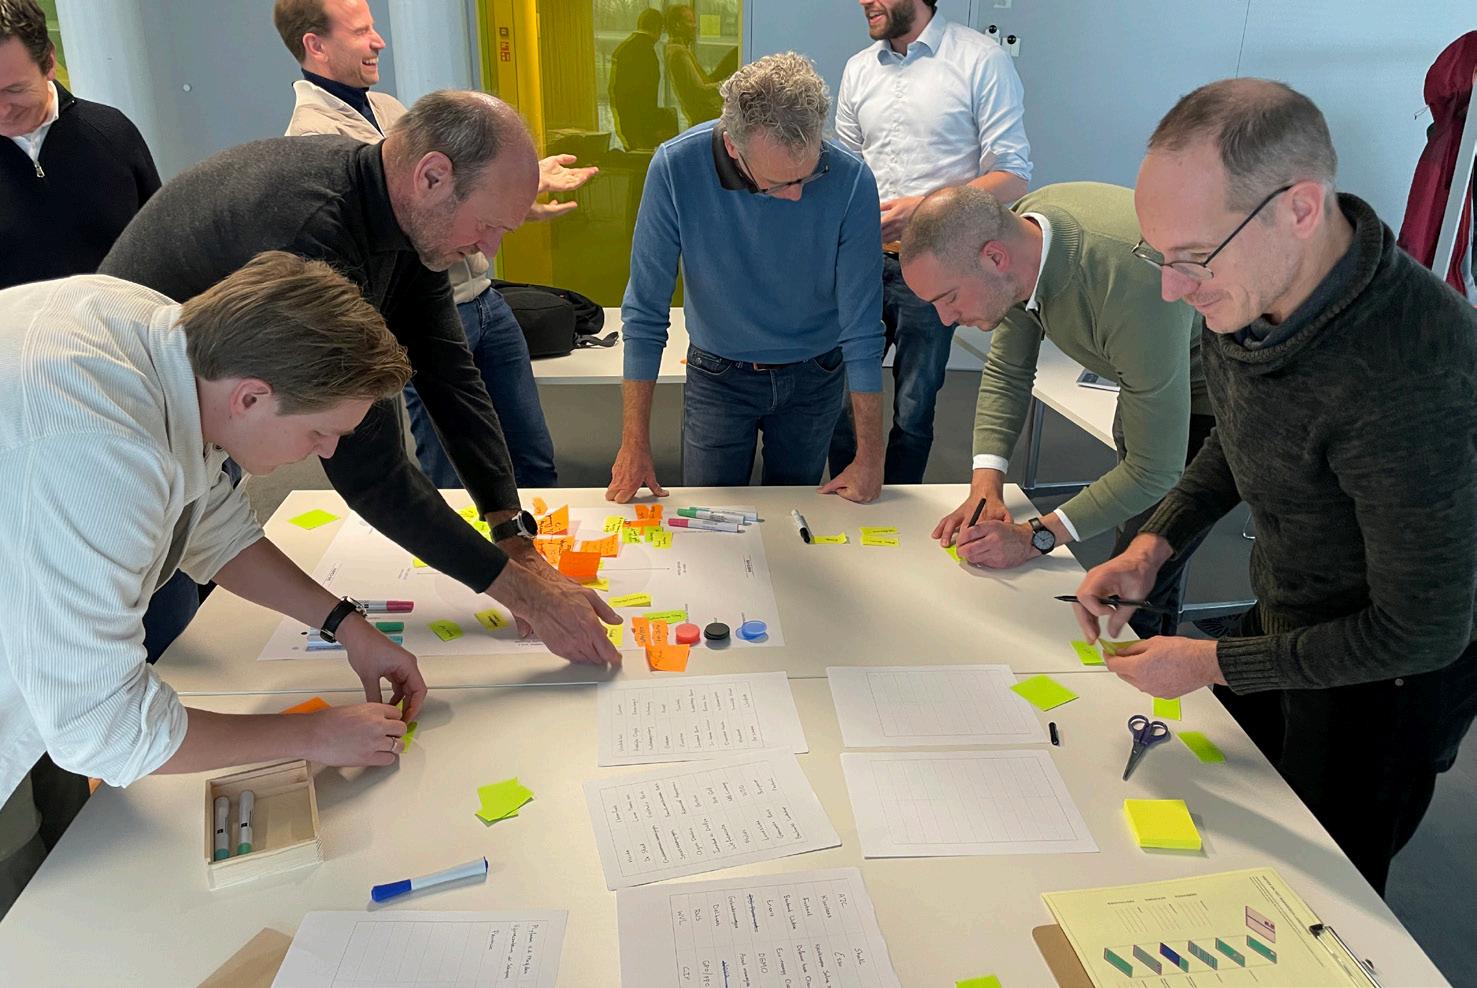
After identifying actors in four categories: farmers, residents, businesses, and nature, we organized a joint session with RWS, RUG, CK, and DAE to plot these actors on a two-dimensional axis during a workshop session at Rijkswaterstaat in Utrecht.
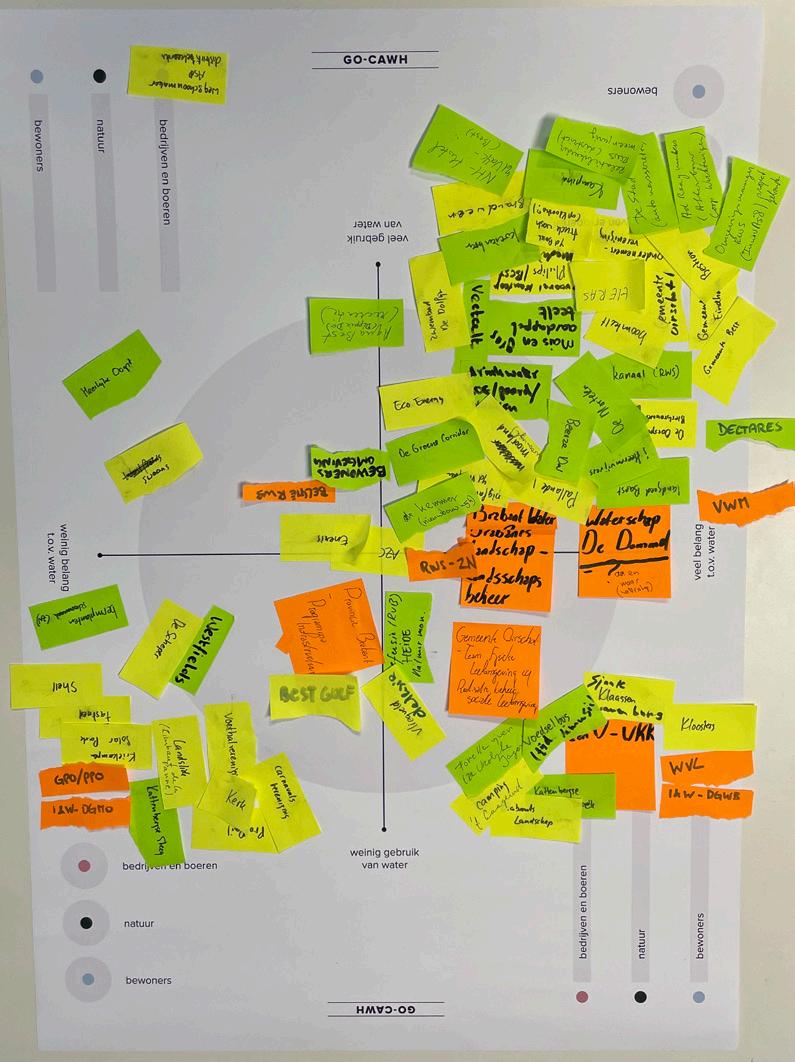
The horizontal axis represents ‚little interest in water‘ versus ‚significant interest in water,‘ while the vertical axis reflects ‚little water consumption‘ versus ‚significant water consumption.‘ With this approach, we aimed to make an initial assessment of the interest and importance of each actor concerning water-related issues from the various perspectives (institutional, community, and participatory) of the participants in this mapping (see Figure 54). For instance, farmers, who use relatively large amounts of water, hold significant interest in this matter, while households have lesser interest. On the other hand, nature, represented by entities such as trees, uses relatively little water but still has an interest in the problem and may not be adequately represented by a specific actor. An interesting question is which actors we have in view and how we position them from the perspective we represent.
During the workshop, there was a need for clarification regarding the chosen criteria for the axes. Questions arose about why these criteria were selected and what the labels meant in terms of quantity (for example, what is considered ‚much‘). A key finding was that a large majority of the actors fell into the quadrant of high water consumption and significant interest in water (see Figures 55 and 56). Further exploration of this category in the next step would be desirable. This exploration could include a more accurate assessment of water consumption and quality, as well as evaluating the capacity of the involved parties to address the issue (whether it be a shortage or an excess) independently, identifying interdependency relationships, and establishing criteria for grant eligibility.
Figure 54: Actor mapping at Rijkswaterstaat in Utrecht with RUG, CK, and DAE.
The greater value of this exercise lay not so much in the outcome of the map but in the discussions it facilitated. It served as a means to explore how the three perspectives within this project relate to one another. Some insights that emerged from this process include that the institutional perspective primarily focuses on existing actors, structures, and established pathways, while the local perspective centers on individuals who organize around a shared interest. In contrast, the participatory perspective is more attuned to initiatives that have not yet come to the forefront but may be potentially interesting. Ideally, a joint definition of the axis system would allow for a clear differentiation between institutional and participatory approaches. This process should also provide insight into the reasoning behind the selection of certain actors.
Figure 55: Outcome of actor mapping at Rijkswaterstaat in Utrecht with RUG, CK, and DAE.
PARTICIPATORY MAPPING
Participatory Mapping is often described as a spectrum of collaboration, co-decision-making, and the transfer of power. However, participatory mapping can also serve as a way to explore what is happening within a community and to experiment with different perspectives. In our case, we organized participatory mapping workshops at various points with this goal in mind: having the international partners practice with the different perspectives. Here, we describe a workshop we conducted with international partners in Karlsruhe.
For the broader research question outlined at the beginning of this document, which we are submitting with partners in Belgium, Germany, France, Switzerland, and Ireland, three partner sessions have been organized in different countries throughout the research. Each country addresses its own case and challenges, but the common goal is to ensure that technological innovations (such as draining, filtering, and cleaning road water for reuse) are complemented by social innovations (like climate-adaptive water hubs developed with and for the community).
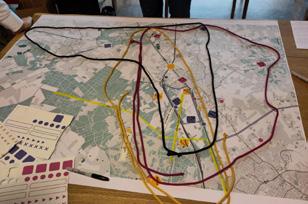
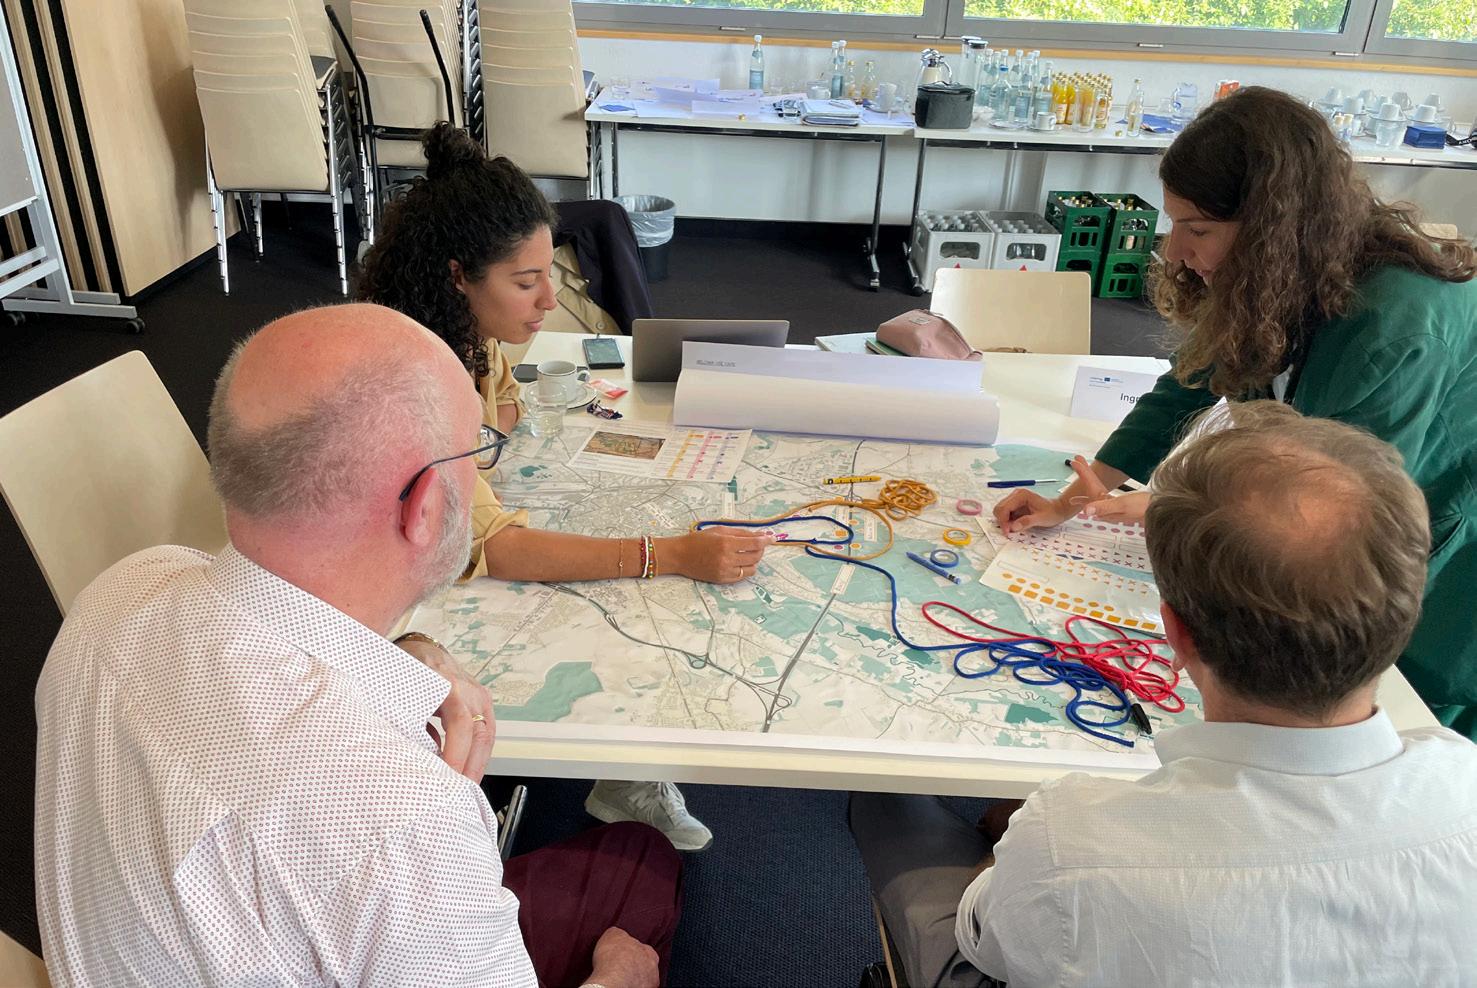
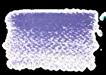
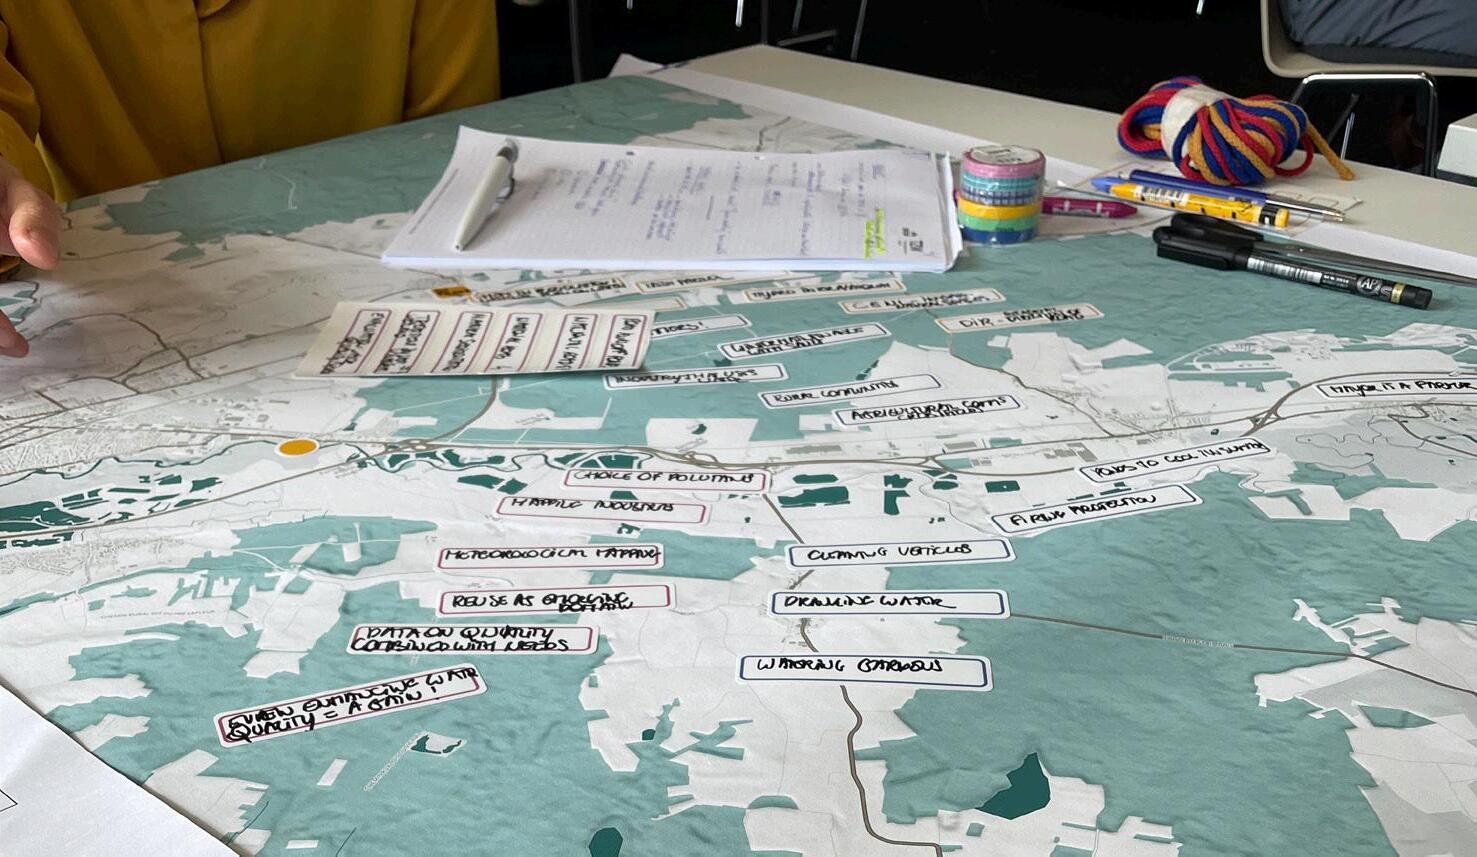
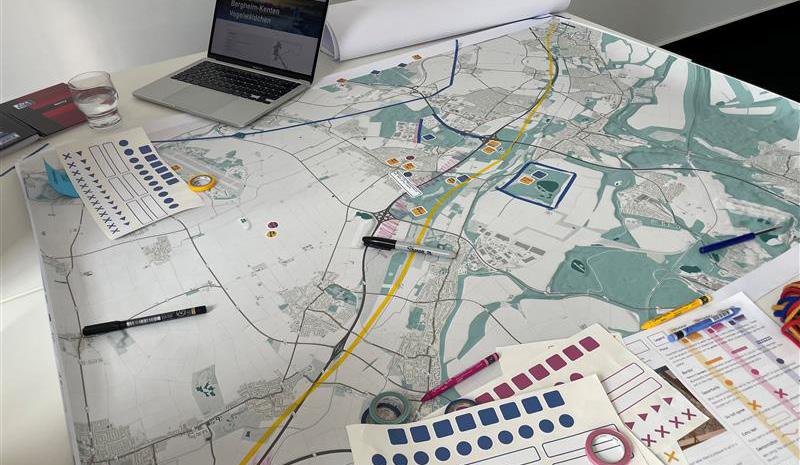
For the live partner meeting in Karlsruhe in June 2024, Naomi Bueno de Mesquita organized a participatory mapping workshop (see Figure 57) with tools that were prepared and designed by Niene Boeijen. For each use case, a map of the relevant area was distributed (see Figures 58 to 63 for the area maps of all use cases).
The mapping workshop was designed to facilitate an in-depth exploration of community engagement in area-oriented planning by practicing with three different perspectives: local, participatory, and institutional. The session aimed to provide insight into how these perspectives and their approahces influence area development strategies, particularly within the framework of the Sponge Works project.
The workshop utilized three different maps for each case study: an infrastructure map, a stakeholder map, and an area map, allowing participants to gain a comprehensive overview of the context in which they were operating.
the live partner meeting in Karlsruhe in June 2024.
Figure 57: Participatory mapping during
Photo taken by Naomi Bueno de Mesquita.
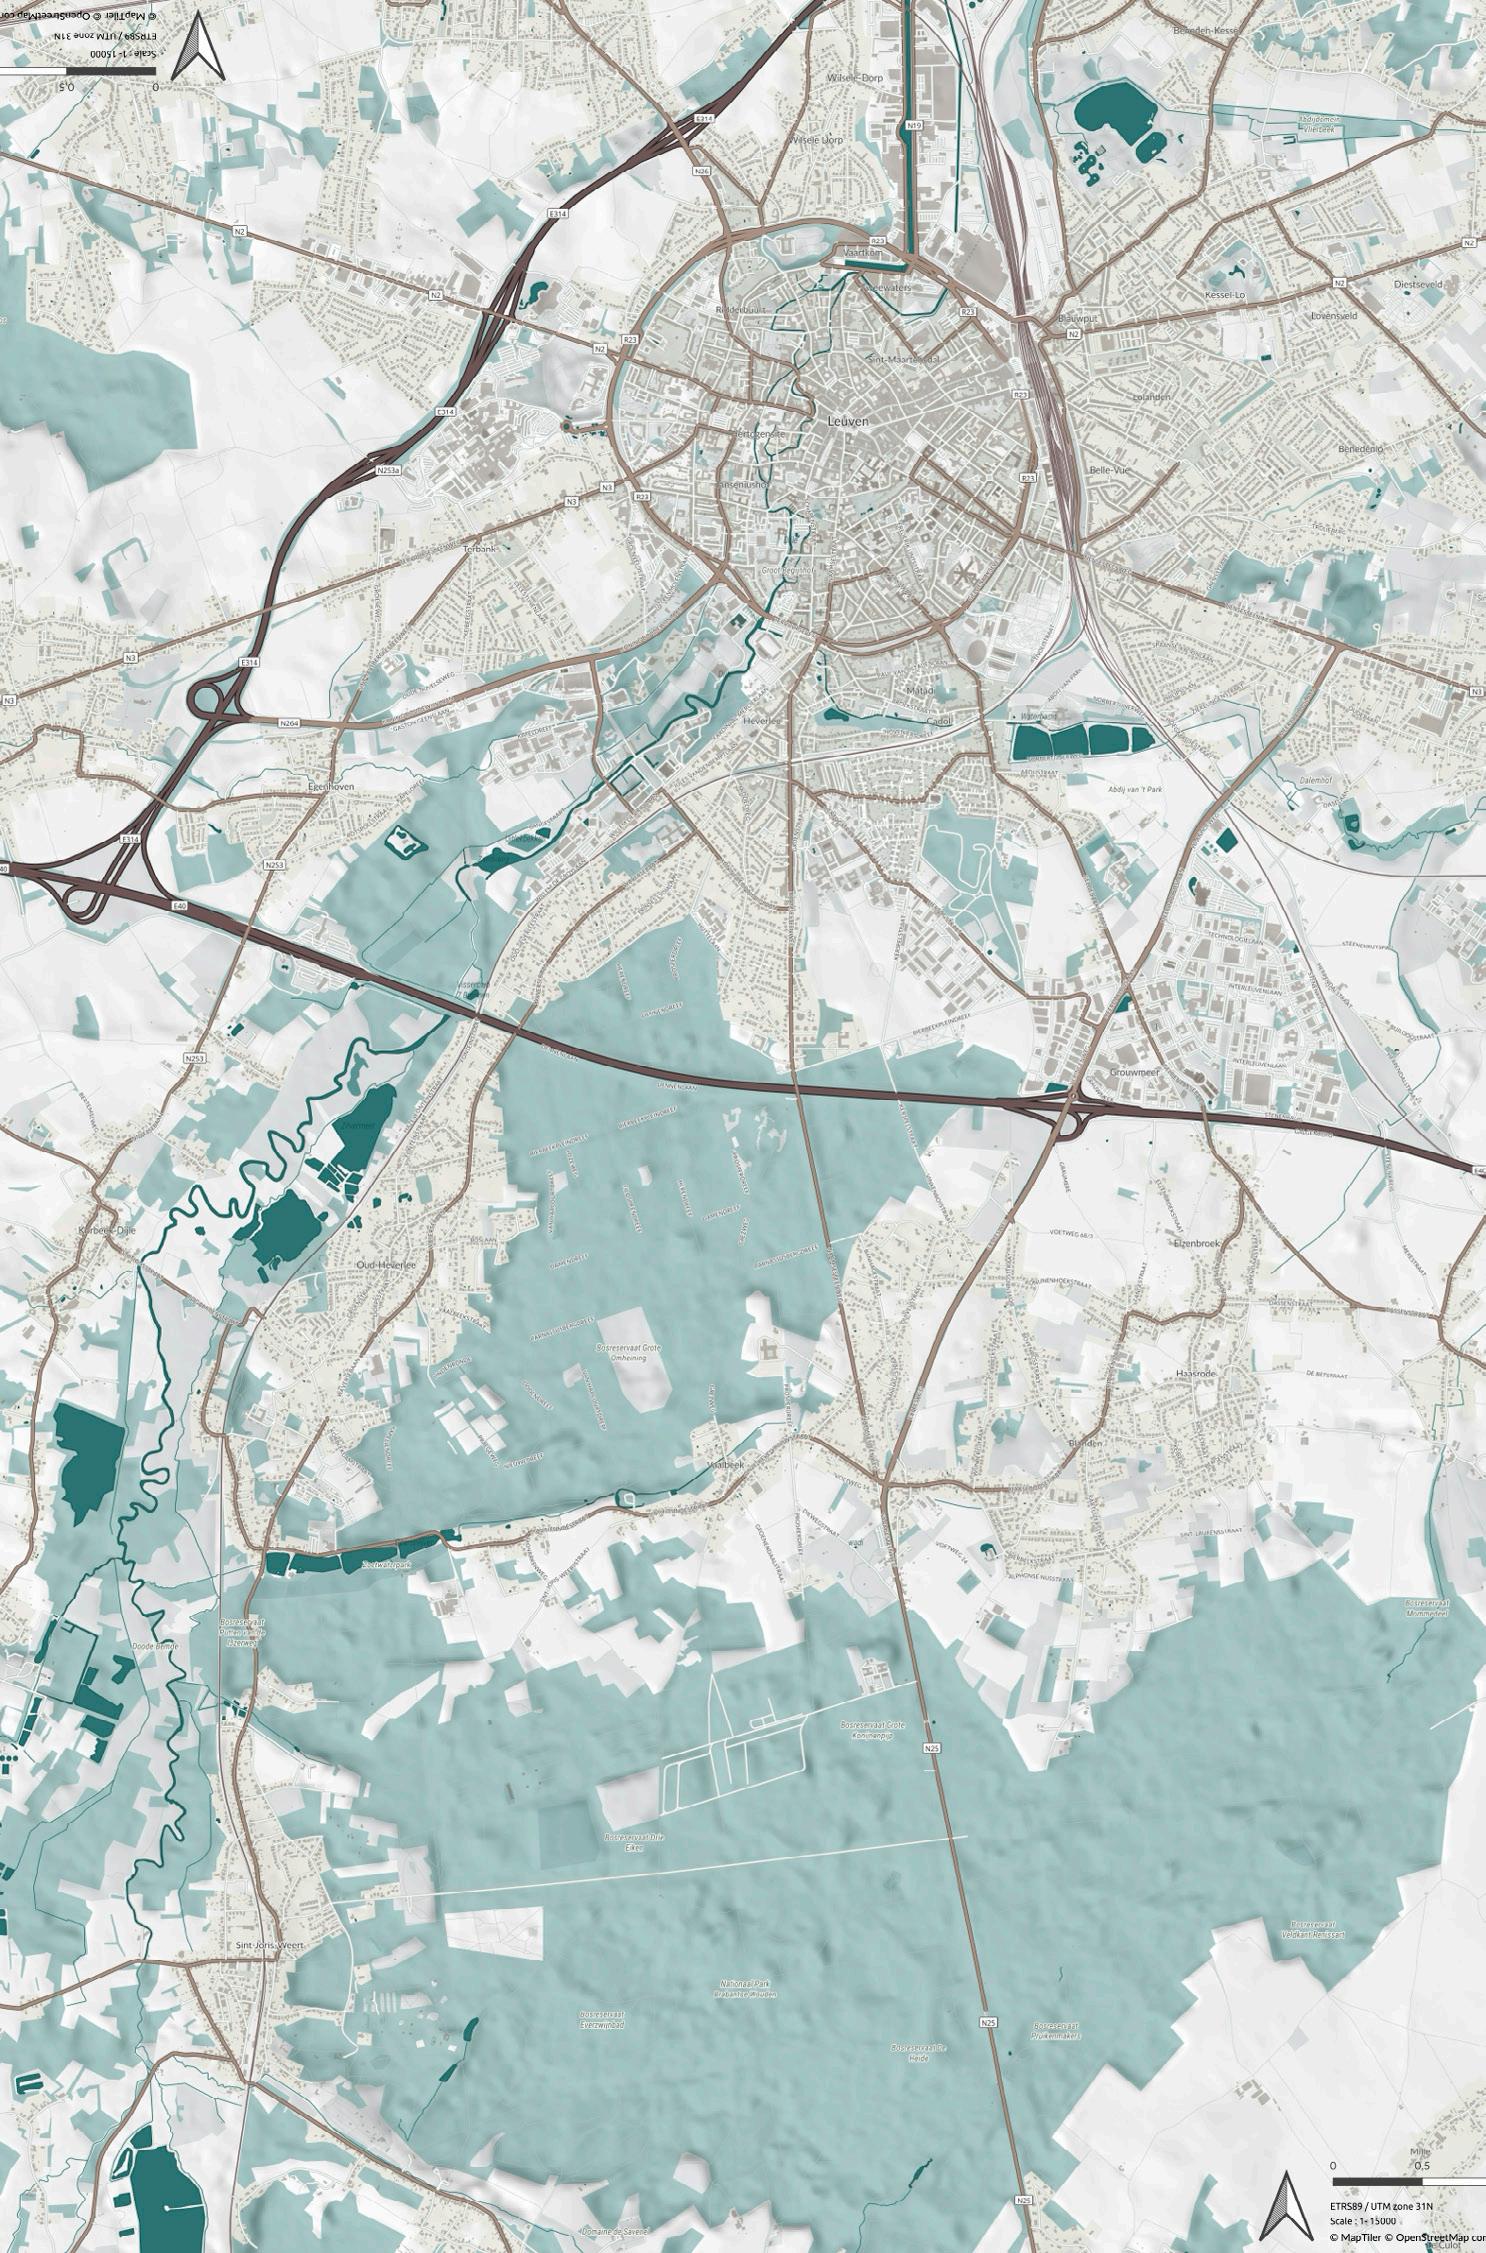
Figure 58: Map of Heverlee, Belgium use case, focusing on the E40 highway [50.8462, 4.6958]. Map created by Niene Boeijen.
highway
Eindhoven, 31 January 2025
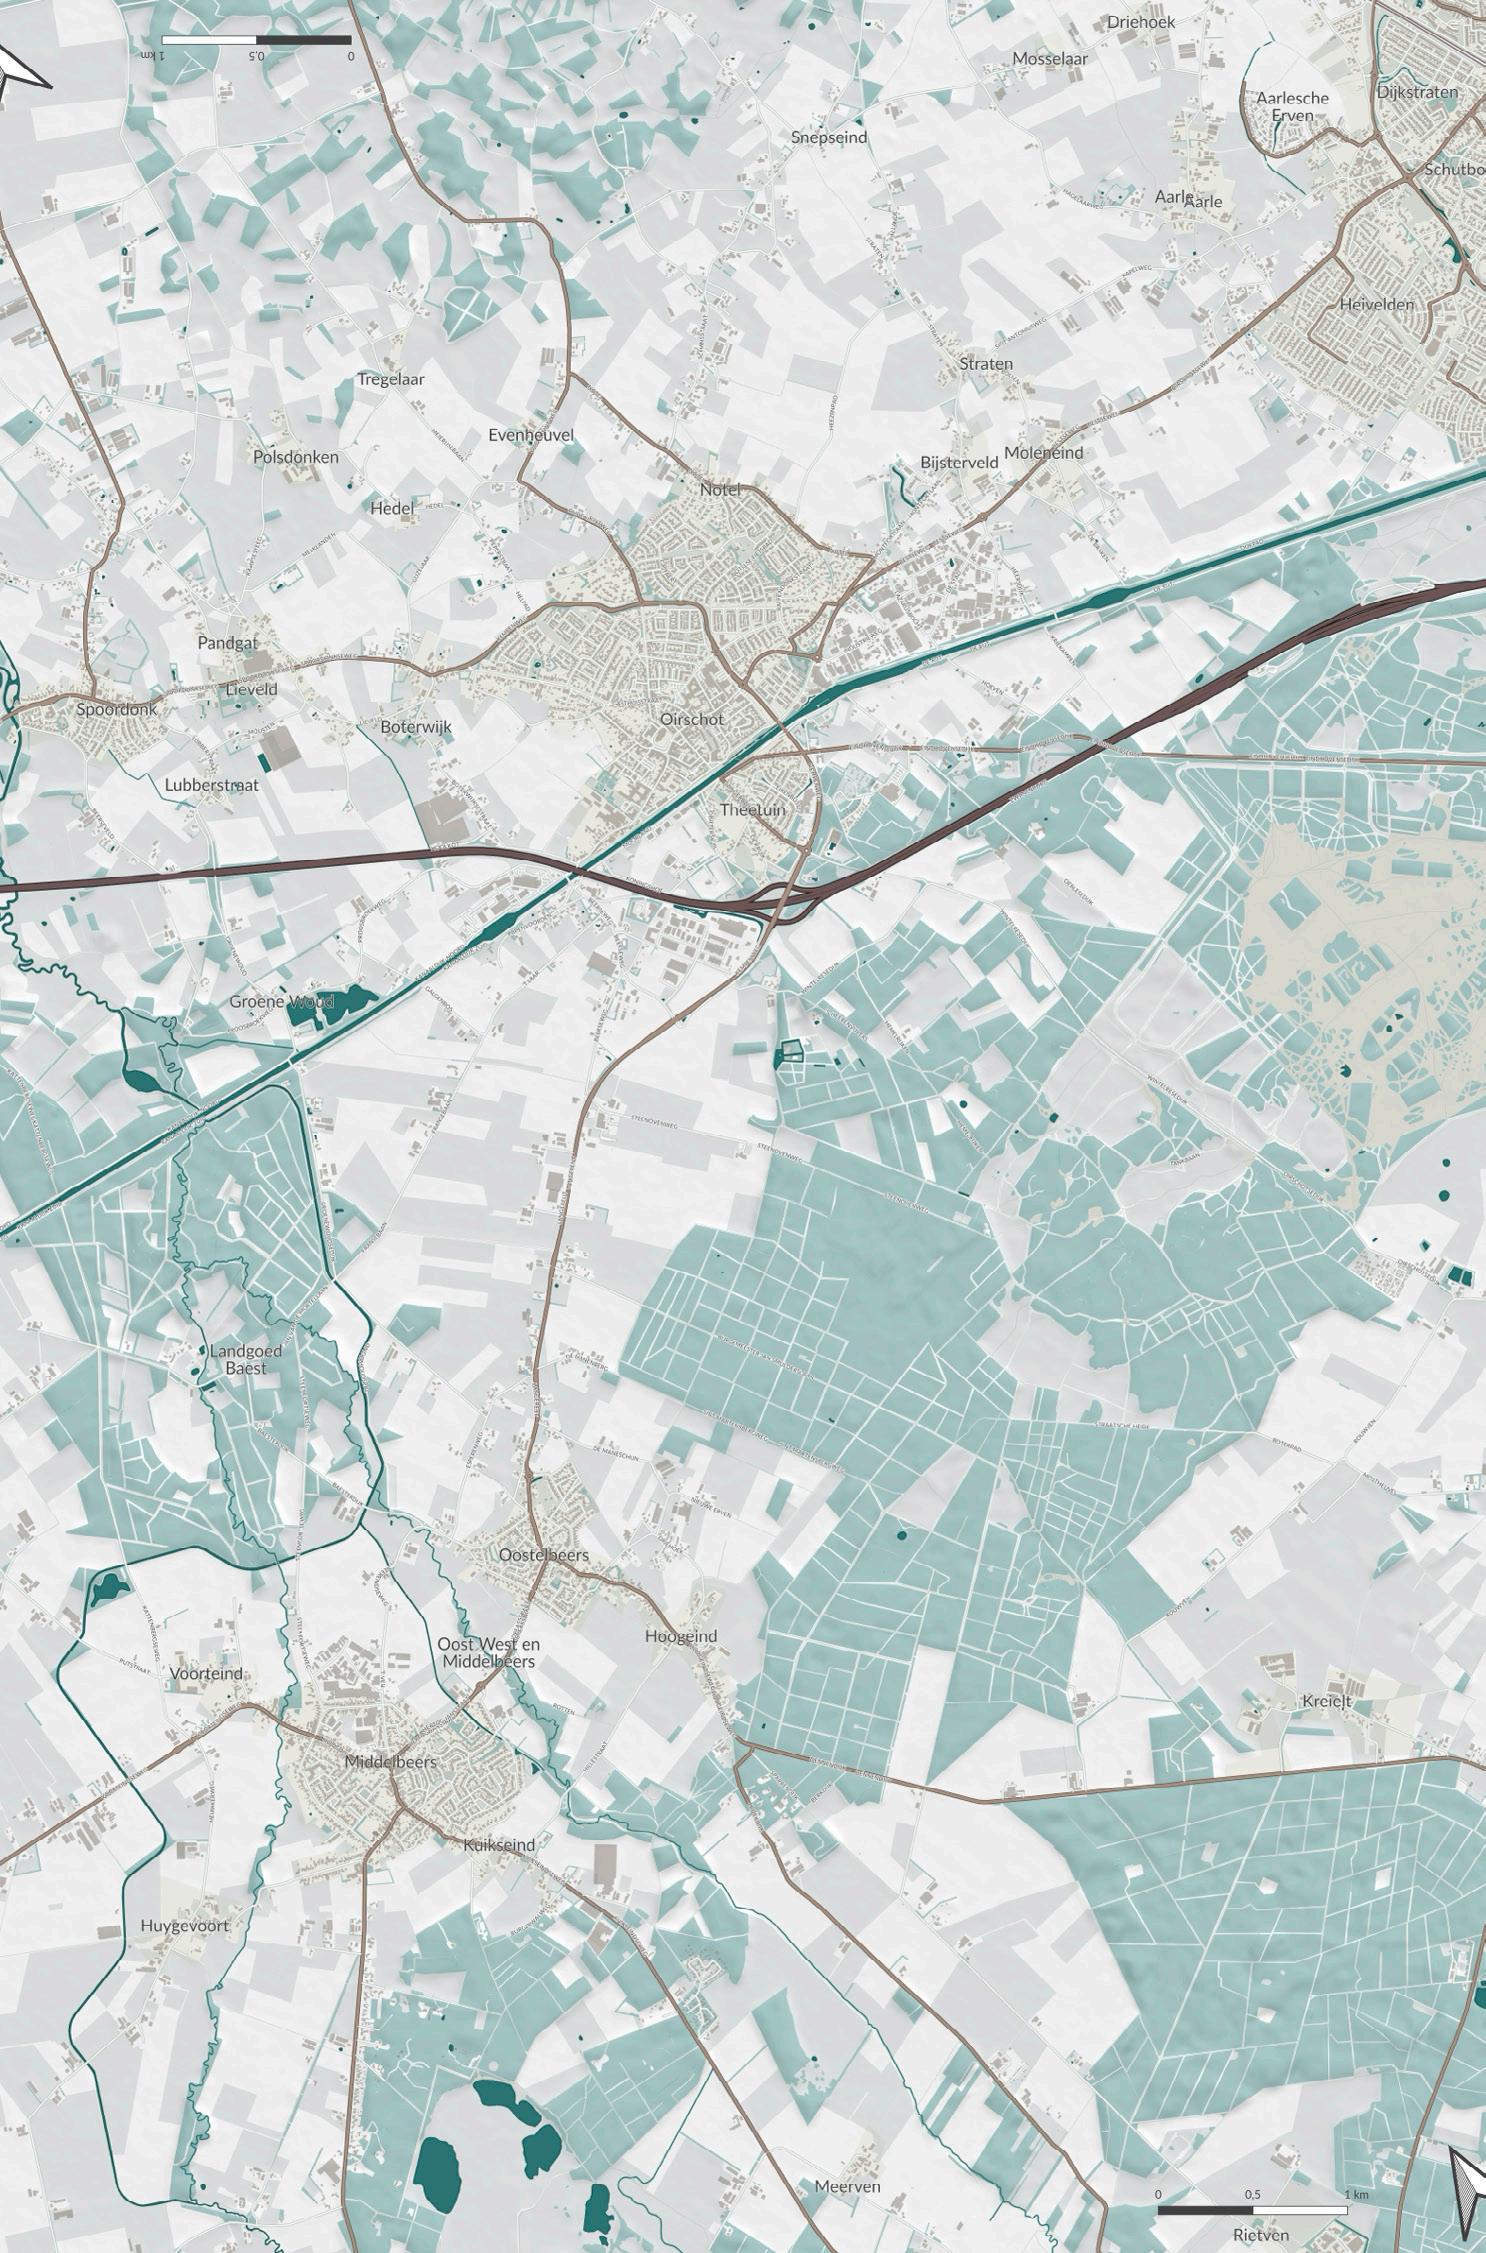
Figure 59: Map of the Dutch use case, focusing on the A58
[51.49203, 5.34878]. Map created by Niene Boeijen.
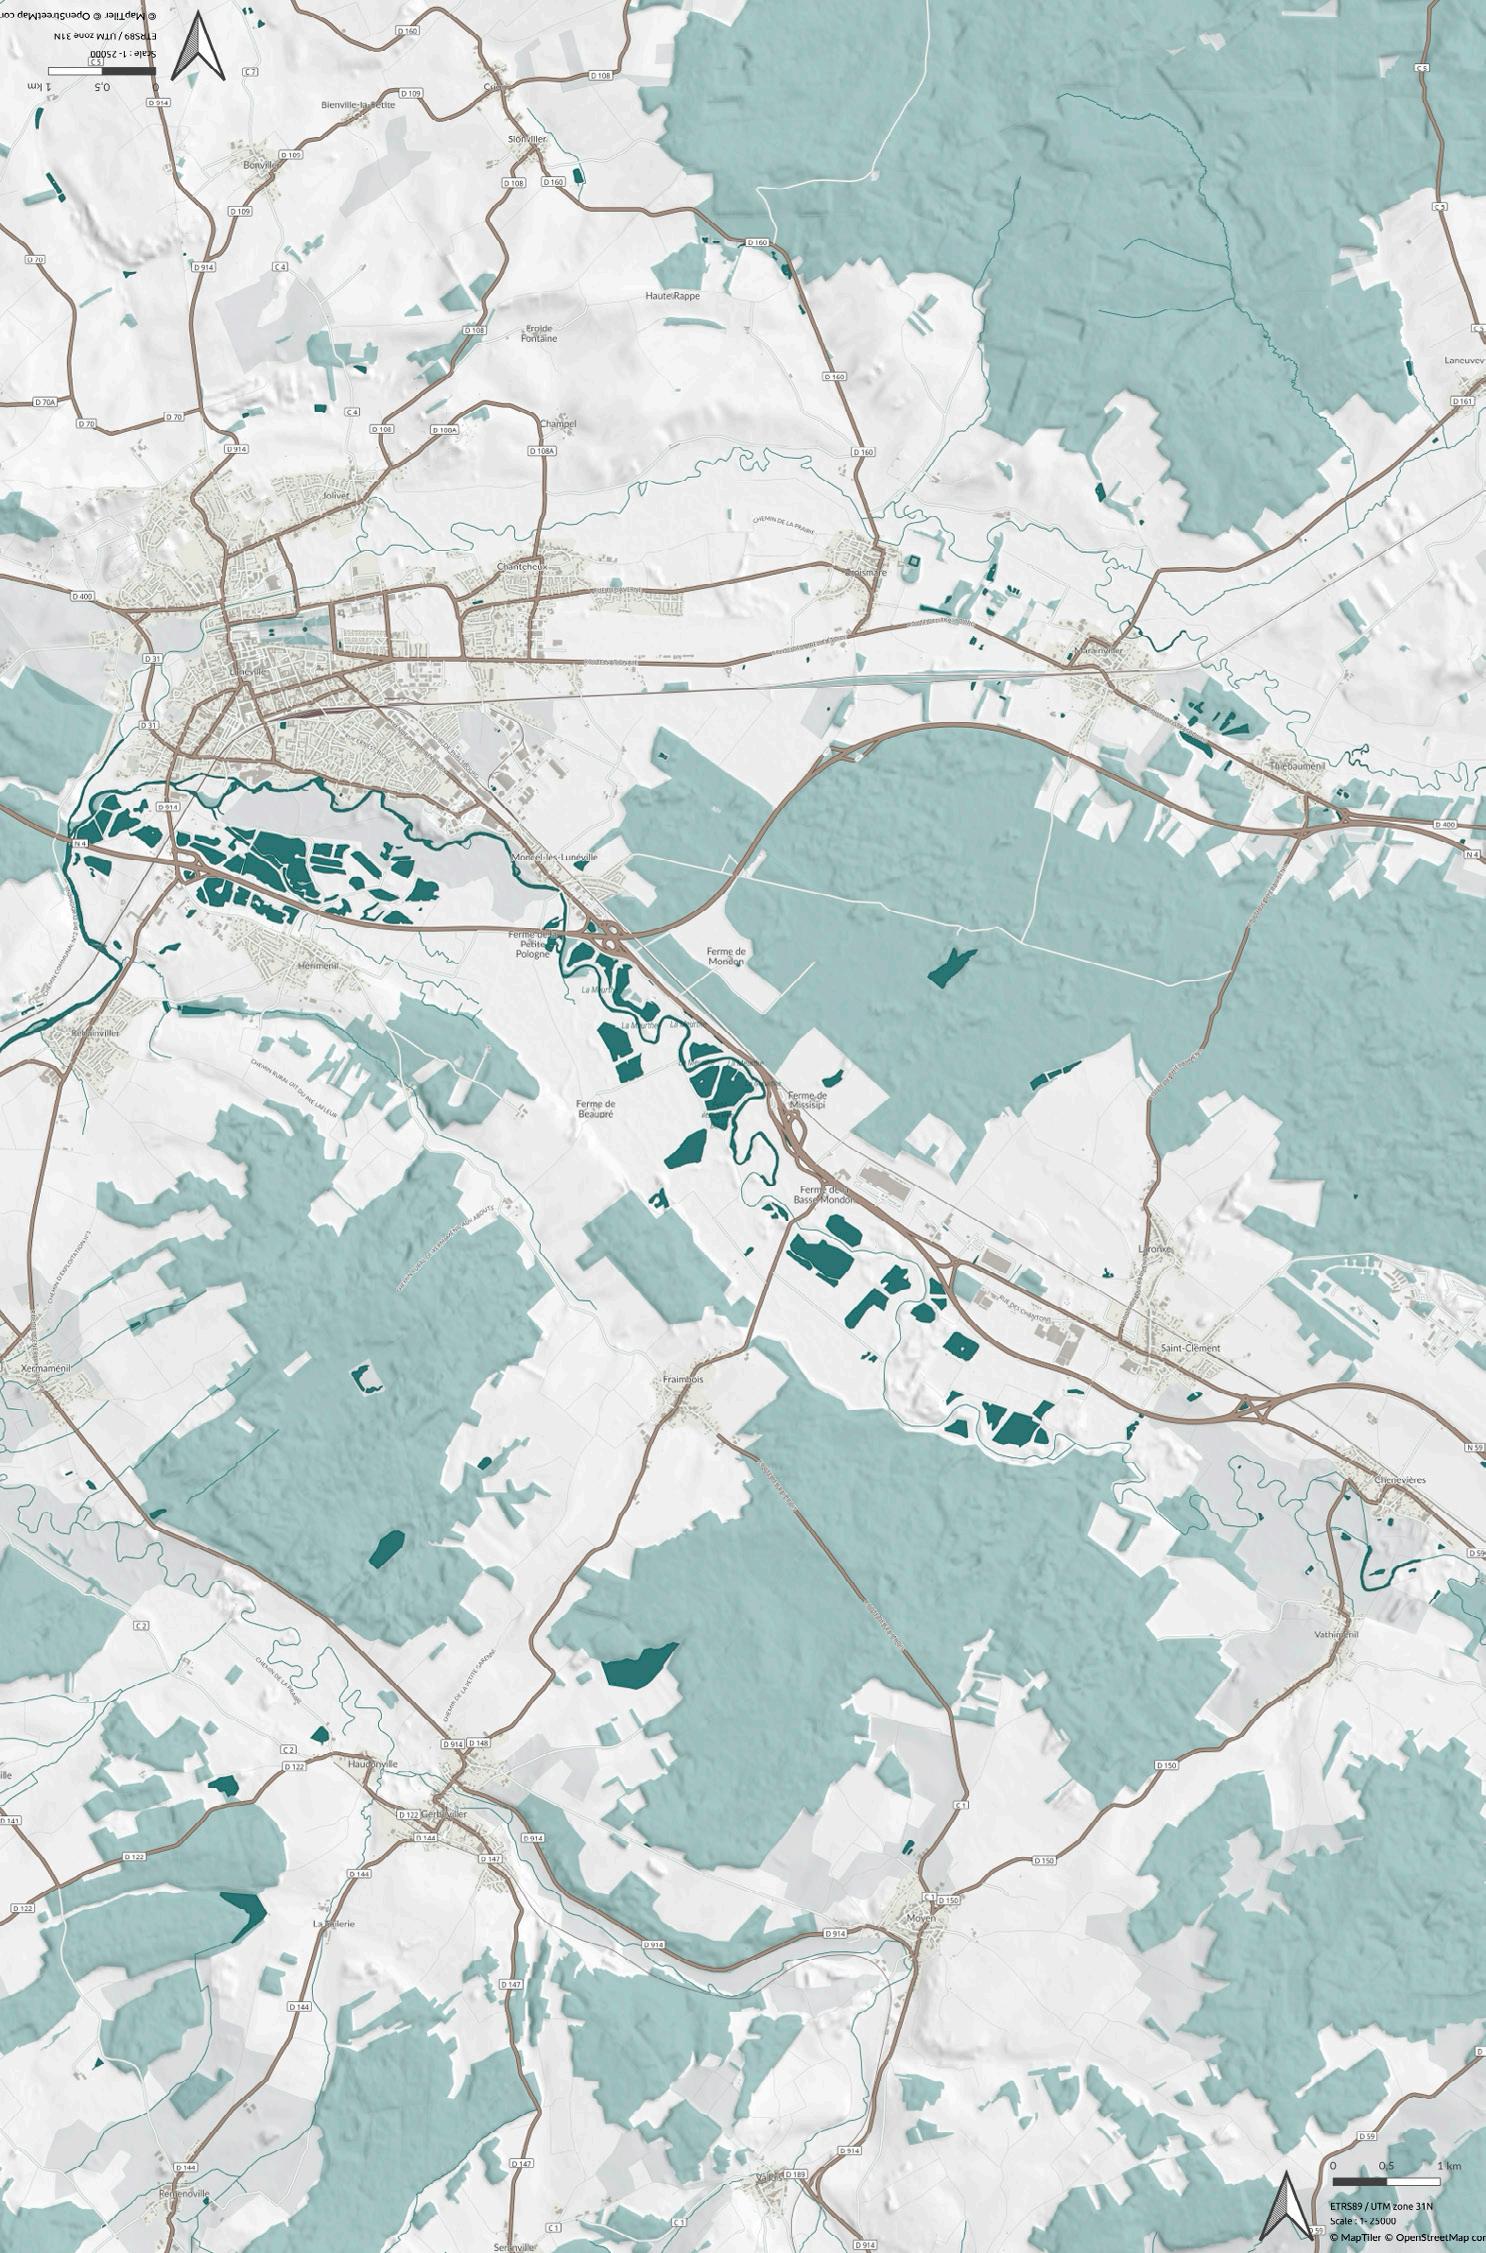
Figure 60: Map of the French use case, focusing on the N59 highway [50.8462, 4.6958]. Map created by Niene Boeijen.
31 January 2025
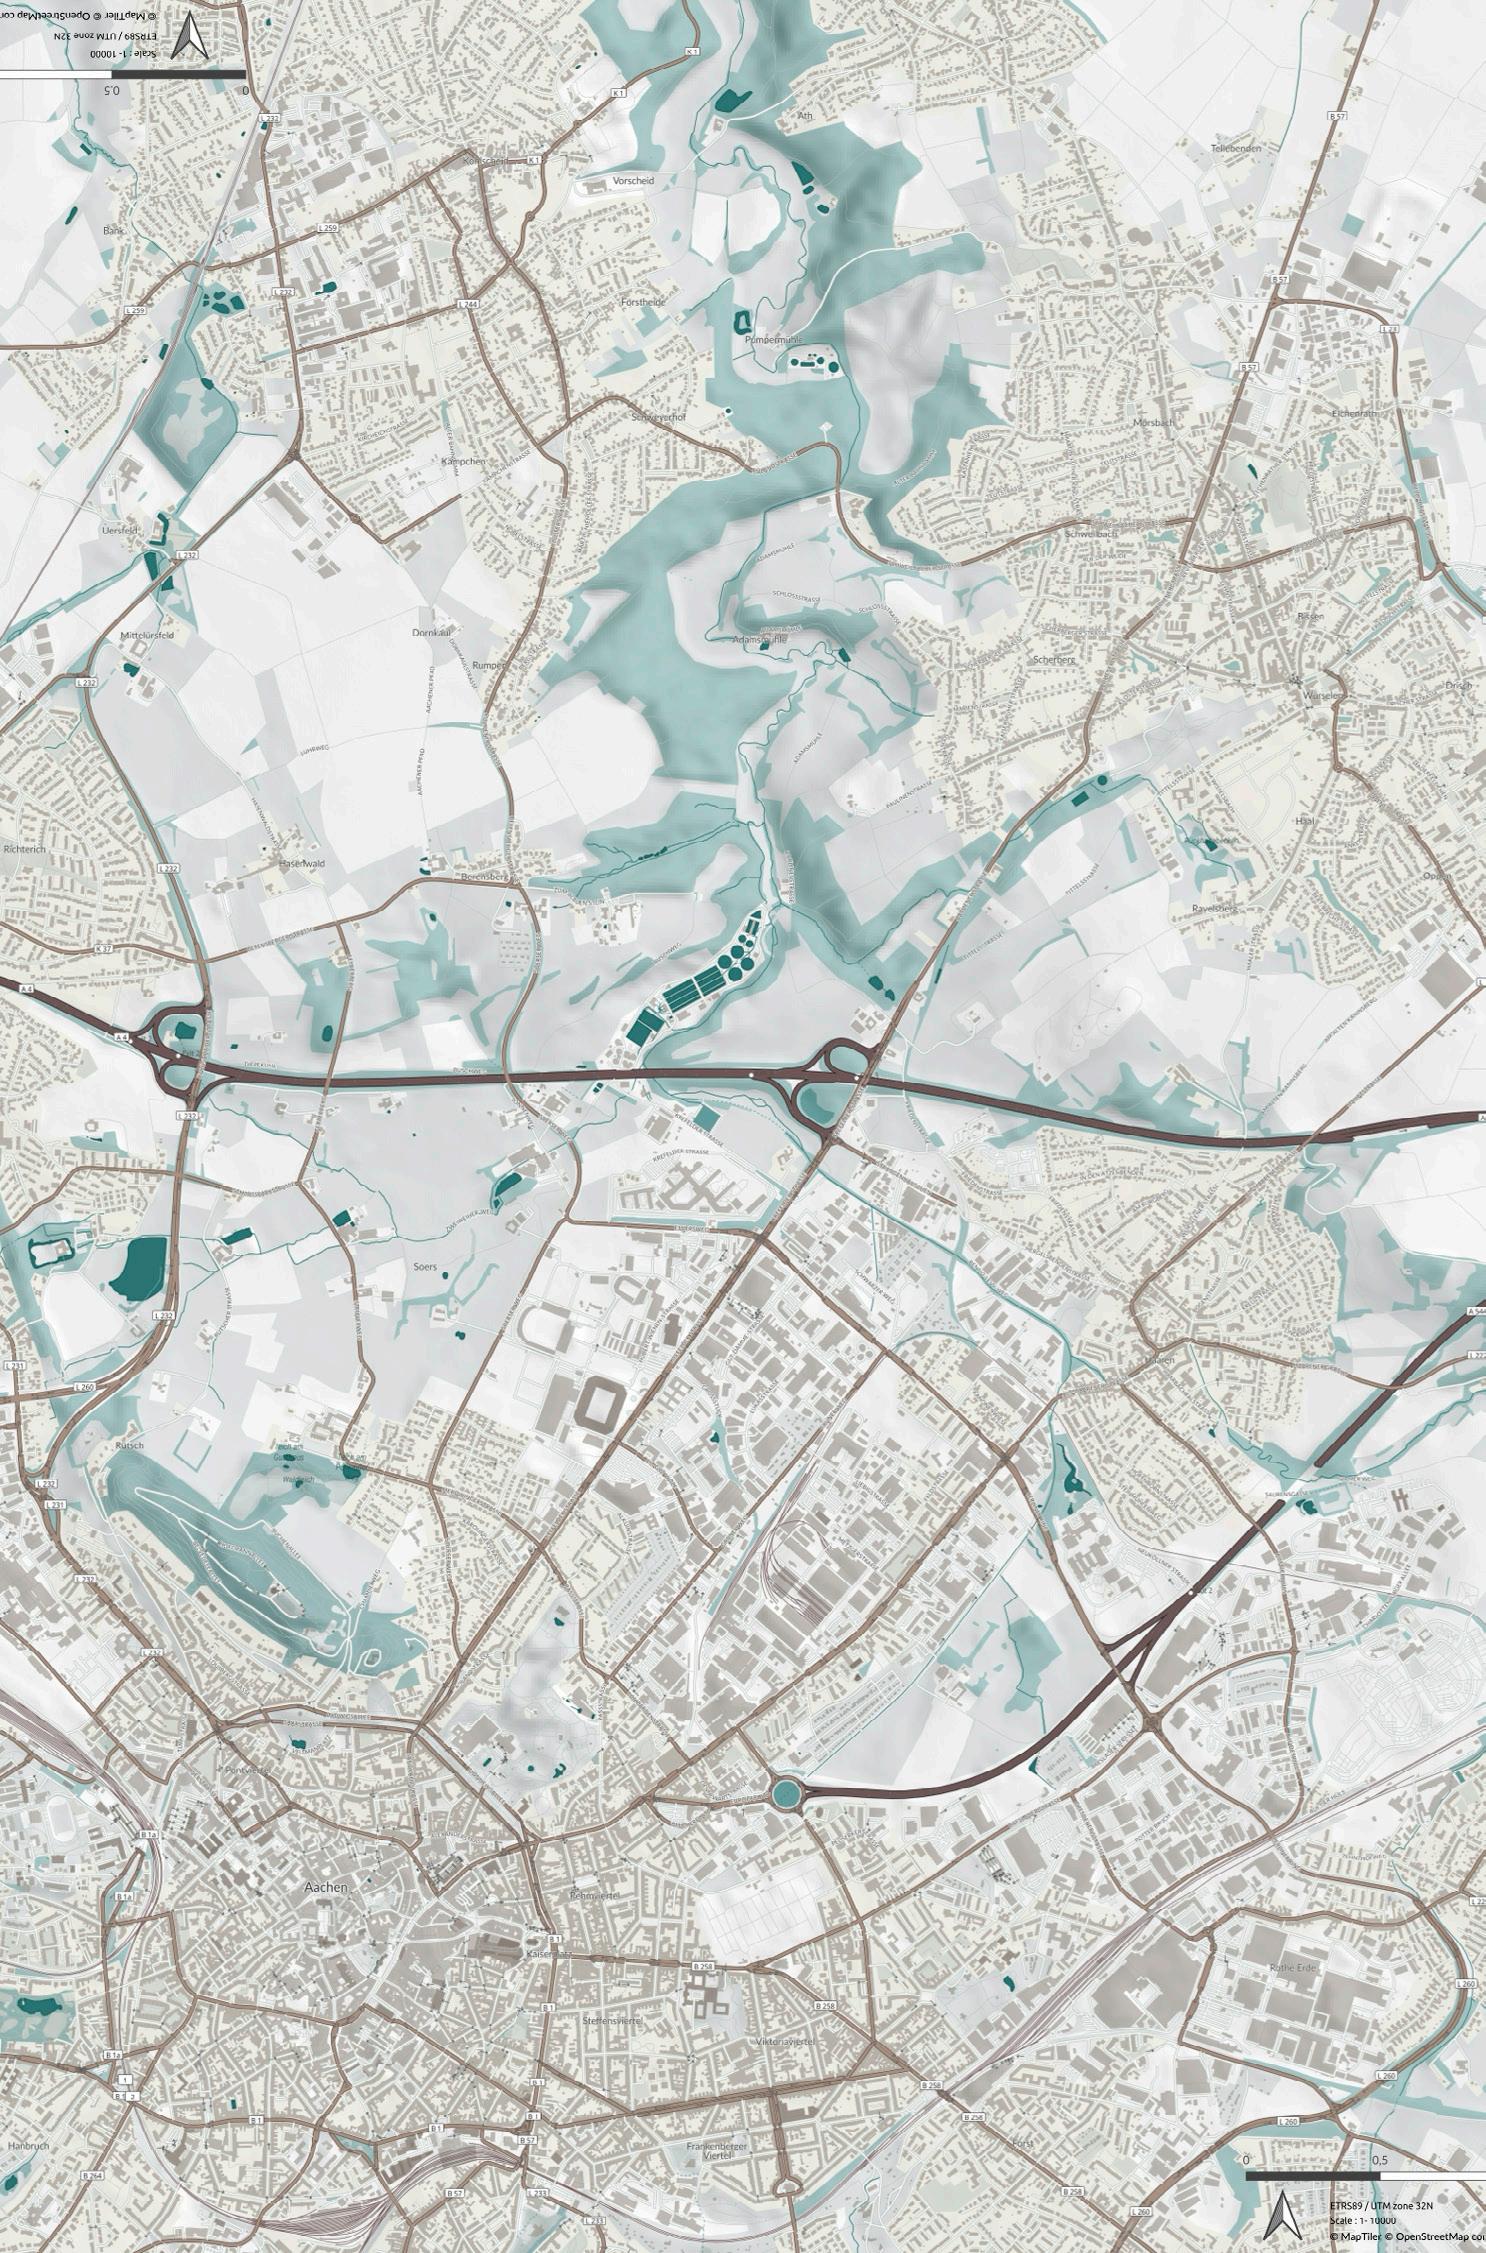
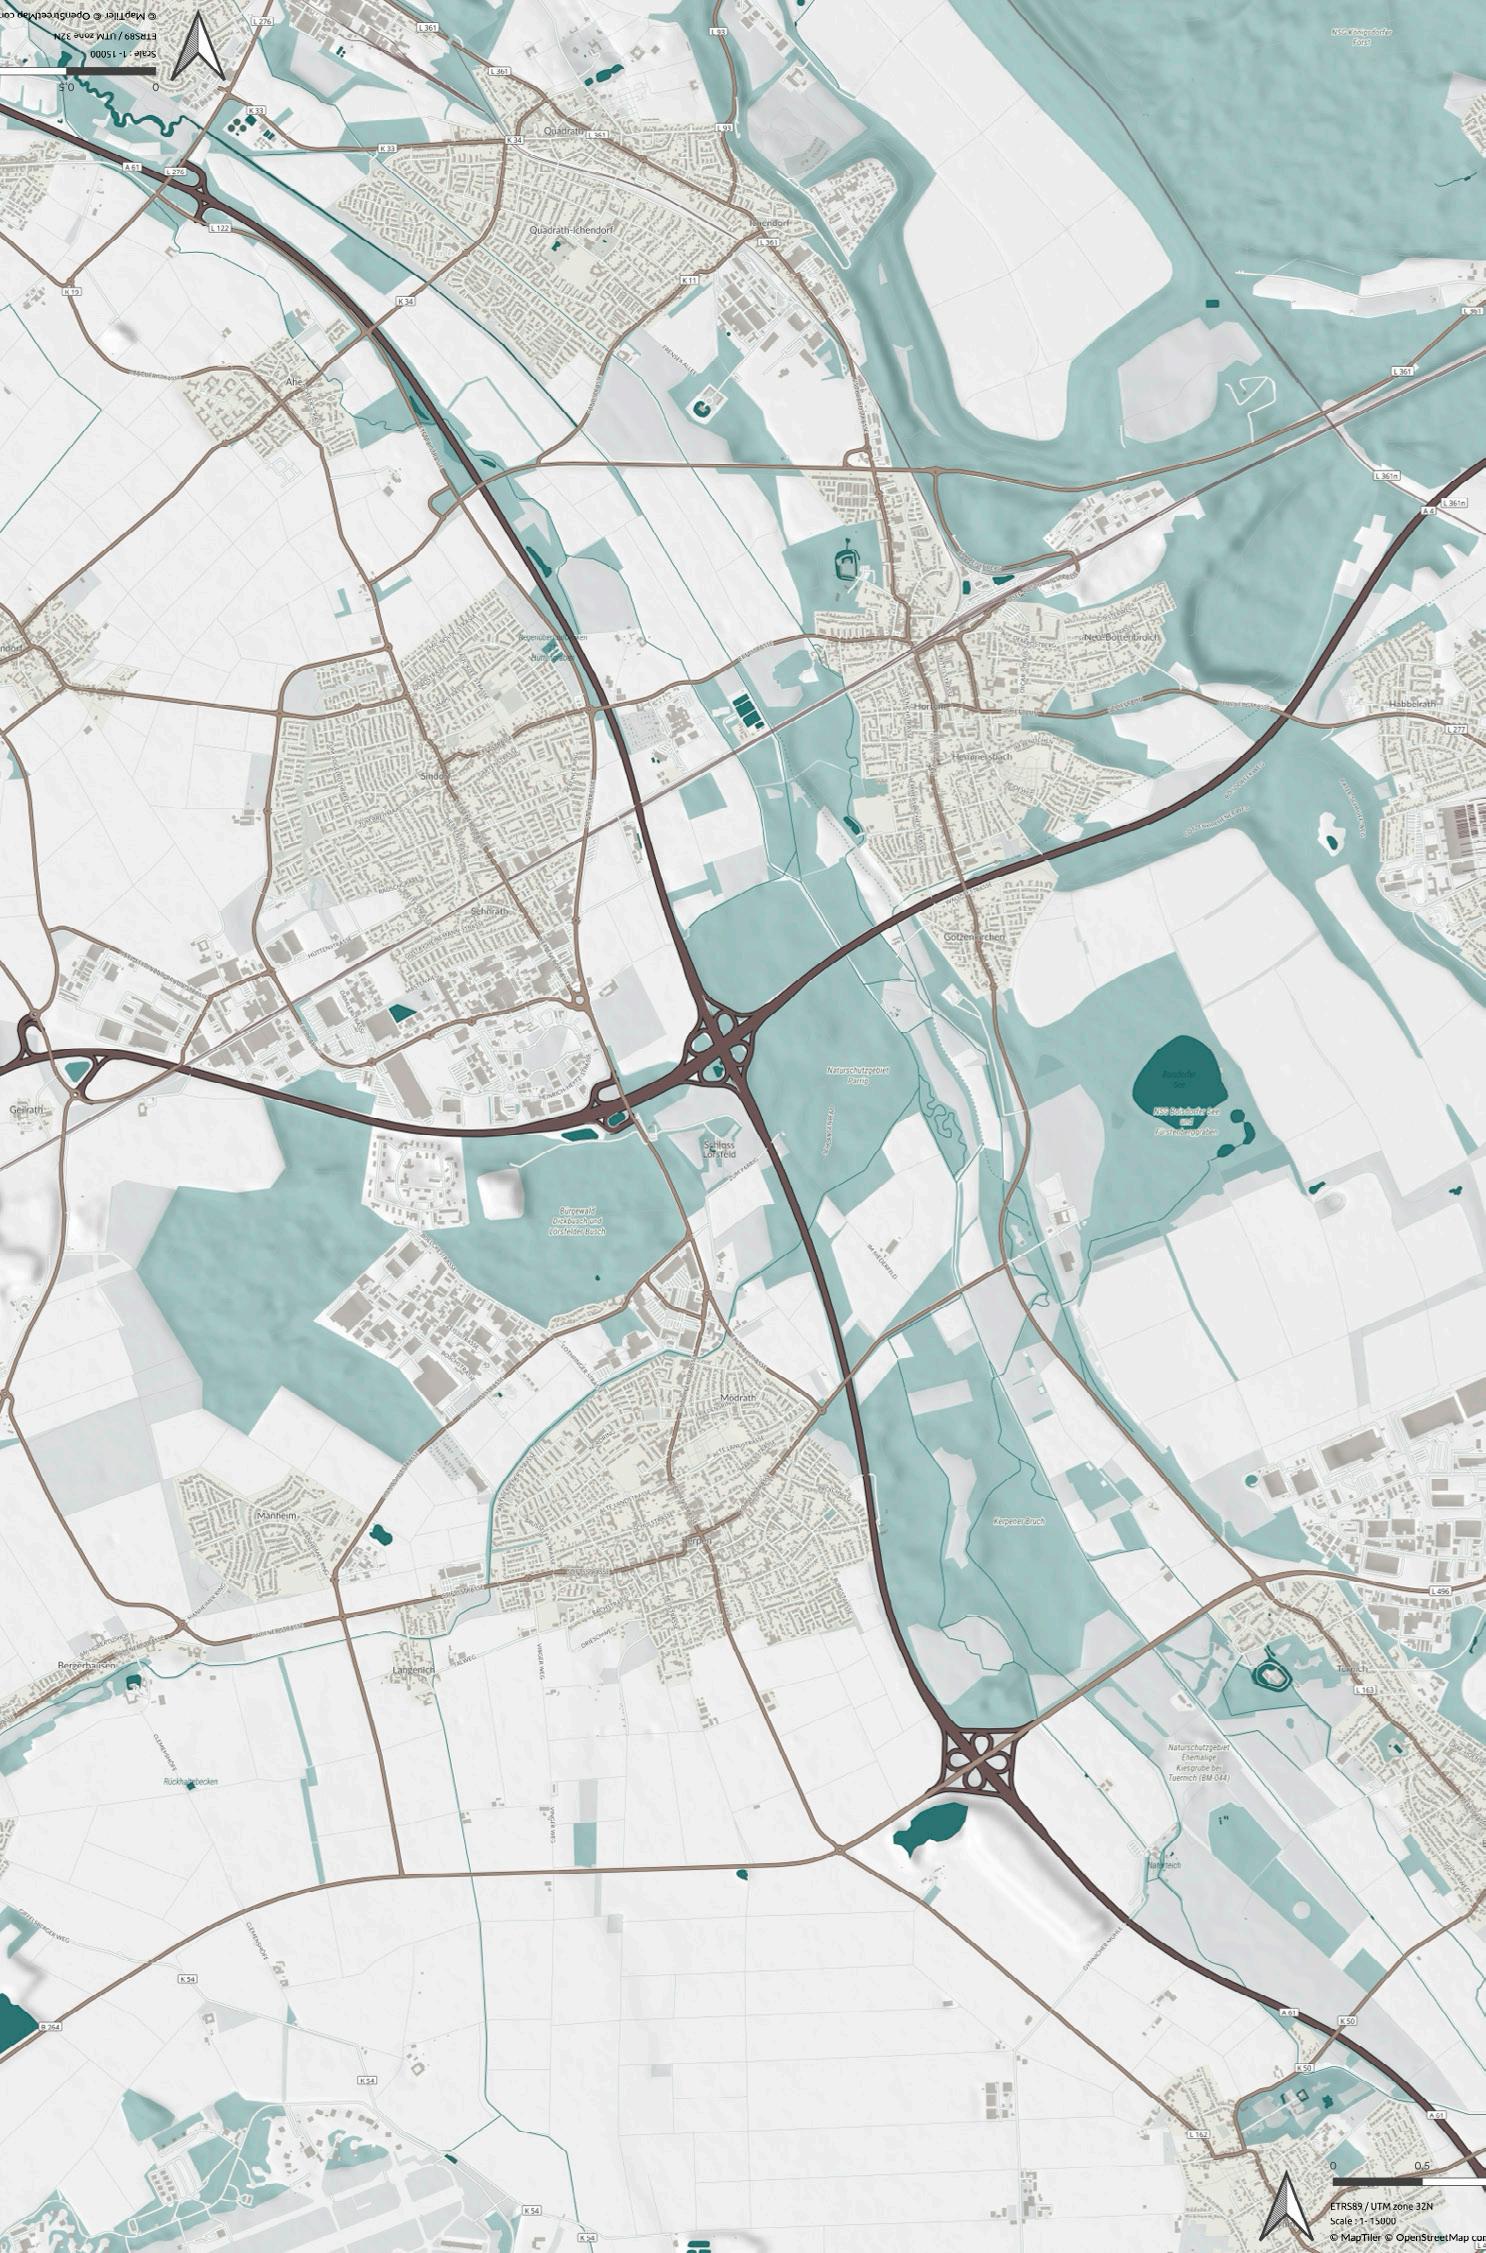
Figure 61: Map of the German use case, focusing on the A4 highway [50.8057, 6.0990]. Map created by Niene Boeijen.
62: Map of the German use case, focusing on the A4/A61 highways [50.8948, 6.6949]. Map created by Niene Boeijen.
Figure
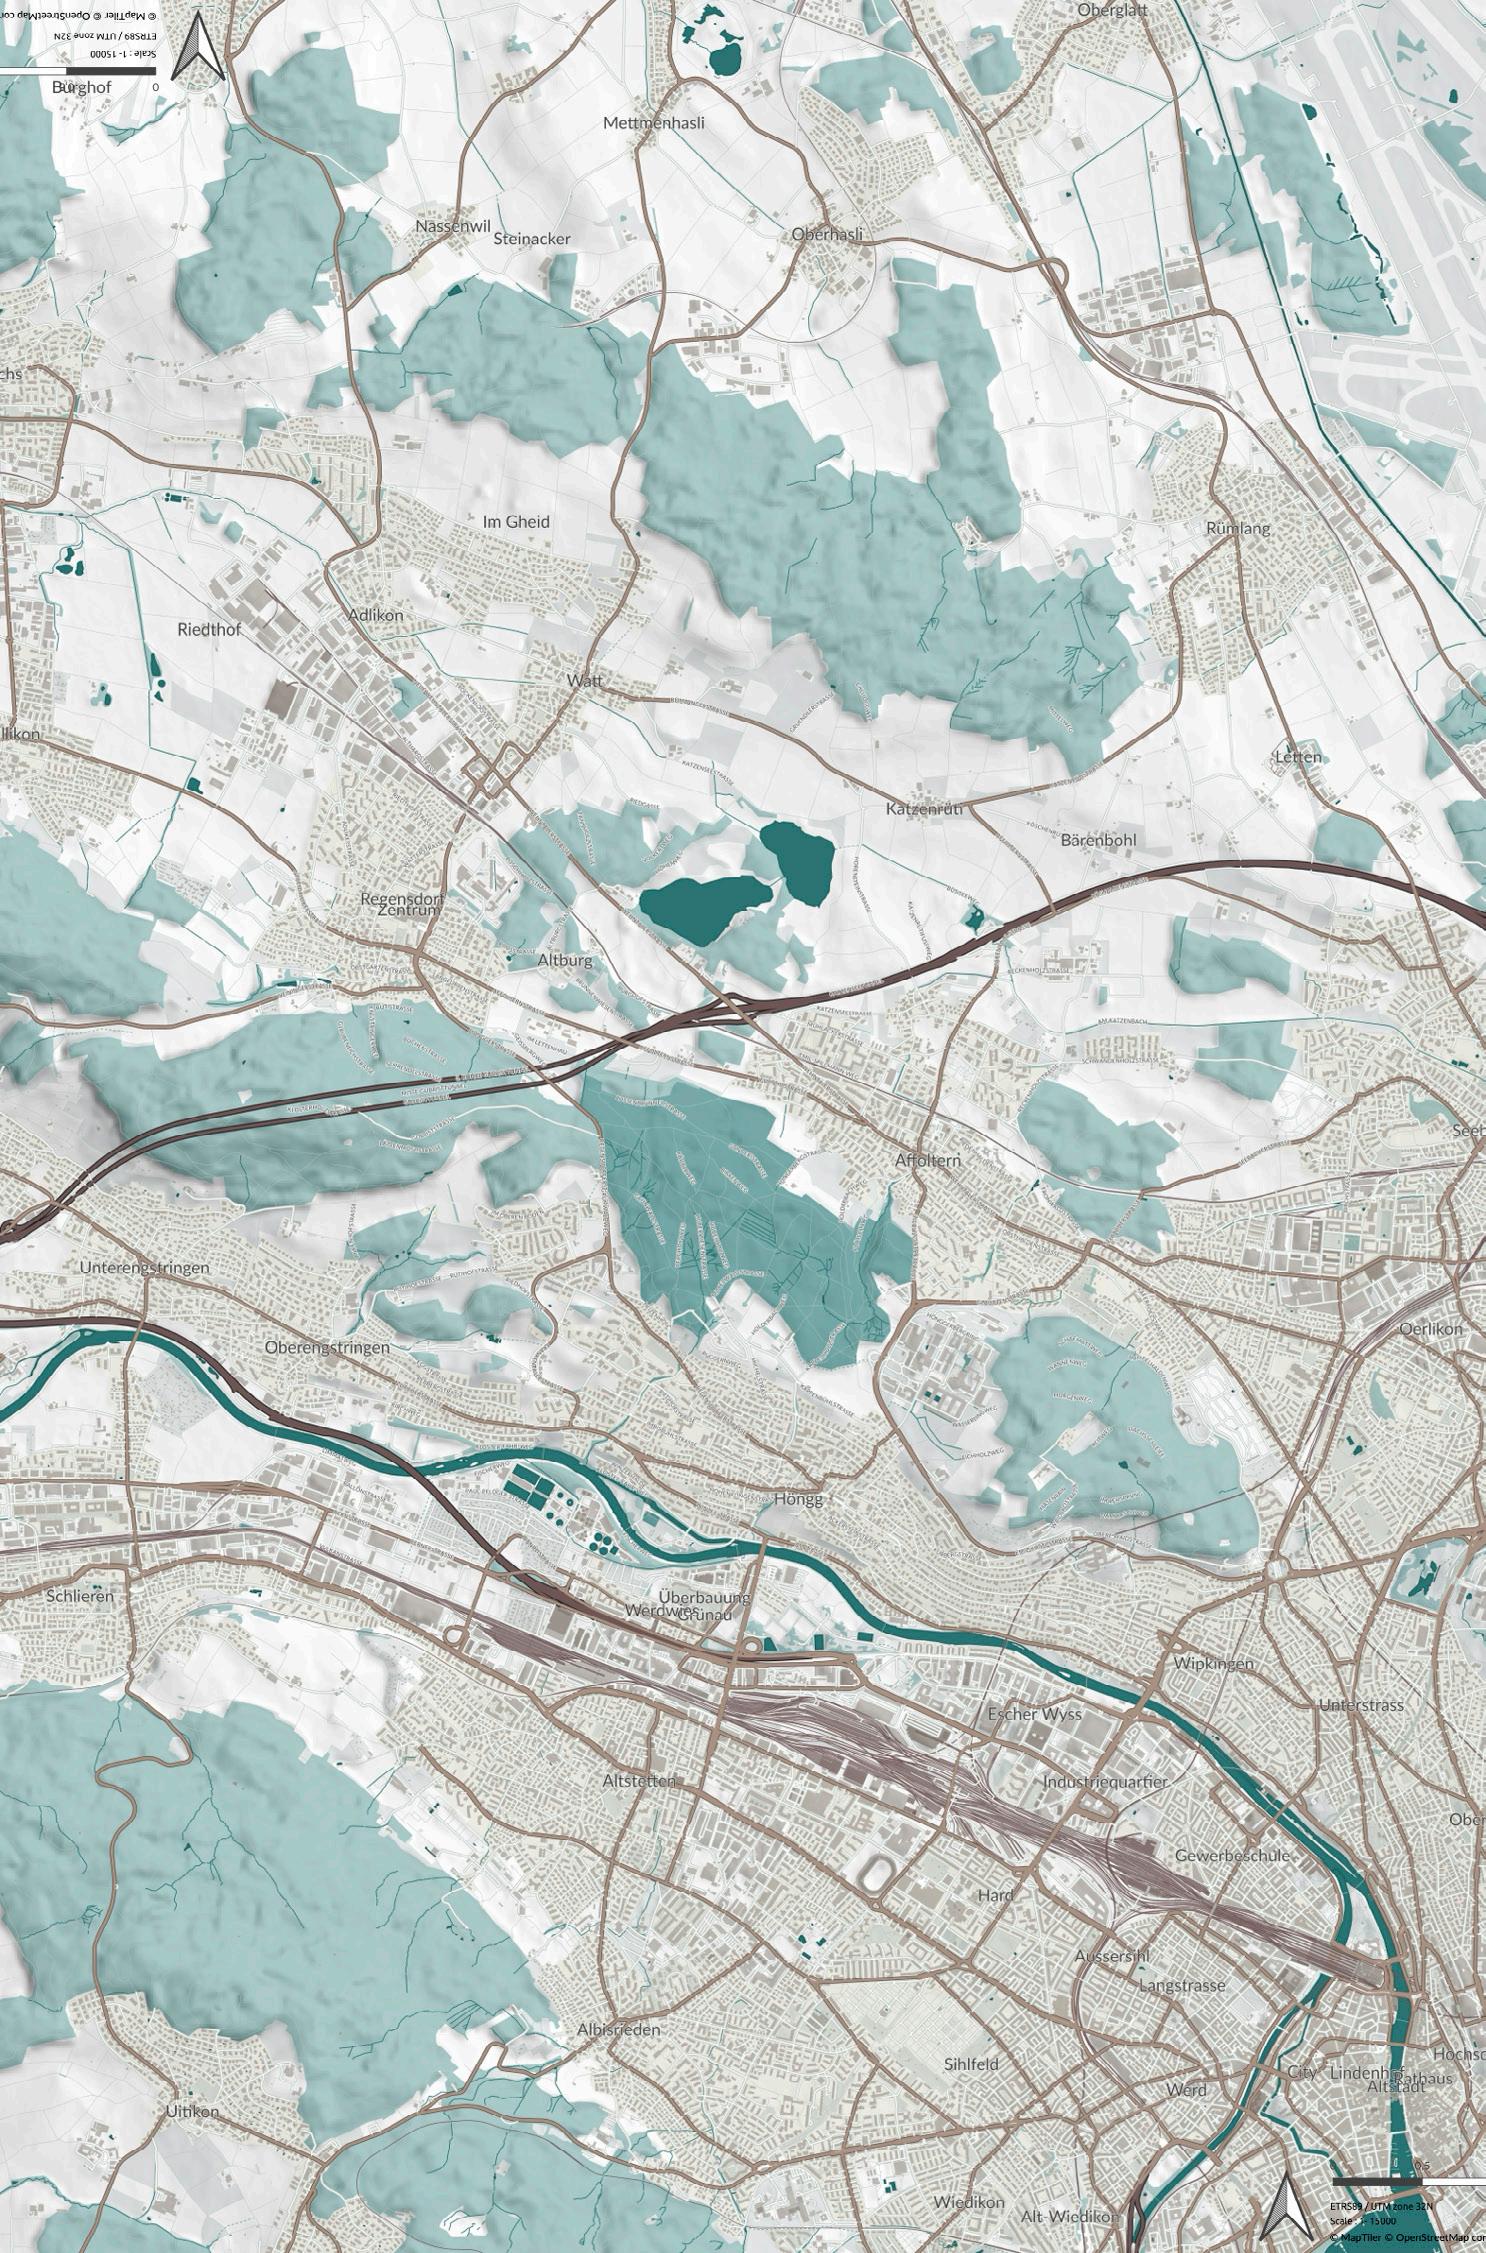
63: Map of the Swiss use case, focusing on the A1/A4 highways [47.42913, 8.51256]. Map created by
31 January 2025
Figure
Niene Boeijen.
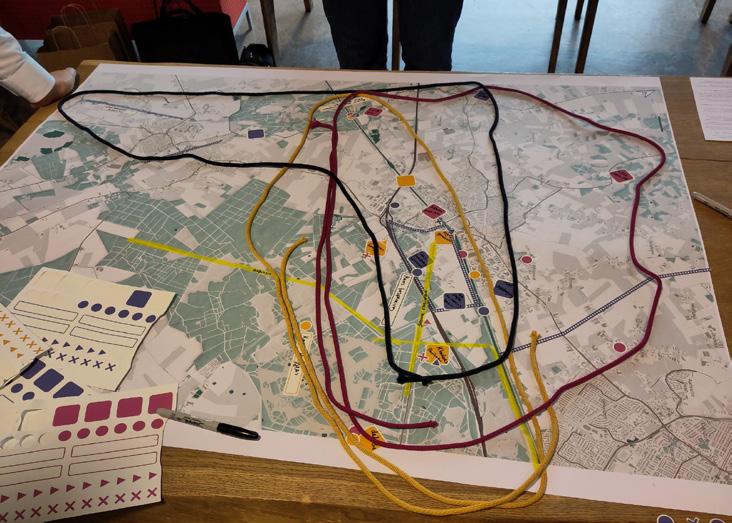
At the beginning of the workshop, participants received a handout outlining the objectives and instructions for the activities (see Figure 64).
The institutional perspective was discussed concerning traditional practices and pressures that often dominate decision-making processes. The local perspective emphasized the importance of local knowledge and shared interests within local communities, especially when navigating shared challenges. Lastly, the participatory perspective highlighted the value of community input in exploring issues without preconceived conclusions, allowing for a flexible engagement with matters based on stakeholder input.
During the workshop, participants undertook mapping to identify their perspective and visualize important places, boundaries, and opportunities relevant to their perspectives. They were expected to follow these steps:
STEP 1:
Each participant selected relevant locations for their perspective and placed markers on the map. They then shared stories about these locations and captured their significance in a few words on stickers attached to each marker (see Figure 65).
The focus then shifted to identifying borders on the map. Using tape, participants marked relevant boundaries, recording both physical barriers, such as roads and fences, and metaphorical boundaries, such as social, economic, or psychological constraints (see Figure 66). By articulating the nature of these boundaries, they gained better insight into the challenges presented by different perspectives for community engagement.
Next, the workshop highlighted the interrelationships between places and borders. Participants discussed how these elements were interconnected and influenced community dynamics, emphasizing the complexity of both physical and metaphorical boundaries in shaping community experiences and participation.
STEP 2:
Participants were asked to indicate opportunities on the map using specific stickers. A different color was used for each opportunity, indicating consensus from multiple perspectives. This visual element
64: Handout with instructions for the activities and the various tools used during the mapping workshop. Handout designed by Niene Boeijen.
Figure
created a clear overview of shared possibilities and enhanced collaboration among the involved parties. Participants were also given the space to express disagreements. When a proposed opportunity was not widely supported, a „disagree“ sticker could be used. This provided an opportunity to clarify viewpoints and engage in discussions about different visions and interests.
Additionally, it was crucial to document the discussed opportunities and viewpoints. Participants used text boxes to explain why each item was relevant to their perspective. This documentation formed a summary of the stories shared during the workshop, making the opportunities and underlying reasons visible, as well as showcasing the involvement of diverse perspectives in the participatory process.
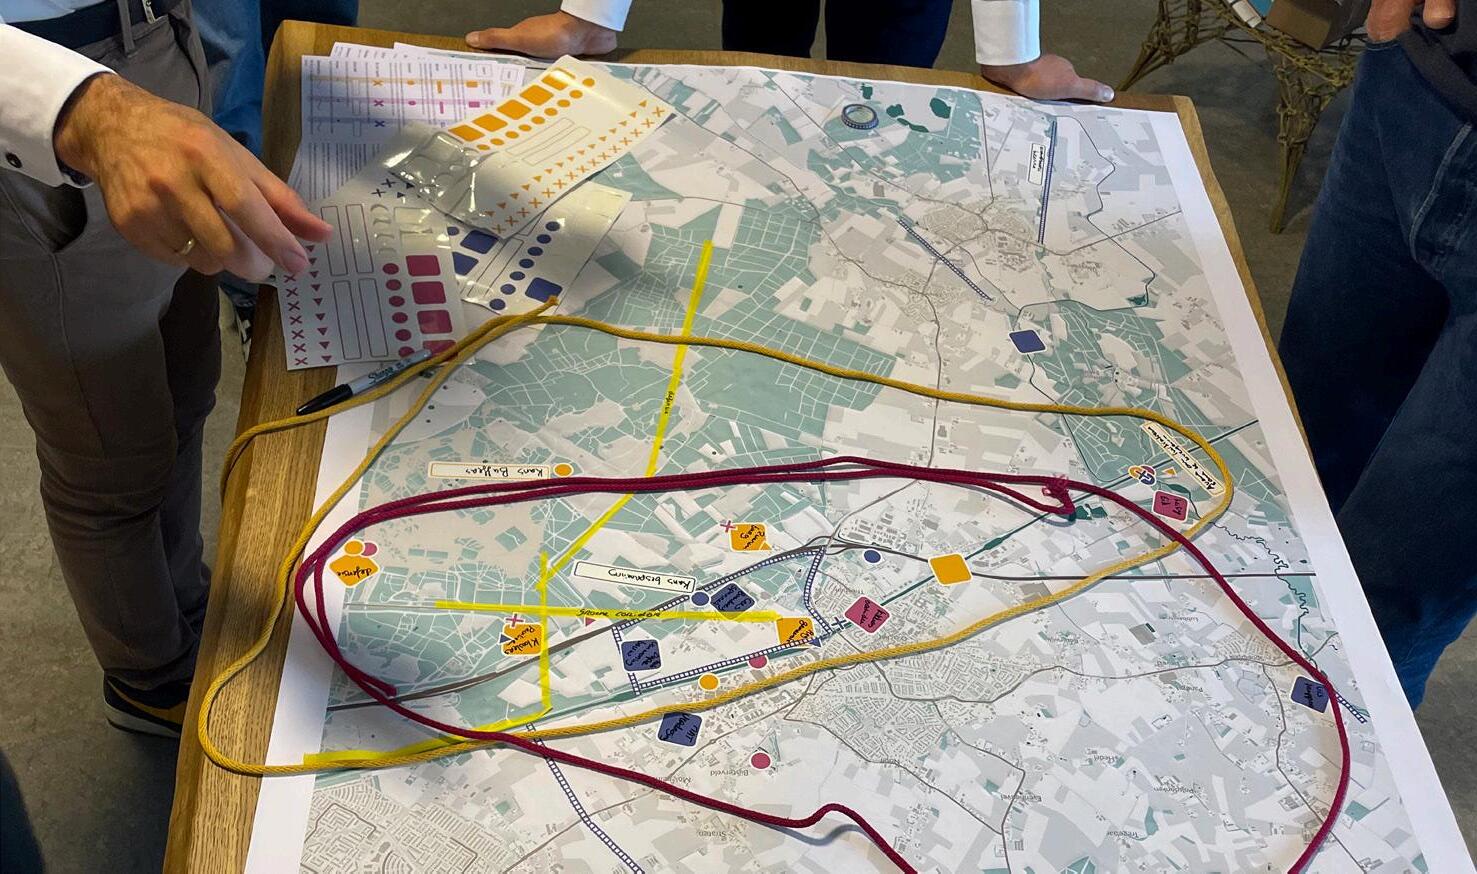
STEP 3:
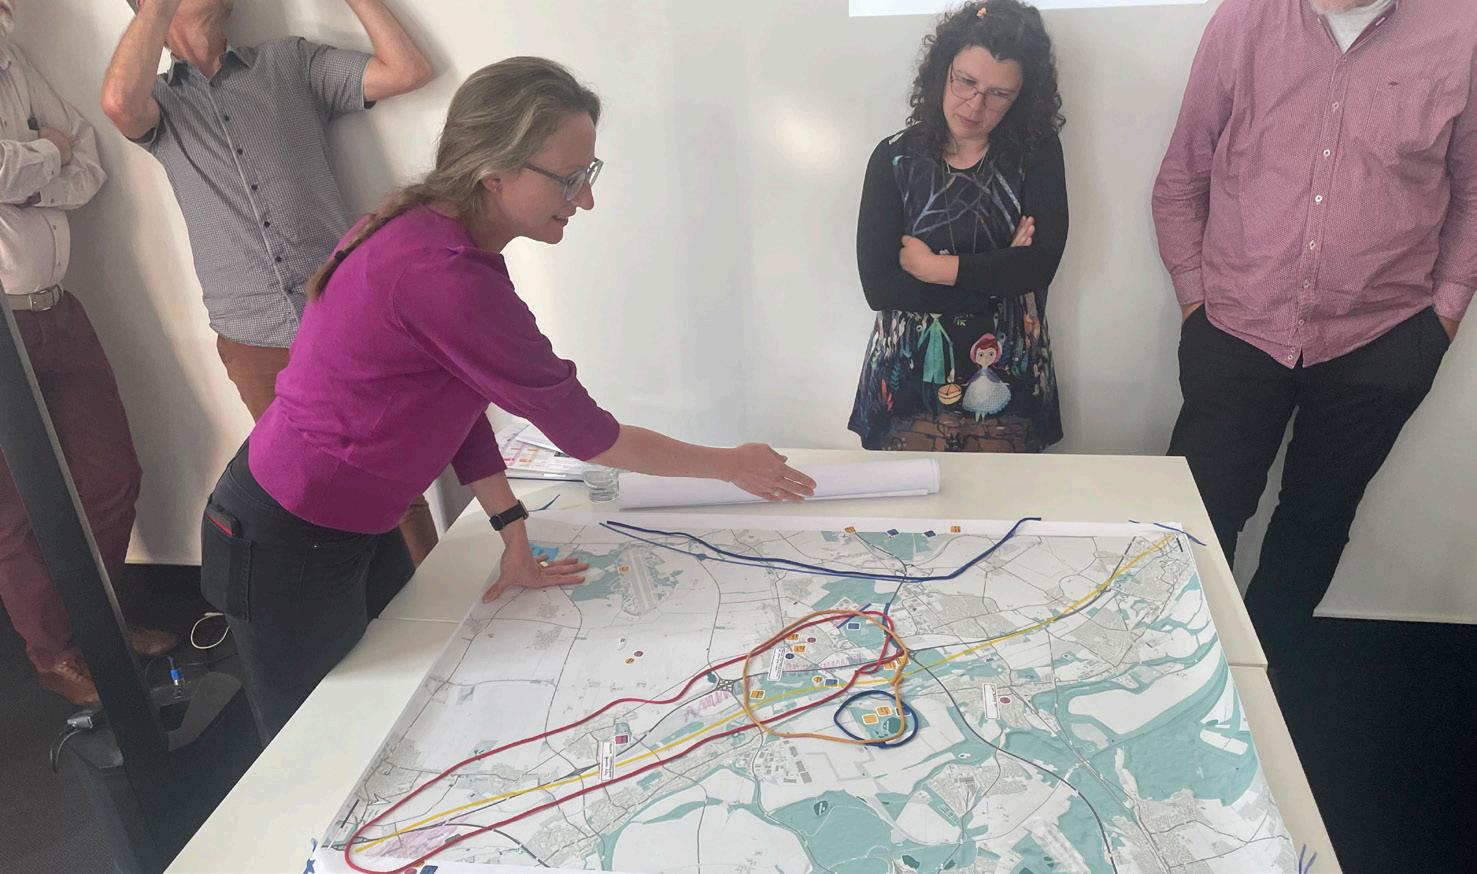
During the workshop, delineation of focus areas was performed using colored ropes (see Figure 68). Participants used these ropes to surround all markers of the same color on the map, thus enclosing relevant places and opportunities for each perspective. This visual tool helped participants draw attention to the specific areas they considered important. As they laid down the rope, they adjusted its
Figure 65: Participatory Mapping workshop in Karlsruhe with international partners. Participants practice with perspectives. Photo taken by Naomi Bueno de Mesquita.
position until a balanced delineation for each approach was achieved. Following this delineation, a discussion ensued in which participants evaluated the choices made. They discussed whether everything they wanted to include was actually captured, whether the delineated area might be too large, and what might be missing. This discussion also enabled the exploration of the visual and spatial relationships between the different perspectives, which is crucial for a deeper understanding of how various interests and opportunities are interconnected. In this way, not only the focus areas become clear, but also how perspectives on the area relate to one another.
Before the workshop in Karlsruhe began, it became clear that the preparatory materials, such as the WETsus article and the instruction sheet, had been read by almost no one, necessitating a brief presentation. Due to time constraints and new agenda items, the actor mapping was skipped, and the session focused on a few specific use cases without the presence of key use case owners. This led to a disorganized start and highlighted the importance of actor mapping and the presence of a workshop facilitator, as evidenced by the effective session with facilitator Liesbeth Huybrechts in her group.
Figure 66: Participatory mapping in Karlsruhe with international partners. Stickers are used to indicate opportunities on the map.
Participatory mapping in
with international partners.
are used to delineate and discuss focus areas.
Figure 67:
Karlsruhe
Ropes
During the workshop with the group in Hambach (which Naomi attended, see Figure 67), the paper map was effectively used in combination with visiting websites of actors and initiatives. The discussions uncovered tensions between participatory and institutional perspectives, with participation often regarded as a formality rather than an integral part of the decision-making process. This provided valuable insights for our research into how the actors of the German use case approach these perspectives, emphasizing the need for more time to further explore these issues.
Although the workshop in Karlsruhe was somewhat chaotic, we see significant potential for this mapping and the associated tools in future sessions or for future research. However, a key requirement is the need for more time, better preparation of participants, the presence of use case owners performing the mapping, a prior presentation, and a workshop facilitator.
Figure 68: Participatory Mapping workshop during a practice session with RUG and CK in Eindhoven led by Niene Boeijen. Photo taken by Naomi Bueno de Mesquita.
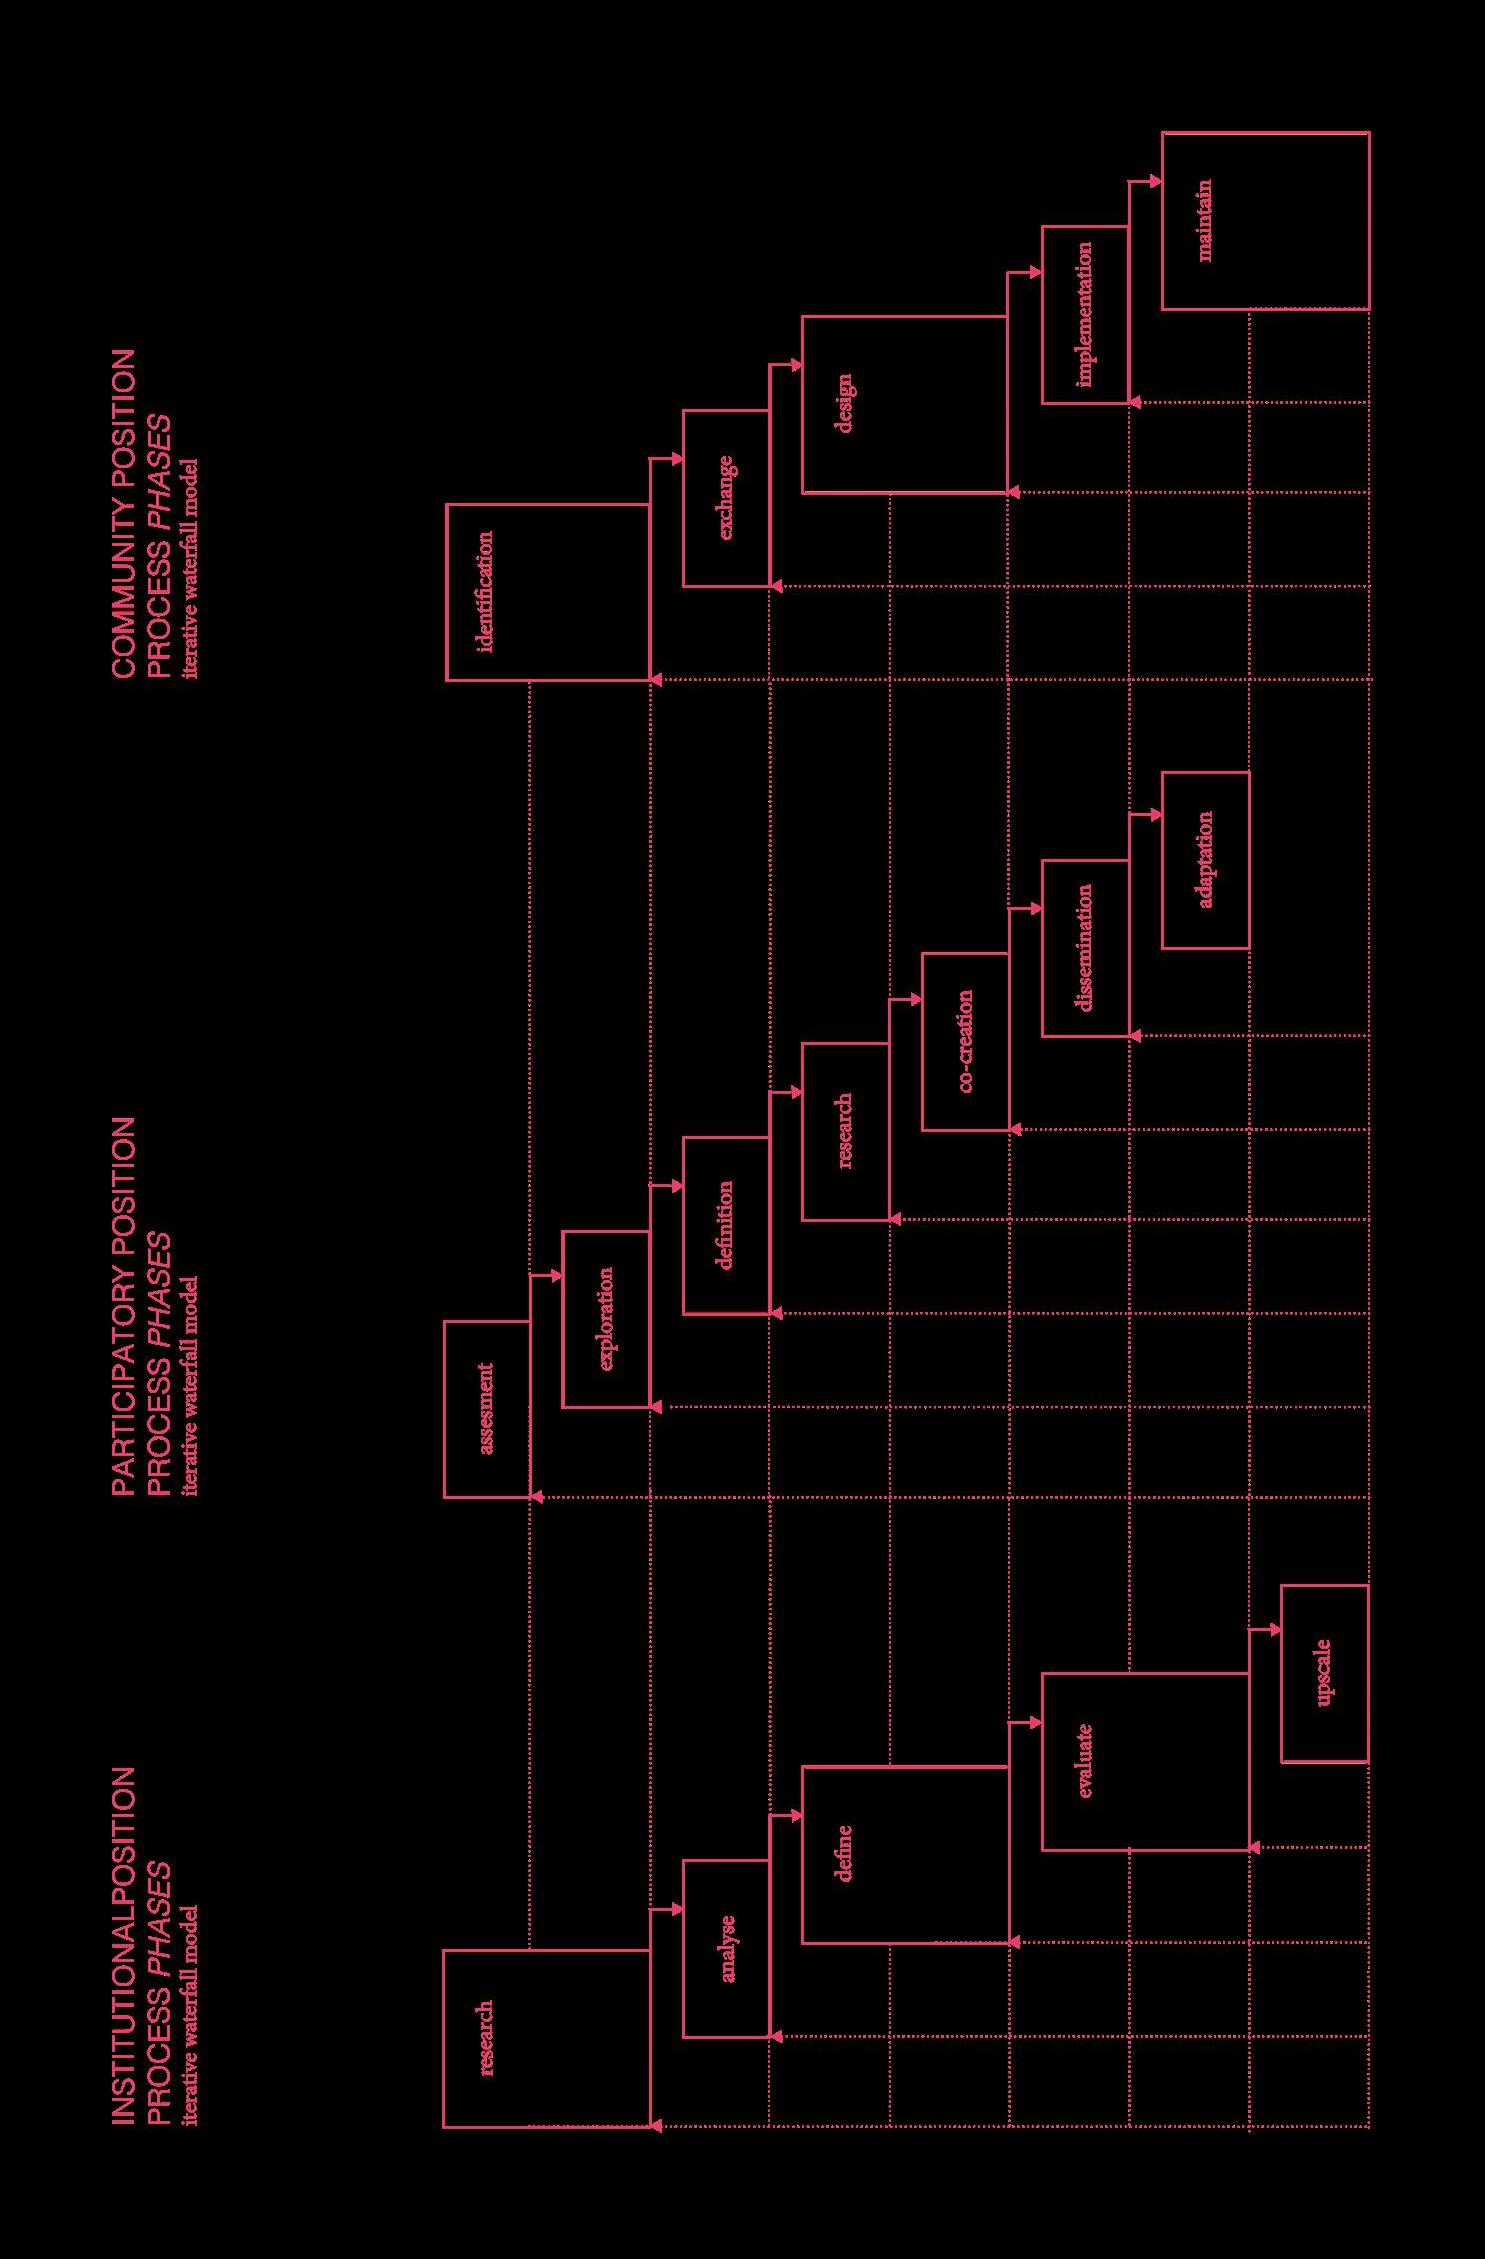
PHASE 2: THREE PERSPECTIVES FOR AREA-ORIENTED PLANNING
We departed from the idea that three perspectives play a key role in area-oriented planning: the local perspective, the participatory perspective, and the institutional perspective. Throughout the research, we defined what each perspective contributes and takes: these perspectives offer unique strengths and weaknesses that influence the effectiveness of community engagement in area development.
The local perspective (which we someyimes also label as the ‘community’ perspective in the project) encompasses in-depth local knowledge and a good understanding of the needs and priorities of the community, focusing on individuals organized around a shared interest or very much invested in the local community. This knowledge and embedding allow initiatives to be better aligned with local needs. Furthermore, there is a strong sense of trust and legitimacy within the community, contributing to greater acceptance and involvement in development projects. This perspective also has the ability to mobilize local resources and support, which is essential for successful implementation.
On the other hand, there are also weaknesses associated with the local perspective. There is potential for isolation/insularity, meaning external opportunities and broader initiatives may be overlooked. Additionally, there is a risk of bias towards immediate community interests, which can conflict with long-term sustainability goals or incoming/new communities. Communities often have limited access to institutional resources and formal support mechanisms, which can restrict their capabilities.
The participatory perspective offers an inclusive approach that values diverse voices and focuses on the collection of data across various scales and timeframes. This flexibility allows for problems to be adjusted and redefined based on community input, with the same community continuously being redefined. Moreover, there is openness to innovative solutions and multidisciplinary collaboration, which can contribute to creative and effective approaches to complex issues.
However, this perspective may lack in-depth, locally rooted knowledge and connections, thereby compromising the effectiveness of participatory processes. Additionally, there is a risk that this approach becomes fragmented without clear goals, leading to process fatigue. Finally, it can be challenging to obtain formal recognition and support from institutional bodies, complicating implementation.
The institutional perspective offers important advantages to the participatory perspective, such as access to formal resources, funding, and regulatory support. This enables long-term sustainability to be assured and alignment with broader policy goals. Furthermore, institutions often possess expertise in administrative matters (such as grants), contributing to the efficient execution of projects. On the other hand, this perspective also presents a risk of a top-down approach that does not align with local community needs. This can lead to potential inertia, slowing down innovation and responsiveness. Additionally, this perspective may prioritize formal knowledge over local insights and initiatives, which can result in a legitimacy gap.
Contributions from the local community and institutions to the participatory perspective are crucial. Communities provide grassroots insights and practical applicability for participatory processes, strengthening legitimacy and trust among local stakeholders. Furthermore, they facilitate the identification of local intermediaries (which we also refer to as boundary spanners) who can bridge the gap between local and participatory efforts. On the other hand, institutions provide stability and ensure that participatory processes have the necessary resources and regulatory support. They also help align participatory initiatives with broader policy frameworks, making them sustainable in the long term and/or scalable.
Recognizing and balancing the local, participatory, and institutional perspective is essential for long-term enagement of the local community in climate-adaptive water hubs. The key is to combine the strengths of each perspective.
TENSIONS BETWEEN THE PERSPECTIVES
Due to a continuous tension between these perspectives, it is important to map actors from each perspective and regularly update these maps. This ensures that all three perspectives are adequately represented and maintained. Additionally, it is essential to deepen the analysis of case studies to identify best practices and lessons learned in balancing these perspectives. We should also develop tools and methods that integrate insights from each perspective, allowing future area development projects to be effectively guided (we will present such a tool later in the document). Furthermore, workshops should be organized where representatives from the three perspectives come together to promote dialogue.
BALANCING BETWEEN THE PARTICIPATORY AND INSTITUTIONAL PERSPECTIVES
An example where the tension between the participatory and institutional perspectives was clearly visible in this case is Buurtgroep De Kemmer (n.d.). Niene interviewed a boundary spanner in this neighborhood group. This individual had gathered local perspectives over an extended period of time and presented them to the municipality in a comprehensive and well-substantiated report.
In bringing together the perspectives, it is important to explore why the municipality may have overlooked certain findings in its policy vision. At the same time, the legitimacy of this individual as a representative of various local initiatives needs to be further scrutinized. Understanding the dynamics between participatory input and institutional actions within the neighborhood group is crucial.
The participatory perspective has strengths in promoting inclusion and collaboration among stakeholders, encouraging the integration of local knowledge, and possessing the flexibility to address dynamic challenges. On the other hand, this perspective may struggle with scalability and acceptance of regulations, and it can exhibit a lack of the structure needed for long-term sustainability. Conversely, the institutional perspective offers stability and predictability through established rules and norms. It brings administrative expertise
and ensures alignment with broader policy goals and access to resources. However, it often lacks the flexibility to adapt to changing circumstances and can become disconnected from local community needs, leading to a legitimacy gap.
In the paper „Balancing Institutional and Participatory Space in the Management of Water Imbalance: A Dual Institutional and Participatory Design Perspective“ (Neef et al., 2024), to which RUG and DAE contributed, the integration of these two approaches is explored. Key points include the complementary nature of institutional and participatory approaches, where each can offset the weaknesses of the other.
In Table 2, we outline these strengths and weaknesses of both perspectives (somewhat hyperbolically). The paper outlines various dilemmas and balancing acts necessary for the integration of participatory and institutional approaches. This includes balancing the deductive logic of institutions with the abductive logic of creativity and participation to create space for innovation within institutional frameworks. It is also important to combine structured frameworks with flexibility to accommodate both local contexts and broader policy frameworks. An interesting reflection is how ‚uncertainty‘ and unpredictability in outcomes (a precondition for the participatory approach) can be accommodated within institutionally driven participatory processes.
Table 2: Strengths and weaknesses of institutional and participatory design methods. From the WETsus article „Balancing Institutional and Participatory Space in the Management of Water Imbalance: A Dual Institutional and Participatory Design Perspective“ (Neef et al., 2024).
Structures the agency of actors; Structures the possibilities of what can, must, or must not take place in decision-making processes
Outside-the-box
Being free from rules may lead to new possibilities
Inertia / predictability-oriented Focus on stability (dynamic equilibria) so as to consolidate and perpetuate distributions of goods or power of actors.
Change-oriented Focus on change-oriented action so as to change the status-quo
Legitimacy from rules. Rules inform actions.
Legitimacy from actions Action seek to change rules
Biases of: overrepresentation of status quo; perspectives of researchers.
Unbalanced representation of actors x
Exclusion. Not focussed on maximizing representation and inclusivity.
Limited space for creativity (due to embedded inert rule systems)
Time-consuming
Restricts behaviour
Unrealistic at system-wide scale
Limited adaptive capacity
Too particular for system change
Takes long, high-threshold
Difficult to upscale due to disconnect from legal framework
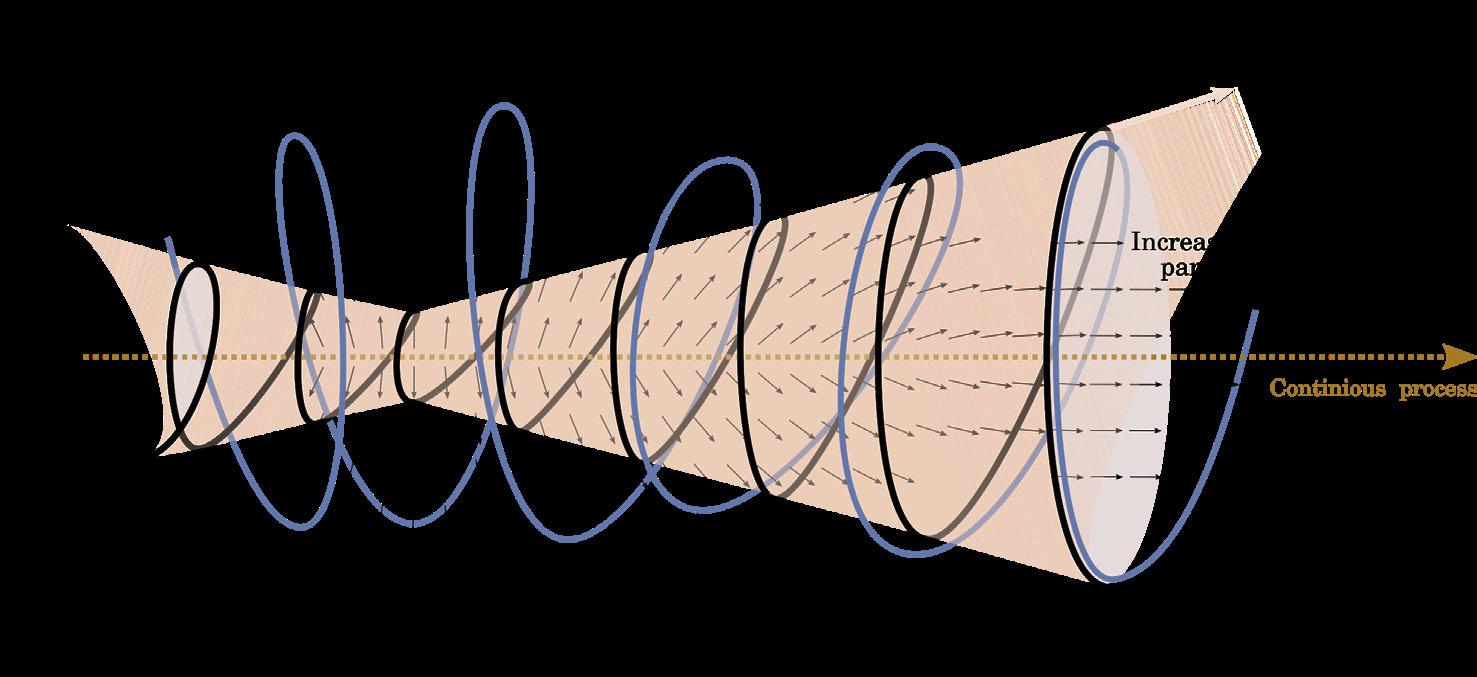
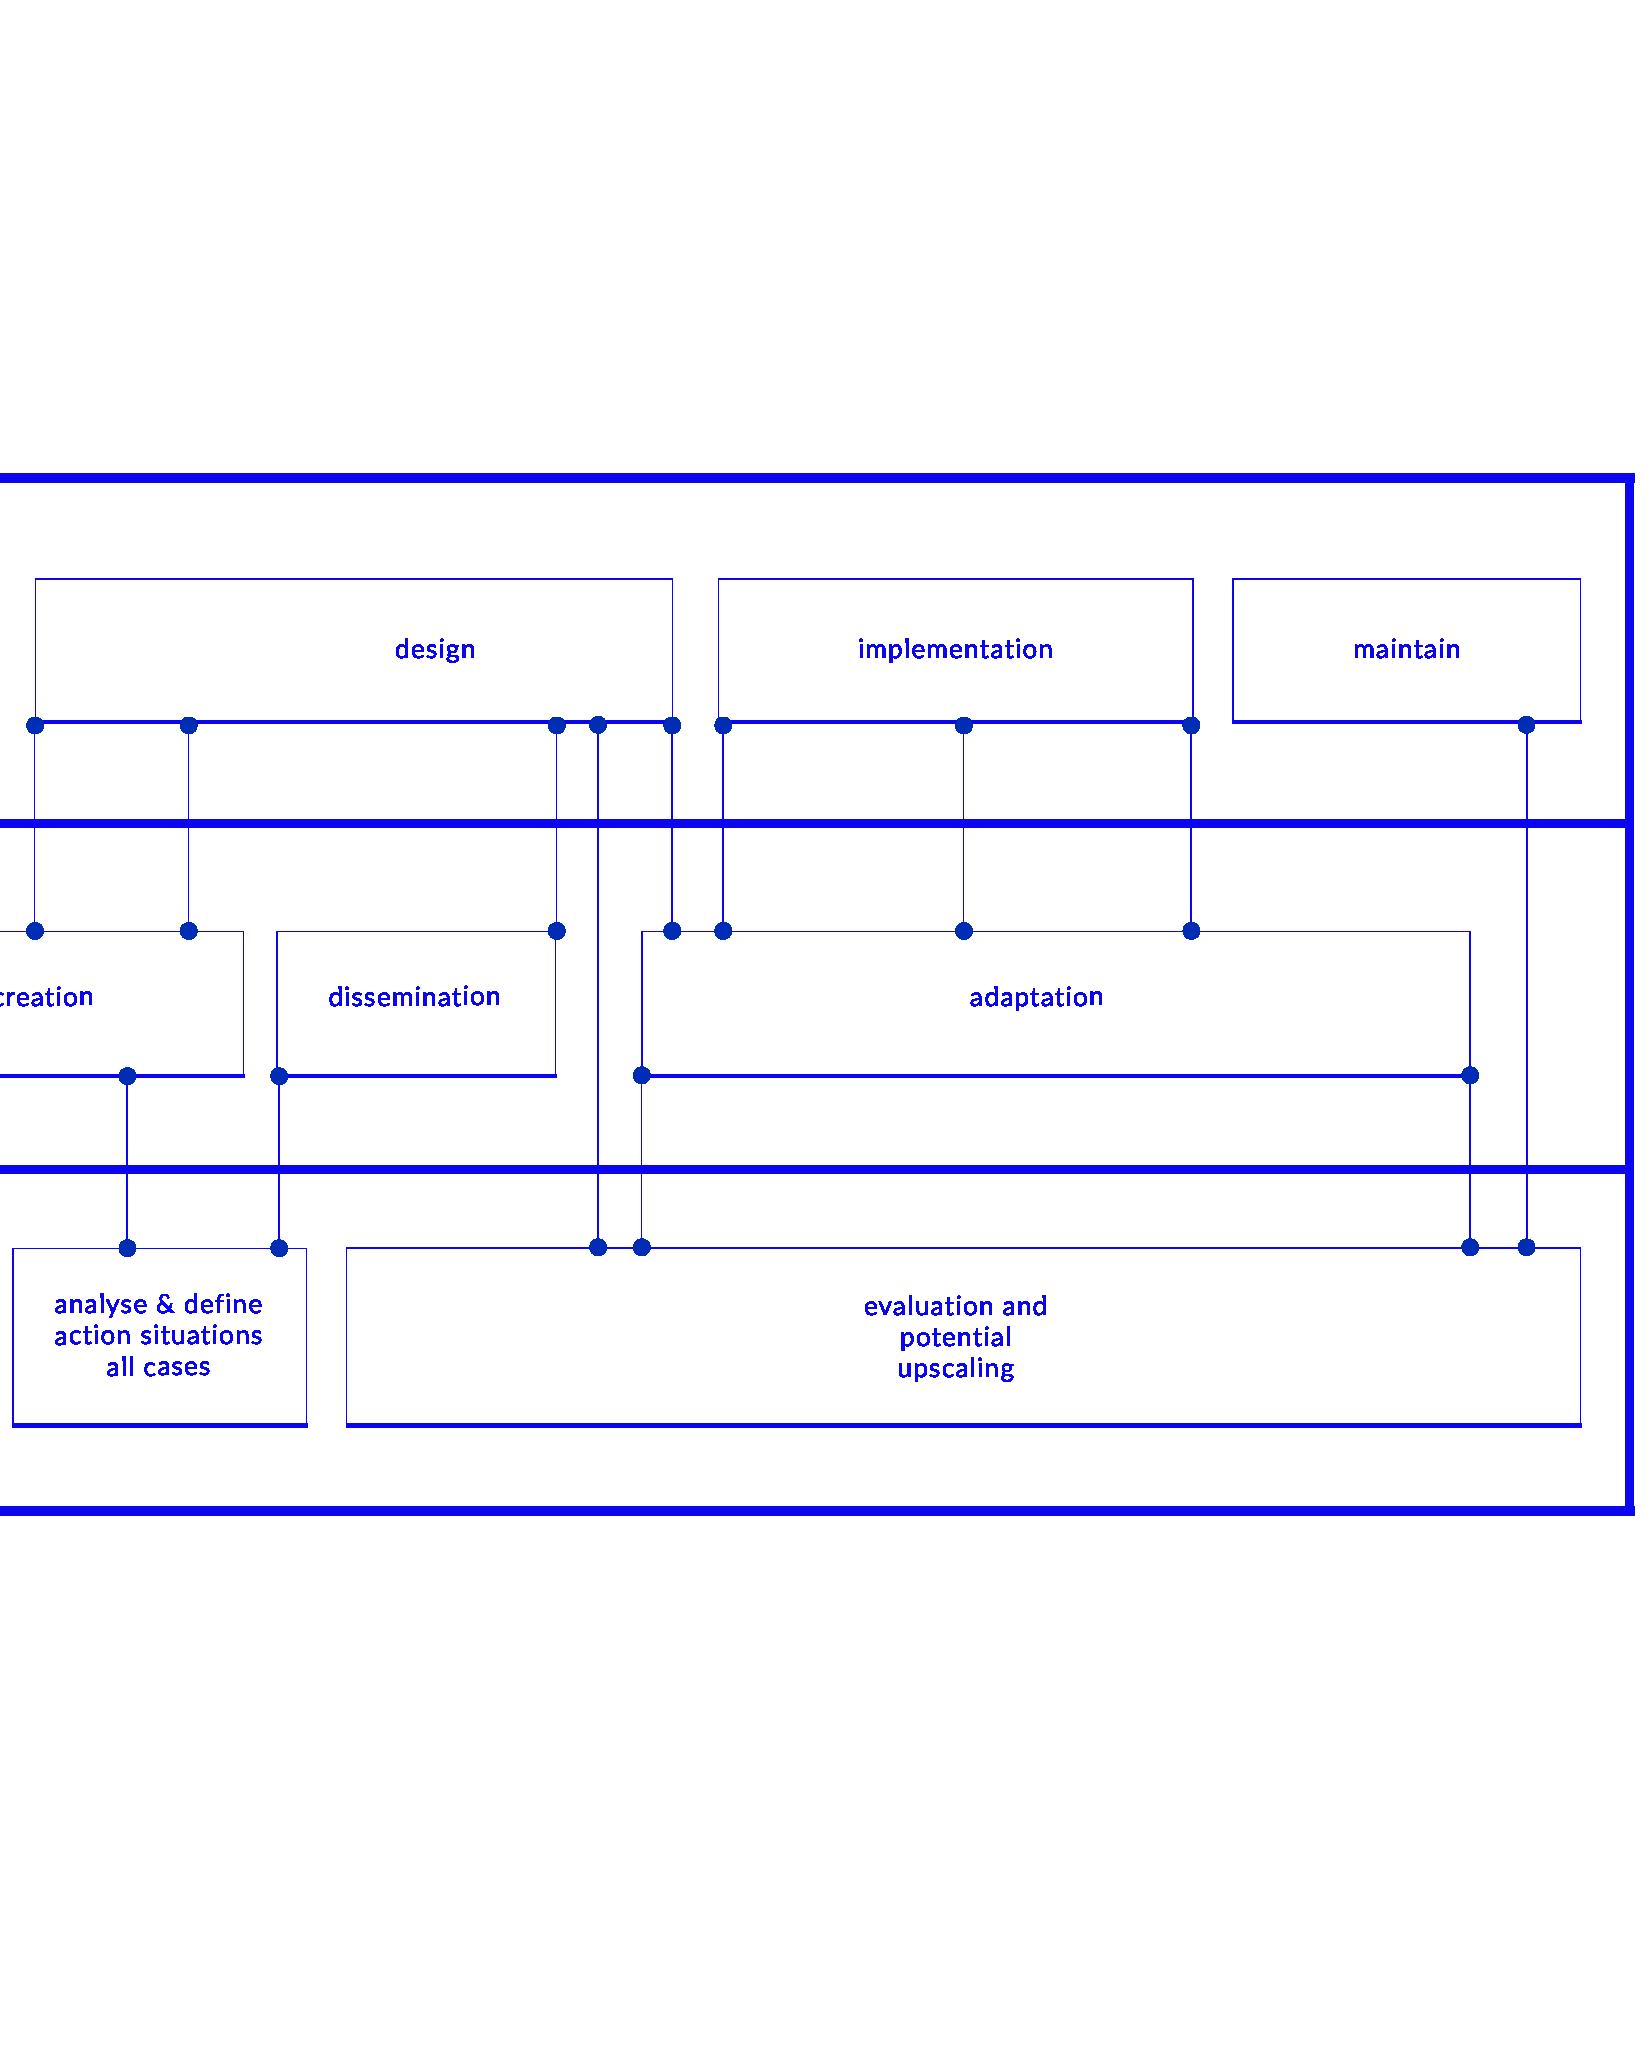
We further discuss how a combination of institutional and participatory approaches can contribute to better water management and other transition challenges in the Netherlands. It emphasizes that the weakness of one approach often serves as the strength of the other, allowing them to complement each other. This requires ongoing coordination and an evolving design process that integrates both existing and new local and regional initiatives, as we have attempted to visualize in Figure 69. Essential are boundary spanners who facilitate knowledge exchange and manage expectations. Moreover, an institutional analysis is crucial for navigating complex governance structures and enabling participatory action. The combination of both approaches can lead to innovative solutions and more resilient systems but requires collaboration between top-down and bottom-up approaches, valuing diverse perspectives, and respecting and allowing for alternative interpretations of the process.
Figure 69: An illustration of the gradual evolutionary convergence of an institutional and participatory approach. From the WETsus article „Balancing Institutional and Participatory Space in the Management of Water Imbalance: A Dual Institutional and Participatory Design Perspective“ (Neef et al., 2024). Visualization created by Niene Boeijen.
BALANCING BETWEEN THE PARTICIPATORY AND LOCAL PERSPECTIVES
The tension between the local and participatory perspectives emerged during an actor mapping exercise with Rijkswaterstaat, CK, DAE, and RUG (see Figure 54) and at various other points in the project. This tension is a result of the inherent biases and blind spots of each perspective.
The local perspective has advantages as it is represented by community members with in-depth local knowledge. Local boundary spanners connect social networks and act as recognized facilitators. However, this perspective can exhibit blind spots, such as ignoring external initiatives and broader benefits due to an overly strong focus on immediate and local needs.
In contrast, the participatory perspective involves outsiders without a clear agenda, resulting in the integration of a diversity of voices. This perspective looks beyond organized interests and also addresses informal initiatives that are not structured or ogranised. A key point, however, is that participatory designers can become too involved in such initiatives, which may lead to role confusion. Many examples show that they sometimes act as social workers (Miessen, 2011; see also Golchehr & Bueno de Mesquita, 2018). This situation can jeopardize professionalism and raise ethical concerns.
Merging these perspectes enables designers to maintain their focus by collaborating with local boundary spanners. This leverages the strengths of both approaches: designers provide a broad and open view using innovative methods, while boundary spanners ensure grounding within the community.
A balanced approach is essential for the sustainability of communityled projects. By utilizing local knowledge, participatory designers can ensure inclusion and avoid the risks of over-involvement and bias. This strategy ensures that projects are rooted in the community‘s needs and remain open and perceptive to broader or new initiatives.
EXCHANGE OF PERSPECTIVES USING THE SWIMLANE DIAGRAM
For the exchange between perspectives and to support a process model for GO-CAWH, research associate Anne Vader developed a variation of the Swimlane diagram.
Many process modeling methods use the concept of swimlanes as a mechanism to organize activities into separate visual categories. It is a method to represent a process in which multiple teams/ departments/organizations collaborate. The different lanes illustrate where processes differ and where they align. This makes the active collaboration transparent. Swimlanes are commonly used in business and management (Lucidchart, n.d.). There are open-source online tools that can be used to create a custom swimlane diagram, such as this one: https://swimlanes.io/
By visually acknowledging the different processes and their overlaps, understanding of each other’s steps is created. Swimlanes are primarily used as a communication tool, enabling representatives to clearly illustrate complex decision-making to all stakeholders. They quickly and clearly highlight inefficiencies, addressing situations where responsibility is lacking or where collaboration is needed.
In the case of the GO-CAWH project, there are three different processes that occasionally overlap and rely on each other, yet each must maintain its own pace and character. The strength of bundling the different perspectives lies in respecting and safeguarding these differences, not merging them. The institutional perspective cannot be subsumed by the participatory or local perspectives. Thus, the swimlanes protect the distinct processes while also ensuring collaboration. There is no need to compromise beliefs and findings; instead, the focus is on exchanging information. No compromises, only additions.
The swimlane model can be continuously adapted and supplemented. As values are carefully filled in for each area, actor, and possibility, the acquired information, along with any missing information, creates an overview of the situation. For instance, if information about interests or decision-making cannot be obtained, this indicates something about the approachability of the involved actor, making it clear that decision-making from this actor should not be expected. Filling in the entities and selecting the values ensure that estimates regarding
involvement are based on data rather than assumptions about the positions or interests. The differences between the assumptions of the actors and other perspectives compared to the situation as viewed through the lens and methods of representatives from the participatory perspective thus become clear. The model helps maintain role integrity. In situations where responsibility is lacking or there is a need for collaboration, the swimlane model provides a direct representation of the whole, making the need explicit. The swimlane model simplifies communication about very distinct and complex processes that must work together.
For GO-CAWH, Anne has sketched an iterative waterfall model as a variation of the swimlane, as it offers a sequential system that allows for revisiting earlier phases while also requiring the completion of subsequent phases to meet expectations. A drawback of many iterative models is the risk of evading accountability; the ability to remain indefinitely in the process can lead to a lack of responsibility, which is problematic in the context of applied processes at Rijkswaterstaat, where efficiency is important.
While iterative processes are common among designers, they can cause bottlenecks regarding time and costs for entities like Rijkswaterstaat, as they require accountability. This can be unrealistic, especially in design contexts. A circular iterative model offers more flexibility as it is not bound by strict deadlines but also brings risks, such as the fact that progress and collaboration are often conditional and not always made explicit. Conversely, the iterative waterfall model provides a good balance by combining the benefits of other iterative models with the assurance of progress and accountability.
70: Iterative waterfall model for the participatory perspective. Diagram created by Anne Vader.
Figure
71: Iterative waterfall model for the institutional, participatory, and local perspectives. Diagram created by
Figure
Anne Vader.
Figure 72: By placing the different perspectives and processes in a swimlane, touch points are created where relevant knowledge exchange can occur between the perspectives. Diagram created by Anne Vader.
PHASE 3: IDENTIFYING
PARTICIPATION OPPORTUNITIES
Based on the research conducted in phases 1 and 2, we developed an Action Arena Mapping Tool aimed at identifying participation opportunities. The tool is designed for members of a core team responsible for leading a participation process and is not intended for representatives of other perspectives.
The tool is relevant for organizations such as Rijkswaterstaat, municipalities, and provincial authorities, as well as for designers and other professionals looking to initiate a participatory process. It assists them in making informed decisions about how and when to engage actors, what resources they can use, and which methods are most effective to employ at different stages of the project.
FUNCTIONALITY
The data system, technically developed by Niene Boeijen and organizationally developed by Anne Vader, needs to be filled in with data by a user. By collecting and correlating this data in various ways and visualizing it, new insights can be generated. These insights stem from the questions that a user poses to the system.
It can be compared to a map that is filled with data to perform calculations, such as the shortest route between two entities, the warmest route, or the route that facilitates the most social interaction—this depends on the data you add to the system and the questions you ask the system.
Example questions that can be posed to the data system (see Figure 73) include:
What is the shortest route from Rijkswaterstaat to a specific resident? What connections already exist between them?
-> -> -> Which locations have no connection to a stakeholder, meaning which places are not represented by anyone?
What is the shortest route from a phase to a resident? Which method would be most effective to employ?
Figure 73: A screenshot of the backend of the website showing what possible questions can be posed to the data system. The code was written by Niene Boeijen.
74: A schematic overview of the website architecture. Original diagram created by
Figure
Anne Vader and modified by Toni Wagner.
DESCRIPTION OF SELECTED CATEGORIES
Figure 74 demonstrates the website architecture of the tool. After a brief introduction, a user can choose between ‚scope,‘ ‚positions,‘ and ‚actions.‘ While ‚scope‘ and ‚positions‘ provide more generic solutions, such as the phases of a participatory project, the ‚actions‘ option allows the user to engage directly and tailor the tool to the context that is relevant to them.
POSITIONS
The scope pertains to the extent of the project. It includes:
Phases: Characterizes the process of a participatory approach, namely: assessment, inventory, definition, research, creation, dissemination, and adaptation. This process is also reflected in the swimlane diagram.
Conditions: This section describes the prerequisites and conditions necessary for establishing a participatory process.
Representatives: A representative is a person or organization that has influence over and interest in the outcome of the process. We distinguish between representation from government, representation from a community, and representation from an individual.
The position indicates how a representative is organized. We make distinctions between:
Government-organized
Organized around a shared interest
Non-organized or organized from an individual interest
To make the generic solutions context-specific and to allow users to actively engage with the tool, the ‚actions‘ section has been added. Within ‚actions,‘ the following three steps can be followed:
Method & Tools; For each phase (categorized under ‚phases‘), specific methods are recommended regardig how to collect specific data, such as how and when to use an actor mapping, etc.
Mapping Approach; Through data input from the participant an action arena map is created. This visualization consists of entities such as locations, actors, positions, etc. (visualized as nodes) and the relationships between those entities (visualized as lines). Values are assigned to the entities, allowing the sizes of the nodes to be visualized as larger or smaller. The user can choose which parameters to correlate to gain unique perspectives.
Activation; The user can respond to the identified opportunities.
In this way, the tool allows a user to methodically collect input, gain insights by correlating data, and identify participation opportunities.
ACTION ARENA MAP
The data system allows us to pose different questions, each of which can tell its own visual story. Through the action arena map, a personalized ‚visual story‘ can be created. This visual story is based on correlations between some or all of the following entities:
Places
This refers to the geographic or administrative area where the participation process occurs. The place may contain values that are administrative, cultural, social, or natural in nature.
Actors
Defined as an individual, group, or organization that plays a role in the participation process. Within this definition, various values are recorded, such as their position, specific interests, or role in decision-making.
Positions
This section discusses how actors are organized, distinguishing between government-organized, organized around a shared interest, or organized from an individual interest. Government-organized refers to processes facilitated by regulation. Organized around a shared interest pertains to individuals who unite to achieve common goals. Unorganized or individual interests are often still unknown but can become visible through a participatory approach and evolve into an organization around a shared interest.
Relations
A relation is a connection between entities that has an effect (exploratory, informative, illustrative, guiding) on the participation process.
Possibilities
This refers to the resources and opportunities that can be explored within the participation process. It includes aspects such as materials, expertise, knowledge, and financial resources.
Table 3 displays the values associated with each entity. We have currently assigned these values, but they may differ and/or change depending on the case.
Table 3: Different values we have assigned to the entities of places, actors, positions, relations, and possibilities.
Usability: constant, variable, incidental, unknown, to be determined.
Goal: facilitate, organize, activate, inspire, inform, unknown, to be determined.
Urgency: responsible, demand, necessity, wish, expectation, anticipation, rejection, unknown, to be determined.
Representation: resident, administration, official, manager, forest ranger, visitor, owner, user, researcher, enforcement officer, unknown, to be determined.
Here are some examples of how to interpret a visualization:
Figure 75 displays the actors and locations, along with the relationships between these entities, distinguishing between proximity to, ownership of, or collaboration with a place. An actor possesses one of these characteristics: government, community, or individual.
It becomes particularly interesting when an actor is involved in multiple clusters and manages to connect them, as shown in Figure 76. Here, a governmental actor is depicted as being connected to various locations, thus functioning as a link between these two clusters. This approach allows us to visualize the boundary spanners.
In Figure 77, where we have the data from our use case, it is evident that the Wilhelmina Canal is connected with many ‚individual‘ actors, in contrast to, for example, the A58, De Kemmer, or Brabants Landschap. Generally, these actors are not grouped around a shared interest. We also see new places emerging that are connected to this location (the Wilhelmina Canal), such as the harbor, which also manages to link new actors to it.
No conclusions can be drawn yet, given that the input data is still limited. However, as new data is uploaded, this visualization will become more complete and will offer increasingly valueble insights.
Figure 75: A screenshot of the frontend of the website. It displays actors and places with different values and relationships between these two entities. Created by Niene Boeijen.
Figure 76: A schematic overview of how the entities might relate to each other. Visualization created by Anne Vader.
Figure 77: A screenshot of the frontend of the website. It clearly shows which location is connected to many actors. Created by Niene Boeijen.
WHAT INSIGHTS DOES THE VISUAL PROVIDE?
The visual provides insights into participation opportunities by structuring crucial elements. There are several fixed components that contribute to obtaining contextual outcomes, such as:
1.
2.
Place: Every water innovation project is location-specific. The definition of this place varies depending on the involved actors and perspectives. By explicitly defining the values of the location, discussions about what to include and exclude can be conducted more effectively.
Actor: Participation takes place among various actors from different organizations with diverse interests. The values assigned to these actors clarify their role and position in the process, facilitating the identification of potential collaborations and conflicts.
It is essential that the different values are chosen independently; multiple values cannot be selected for one entity at the same time, which helps register conflicts. When an actor has conflicting interests and it is unclear which is primary, this can be classified as a conflict.
By carefully filling in the values for each place and actor, a clear overview of the situation emerges. Missing information, such as ambiguity around interests or decision-making, provides insight into the approachability of the involved actors. This indicates that decision-making with these actors may not be feasible. Filling in the entities and selecting values ensures that estimates about involvement are based on data rather than assumptions.
TECHNICAL SPECIFICATION
The technology used for this visualization is Neo4J - Graph (n.d.). A knowledge graph, or semantic network, represents concepts from the physical living environment through data points (nodes) and their connecting relationships (edges). This database organizes knowledge into an interconnected structure, with each node symbolizing a distinct entity. The edges define the relationships between these entities, improving our understanding of their interconnections.
For our project, it is important to collect data about the location of Oirschot, as well as about the people, organizations, and places we
have encountered. In the design process, it is essential to determine which entities and connections are relevant and what values we assign to those entities. We then need to establish what questions we want to be able to pose to the system.
The insights we gather are stored in a Neo4J database, allowing for effective access. The goal is to develop a user-friendly website that communicates with this database via an API. So far, this development has not been realized due to time constraints and limited technical skills.
ITERATION
The interactive network visualization must equip users with the skills and foundational knowledge to make informed choices and indicate what the tool can offer that they cannot achieve on their own. Users should have the ability to create their own nodes, provide input about actors, and create informative layers, accompanied by relevant guides.
Additionally, it is important to provide insight into the relationships between actors and to understand why certain interactions are connected or not. At the outset, users should learn about three perspectives: institutional (aware of formal and informal rules), grouped around a shared interest (such as a cooperative), and loose/ individual initiatives (such as an orchid woman or water angel). This will make navigating the complexity of involved stakeholders and their interests easier.
To further expand the tool, it is essential to enhance its capabilities, allowing for more questions to be posed. This can be achieved by opening up the database with an API, which will not only bring more dynamism to the data but also significantly expand the design challenge.
Examples of questions that can be posed include: „How many connections does an actor have?“ and visualizing the distribution of different types of other actors they are connected to.
Additionally, it would be interesting to explore how far an actor is from connecting with the municipality, and which locations are wellconnected to the community but not to organizations. It would also be beneficial to assign weights, directions, or properties to connections, as the system currently suffers from a degree of flatness. The more
data and complexity are processed, the more intriguing questions can be posed to the system and the richer ther insights.
Finally, it is advisable to add phases and methods so that users can also ask questions about these elements. We can view this as additional layers to the system, similar to a route planner, where you can not only calculate the shortest route but also a route that leads to various museums. These enhancements would significantly increase the functionality and applicability of the tool.
CONCLUDING AND FURTHER RESEARCH
In this research, we employed a three-part structure: an exploratory reesach phase, the identification of three perspectives for areaoriented planning, and examining participation opportunities. Prior to the use case analysis, we studied the role of visual methods, particularly maps, within spatial design processes. We utilized a framework developed by Carton that applies „frames“ as a lens to analyze the design and interaction with maps. The three frames— analytical, design, and negotiation—offer various approaches to decision-making in participatory design processes. Within these processes, data-driven analyses (such as exploration using GIS, open data, and digital scraping), creative methods (the eliciting tools used in interviews and other visual methods), and maps for political negotiations (actor mapping and participatory mapping) converge to promote inclusive area-oriented planning.
During the exploratory phase, both qualitative and quantitative data and soft and hard data were collected and synthesized. The maps, compiled using GIS, open data, digital scraping, and other methods, contributed to formulating targeted research questions for field research and identifying relevant individuals and locations for further investigation. An important consideration in further studying digital scraping methods is connecting with institutional actors such as Rijkswaterstaat and exploring perceptions surrounding solutions for water management.
Additionally, it would be valuable to analyze social media data with geo-tags to understand how local communities communicate about water issues and potential solutions they propose. This offers unique insights into the experience of the problem, supported by data generated by residents themselves.
In our exploration of perspectives, we identified a knwoledge gap between participatory approaches within the design world and participatory methods employed by government agencies. This discrepancy seems to stem from the different ways in which ‚uncertainty‘ is approached and dealt with. Government agencies often strive for specific outcomes, while creatives leave room for open, research-driven results. Better understanding this tension between the need for unpredictable outcomes and the inertia of governmental institutions is crucial for designing and implementing participatory processes.
We presented the swimlane diagram as a model to unify these different processes. This model has the potential to better align the
processes of the three perspectives. However, there is still a lack of a well-founded rationale for the choice of process for each perspective. Future research should provide more transparency in these choices.
Moreover, the integration of institutional analysis proves to be a valuable addition to participatory design. Institutional analysis and the creation of institutional space are crucial for designers and others aiming to establish sustainable participation projects. This space can be defined as the freedom for (community) initiatives to make autonomous decisions regarding design, content, processes, and resources. This means that not only are there no constraints, but conditions also exist that support initiatives (Oteman, 2014, p. 4). By adjusting rules, for example through institutional design, additional space can be created (Neef et al., 2024). This offers opportunities to upscale initiatives or bring together yet ungrouped initiatives around a common interest. This institutional space can also lead to a role reversal, where governmental entities like Rijkswaterstaat are the ones participating.
Additionally, we examined how the participatory perspective can enhance the local perspective and vice versa. During an actor mapping workshop with Rijkswaterstaat, CK, DAE, and RUG, the tension between these two perspectives became apparent, stemming from biases and blind spots on both sides. The local perspective, which is deeply rooted in the community, may overlook external initiatives. In contrast, the participatory perspective fosters diversity by incorporating outsiders but can risk becoming overly involved in local initiatives. Collaborating with local boundary spanners can mitigate the potential for role confusion, allowing participatory designers to leverage local knowledge while maintaining inclusivity, ultimately promoting the sustainability and diversity of community-led projects.
In our case, the focus is on the highway and the Kloosters service area, including the location of pavilions. However, this zone does not attract the local population, raising questions about the effectiveness of this location for establishing a community participation project. From a participatory perspective, in-depth analyses of the actors surrounding Kloosters and perceptions about this place offer possibilities to identify key actors that might otherwise remain unnoticed.
A clear definition of roles prior to such projects has proven essential. For this reason, amongst others, we developed an Action Arena Mapping tool designed to identify participation opportunities.
Integrating this tool from the outset of a future project that brings these perspectives together could yield significant benefits.
For future use, we would like to expand the tool so that more questions can be asked by actually opening the database with an API. This will enhance the dynamism of the system. For example, we want to be able to ask questions such as: „How many connections does an actor have?“ and visualize the distribution of different types of other actors with whom that actor is connected. We also intend to investigate how far an actor is from connecting with the municipality and which places are well-connected to the community but not to organizations. Furthermore, we want to assign weights, directions, or properties to the connections; the more data and complexity we integrate into the system, the more interesting questions we can pose and the richer the insights.
Finally, throughout the research, we have observed a terminological shift from ‘participatory design’ to ‘area-oriented design’ This shift may indicate a growing recognition of the role of non-huamns/nature in decision-making processes, as illustrated by the Environmental Act. It emphasizes the need for a broader framework for participation.
BIBLIOGRAPHY
Bogatinoska, B., Lansu, A., Hugé, J., & Dekker, S. C. (2022). Participatory design of naturebased solutions: Usability of tools for water professionals. Sustainability, 14(9), 5562. https://doi.org/10.3390/su14095562
Bueno de Mesquita, N. (2022). Digital Performative Mapping [Doctoral dissertation, KU Leuven/LUCA School of Arts]. KU Leuven Research Repository.
Business Map. (n.d.). Kanban swimlanes –Kanban software resources. Retrieved January 25, 2025, from https://businessmap.io/ kanban-resources/kanban-software/kanbanswimlanes
Buurtgroep De Kemmer. (n.d.). Newspaper articles. Retrieved from https://www. buurtgroepdekemmer.nl/krantenartikelen
Carton, L. (2007). Map making and map use in a multi-actor context: Spatial visualizations and frame conflicts in regional policymaking in the Netherlands. Retrieved from http://repository.tudelft.nl/islandora/ object/uuid:f5821d4b-5299-4af9-baad176dbf1daabb/datastream/OBJ/download
Cyvin, J., Midtaune, K., & Rød, J. K. (2022). Using StoryMaps to prepare for field course –A case study of students in Geography. Cogent Education, 9. https://doi.org/10.1080/233118 6X.2022.2123583
DataVid. (n.d.). Knowledge graph visualization. Retrieved January 27, 2025, from https:// datavid.com/blog/knowledge-graphvisualization
Devisch, O., Huybrechts, L., & De Ridder, R. (Eds.). (n.d.). Participatory design theory using technology and social media to foster civic engagement. Digital Methods Initiative. (2020). Tool database. Retrieved from https://www. digitalmethods.net/Dmi/ToolDatabase
Dibiase, D. (1990). Visualization in the earth sciences. Bulletin of the College of Earth and Mineral Sciences, 59(2), 13–18. Doe mee Oirschot. (n.d.). [Website]. Retrieved October 16, 2024, from https://doemeeoirschot.nl/nl-NL/
Dreessen, K., Huybrechts, L., Laureyssens, T., & Schepers, S. (2011). MAP-it: A participatory
mapping toolkit. In www.map-it.be. Acco Nederland. Retrieved from https://lirias. kuleuven.be/handle/123456789/356569
Džokić, A., & Neelen, M. (2015). Instituting communing. Footprint, 9(1), 21-34.
Golchehr, S., & Bueno de Mesquita, N. (2018). Data-driven design for civic participation: Introducing digital methods for ongoing civic engagement for design in public space. In O. Devisch, L. Huybrechts, & R. De Ridder (Eds.), Participatory design theory: Using technology and social media to foster civic engagement. Routledge - Taylor & Francis Group.
Grafe, C., & Decroos, B. (2017). Linkeroever: Sprong over de Schelde. Die Keure.
Hajer, M., & Reijndorp, A. (2001). Op zoek naar nieuw publiek domein: Analyse en strategie. NAi, Rotterdam.
Hamers, D., Bueno de Mesquita, N., Vaneycken, A., & Schoffelen, J. (Eds.). (2017). Trading Places: Practices of Public Participation in Art and Design Research. Barcelona, Spain: dpr-Barcelona.
KNMI. (n.d.). Klimaatsignaal’21: Hoe staat het ervoor met het klimaat in Nederland? Retrieved from https://www.knmi.nl/over-het-knmi/ nieuws/klimaatsignaal21
Latour, B. (2005). Reassembling the social: An introduction to actor-network-theory. Oxford University Press.
Lucidchart. (n.d.). Swimlane diagram tutorial. Retrieved January 25, 2025, from https://www. lucidchart.com/pages/tutorial/swimlanediagram
Maceachren, A. M. (1994). Visualization in modern cartography: Setting the agenda. In A. M. Maceachren & D. R. Fraser Taylor (Eds.), Modern Cartography Series (Vol. 2, pp. 1-12). Academic Press. https://doi.org/10.1016/B9780-08-042415-6.50008-9
Meulemans, L. (2021). Strijd voor het publieke domein. Retrieved from https://www.rooilijn.nl/ artikelen/strijd-voor-het-publiek-domein/
Miessen, M. (2013). From written to practiced word. In A. Oosterman (Ed.), Volume #36: Ways to be critical. Stichting Archis,
Amsterdam. Retrieved from https://archis.org/ volume/from-written-word-to-practiced-word/
Miessen, M. (2011). The nightmare of participation. Sternberg Press.
Mrs. O. (2024). Informal encounter discussing the frogs and flowers at the waterside of the Wilhelmina Canal in Oirschot. Interview by N. Boeijen, [Oirschot], May 1, 2024.
MIT Press. (n.d.). The view from the road. Retrieved January 27, 2025, from https:// mitpress.mit.edu/9780262010153/the-viewfrom-the-road/
Neef, R., Bueno de Mesquita, N., Leenderste, W., & Boeijen, N. (June 2024). Balancing institutional and participatory space in the management of water imbalance: A dual institutional and participatory design perspective. Conference paper presented at the WETsus Economy for the Common Good International Conference, Leeuwarden, Fryslân, Netherlands.
Njambi, R. (June 16, 2021). Avoidance mapping: What it is & where it fits in the cartography cube. Geohub. Retrieved from https:// geohubkenya.wordpress.com/2021/06/16/ avoidance-mapping
Oirschot. (n.d.). Area vision De Kemmer. [Website]. Retrieved from https://doemeeoirschot.nl/nl-NL/projects/gebiedsvisie-dekemmer
Ostrom, E. (1990). Governing the commons: The evolution of institutions of collective action. Cambridge University Press.
Ouwekerk, C. (2024). About Buurtgroep de Kemmer and participation in the municipality of Oirschot. Interview by N. Boeijen & J. Kwaaijtaal, [De Kemmer], May 3, 2024.
Priesters, R. (2017). Onze online platformen: Hoe online platformen de democratie bedreigen én kunnen versterken. Citizen Data Lab, Hogeschool van Amsterdam. Retrieved from https://visualmethodologies. org/wp-content/uploads/2021/07/ OnzeOnlinePlatformen.pdf
Ramasubramanian, L. (2008). Geographic information science and public participation. In Advances in geographic information science.
31 January 2025
https://doi.org/10.1007/978-3-540-75401-5
Raviv, S. (2021). A place to stay (NL edition). Onomatopee 205.2: Embedded design in de praktijk.
Rural Road Water Rescue. (n.d.). Retrieved January 29, 2025, from https://ruralroadwater-rescue.nweurope.eu/
Rijksoverheid. (n.d.). Omgevingswet. Retrieved January 27, 2025, from https://www. rijksoverheid.nl/onderwerpen/omgevingswet
Van Barneveld, C., David, J., & Braan, N. (2022). Area-oriented working [Report]. Client: Rijkswaterstaat WVL, den Bakker, M., ’t Hart, I., & van Gelderen, M. Rijkswaterstaat.
Van Zutphen, P. (2019). Participatie bij infrastructuurprojecten: Een verkennende studie naar de gerealiseerde theoretische potentie van participatie bij infrastructuurprojecten (Master‘s thesis, University of Groningen). Retrieved from https://frw.studenttheses.ub.rug.nl/1038/1/ Participatie_bij_infrastructuu_1.pdf
VNG. (n.d.). Integraal werken. Retrieved January 27, 2025, from https://vng.nl/artikelen/ integraal-werken#:~:text=Integraal%20 werken%20betekent%20dat%20 mensen,de%20bedoeling%20van%20de%20 regels.
Wikipedia. (n.d.). Omgevingswet. Retrieved January 27, 2025, from https://nl.wikipedia. org/wiki/Omgevingswet