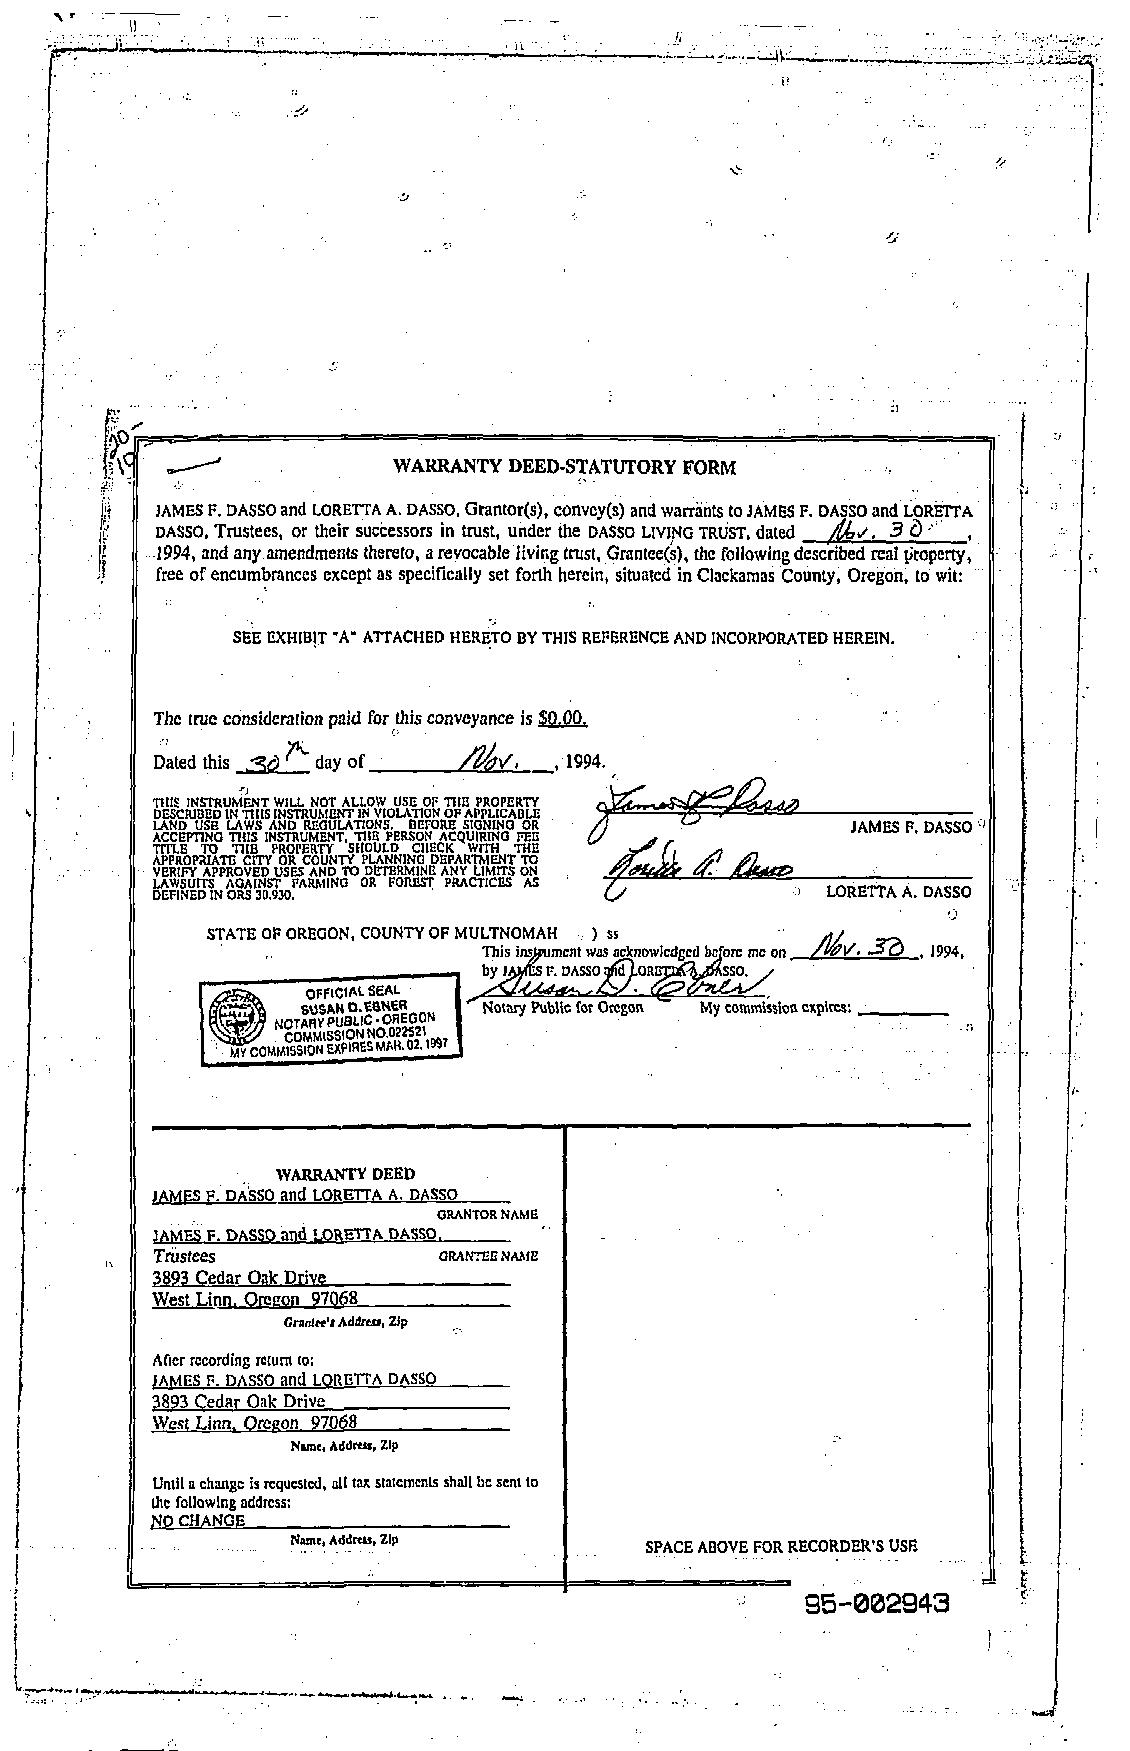
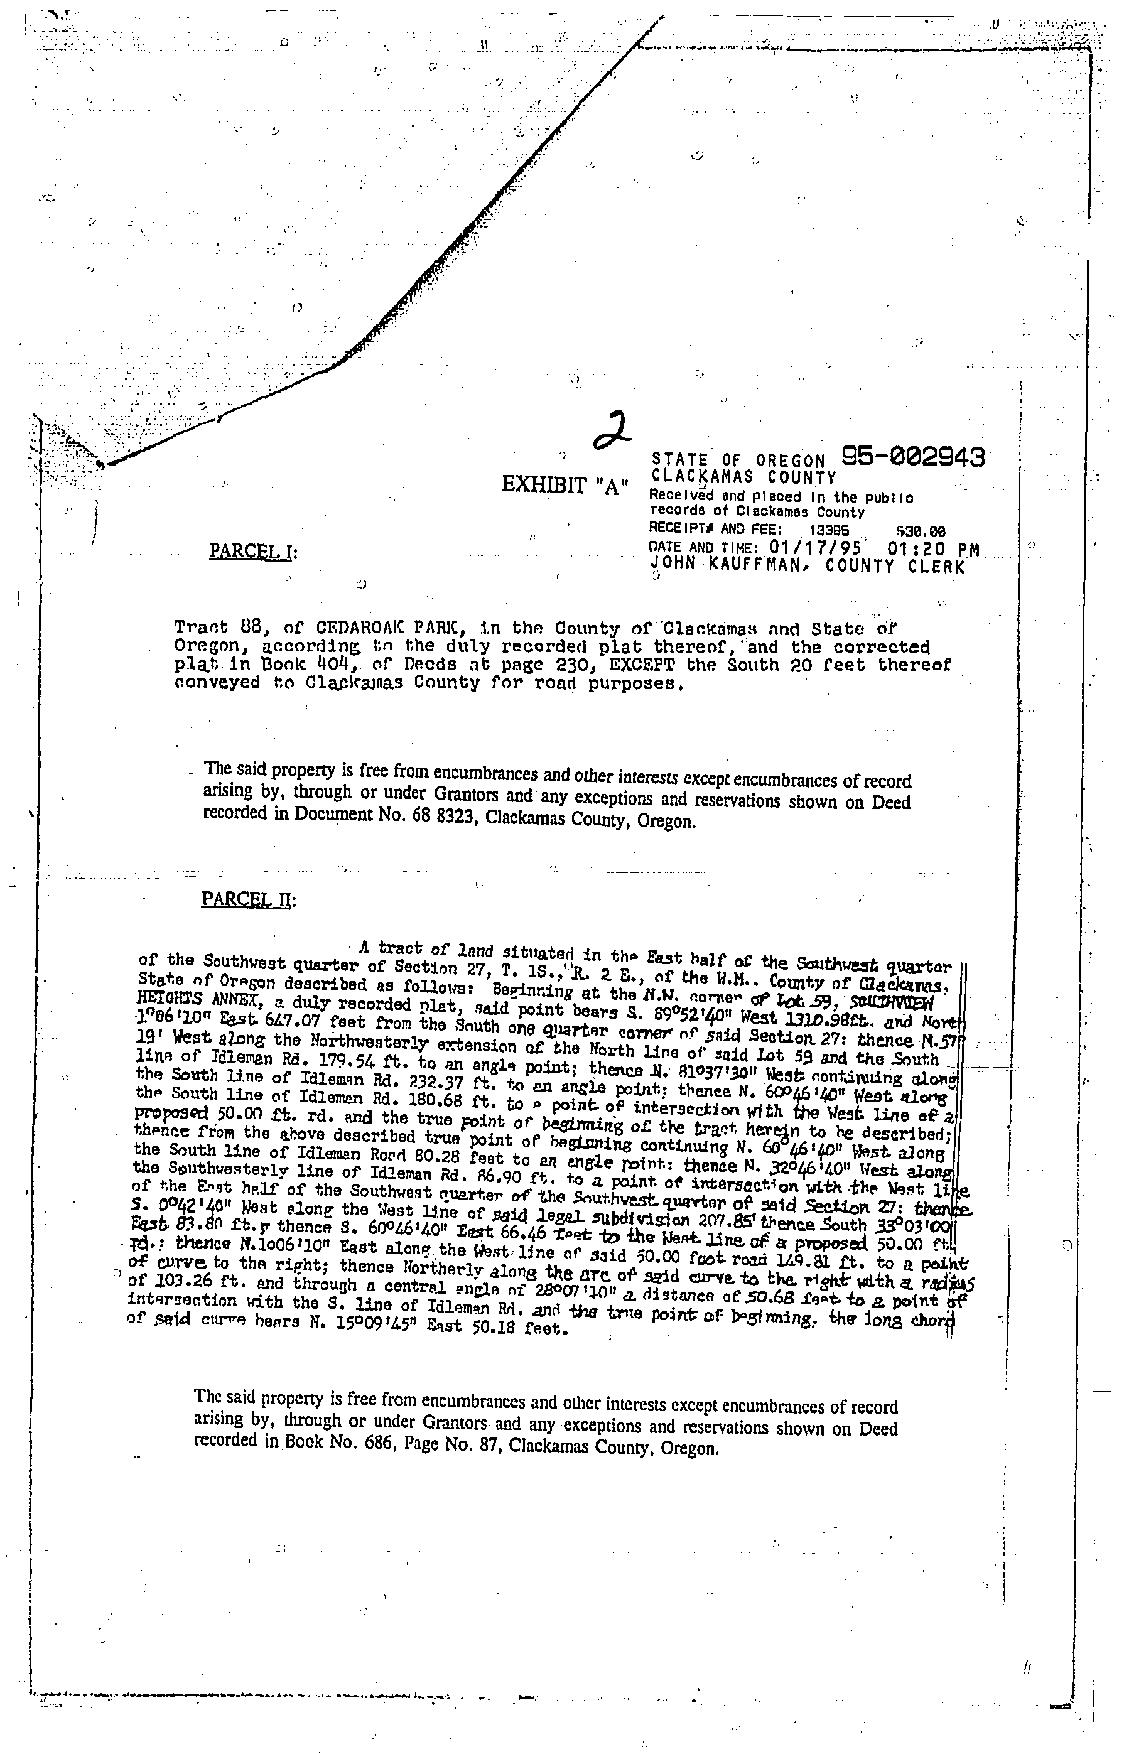
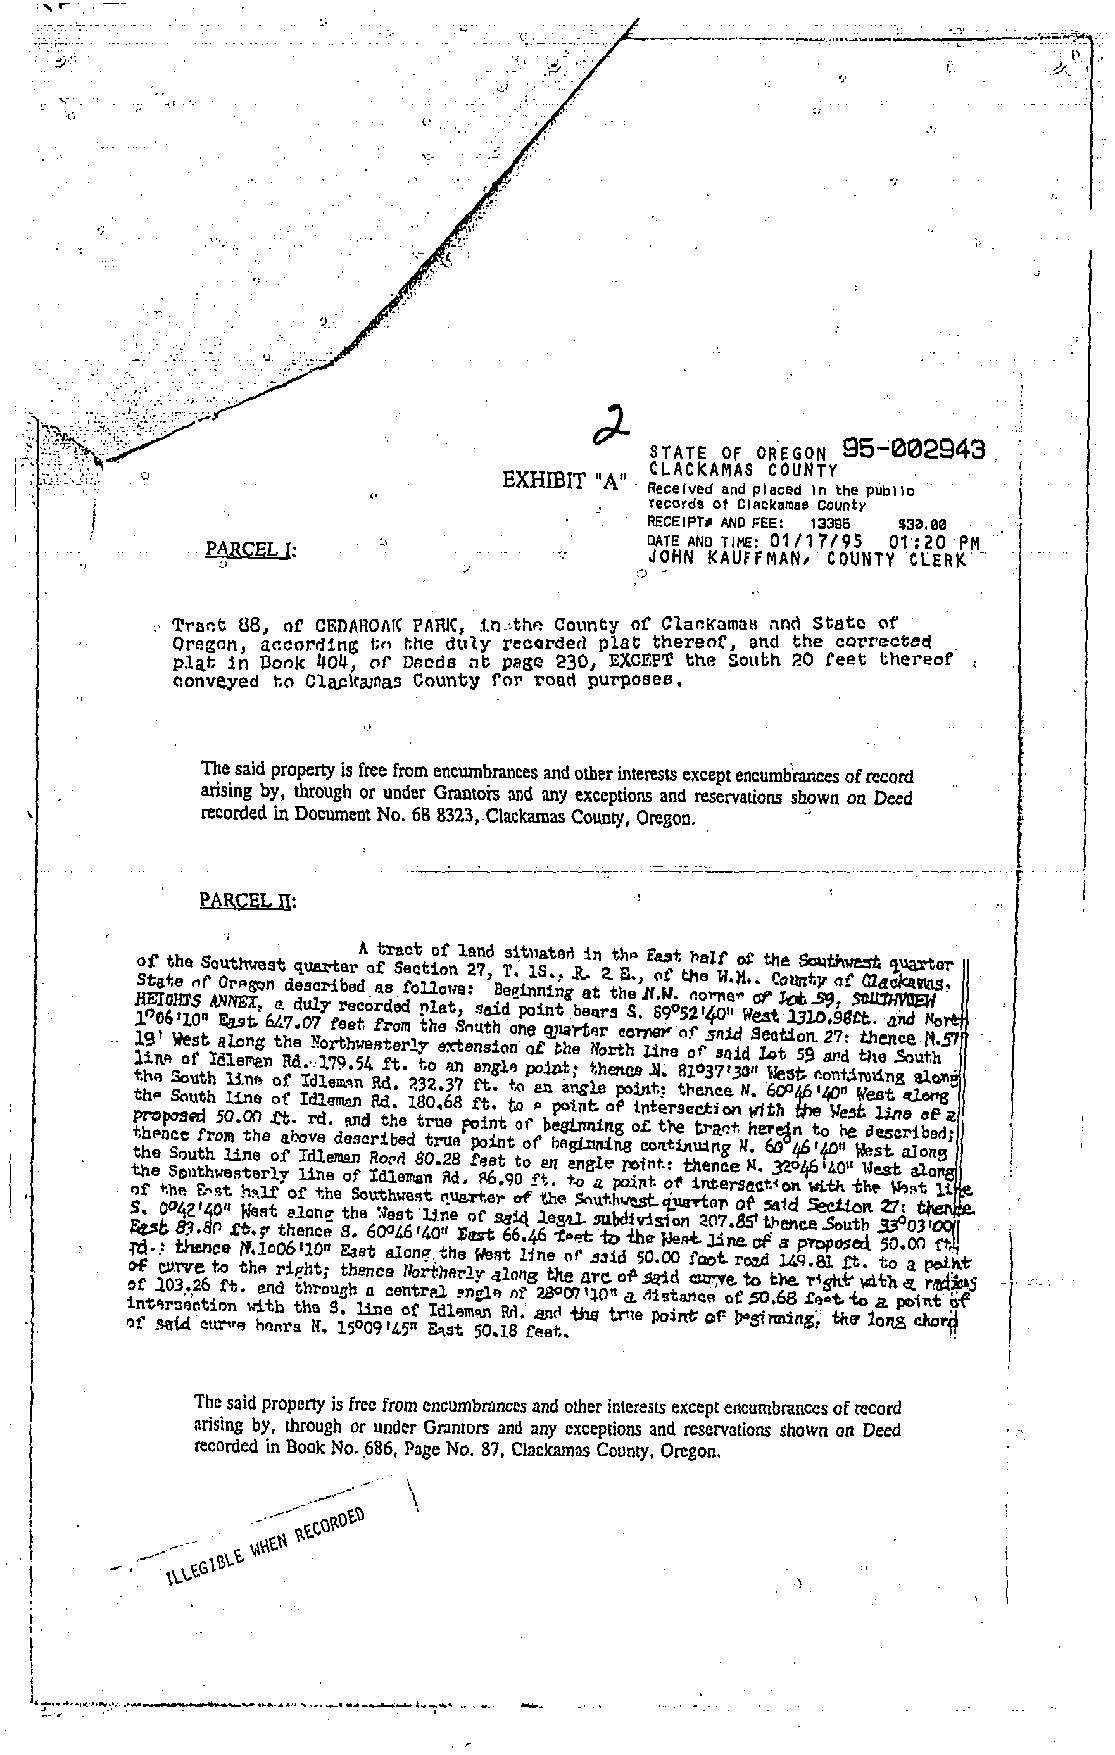
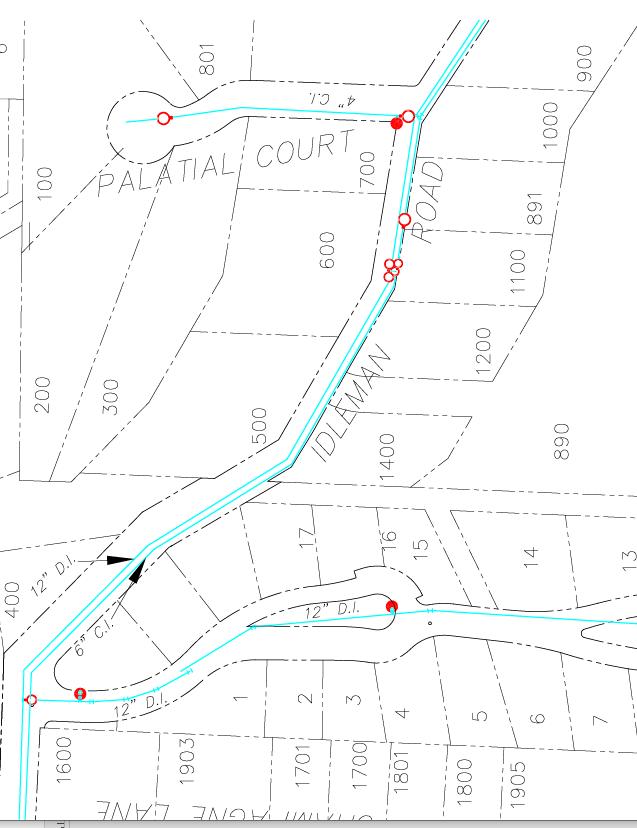
SEWER LINE MAP
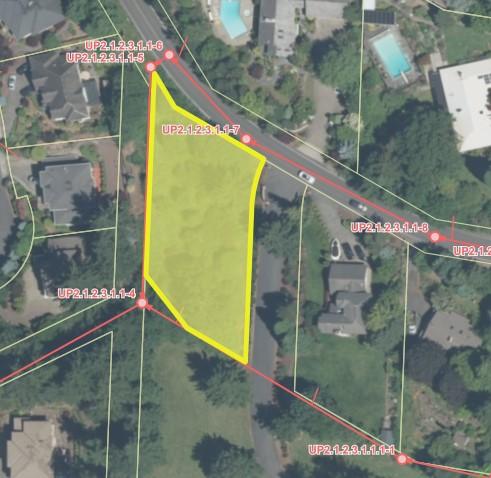
This map is a copy of public record and is provided solely for informational purposes.
WFG National Title assumes no liability for variations, if any, in dimensions, area or location of the premises or the location of improvements.

ZONING Detailed Zoning Information R20 (Residential 20,000 Sqft—Very Low Density) Zoning Map Community Jurisdiction DETAILS The information contained is provided by WFG’s Customer Service Department to our customers, and while deemed reliable, is not guaranteed.
Chapter 16.22. RESIDENTIALLAND USE DISTRICTS
§ 16.22.010. Future urbanization zone.
Purpose—Future Urbanization (FU-10). This district is intended to preserve for future development at urban densities the future urbanizable areas of the City as designated by the Comprehensive Plan and to act as a "holding area" for future urban development on lands formerly in unincorporated Clackamas County that are annexed to the City.
Area ofApplication. The FU-10 zone is applied to those areas designated as future urbanizable on the City's zoning map.
C.
Permitted Uses. Table 16.22.010-1 identifies the land uses that are allowed in the Future Urbanization (FU-10) District.
Table 16.22.010-1 Future Urbanization (FU-10) Permitted Uses
P=Permitted;
Temporary manufactured home to allow for care of an aged or infirmed relative, provided that adequate water, sewage, disposal and fire protection are available, and that tongue, undercarriage and axles remain intact on the unit. Undercarriage wheels and supporting base must be covered with a full ground length sign-obscuring skirting around the entire circumference of the manufactured home.
A. B.
City of Happy Valley, OR Tuesday, March 26, 2024
16. Land Development Code
Title
ARTICLE 16.2. LAND USE DISTRICTS
C=Conditional
Land Use FU-10 Residential Accessory dwelling units complying with Section 16.44.050 P One single-family dwelling, modular dwelling unit, mobile or manufactured home per lot.As an accessory use, there may be the customary outbuildings and no more than one accessory dwelling unit, complying with the requirements of Section 16.44.050 P Residential care facilities C
Use; X=Prohibited
C Home occupation, complying with the requirements of Section 16.69.020 P Institutional/Utilities Public and semi-public buildings and functions C Public utility substations or other function C Cemeteries C Church, synagogue, temple or other place of worship C Public or private schools C Commercial daycare facilities C
Table 16.22.010-1 Future Urbanization (FU-10) Permitted Uses
P=Permitted; C=Conditional Use; X=Prohibited
Land Use FU-10
Other
Agriculture and related activities, not to include the commercial processing for any type of agricultural products, whether animal or vegetable P
Open space in a natural state P
Fish and wildlife management programs P
Public and private conservation areas and structures for the conservation of water, soil, forest, or other wildlife habitat resources P
Private parks or recreation facilities C
Temporary use of a trailer, mobile home, or other building for a use incidental to construction work; provided that:
The maximum time period is six months, with a maximum extension for another six months;
The trailer, mobile home, or other building is connected to an approved sewage disposal system;
Abuilding permit for a permanent structure has been issued;
The temporary home or building shall be removed upon completion or abandonment of construction; and
No reasonable alternative, such as the availability of nearby rental housing exists. C
Personal use helicopter pads C
Any accessory structure which is customarily incidental to any of the permitted uses, on the same lot P
Development Standards. The development standards in Table 16.22.010-2 apply to all uses, structures, buildings, and development in the FU-10 District. The purpose of these dimensional standards is to:
Provide for fire safety and protection of all structures;
Provide for privacy and livability of dwellings and yard areas; and
Preserve, within urban growth boundaries, large parcels of land for future development at urban densities.
Adjustments to Dimensional Requirements. The dimensional standards in Table 16.22.010-2 may be modified under the procedures provided by Chapter 16.63. If the adjustment exceeds 10% of the applicable dimensional standard of this subsection, the matter shall be reviewed under the standards for a variance under Chapter 16.71. If the adjustment is less than 10% of the applicable dimensional standard of this subsection, the criteria shall be the purpose provisions of subsection (D)(1) through (3) of this section.
FU-10
Residential density
Average
Lot width
Lot depth (minimum)
Lot coverage(maximum)
Building setbacks (minimum)
unit for each 10 acres
acres
feet
feet
for all structures
D. 1. 2. 3. E.
Table 16.22.010-2 Development Standards for FU-10 Standard
(maximum) One
(minimum) 10
lot size
100
(minimum)
200
20%
1
Table 16.22.010-2
Front 32 feet
Side 12 feet
Rear 32 feet
Street side (corner lot) 15 feet
Building height (maximum) 45 feet
NOTES:
Density calculations shall be made pursuant to Section 16.63.020(F)
The single-family residential building height maximum is 45 feet at the front elevation; side and rear elevations may not exceed 49 feet.
(Ord. 389 § 1(Exh.A), 2009; Ord. 539 § 1, 2018)
§ 16.22.020. Very low density residential zones.
Purpose.
Residential—Forty thousand Square Feet (R-40). This district reflects the first developmental step in the conversion of agricultural or open space land to residential purposes. Through benefit of available public services and faculties, land in this district is capable of supporting lower densities, yet constraints may still exist which would limit present and future carrying capacities. This district provides the transition to the more fully urban development of higher districts while expressing physical limitations on the potential of the land. The district may be applied in sloped areas where clustering and other hillside protection standards are applied. The numerical designation R-40 shall be interpreted to mean that the maximum density shall be one primary dwelling unit per 40,000 square feet of lot area.
Residential—Twenty thousand Square Feet (R-20). This low density urban residential district responds to development patterns already established in the City and perpetuates those patterns in recognition of the potential for infilling and the overall carrying capacity of the land. Single-family detached dwellings on larger lots are encouraged in this district which seeks to maintain "elbow room and breathing space" within the urban framework of the City. This district is a buffer between the low density and undeveloped areas and the higher density, more typical urban residential districts. It is within this district that uses and standards begin to change to reflect the desired urban trends and patterns. The district may be applied in sloped areas where clustering and other hillside protection standards are applied. The numerical designation of R-20 shall be interpreted to mean that the maximum density shall be one primary dwelling unit per 20,000 square feet of lot area.
Residential—Fifteen thousand Square Feet (R-15). This low density urban residential district responds to the continuing urbanization of the City due to the availability of public sanitary sewers in areas previously zoned R-40 or R-20. Single-family detached dwellings are encouraged in this district which seeks to maintain "estate development" within the urban framework of the City. This district is a buffer between the densities allowed in the lower density R-20 district and the densities allowed in the medium density, more typical urban residential districts. The numerical designation of R-15 shall be interpreted to mean that the maximum density shall be one primary dwelling unit per 15,000 square feet of lot area.
Permitted Uses. Table 16.22.020-1 identifies the land uses allowed in the R-40, R-20 and R-15 Districts.
A.
B.
1. 2. 3.
FU-10 Standard FU-10
Development Standards for
2 1 2
P=Permitted; C=Conditional Use; X=Prohibited
Land Use
Residential
One single-family dwelling, townhome, duplex, triplex, quadplex, cottage cluster, modular dwelling unit or manufactured home per lot1
Multiple-family units or manufactured housing, approved as part of a PUD application pursuant to Section 16.63.130
Temporary manufactured home to allow for care of an aged or infirmed relative, provided that adequate water, sewage, disposal and fire protection are available, and that tongue, undercarriage and axles remain intact on the unit. Undercarriage wheels and supporting base must be covered with a full ground length sign-obscuring skirting around the entire circumference of the manufactured home.
Other Agriculture and related activities, not to include the commercial processing of any type of agricultural products, whether animal or vegetable
Public or private open spaces, parks and playgrounds, tennis courts and similar outdoor recreational activity areas and recreational buildings, facilities and grounds, which include fully or partially enclosed structures for the primary or secondary use
such as golf courses, aquatic centers, aquariums, amusement parks and similar uses
Temporary use of a trailer, mobile home, or other building for a use incidental to construction work provided that:
The maximum time period is six months, with a maximum extension for another six months;
The trailer, mobile home, or other building is connected to an approved sewage disposal system;
Table 16.22.020-1 Very Low Density Residential (R-40, R-20, R-15) Permitted Uses
R-40
R-20 R-15
P P P
P P P
dwelling
complying
P P P
Accessory
units
with Section 16.44.050
C C C Residential care home P P P Residential care facilities C C C Home occupation as defined
visions of Section
P P P Rooming houses X X X Commercial Commercial daycare facilities C C C Special event centers for hosting functions such as weddings, anniversary celebrations, corporate parties and similar events C C C Institutional/Utilities Public and semi-public buildings and functions C C C Public utility substations or other function C C C Cemeteries C C C Church, synagogue, temple or other place of worship C C C Public or private school(s) C C C
P P P
in Section 16.12.030, per the pro-
16.69.020
P P P
recreational
C C C
Large scale
facilities
C C C
Table 16.22.020-1 Very Low Density Residential (R-40, R-20, R-15) Permitted Uses
P=Permitted; C=Conditional Use; X=Prohibited
Land Use R-40 R-20 R-15
Abuilding permit for a permanent structure has been issued; The temporary home or building shall be removed upon completion or abandonment of construction; and No reasonable alternative, such as the availability of nearby rental housing exists.
Wireless communication facilities, not to include antenna support structures, subject to the provisions of Section 16.44.020 of this title
Construction of new streets and roads, including the extensions of existing streets and roads, that are included with the adopted transportation system plan
Any accessory structure which is customarily incidental to any of the permitted uses, located on the same lot
NOTES:
Applies to a parent lot. Duplexes, triplexes, quadplexes, and cottage clusters are not permitted on a child lot (i.e., previously subdivided lot from a middle housing land division).
Development Standards. The development standards in Table 16.22.020-2 apply to all uses, structures, buildings, and development in the R-40, R-20 and R-15 Districts.
Table 16.22.020-2 Development Standards for R-40, R-20, R-15
C.
C C C
P P
C C
P Helipad
C
P P
P
Standard R-40 R-20 R-15 Lot size (minimum): Single-family detached, duplex, triplex,
40,000 sq. ft. 20,000 sq. ft. 15,000 sq. ft. Lot size (minimum):Townhome 1,500 sq. ft. 1,500 sq. ft. 1,500 sq. ft. Townhome density (units per net acre) 4.4 du/net acre 8.7 du/net acre 11.6 du/net acre Lot width (minimum) 100 feet 80 feet 70 feet Lot depth (minimum) 200 feet 100 feet 90 feet Street frontage (minimum) Lots fronting on cul-de-sac 70 feet 50 feet 50 feet All other lots 100 feet 80 feet 60 feet Townhomes 20 feet 20 feet 20 feet Lot coverage (maximum) 20% 30% 35% Building setbacks (minimum) Front 22 feet 22 feet 22 feet Rear 22 feet 22 feet 22 feet Interior side 15/0 feet 10/0 feet 7/0 feet Street side (corner lot) 15 feet 15 feet 15 feet Cottage cluster, front 10 feet 10 feet 10 feet Cottage cluster, rear 10 feet 10 feet 10 feet Cottage cluster, interior side 10 feet 10 feet 7 feet Cottage cluster, street side 10 feet 10 feet 10 feet 1 1,6 1 2,6 3,6,7 6 4 4 4
quadplex, cottage cluster
Table 16.22.020-2 Development Standards for R-40, R-20, R-15
Standard R-40 R-20 R-15
Building height (maximum) 45 feet
Shared outdoor recreation areas 400 sq. ft./unit provided in accordance with Section 16.42.080
NOTES:
Density calculations for single-family detached shall be made pursuant to Section 16.63.020(F)
Cottage clusters must meet a minimum density of four units per gross acre.
Townhomes are exempt from the lot width requirements.
Cottage cluster housing is exempt from lot coverage requirements.
Interior side yard setbacks for townhomes may be reduced to zero in compliance with applicable sections of the adopted Uniform Building Code.
The single-family residential building height maximum is 45 feet at the front elevation; side and rear elevations may not exceed 49 feet.
If a duplex, triplex, fourplex, or cottage cluster has been divided by a middle housing land division, per LDC 16.61, the development standards that are applicable to the lot shall apply to the middle housing parent lot, not to the middle housing child lot.
Maximum lot coverage for townhomes is the greater of the percentage identified in the table or up to 1,000 square feet of buildings, decks, stairways and entry bridges that are more than 30 inches above grade (excluding eaves). Compliance with all other standards is required.
(Ord. 389 § 1(Exh.A), 2009; Ord. 406 § 1, 2010; Ord. 427 § 1, 2012; Ord. 433 § 1, 2013; Ord. 446 § 1, 2014; Ord. 468 § 1, 2014; Ord. 561 § 1(Exh.A), 2022; Ord. 571 § 1, 2022)
§ 16.22.030. Low density residential zones.
Purpose.
1.
Residential—Ten thousand Square Feet (R-10). This urban residential district is a means by which the densities are increased to make efficient use of available facilities and services in an environment of single-family dwellings. Variations in dwelling types and lot sizes should provide for a necessary flexibility in the City which will prevent typical appearances created by the traditional subdivision of land. Standards in this district are strictly urban oriented and are designed to develop and perpetuate urban trends and patterns. The numerical designation R10 shall be interpreted to mean that the maximum density shall be one primary dwelling unit per 10,000 square feet of lot area.
2.
3.
Residential—Eight thousand five hundred Square Feet (R-8.5). This urban residential district responds to the continuing urbanization of the City. Single-family detached dwellings are encouraged, but multifamily development is allowed in this district, as part of a PUD, which seeks to maximize the development potential in hillside areas. This district serves as a buffer between the R-10 and R-7 development districts. The numerical designation of R-8.5 shall be interpreted to mean that the maximum density shall be one primary dwelling unit per 8,500 square feet.
Residential—Seven thousand Square Feet (R-7). This development district will allow more urban residential density within the City through the use of small lots and a variation in dwelling types. Trends which were originated in lower density districts are continued and strengthened in this district and the patterns of the Comprehensive Plan are reinforced. Sanitary sewer and water are the most essential of urban services, but all Level I services and facilities are necessary and required for development at full density. The numerical designation R-7 shall be interpreted to mean that the maximum density shall be one primary dwelling unit per 7,000 square feet of lot area.
A.
2 1 2 3 4 5 6 7
B. Permitted Uses. Table 16.22.030-1 identifies the land uses that are allowed in the R-10, R-8.5 and R-7 Districts.
Table 16.22.030-1 Low Density Residential (R-10, R-8.5, R-7) Permitted Uses
P=Permitted; C=Conditional Use; X=Prohibited
Residential
One single-family dwelling, townhome, duplex, triplex, quadplex, cottage cluster, modular dwelling unit or manufactured home per lot
Multiple-family units or manufactured housing, approved as part of a PUD application pursuant to Section 16.63.130
Multifamily dwellings not approved as a PUD. Density calculation as defined in Section 16.63.020 may be used where applicable
Accessory dwelling units complying with Section 16.44.050
Temporary manufactured home to allow for care of an aged or infirmed relative, provided that adequate water, sewage, disposal and fire protection are available, and that tongue, undercarriage and axles remain intact on the unit. Undercarriage wheels and supporting base must be covered with a full ground length sign-obscuring skirting around the entire circumference of the manufactured home.
parks, subject to the
Other
Public or private open spaces, parks and playgrounds, golf courses, tennis courts and similar outdoor recreational activity areas and recreational buildings, facilities and grounds, which include fully or partially enclosed structures for the primary or secondary use
Large scale recreational facilities such as golf courses, aquatic centers, aquariums, amusement parks and similar uses
use of a trailer, mobile home, or other building for a use incidental to construction work provided that:
Land Use R-10 R-8.5 R-7
P P P
P P P
X X X
P P P
C C C Residential care home P P P Residential care facilities C C C Rooming houses X X X
home
provisions
P P P Home occupation as defined in Section 16.12.030, per the provisions
P P P Commercial Commercial daycare facilities C C C Special event centers for hosting functions such as weddings, anniversary celebrations, corporate parties and similar events C C C Institutional/Utilities Public utility substations or other function C C C Church, synagogue, temple or other place of worship C C C Public or private school(s) C C C
Manufactured
of Section 16.44.040
of Section 16.69.020
P P P
C C C Temporary
C C C 1
Table 16.22.030-1 Low Density Residential (R-10, R-8.5,
P=Permitted; C=Conditional Use; X=Prohibited
Land Use R-10 R-8.5 R-7
The maximum time period is six months, with a maximum extension for another six months;
The trailer, mobile home, or other building is connected to an approved sewage disposal system;
Abuilding permit for a permanent structure has been issued; The temporary home or building shall be removed upon completion or abandonment of construction; and
No reasonable alternative, such as the availability of nearby rental housing exists.
Wireless communication facilities, not to include antenna support structures, subject to the provisions of Section 16.44.020 of this title
Helipad
Construction of new streets and roads, including the extensions of existing streets and roads, that are included with the adopted transportation system plan
Any accessory structure which is customarily incidental to any of the permitted uses, located on the same lot
NOTES:
Applies to a parent lot. Duplexes, triplexes, quadplexes, and cottage clusters are not permitted on a child lot (i.e., previously subdivided lot from a middle housing land division).
Subject to applicable FAArules and regulations.
Development Standards. The development standards in Table 16.22.030-2 apply to all uses, structures, buildings, and development in the R-10, R-8.5 and R-7 Districts.
C.
R-7) Permitted Uses
C
C C
C
C C
P
P P
P
P P
R-10, R-8.5
Standard R-10 R-8.5 R-7 Lot size (minimum): Single-family detached, duplex, triplex, quadplex, cottage cluster 10,000 sq. ft. 8,500 sq. ft. 7,000 sq. ft. Lot size (minimum):Townhome 1,500 sq. ft. 1,500 sq. ft. 1,500 sq. ft. Townhome density (units per net acre) 17.4 du/net acre 20.5 du/net acre 24.9 du/net acre Lot width (minimum) 60 feet 50 feet 50 feet Lot depth (minimum) 80 feet 70 feet 70 feet Street frontage (minimum) Lots fronting on cul-de-sac 35 feet 35 feet 35 feet All other lots 50 feet 50 feet 50 feet Townhomes 20 feet 20 feet 20 feet Lot coverage (maximum) Single-family detached, duplex, triplex, quadplex, townhome 40% 45% 50% Building setbacks (minimum) Front 22 feet 22 feet 22 feet 2 1 2 1,6 1 2,6 6 3,6,7 6
Table 16.22.030-2 Development Standards for
and R-7
Standard
Rear
feet 22 feet
feet
Interior side 7/0 feet 5/0 feet 5/0 feet
Garage and carport entrances 22 feet 22 feet 22 feet
Street side (corner lot)
Cottage cluster units, rear
feet 15 feet 15 feet
feet 10 feet
feet
Cottage clusters, side 7 feet 7 feet 7 feet
Building height (maximum) 45 feet
Shared outdoor recreation areas 400 sq. ft./unit provided in accordance with Section 16.42.080
NOTES:
Density calculations for single-family detached shall be made pursuant to Section 16.63.020(F). Cottage clusters must meet a minimum density of four units per gross acre.
Townhomes are exempt from the lot width requirements.
Cottage clusters are exempt from lot coverage requirements.
Interior side yard setbacks for townhomes may be reduced to zero in compliance with applicable sections of the adopted Uniform Building Code.
The single-family residential building height maximum is 45 feet at the front elevation; side and rear elevations may not exceed 49 feet.
If a duplex, triplex, fourplex, or cottage cluster has been divided by a middle housing land division, per LDC 16.61, the development standards that are applicable to the lot shall apply to the middle housing parent lot, not to the middle housing child lot.
Maximum lot coverage for townhomes is the greater of the percentage identified in the table or up to 1,000 square feet of buildings, decks, stairways and entry bridges that are more than 30 inches above grade (excluding eaves). Compliance with all other standards is required.
(Ord. 389 § 1(Exh.A), 2009; Ord. 406 § 1, 2010; Ord. 427 § 1, 2012; Ord. 433 § 1, 2013; Ord. 446 § 1, 2014; Ord. 468 § 1, 2014; Ord. 561 § 1(Exh.A); 2022; Ord. 571 § 1, 2022)
§ 16.22.040. Medium density single-family residential zones.
Purpose.
Residential—Five thousand Square Feet (R-5). This development district will allow singlefamily (attached and detached) as well as duplexes, triplexes within the City. Sanitary sewer and water are the most essential of urban services, but all Level I services and facilities are necessary and required for development at full density. In this district, there is an average lot size of 5,000 square feet.
Mixed Use Residential—Single-Family (MUR-S). Mixed use residential will promote compact form, and residential and commercial or residential and office mixed vertically, in addition to across the district. Minimum densities are provided to comply with the Urban Growth Management Functional Plan, Title 1 requirements. MUR-S has a minimum density of six units per net acre and a minimum lot size of 5,000 square feet.
Permitted Uses Table 16.22.040-1 identifies the land uses that are allowed in the R-5 and MUR-S Districts.
A. 1. 2. B.
16.22.030-2 Development Standards for R-10, R-8.5 and R-7
Table
R-10 R-8.5 R-7
22
22
15
10
10
4 4 4 2 1 2 3 4 5 6 7
Public
open spaces, parks and playgrounds, tennis courts, and similar outdoor recreational activity areas and recreational buildings, facilities and grounds, which include fully or partially enclosed structures for the primary or secondary use
Table 16.22.040-1 Medium Density Single-Family Residential (R-5 and MUR-S) Permitted Uses P=Permitted; C=Conditional Use; X=Prohibited Land Use R-5 MUR-S Residential One single-family dwelling, townhome, duplex, triplex, quadplex, cottage cluster, or modular dwelling unit per lot P P
manufactured housing,
pursuant
Section 16.63.130
Density calculation as defined in Section 16.12.030 may be used where applicable. P P Accessory dwelling units, complying with Section 16.44.050 P P Residential care home P P Residential care facilities C C Manufactured home parks subject to the provisions of Section 16.44.040 C P Rooming houses X X Commercial Commercial daycare facilities C C Home occupation as defined in Section 16.12.030, per the provisions of Section 16.69.020 P P Special event centers for hosting functions such as weddings, anniversary celebrations, corporate parties and similar events C C Neighborhood Commercial Uses Coffee shops, cafés, sandwich shops and delicatessens, restaurants (no drive-through service allowed) X P Florists X P Grocery, food, specialty foods, and produce stores X P Laundromats and dry cleaners X P Personal services (e.g., barbershops, hair salons, spas) X P Yogurt and ice cream stores X P Video rental stores X P Retail and service commercial uses similar to those above but not listed elsewhere in this section upon administrative determination through the design review process X P Institutional/Utilities Church, synagogue, temple or other place of worship C C Public or private school(s) C C Utility facilities (telecommunication, pump stations, substations) C C Other
Multiple-family units or
approved as part of a PUD application
to
.
or private
P P Large scale recreational facilities such as golf courses, aquatic centers, aquariums, amusement parks and similar uses C C 1 2, 3 2, 3 2, 3 2, 3 2, 3 2, 3 2, 3 2, 3
C.
16.22.040-1 Medium Density Single-Family Residential (R-5 and MUR-S) Permitted Uses
P=Permitted; C=Conditional Use; X=Prohibited
Land Use R-5 MUR-S
Wireless communications facilities not to include antenna support structures, subject to the provisions of Section 16.44.020 of this title P/C P/C
Helipad X X
Construction of new streets and roads including the extensions of existing streets and roads, that are included with the adopted transportation system plan P P
Any accessory structure, which is, customarily incidental to any of the permitted uses, located on the same lot P P
Uses similar to those upon administrative determination by the Planning Official P/C P/C
NOTES:
Applies to a parent lot. Duplexes, triplexes, quadplexes, and cottage clusters are not permitted on a child lot (i.e., previously subdivided lot from a middle housing land division).
Neighborhood commercial uses subject to the provisions of Section 16.44.080.
Neighborhood commercial uses are permitted within the Happy ValleyTown Center PlanArea.
Development Standards. The development standards in Table 16.22.040-2 apply to all uses, structures, buildings, and development in the R-5, MUR-S Districts.
Table
Standard R-5 MUR-S Lot size (minimum): Single-family
and
5,000 sf 5,000 sf Lot size (minimum): Quadplex and cottage cluster 7,000 sf 7,000 sf Lot size (minimum)Townhome 1,500 sf 1,500 sf Townhome density (units/net acre) 25 du/net acre 25 du/net acre Residential density (minimum) None 6 du/net acre Lot width (minimum) 40 feet Variable Lot depth (minimum) 60 feet Variable Street frontage (minimum) Lots fronting on cul-de-sac 35 feet Variable All other lots 40 feet Variable Townhomes 20 feet 20 feet Lot coverage (maximum) Single-family (detached) 50% Variable Duplex, triplex, quadplex, townhome 60% Variable Building setbacks (minimum) Front (street access garage) 20 feet 20 feet Front (alley access garage) 10 feet 10 feet Rear 20 feet 20 feet 1 2 3 1,8 8 1 1 2 4 4 8 4 4 5,8,9 4,6 4,6 8 4 4
Table 16.22.040-2 Development Standards for R-5 and MUR-S
dwelling detached, duplex,
triplex
Interior side 5/0 feet
feet
Street side (corner lot) 8 feet 8 feet
Cottage cluster, front 10 feet 10 feet
Cottage cluster, rear 10 feet 10 feet
Cottage cluster, interior side 5 feet 5 feet
Cottage cluster, street side 8 feet 8 feet
Garage and carport entrances
Entrances not facing an alley 22 feet 22 feet
Entrances facing an alley
22 feet to base floor (foundation only, not including posts or other support mechanisms)
6 feet to upper floors (wall face)
22 feet to base floor (foundation only, not including posts or other support mechanisms)
6 feet to upper floors (wall face)
Building height (maximum) 45 feet 65 feet
Shared outdoor recreation areas 400 sq. ft./unit provided in accordance with Section 16.42.080
NOTES:
Density calculations for single-family detached shall be made pursuant to Section 16.63.020(F). Cottage clusters must meet a minimum density of four units per gross acre.
Townhomes are exempt from the lot width requirements. Street frontage controls lot width for townhomes.
Interior side yard setbacks for townhomes may be reduced to zero in compliance with applicable sections of the adopted Uniform Building Code.
Standards may be proposed for amendment by Master Plan, PUD or Design Review land use applications.
Cottage cluster housing is exempt from lot coverage requirements.
Pursuant to Section 16.42.030, 20% of the net developable area must be usable open space.
The single-family residential building height maximum is 45 feet at the front elevation; side and rear elevations may not exceed 49 feet.
If a duplex, triplex, fourplex, or cottage cluster has been divided by a middle housing land division, per LDC 16.61, the development standards that are applicable to the lot shall apply to the middle housing parent lot, not to the middle housing child lot.
Maximum lot coverage for townhomes is the greater of the percentage identified in the table or up to 1,000 square feet of buildings, decks, stairways and entry bridges that are more than 30 inches above grade (excluding eaves). Compliance with all other standards is required. (Ord. 389 § 1(Exh.A), 2009; Ord. 406 § 1, 2010; Ord. 422
2012;
A. 1.
Standard
MUR-S
Table
16.22.040-2
Development Standards for R-5 and MUR-S
R-5
5/0
§ 1,
Ord. 427 § 1, 2012; Ord. 433 § 1, 2013; Ord. 446 § 1, 2014; Ord. 468 § 1, 2014; Ord. 474 § 1, 2015; Ord. 501 § 1, 2016; Ord. 521 § 3, 2017; Ord. 556 § 1, 2021; Ord. 561 § 1(Exh.A), 2022; Ord. 571 § 1, 2022)
provide
3 3,4 4 4 4 6 6 1 2 3 4 5 6 7 8 9
§ 16.22.050. High density residential—Attached. Purpose. Single-Family Attached Residential (SFA). This district is intended to promote the livability, stability and improvement of Happy Valley's new neighborhoods and to
opportunities
for a variety of medium density residential housing types with a density range of 10 to 15 dwelling units per acre, as well as certain neighborhood commercial uses. The district is intended to:
Make efficient use of land and public services, and implement the Comprehensive Plan, by providing minimum and maximum density standards for housing.
Accommodate a range of housing needs, including owner-occupied and rental housing.
Provide for compatible building and site design at an appropriate neighborhood scale.
Reduce reliance on the automobile for neighborhood travel and provide options for walking and bicycling.
Provide direct and convenient access to schools, parks and neighborhood services.
Mixed Use Residential—Attached (MUR-A). Mixed use residential will promote compact form, and residential and commercial or residential and office mixed vertically, in addition to across the district. Minimum densities are provided to comply with the Urban Growth Management
Functional Plan, Title 1 requirements. MUR-A has a maximum density of 15 units per net acre and a minimum density of 10 units per net acre.
Village Townhouse District (VTH). This district is based on the Village Townhouse District in the Clackamas County Zoning and Development Ordinance. It was adopted by the City of Happy Valley to provide consistent land use regulations for areas recently annexed to the City.
A Traffic Impact Analysis (TIA) shall be submitted with each development application pursuant to the City's Traffic Impact Study Guidelines. The TIA shall address, but is not limited to, the following traffic management mechanisms: physical site controls on existing traffic, p.m. peak hour existing traffic limitations, traffic monitoring, restrictions on the number of parking spaces, transportation/transit information center; flextime, staggered working hours, car and van pool spaces, and similar ride share programs.
The procedures and application requirements under Chapter 16.63 (Land Divisions and Property Line Adjustments) and Article 16.4 (Community Design Standards) shall apply to all development in the Village Townhouse District. If language within these sections conflicts with specific requirements and standards of the village townhouse district, the standards within the village townhouse district shall prevail.
Permitted Uses. Table 16.22.050-1 identifies the land uses that are allowed in the SFA, MUR-Aand VTH Districts.
a. b. c. d. e. 2. 3. a. b. B.
Table 16.22.050-1 High DensityAttached Residential (SFA, MUR-A, VTH) Permitted Uses P=Permitted; C=Conditional Use; X=Prohibited Land Use SFA MUR-A VTH Residential Single-family detached dwellings (existing) P P P Single-family detached dwellings (new) X X X Single-family attached dwellings (townhouses, rowhouses) P P P Two-family dwelling (duplex) P P P Three-family dwelling (triplex) P P P Four-family dwelling (quadplex) P P P Cottage cluster dwellings X P X Multifamily dwellings containing five or more dwelling units or condominiums X X X Senior housing, congregate housing or nursing homes X P X 1 8
Other
Public or private open spaces, parks and playgrounds, tennis courts and similar outdoor recreational activity areas and recreational buildings, facilities and grounds, which include fully or partially enclosed structures for the primary or secondary
Table 16.22.050-1 High DensityAttached Residential (SFA, MUR-A, VTH) Permitted Uses P=Permitted; C=Conditional Use; X=Prohibited Land Use SFA MUR-A VTH Rooming houses X X X Accessory dwelling units (per Section 16.44.050) P P P Home occupation (per Section 16.69.020) P P P Bed and breakfast residencies C C C Rental information offices P P P Neighborhood Commercial Uses Coffee shops, cafés, sandwich shops and delicatessens, restaurants (no drive through service allowed) P P X Florists P P X Grocery, food, specialty foods, and produce stores P P X Laundromats and dry cleaners P P X Personal services (e.g., barbershops, hair salons, spas) P P X Yogurt and ice cream stores P P X Video rental stores P P X Retail and service commercial uses similar to those above but not listed elsewhere in this section upon administrative determination through the design review process P P X Commercial—Offices Professional and administrative offices C C X Medical and dental office, clinics and laboratories C C X Institutional/Utilities Churches, synagogues, temples or places of worship C C C Private and public schools C C C Commercial daycare facilities C C C Utility facilities (telecommunication, pump stations, substations, utility carrier cabinets) C C C
use P P P New streets and roads, including the extensions of existing streets and roads, that are included with the adopted transportation system plan P P P Wireless telecommunication facilities P/C P/C P Uses and structures customarily accessory and incidental to a primary use P P P Temporary storage of recyclables/reuseables:The temporary storage within an enclosed structure of source-separated recyclable/reusable materials generated and/or used on-site prior to on-site reuse or removal by the
or licensed or franchised collector to a user or broker P P P 2 3 3 4, 7 4, 7 4, 7 4, 7 4, 7 4, 7 4, 7 4, 7 4, 7 4, 7 4, 7 4, 7 4, 7 4, 7 4, 7 4, 7 4 4 4 4 5 6 3 3
generator
16.22.050-1
P=Permitted; C=Conditional Use; X=Prohibited
Land Use SFA MUR-A VTH
Temporary buildings for uses incidental to construction work subject to the provisions of Section 16.69.010—Such buildings shall be removed upon completion or abandonment of the construction work P P P
Bus shelters, bicycle facilities, street furniture, drinking fountains, kiosks, art works and other pedestrian and transit amenities
Helipad X X X
Uses similar to those upon administrative determination by the Planning Official P/C P/C P/C
NOTES:
Preexisting single-family dwellings and residential homes may be altered or expanded.
Permitted as an accessory use and subject to the provisions of Section 16.22.050(D)(3).
Permitted only as an accessory use.
Neighborhood commercial use subject to the provisions of Section 16.44.080
Alteration or expansion of a religious facility which was lawfully established prior to July 1, 1993. The use shall not extend beyond the property which was under the ownership of, or occupied by, the preexisting religious facility and associated facilities prior to July 1, 1993.
Public parks, playgrounds, recreational and community buildings and grounds, tennis courts, and similar recreational uses, all of a noncommercial nature, are permitted; provided that any principal building or swimming pool shall be located a minimum of 30 feet from any other lot in a residential district.
Neighborhood commercial uses are permitted within the Happy ValleyTown Center PlanArea.
Single-family detached units with a maximum floor area of 2,000 square feet are permitted in the MUR-Azone within the Happy ValleyTown Center PlanArea.
Development Standards. The development standards in Table 16.22.050-2 apply to all uses, structures, buildings, and development in the SFA, MUR-Aand VTH Districts.
C.
Table
High DensityAttached Residential (SFA, MUR-A, VTH) Permitted Uses
P P P
Standard SFA MUR-A VTH Residential density (maximum) 15 du/net acre 15 du/net acre 2,000 sf/primary unit Residential density (minimum) 10 du/net acre 10 du/net acre 3,000 sf/primary unit Lot size (minimum) 2,000 sf 3,000 sf 2,000 sf Lot width (minimum) None None None Lot depth (minimum) None None None Lot coverage (maximum) 75% 75% 65% Lot landscaping (minimum) 15% 15% 25% Setbacks (minimum): Front 10 feet 10 feet 10 feet Rear 15 feet 15 feet 15 feet Interior side 5 feet 5 feet 5 feet
1 2 3 4 5 6 7 8 1 2 2 9 1 2 9 9 12 12 7 7 3 3 10,11 3,4 3,4 10, 11 3, 4, 5 3, 4, 5 5, 10
Table 16.22.050-2 Development Standards for SFA, MUR-Aand VTH Districts
3 3
Street
Cottage cluster, rear
Garage and carport entrances
Entrances not facing an alley
Entrances facing an alley 22 feet to base floor (foundation only, not including posts or other support mechanisms)
6 feet to upper floors (wall face)
Between groupings of residential buildings on the same lot
feet
feet
22 feet to base floor (foundation only, not including posts or other support mechanisms)
6 feet to upper floors (wall face)
feet
feet
22 feet to base floor (foundation only, not including posts or other support mechanisms)
6 feet to upper floors (wall face)
feet Setback
from street right-of-way or designated
NOTES:
Density calculations shall be made pursuant to Section 16.63.020(F). Cottage clusters must meet a minimum density of four units per gross acre.
Residential care homes/facilities, duplexes, triplexes, quadplexes, cottage clusters, and accessory dwellings are exempt from the density standards. Townhouses may have a maximum density of 25 units/acre.
The minimum front, rear, side and street side building setbacks for public and institutional uses in the SFAdistrict is 20 feet. Cottage clusters shall have a perimeter setback of 10 feet in the MUR-A zone.
Where the SFA district abuts lower density residential districts, the abutting yards shall have a 10-foot landscaped buffer area.
Side yard building setbacks for attached single-family (townhouse) may be reduced to zero in compliance with applicable sections of the adopted Uniform Building Code.
Pursuant to Section 16.42.030, 20% of the gross developable area of the greater development project must be usable open space—the 15% landscaping standard is applicable to individual lots.
Maximum building height for single-family detached/attached is 45 feet at the front elevation; side and rear elevations may not exceed 49 feet in height.
Each lot for an attached single-family (townhouse) dwelling in the SFA and VTH zones shall have a minimum size of 2,000 square feet and a maximum size of 3,000 square feet, or each lot shall have a minimum size of 2,000 square feet and the average size of all lots shall not exceed 2,500 square feet. Each lot for a townhouse in the MUR-A zone shall have a minimum size of 1,500 square feet and no maximum lot size. Lots created for congregate care facilities, two- and three-family dwellings, or multifamily dwellings are not subject to minimum, maximum, or average lot size standards. However, the density provisions of Section 1012 are applicable. A new lot created for a preexisting single-family dwelling shall have a minimum lot size of 3,000 square feet,
Table 16.22.050-2 Development Standards
Standard SFA MUR-A VTH
for SFA, MUR-Aand VTH Districts
8 feet 8 feet 5
side
feet
10
feet
22
22
22
feet
10
10
10
None None 18
Building height (maximum) 45 feet 65 feet 35 feet Shared outdoor recreation areas 400 sq. ft./unit provided in accordance with Section 16.42.080
(maximum
accessway)
feet
3 3 10, 11 10 10 8 8 1 2 3 4 5 7 8 9
NOTES:
and a maximum lot size of 5,000 square feet. A lot created for a preexisting dwelling shall not be included in the gross site area used to determine the maximum density for the remaining lot.
Preexisting dwellings and their accessory structures shall comply with the Clackamas County VR-4/5 setback standards.
On a corner lot, one of the required front yard building setbacks may be reduced to eight feet when abutting a local or connector street.Awnings, porches, bays, and overhangs may extend up to four feet into this setback.
Lot coverage maximum for existing, or where allowed, proposed single-family detached units is 50%. Maximum lot coverage does not apply to cottage clusters.
Special Standards for Certain Uses.
Special Standards for Public and Institutional Uses.
Minimum Setbacks.
Front.Twenty feet.
Rear.Twenty feet.
Side.Twenty feet.
Street Side.Twenty feet.
Attached Single-Family Dwellings in the VTH District.
Configuration and Façades.
Attached single-family dwellings shall orient to and line streets with a series of attached "rowhouse" units.
Front façades shall be designed with balconies and/or bays. Façades facing a street right-of-way or designated accessway shall not consist of a blank wall.
Window trim shall not be flush with exterior wall treatment. Windows shall be provided with an architectural surround at the jamb, head, and sill.
Entries and Porches.
Primary entries shall be accessed directly from a street right-of-way and must be visible from the street.
Porches are required for each unit and must be located immediately adjacent to the primary entry. Porches must cover a minimum of 50% of the primary façade (not including the garage) with a minimum net depth of six feet.
Roofs. Hipped, gambrel, or gabled roofs are required. Flat roofs are prohibited.
Accessory Structures in the VTH District. The following standards apply to accessory structures:
A maximum of two accessory structures, including one accessory dwelling unit, may be permitted on a lot.
An accessory structure and its projections shall be detached and separated from other structures by a minimum of three feet.
Only one accessory structure per lot may exceed 100 square feet in area.
Accessory structures greater than 100 square feet in area shall comply with the following requirements:
D. 1. a. i. ii. iii. iv. 2. a. i. ii. iii. b. i. ii.
3. a. b. c. d.
c.
10 11 12
The accessory structure shall be constructed with similar exterior building materials as that of the primary dwelling.
The square footage of the ground floor of the accessory structure shall not exceed either 500 square feet or the square footage of the ground floor of the primary dwelling, whichever is less. An accessory dwelling unit shall not exceed 500 square feet in size.
The detached accessory structure shall have a maximum building height of 25 feet or the building height of the primary dwelling, whichever is less.
The front yard setback shall be no less than the front façade of the primary dwelling unit (not including porches, bays, garages, and architectural features). Garages shall comply with the front yard setback standards of Clackamas County ZDO Subsection 1604.06(F).
No side or rear yard setback shall be required for any detached accessory structure that is 100 square feet or less in area and does not exceed a height of feet.
For structures that exceed 100 square feet in area or eight feet in height, rear and side yard setbacks shall be as follows, except where a rear or side lot line is adjacent to a street, pedestrian path, sidewalk, or accessway, in which case a minimum setback of five feet is required:
For structures greater than eight feet and up to 20 feet in height, the minimum side yard setbacks shall be zero on one side and three feet on the other side. The minimum rear yard setback where the rear property line abuts an alley shall be six feet. The minimum rear yard setback where the rear property line does not abut an alley shall be three feet.
For structures greater than 20 feet in height, the minimum side yard setbacks shall be zero on one side and five feet on the other side. The minimum rear yard setback where the rear property line abuts an alley shall be six feet, except that a second-level accessory dwelling unit may cantilever up to four feet.The minimum rear yard setback where the rear property line does not abut an alley shall be five feet.
Garages in the VTH District.
A minimum of one off-street parking space shall be located in a garage and no required parking or loading space shall be used for storing a recreational vehicle, camper, or boat.
Adetached garage may be placed at the rear of a lot.
A front-access garage attached to the dwelling structure shall be recessed a minimum of two feet behind the front façade (not including porches, bays, and architectural features) and a minimum of 20 feet from the street right-of-way.
Aminimum two-foot deep trellis or bay window shall be placed above the garage opening. The trellis shall extend the full width of the garage, and the bay window shall be a minimum of eight feet in width.
If located in the front, the garage opening and the driveway shall not exceed a width of 10 feet.
If an alley adjoins a lot, then garage access from the street is prohibited.
Fences and Sight-Obscuring Plantings in the VTH District.
Fences and sight-obscuring plantings shall comply with intersection sight distance requirements.
The maximum height of a fence or sight-obscuring planting shall be six feet along the side and rear yards behind the front building line, and four feet forward of the front building line.
i. ii. iii. e. f. g. i. ii. 4. a. b. c. d. e. f. 5. a. b.
Manufactured Dwelling Parks in the VTH District.
Existing manufactured dwelling parks shall not be redeveloped with a different use until a plan for relocation of the existing tenants is submitted and approved by the Planning Official or designee.
Variances.The requirements of this section may be modified pursuant to Chapter 16.71 (Ord. 389 § 1(Exh.A), 2009; Ord. 406 § 1, 2010; Ord. 422 § 1, 2012; Ord. 427 § 1, 2012; Ord. 433 § 1, 2013; Ord. 446 § 1, 2014; Ord. 501 § 1, 2016; Ord. 521 § 3, 2017; Ord. 545 § 1, 2019; Ord. 561 § 1(Exh.A), 2022; Ord. 571 § 1, 2022)
§ 16.22.060. Mixed use residential—Multifamily (MUR-M and MUR-X).
Purpose.
Mixed use residential will promote compact form, and residential and commercial or residential and office mixed vertically, in addition to across the district. The multifamily sub-area provides for a range of densities, each of which should be shown on the master plan map. The multifamily subareas allow for retail uses that are meant to provide services to local residents, not attract outside traffic.The density requirements and minimum/maximum lot sizes are meant as a guide, and will vary based on the amount of unbuildable lands removed from gross acres. The density is calculated by averaging density for the residential district area identified in the master plan. Therefore, some lots may be smaller than the lot sizes given below. Minimum densities are provided to comply with the Urban Growth Management Functional Plan, Title 1 requirements.
MUR-X Mixed Use Buildings with Residential Emphasis. Residential and retail combinations with the primary use of the building being residential. Permitted commercial uses shown on Table 16.22.060-1.
Permitted Uses. Table 16.22.060-1 identifies the land uses that are allowed in the MUR-M and MUR-X Districts.
Table 16.22.060-1 Mixed Use Residential—Multifamily (MUR-M and MUR-X) Permitted Uses
P=Permitted; C=Conditional Use; X=Prohibited
6. a. 7. A.
1. 2. B.
Land Use MUR-M Multifamily MUR-X Mixed Buildings Residential Single-family detached dwellings X X Attached dwellings, (townhouses, attached duplex, rowhouses) P P Multifamily dwellings Low P P Medium P P High P P Senior housing P P Skilled nursing facility C C Congregate housing C C Rooming houses X X Accessory dwelling units (per Section 16.44.050) X X
Table 16.22.060-1 Mixed Use Residential—Multifamily (MUR-M and MUR-X) Permitted Uses P=Permitted; C=Conditional Use; X=Prohibited Land Use MUR-M Multifamily MUR-X Mixed Buildings Home occupation (per Section 16.69.020) P P Neighborhood Commercial Uses Coffee shops, cafés, sandwich shops and delicatessens, restaurants (no drive-through service allowed) P Florists P Grocery, food, specialty foods, and produce stores P Laundromats and dry cleaners P Personal services (e.g., barbershops, hair salons, spas) P Yogurt and ice cream stores P Video rental stores P Retail and service commercial uses similar to those above but not listed elsewhere in this section upon administrative determination through the design review process P Commercial—Retail Uses Art and craft supply stores, studios P Bakeries P Banks, savings and loan associations, loan companies, ATM (not drive-in or drive-through) P Bicycle sales, supplies, repair service P Book stores C Coffee shops, cafés, sandwich shops and delicatessens (no drive-through service allowed) P Drug stores P Dry cleaners and tailors P Florists P Gift stores P Grocery, food, specialty foods, and produce stores P Hotels P Indoor health and recreation facilities, such as racquetball court, gymnasiums, health and exercise spas, swimming pools, and similar uses and associated facilities C Interior decorating shops, sales and service P Laundromats P Marijuana retailing X X Music shops, sales and service P Optometry and optical goods, sales and service P Personal services (e.g., barbershops, hair salons, spas) P Photo finishing, photography studiosPPost offices P Psilocybin service center X X 1 1 1 1 1 1 1 1
NOTES:
Neighborhood commercial use subject to the provisions of Section 16.44.080
scale and trip generation are compatible with residential development.
Development Standards. The development standards in Table 16.22.060-2 apply to all uses, structures, buildings, and development in the MUR-M and MUR-X Districts.
C. Table 16.22.060-1 Mixed Use Residential—Multifamily (MUR-M and MUR-X) Permitted Uses P=Permitted; C=Conditional Use; X=Prohibited Land Use MUR-M Multifamily MUR-X Mixed Buildings Rental stores, without outdoor storage P Restaurants, full service C Shoe sales and repair stores P Sporting goods, sales and service P Stationery stores P Taverns, bars and cocktail lounges (1,500 feet from school uses, public parks and churches) C Yogurt and ice cream stores P Video rental stores C Retail and service commercial uses similar to those above but not listed elsewhere in this section upon administrative determination through the design review process P Commercial—Offices Professional and administrative offices C P Medical office buildings C P Institutional Churches, synagogues, temples or places of worship C C Public park, usable open space C C Private and public schools (includes day care) C C Other Utility facilities (telecommunication, pump stations, substations) C C Helipad X X Marijuana processing, production and wholesaling X X New streets and roads, including the extensions of existing streets and roads, that are included with the adopted transportation system plan P P Psilocybin processing, production and wholesaling X X
Where
Table 16.22.060-2
Standards
MUR-M1, MUR-M2 and MUR-M3 Districts Standard MUR-M1 MUR-M2 MUR-M3 Residential density (maximum) 24 du/net acre 34 du/net acre 50 du/net acre Residential density (minimum) 15 du/net acre 25 du/net acre 35 du/net acre Lot size (minimum) Variable Variable Variable 2 1 1 1 2 1 1 2 2 2
Development
for
NOTES:
Density calculations shall be made pursuant to Section 16.63.020.F
Standards are flexible and shall be determined through the master plan process or design review application.
Pursuant to Section 16.42.030, 20% of the net developable area must be usable open space.
Building height is measured pursuant to Chapter 16.12 Definitions. Maximum building height for single-family (attached) is 45 feet at the front elevation; the building height may not exceed 49 feet at the side and rear elevations.
(Ord. 389 § 1(Exh.A), 2009; Ord. 398 § 1, 2010; Ord. 406 § 1, 2010; Ord. 427 § 1, 2012; Ord. 433 § 1, 2013; Ord. 446 § 1, 2014; Ord. 503 § 1, 2016; Ord. 572 § 1, 2023)
Table 16.22.060-2 Development Standards for MUR-M1, MUR-M2 and MUR-M3 Districts Standard MUR-M1 MUR-M2 MUR-M3 Lot width (minimum) Variable Variable Variable Lot depth (minimum) Variable Variable Variable Lot coverage (maximum) Variable Variable Variable Landscaping (minimum) Variable Variable Variable Building setbacks (minimum) Variable Variable Variable Building height (maximum) 65 feet 65 feet 65 feet
2 2 2 2 2 2 2, 3 2, 3 2, 3 3 3 3 2 2 2 4 4 4 1 2 3 4

OSM OSM OSM R10 R15 R15 R20 IPU R10 R20 R20 R20 R40 R40 R7 SEIDLEMAN RD SEKING WAY SE 99T H D R CTGIASE SE WALNUT DR SE PHEASANT RIDGE DR SE W E S T V I E W C T SE NICO L E L O O P SE CITY VIEW DR SE STEVEN CT SEDEREK CT SE WESTVIEW CT SE MIRANDOL ST S E 1 0 2 N D AV E SEKELACT SE KELAPL S E CLEONE CT SE DE RE K LOOP SE TYLER RD SENANCY CT SE CELANOCT S E P A R TRIDGE P L SE CHULA VISTA ST SEOVERLOOK LN SE HILLCREST DR SE98THCT SEHILLCREST DR VSESUNSET IEWCT S E P A L A T I A L TC SE 100TH DR SEDUNDEEDR SE TURNBERR Y L O O P S E WESSEXWAY SE 99TH CT SE CARNA BY WAY SE CHAMPAGNE LN This map is a copy of public record and is provided solely for information purposes. WFG National Title assumes no liability for variations, if any, in dimensions, area or location of the premises or the location of improvements. Customer Service Department 12909 SW 68th Parkway, Suite 350 Portland, OR 97223 (503) 603-1700 cs@wfgnationaltitle.com 0 190 380 95 Feet Zoning Subject Property Tax Lots Industrial Parks & Open Spaces Single Family ²
12E27CC01400
Clackamas
T1S R2E S27
Latitude: 45.449024
TAXLOT INFORMATION
Tax Lot ID:

R Number:
Tax Lot Size:
Building Area
Market Total Value
Land Use
Year

Market
State General Property


Market Land Value 233166.00000000
Built Sale Date Sale Price
Building Value
Class County Tax Code Site Address POLITICAL BOUNDARIES Jurisdiction Neighborhood Voting Precinct 103.00000000 Metro Council District 2 Metro Councilor Christine Lewis Metro Councilor Email christine.lewis@oregonmetro.gov US Congressional District 5 Oregon House District 39 Oregon Senate District 20 LAND USE AND PLANNING +30 m 100 ft Lea�et (http://lea�etjs.com) | Tiles: © Metro RLIS
Local Zoning R20
Generalized Zoning SFR
Classi�ed Zoning SFR1
Watershed Johnson Creek
Sub-Watershed Kellogg Creek
Basin Willamette
Sub-Basin Lower Willamette
Flood Plain Outside
Wetland Not in a wetland
Urban Growth Boundary Inside
Urban/Rural Reserve
Reserve Name
USGS Quad Name Gladstone
SERVICE DISTRICTS
Garbage Hauler Recology Clackamas
Commercial Hauler Recology Clackamas
Dropbox
School District NORTH CLACKAMAS School District Number 12 Oregon Dept. of Ed. Dist. ID 1924 Natl. Center for Ed. Statistics Dist. ID 4108830 Water District Sunrise Water Authority Park District Sewer District Clackamas County Service District #1 Fire District Clackamas Fire District #1 Fire Management Zone 5800 CENSUS INFORMATION Census Tract 22206.00000000 Census Block Group 3 Census Block Population (2010) 2703
Provider Recology Clackamas

Data Resource Center
600 Northeast Grand Avenue, Portland, OR 97232
503-797-1742
drc@oregonmetro.gov
© Oregon Metro www.oregonmetro.gov/rlis
This Web site is offered as a public service, integrating various government records into a region-wide mapping system. The property assessment records are a multi-county integration of Clackamas, Multnomah and Washington County records. MetroMap blends each county's records into a common database on a quarterly basis. Therefore, to view each county's of�cial records, go to their respective web sites or of�ces. The other MetroMap data are derived from city, county, state, federal and Metro sources. The metadata (data about the data) are included on this site, including the sources to be consulted for veri�cation of the information contained herein. It describes some cases where Metro blends city and county records by generalizing the disparities. Metro assumes no legal responsibility for the compilation of multi-source government information displayed by Metro Map. Users of this information are cautioned to verify all information.
CUSTOM Topography Water Features Aerial Aerial Environmental Community Transit Vacant Land MAPS The information contained is provided by WFG’s Customer Service Department to our customers, and while deemed reliable, is not guaranteed.
SEIDLEMANRD S E N I C O L E L O PO SE N I COLE LOOP SE DE RE K LOOP SE PALATIAL CT SE CHAMPAGNE LN 920 675 825 870 770 680 760 615 695 820 715 690 755 915 830 640 700 910 750 800 795 905 685 900 665 815 660 705 765 745 840 670 895 855 620 735 710 795 740 655 810 890 850 720 845 885 805 725 880 800 625 730 875 865 775 780 785 860 790 630 835 635 645 650 610 910 900 890 620 880 630 870 640 860 650 850 840 660 830 820 810 670 720 730 710 690 700 750 680 740 800 770 760 780 790 This map is a copy of public record and is provided solely for information purposes. WFG National Title assumes no liability for variations, if any, in dimensions, area or location of the premises or the location of improvements. Customer Service Department 12909 SW 68th Parkway, Suite 350 Portland, OR 97223 (503) 603-1700 cs@wfgnationaltitle.com 0 60 120 30 Feet Contours Tax Lots Subject Property 5' Contours ²
Flood Plain
Tax
Subject
Streams
Flood Plain
Wetlands
Rivers
SEIDLEMAN RD SEKING WAY SE 99T H D R CTGIASE SE WALNUT DR SE PHEASANT RIDGE DR SE W E S T V I E W C T SE NICO L E L O O P SE CITY VIEW DR SE STEVEN CT SEDEREK CT SE WESTVIEW CT SE MIRANDOL ST S E 1 0 2 N D AV E SEKELACT SE KELAPL S E CLEONE CT SE DE RE K LOOP SE TYLER RD SENANCY CT SE CELANOCT S E P A R TRIDGE P L SE CHULA VISTA ST SEOVERLOOK LN SE HILLCREST DR SE98THCT SEHILLCREST DR VSESUNSET IEWCT S E P A L A T I A L TC SE 100TH DR SEDUNDEEDR SE TURNBERR Y L O O P S E WESSEXWAY SE 99TH CT SE CARNA BY WAY SE CHAMPAGNE LN This map is a copy of public record and is provided solely for information purposes. WFG National Title assumes no liability for variations, if any, in dimensions, area or location of the premises or the location of improvements. Customer Service Department 12909 SW 68th Parkway, Suite 350 Portland, OR 97223 (503) 603-1700 cs@wfgnationaltitle.com 0 190 380 95 Feet
Lots
Property
²
SEIDLEMANRD S E N I C O L E L O PO SE DEREK LOOP SE PALATIAL CT SE CHAMPAGNE LN This map is a copy of public record and is provided solely for information purposes. WFG National Title assumes no liability for variations, if any, in dimensions, area or location of the premises or the location of improvements. Customer Service Department 12909 SW 68th Parkway, Suite 350 Portland, OR 97223 (503) 603-1700 cs@wfgnationaltitle.com 0 60 120 30 Feet Aerial Subject Property Tax Lots ²
SEIDLEMANRD S E N I C O L E L O PO SE N I COLE LOOP SE DEREK LOOP SE PALATIAL CT SE CHAMPAGNE LN 920 675 825 870 770 680 760 615 695 820 715 690 755 915 830 640 700 910 750 800 795 905 685 900 665 815 660 705 765 745 840 670 895 855 620 735 710 795 740 655 810 890 850 720 845 885 805 725 880 800 625 730 875 865 775 780 785 860 790 630 835 635 645 650 This map is a copy of public record and is provided solely for information purposes. WFG National Title assumes no liability for variations, if any, in dimensions, area or location of the premises or the location of improvements. Customer Service Department 12909 SW 68th Parkway, Suite 350 Portland, OR 97223 (503) 603-1700 cs@wfgnationaltitle.com 0 60 120 30 Feet Aerial Topo Tax Lots Subject Property 5' Contours ²
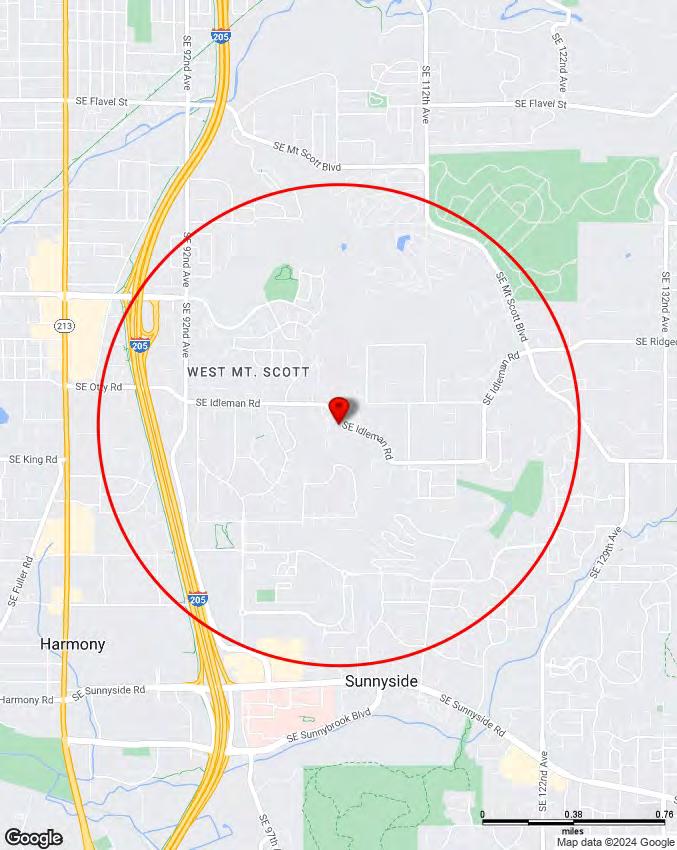
SUNNYSIDE
Mount
Scott Elementary
Savior Preschool & Kindergarten
Beautiful
- WEST MT. SCOTT SOUTHGATE
SUNNYSIDEWEST MT SCOTT
SUNNYSIDEWEST MT SCOTT
This map is a copy of public record and is provided solely for information purposes. WFG National Title assumes no liability for variations, if any, in dimensions, area or location of the premises or the location of improvements. Customer Service Department 12909 SW 68th Parkway, Suite 350 Portland, OR 97223 (503) 603-1700 cs@wfgnationaltitle.com 0 420 840 210 Feet Community Tax Lots Subject Property 8 9 : s Fire Stations n o Hospitals n Schools n Libraries Neighborhoods Rivers Park ²
HAPPY VALLEY
SE PHILIPS PL
S
SE 93RD CT
SE 92ND PL
SE OTTY PL
SE 96TH AVE
SEWHITEH A L L CT
SE WYNDHAM WAY
SE HUNTERS BLUFF
S E C H A TFIELD CT
SE HIGHGATE DR
SE DUNDEE CT SE DEXTER CT
S E 9 7TH A V E
SE BROOKMORE CT
SE QUAILRIDGE DR
SE QUA I LR I D G E C T
SE DUNDEE DR SE
S E W ESTV I E W CT
S E C H U L A V I S T A C T
SE CHULA
SE94THPL
S E 9 5 TH CT
SESTEVENSWAY
SE 96T HCT
SE 97TH AVE
SE WESTVI E W C T
SE CLEONECT
SE EASTVIEW DR
SE FRENCH ACRES DR
S E TORRA V ISTA CT
SEKINGWAY
SEGIA CT SEDEREKCT
S E S T A CY CT
SE 99THDR
SE STEV EN CT
SEKELA CT SE KELAPL
SE HILLCREST RD
SE LINCOLN HEIGHTS ST
SEIDLEMANRD
SE TYLER RD
SE NICOL
SE DEREKLOOP
SE WALNUT DR
S E P ARTRIDGE PL
SE PHEASA NT RIDGE DR
SENANCY CT SECELANO CT
SE MIRANDOL ST
SE REMSON DR S E O N E O N T A D R
SE 100TH AVE
S
SE 105TH AVE
SE CHARLOTTE DR
SELENOREST
SE HILLTOP CT
CT S
SE HILLSIDE DR
SEVALLEY
S E 1 0 2 N D A V E
VIEW TER
AVE
S E 9 6 T H A V E
E S T E V ENS R D
CARTER LN
S E 1 0 3 RD A V E
E C A R T ER C T SE QUAILRIDGEDR S E 1 0 4 T H A VE
E L O O P
SE WAHKEENA
C O T T P A R K L N
E S
VISTA ST SE LEVERN LN SESCOTTSRIDGECT SE CAMBRAY W A Y SEOVERLOOK LN SE HILLCREST DR SE98TH CT VSESUNSET IEWCT S E PALA T I A L C T SE TYLER CT SE FORTON PL SE JOHNS C T SE 9 7 T H C T SE CLOVER LN S E 9 4 T H A V E SE CITY VIEW DR S E H I L L S I D E TC S E T E R R A L I N D A C T SE 100TH DR S ETURNBERRYLOOP S E9 7 T H A V E SE QUAIL RUN DR S E 9 9 T H CT SE FAIRW AY DR SE CHAMPAGNE LN SEJOHNSON CREE K B L V D S E W E S S E X W A Y SEHILLCRESTDR SEJOHNSON CREEKBLVD SE CARNABY W AY SE SCOTTS SUMMIT CT SE RIDGEWAY DR SE N I CO L E LOOP Ella V. Osterman Park This map is a copy of public record and is provided solely for information purposes. WFG National Title assumes no liability for variations, if any, in dimensions, area or location of the premises or the location of improvements. Customer Service Department 12909 SW 68th Parkway, Suite 350 Portland, OR 97223 (503) 603-1700 cs@wfgnationaltitle.com 0 320 640 160 Feet Transit Tax Lots Subject Property X Bus Stops X Light Rail Stops Æ Park & Ride n Transit Centers Bike Routes Bus Lines Light Rail OHSU Tram Park ²
SEIDLEMAN RD SEKING WAY SE 99T H D R CTGIASE SE WALNUT DR SE PHEASANT RIDGE DR SE W E S T V I E W C T SE NICO L E L O O P SE CITY VIEW DR SE STEVEN CT SEDEREK CT SE WESTVIEW CT SE MIRANDOL ST S E 1 0 2 N D AV E SEKELACT SE KELAPL S E CLEONE CT SE DE RE K LOOP SE TYLER RD SENANCY CT SE CELANOCT S E P A R TRIDGE P L SE CHULA VISTA ST SEOVERLOOK LN SE HILLCREST DR SE98THCT SEHILLCREST DR VSESUNSET IEWCT S E P A L A T I A L TC SE 100TH DR SEDUNDEEDR SE TURNBERR Y L O O P S E WESSEXWAY SE 99TH CT SE CARNA BY WAY SE CHAMPAGNE LN This map is a copy of public record and is provided solely for information purposes. WFG National Title assumes no liability for variations, if any, in dimensions, area or location of the premises or the location of improvements. Customer Service Department 12909 SW 68th Parkway, Suite 350 Portland, OR 97223 (503) 603-1700 cs@wfgnationaltitle.com 0 190 380 95 Feet Vacant Tax Lots Subject Property Vacant Lots Park ²
COMMUNITY
Demographics
Traffic Counts INFORMATION
information contained is provided by WFG’s Customer Service Department to our customers, and while deemed reliable, is not guaranteed.
The

12E27CC01400
Sitewise Online
Quick Facts Pop-Facts: Demographic Quick Facts 12E27CC01400 0 - 1 mi Population 2028 Projection 12,477 2023 Estimate 11,713 2020 Census 11,515 2010 Census 9,787 Growth 2023-2028 6.53% Growth 2020-2023 1.72% Growth 2010-2020 17.66% Households 2028 Projection 4,975 2023 Estimate 4,640 2020 Census 4,517 2010 Census 3,902 Growth 2023-2028 7.22% Growth 2020-2023 2.73% Growth 2010-2020 13.62% 2023 Estimated Population by Single-Classification Race 11,713 White Alone 7,366 62.89% Black or African American Alone 426 3.63% American Indian and Alaska Native Alone 109 0.93% Asian Alone 2,131 18.19% Native Hawaiian and Other Pacific Islander Alone 118 1.01% Some Other Race Alone 562 4.80% Two or More Races 1,002 8.55% 2023 Estimated Population by Ethnicity (Hispanic or Latino) 11,713 Hispanic or Latino 1,232 10.52% Not Hispanic or Latino 10,481 89.48% 2023 Occupied Housing Units by Tenure 4,640 Owner-Occupied 2,619 56.45% Renter-Occupied 2,021 43.55% 2023 Average Household Size 2.50
12E27CC01400
Pop-Facts: Demographic
2023 Est. Households by Household Income 4,640 Income Less than $15,000 374 8.07% Income $15,000 to $24,999 173 3.74% Income $25,000 to $34,999 425 9.15% Income $35,000 to $49,999 454 9.78% Income $50,000 to $74,999 538 11.59% Income $75,000 to $99,999 626 13.50% Income $100,000 to $124,999 437 9.41% Income $125,000 to $149,999 374 8.06% Income $150,000 to $199,999 530 11.42% Income $200,000 to $249,999 255 5.49% Income $250,000 to $499,999 308 6.63% Income $500,000 or more 147 3.16% 2023 Est. Average Household Income $121,924 2023 Est. Median Household Income $89,222 2023 Median HH Inc. by Single-Classification Race White Alone $91,720 Black or African American Alone $41,266 American Indian and Alaska Native Alone $72,256 Asian Alone $107,012 Native Hawaiian and Other Pacific Islander Alone $126,356 Some Other Race Alone $67,277 Two or More Races $85,035 Hispanic or Latino $77,604 Not Hispanic or Latino $90,992 Copyright ©
2023.
reserved. 12E27CC01400 Sitewise Online Pop-Facts: Demographic Quick Facts Pop-Facts: Demographic Quick Facts 12E27CC01400 0 - 1 mi
Claritas, LLC
All rights
12E27CC01400 Sitewise Online Pop-Facts: Population Quick Facts Pop-Facts: Population Quick Facts 12E27CC01400 0 - 1 mi Population 2028 Projection 12,477 2023 Estimate 11,713 2020 Census 11,515 2010 Census 9,787 Growth 2023-2028 6.53% Growth 2020-2023 1.72% Growth 2010-2020 17.66% 2023 Est. Population by Age 11,713 Age 0 to 4 604 5.16% Age 5 to 9 658 5.61% Age 10 to 14 727 6.20% Age 15 to 17 460 3.93% Age 18 to 20 413 3.53% Age 21 to 24 520 4.44% Age 25 to 34 1,355 11.57% Age 35 to 44 1,880 16.05% Age 45 to 54 1,487 12.70% Age 55 to 64 1,327 11.33% Age 65 to 74 1,321 11.28% Age 75 to 84 626 5.35% Age 85 and over 335 2.86% Age 16 and over 9,573 81.73% Age 18 and over 9,265 79.10% Age 21 and over 8,852 75.57% Age 65 and over 2,282 19.48% 2023 Est. Median Age 40.96 2023 Est. Average Age 41.40
2023 Est. Population by Single-Classification Race 11,713 White Alone 7,366 62.89% Black or African American Alone 426 3.63% American Indian and Alaska Native Alone 109 0.93% Asian Alone 2,131 18.19% Native Hawaiian and Other Pacific Islander Alone 118 1.01% Some Other Race Alone 562 4.80% Two or More Races 1,002 8.55% 2023 Est. Population by Ethnicity (Hispanic or Latino) 11,713 Hispanic or Latino 1,232 10.52% Not Hispanic or Latino 10,481 89.48% 2023 Est. Population by Sex 11,713 Male 5,738 48.99% Female 5,975 51.01%
Claritas,
2023.
rights reserved. 12E27CC01400 Sitewise Online Pop-Facts: Population Quick Facts Pop-Facts: Population Quick Facts 12E27CC01400 0 - 1 mi
Copyright ©
LLC
All
12E27CC01400 Sitewise Online Pop-Facts: Household Quick Facts Pop-Facts: Household Quick Facts 12E27CC01400 0 - 1 mi Households 2028 Projection 4,975 2023 Estimate 4,640 2020 Census 4,517 2010 Census 3,902 Growth 2023-2028 7.22% Growth 2020-2023 2.73% Growth 2010-2020 15.76% 2023 Est. Households by Household Income 4,640 Income Less than $15,000 374 8.07% Income $15,000 to $24,999 173 3.74% Income $25,000 to $34,999 425 9.15% Income $35,000 to $49,999 454 9.78% Income $50,000 to $74,999 538 11.59% Income $75,000 to $99,999 626 13.50% Income $100,000 to $124,999 437 9.41% Income $125,000 to $149,999 374 8.06% Income $150,000 to $199,999 530 11.42% Income $200,000 to $249,999 255 5.49% Income $250,000 to $499,999 308 6.63% Income $500,000 or more 147 3.16% 2023 Est. Average Household Income $121,924 2023 Est. Median Household Income $89,222 2023 Median HH Inc. by Single-Classification Race White Alone $91,720 Black or African American Alone $41,266 American Indian and Alaska Native Alone $72,256 Asian Alone $107,012 Native Hawaiian and Other Pacific Islander Alone $126,356 Some Other Race Alone $67,277 Two or More Races $85,035 Hispanic or Latino $77,604 Not Hispanic or Latino $90,992 2023 Est. Households by Household Type 4,640 Family Households 2,951 63.61% Nonfamily Households 1,689 36.39% 2023 Est. Group Quarters Population 92
2023 Est. Households by Household Size 4,640 1-person 1,339 28.85% 2-person 1,743 37.57% 3-person 575 12.40% 4-person 562 12.12% 5-person 304 6.55% 6-person 101 2.19% 7-or-more-person 15 0.33% 2023 Est. Average Household Size 2.50 12E27CC01400 Sitewise Online Pop-Facts: Household Quick Facts Pop-Facts: Household Quick Facts 12E27CC01400 0 - 1 mi
2023 Est. HHs by Type by Presence of Own Children 2,951 Married-Couple Family, own children 944 31.97% Married-Couple Family, no own children 1,358 46.02% Male Householder, own children 100 3.38% Male Householder, no own children 100 3.39% Female Householder, own children 251 8.51% Female Householder, no own children 199 6.73% Copyright © Claritas, LLC 2023. All rights reserved. 12E27CC01400 Sitewise Online Pop-Facts: Household Quick Facts Pop-Facts: Household Quick Facts 12E27CC01400 0 - 1 mi
12E27CC01400 Sitewise Online Pop-Facts: Demographic Snapshot (Part 1) Pop-Facts: Demographic Snapshot (Part 1) 12E27CC01400 0 - 1 mi Population 2028 Projection 12,477 2023 Estimate 11,713 2020 Census 11,515 2010 Census 9,787 Growth 2023-2028 6.53% Growth 2020-2023 1.72% Growth 2010-2020 17.66% 2023 Est. Population by Single-Classification Race 11,713 White Alone 7,366 62.89% Black or African American Alone 426 3.63% American Indian and Alaska Native Alone 109 0.93% Asian Alone 2,131 18.19% Native Hawaiian and Other Pacific Islander Alone 118 1.01% Some Other Race Alone 562 4.80% Two or More Races 1,002 8.55% 2023 Est. Population Hispanic or Latino by Origin 11,713 Not Hispanic or Latino 10,481 89.48% Hispanic or Latino 1,232 10.52% Hispanic or Latino by Origin 1,232 Mexican 753 61.15% Puerto Rican 0 0.00% Cuban 23 1.85% All Other Hispanic or Latino 456 37.00% 2023 Est. Hisp. or Latino Pop by Single-Classification Race 1,232 White Alone 262 21.27% Black or African American Alone 18 1.48% American Indian and Alaska Native Alone 33 2.68% Asian Alone 15 1.22% Native Hawaiian and Other Pacific Islander Alone 1 0.07% Some Other Race Alone 466 37.79% Two or More Races 437 35.49%
2023
2023
12E27CC01400
Sitewise Online
Pop-Facts: Demographic Snapshot (Part 1)
Pop-Facts: Demographic Snapshot (Part 1)
12E27CC01400 0 - 1 mi
Est. Pop by Race, Asian Alone, by Category 2,131 Chinese, except Taiwanese 761 35.70% Filipino 213 10.00% Japanese 81 3.80% Asian Indian 143 6.71% Korean 198 9.31% Vietnamese 481 22.58% Cambodian 0 0.00% Hmong 48 2.24% Laotian 10 0.48% Thai 32 1.50% All other Asian Races, including 2 or more 164 7.68%
Est. Pop Age 5+ by Language Spoken At Home 11,109 Speak only English 8,688 78.21% Speak Asian or Pacific Island Language 733 6.60% Speak IndoEuropean Language 1,004 9.03% Speak Spanish 536 4.82% Speak Other Language 148 1.33%
12E27CC01400
Sitewise Online
Pop-Facts: Demographic Snapshot (Part 1)
Pop-Facts: Demographic Snapshot (Part 1)
12E27CC01400 0 - 1 mi
2023 Est. Population by Sex 11,713 Male 5,738 48.99% Female 5,975 51.01% 2023 Est. Population by Age 11,713 Age 0 to 4 604 5.16% Age 5 to 9 658 5.61% Age 10 to 14 727 6.20% Age 15 to 17 460 3.93% Age 18 to 20 413 3.53% Age 21 to 24 520 4.44% Age 25 to 34 1,355 11.57% Age 35 to 44 1,880 16.05% Age 45 to 54 1,487 12.70% Age 55 to 64 1,327 11.33% Age 65 to 74 1,321 11.28% Age 75 to 84 626 5.35% Age 85 and over 335 2.86% Age 16 and over 9,573 81.73% Age 18 and over 9,265 79.10% Age 21 and over 8,852 75.57% Age 65 and over 2,282 19.48% 2023 Est. Median Age 40.96 2023 Est. Average Age 41.40
12E27CC01400
Sitewise Online
Pop-Facts: Demographic Snapshot (Part 1)
Pop-Facts:
12E27CC01400
2023 Est. Male Population by Age 5,738 Age 0 to 4 307 5.35% Age 5 to 9 339 5.90% Age 10 to 14 371 6.46% Age 15 to 17 231 4.03% Age 18 to 20 210 3.66% Age 21 to 24 258 4.50% Age 25 to 34 711 12.39% Age 35 to 44 920 16.04% Age 45 to 54 752 13.10% Age 55 to 64 651 11.34% Age 65 to 74 612 10.66% Age 75 to 84 277 4.82% Age 85 and over 101 1.77% 2023 Est. Median Age, Male 39.81 2023 Est. Average Age, Male 40.10 2023 Est. Female Population by Age 5,975 Age 0 to 4 298 4.98% Age 5 to 9 319 5.34% Age 10 to 14 356 5.96% Age 15 to 17 229 3.83% Age 18 to 20 203 3.40% Age 21 to 24 262 4.38% Age 25 to 34 645 10.79% Age 35 to 44 960 16.07% Age 45 to 54 735 12.31% Age 55 to 64 676 11.32% Age 65 to 74 709 11.87% Age 75 to 84 350 5.85% Age 85 and over 233 3.90% 2023 Est. Median Age, Female 42.05 2023 Est. Average Age, Female 42.62
Demographic Snapshot (Part 1)
0 - 1 mi
12E27CC01400
Sitewise Online
Pop-Facts: Demographic Snapshot (Part 1)
Pop-Facts:
Copyright © Claritas, LLC 2023. All rights reserved.
12E27CC01400
2023 Est. Pop Age 15+ by Marital Status 9,724 Total, Never Married 2,919 30.02% Males, Never Married 1,570 16.14% Females, Never Married 1,349 13.88% Married, Spouse present 4,619 47.50% Married, Spouse absent 268 2.76% Widowed 676 6.95% Males, Widowed 239 2.46% Females, Widowed 437 4.49% Divorced 1,241 12.76% Males, Divorced 465 4.78% Females, Divorced 776 7.98% 2023 Est. Pop Age 25+ by Edu. Attainment 8,332 Less than 9th grade 196 2.35% Some High School, no diploma 351 4.21% High School Graduate (or GED) 1,352 16.23% Some College, no degree 2,000 24.00% Associate Degree 941 11.30% Bachelor's Degree 2,238 26.86% Master's Degree 839 10.07% Professional School Degree 150 1.80% Doctorate Degree 266 3.19% 2023 Est. Pop. Age 25+ by Edu. Attain., Hisp./Lat. 590 No High School Diploma 83 14.13% High School Graduate 137 23.27% Some College or Associate's Degree 226 38.33% Bachelor's Degree or Higher 143 24.28%
Demographic Snapshot (Part 1)
0 -
mi
1
12E27CC01400 Sitewise Online Pop-Facts: Demographic Snapshot (Part 2) Pop-Facts: Demographic Snapshot (Part 2) 12E27CC01400 0 - 1 mi Households 2028 Projection 4,975 2023 Estimate 4,640 2020 Census 4,517 2010 Census 3,902 Growth 2023-2028 7.22% Growth 2020-2023 2.73% Growth 2010-2020 15.76% 2023 Est. Households by Household Type 4,640 Family Households 2,951 63.61% Nonfamily Households 1,689 36.39% 2023 Est. Group Quarters Population 92 2023 HHs by Ethnicity: Hispanic/Latino 299 6.44% 2023 Est. Households by HH Income 4,640 Income < $15,000 374 8.07% Income $15,000 to $24,999 173 3.74% Income $25,000 to $34,999 425 9.15% Income $35,000 to $49,999 454 9.78% Income $50,000 to $74,999 538 11.59% Income $75,000 to $99,999 626 13.50% Income $100,000 to $124,999 437 9.41% Income $125,000 to $149,999 374 8.06% Income $150,000 to $199,999 530 11.42% Income $200,000 to $249,999 255 5.49% Income $250,000 to $499,999 308 6.63% Income $500,000+ 147 3.16% 2023 Est. Average Household Income $121,924 2023 Est. Median Household Income $89,222 2023 Median HH Income by Single-Class. Race or Ethn. White Alone $91,720 Black or African American Alone $41,266 American Indian and Alaska Native Alone $72,256 Asian Alone $107,012 Native Hawaiian and Other Pacific Islander Alone $126,356 Some Other Race Alone $67,277 Two or More Races $85,035 Hispanic or Latino $77,604 Not Hispanic or Latino $90,992
12E27CC01400
Sitewise Online
Pop-Facts: Demographic Snapshot (Part 2)
Pop-Facts:
12E27CC01400
Demographic Snapshot (Part
2)
0 - 1 mi
12E27CC01400
Sitewise Online
Pop-Facts: Demographic Snapshot (Part 2)
Pop-Facts:
2023 Est. Family HH Type by Presence of Own Children 2,951 Married-Couple Family, own children 944 31.97% Married-Couple Family, no own children 1,358 46.02% Male Householder, own children 100 3.38% Male Householder, no own children 100 3.39% Female Householder, own children 251 8.51% Female Householder, no own children 199 6.73% 2023 Est. Households by Household Size 4,640 1-person 1,339 28.85% 2-person 1,743 37.57% 3-person 575 12.40% 4-person 562 12.12% 5-person 304 6.55% 6-person 101 2.19% 7-or-more-person 15 0.33% 2023 Est. Average Household Size 2.50 2023 Est. Households by Presence of People Under 18 4,640 Households with 1 or more People under Age 18 1,408 30.35% Households with No People under Age 18 3,232 69.65% Households with 1 or more People under Age 18 1,408 Married-Couple Family 991 70.36% Other Family, Male Householder 117 8.27% Other Family, Female Householder 284 20.14% Nonfamily, Male Householder 9 0.67% Nonfamily, Female Householder 8 0.56% Households with No People under Age 18 3,232 Married-Couple Family 1,308 40.49% Other Family, Male Householder 84 2.59% Other Family, Female Householder 166 5.14% Nonfamily, Male Householder 747 23.13% Nonfamily, Female Householder 926 28.65%
Demographic Snapshot (Part 2)
0
mi
12E27CC01400
- 1
12E27CC01400
Sitewise Online
Pop-Facts: Demographic Snapshot (Part 2)
Pop-Facts:
2023 Est. Households by Number of Vehicles 4,640 No Vehicles 426 9.18% 1 Vehicle 1,353 29.16% 2 Vehicles 1,886 40.64% 3 Vehicles 575 12.39% 4 Vehicles 339 7.31% 5 or more Vehicles 61 1.32% 2023 Est. Average Number of Vehicles 1.84 Family Households 2028 Projection 3,145 2023 Estimate 2,951 2010 Census 2,518 Growth 2023-2028 6.58% Growth 2010-2023 17.22% 2023 Est. Families by Poverty Status 2,951 2023 Families at or Above Poverty 2,750 93.19% 2023 Families at or Above Poverty with Children 1,077 36.49% 2023 Families Below Poverty 201 6.81% 2023 Families Below Poverty with Children 121 4.08% 2023 Est. Pop Age 16+ by Employment Status 9,573 In Armed Forces 0 0.00% Civilian - Employed 5,750 60.07% Civilian - Unemployed 277 2.90% Not in Labor Force 3,546 37.04% 2023 Est. Civ. Employed Pop 16+ by Class of Worker 5,642 For-Profit Private Workers 3,723 65.99% Non-Profit Private Workers 618 10.95% Local Government Workers 448 7.94% State Government Workers 132 2.35% Federal Government Workers 117 2.08% Self-Employed Workers 603 10.70% Unpaid Family Workers 0 0.00%
Demographic Snapshot (Part 2)
0 -
mi
12E27CC01400
1
2023 Est. Civ. Employed Pop 16+ by Occupation 5,642 Architect/Engineer 61 1.09% Arts/Entertainment/Sports 8 0.14% Building Grounds Maintenance 148 2.62% Business/Financial Operations 291 5.16% Community/Social Services 146 2.59% Computer/Mathematical 169 2.99% Construction/Extraction 120 2.13% Education/Training/Library 249 4.41% Farming/Fishing/Forestry 16 0.29% Food Prep/Serving 364 6.46% Healthcare Practitioner/Technician 467 8.28% Healthcare Support 302 5.35% Maintenance Repair 77 1.37% Legal 79 1.40% Life/Physical/Social Science 85 1.51% Management 1,011 17.91% Office/Admin. Support 650 11.52% Production 246 4.36% Protective Service 90 1.59% Sales/Related 616 10.92% Personal Care/Service 138 2.45% Transportation/Moving 309 5.48% 2023 Est. Pop 16+ by Occupation Classification 5,642 Blue Collar 752 13.33% White Collar 3,831 67.91% Service & Farm 1,058 18.76% 2023 Est. Workers Age 16+ by Transp. To Work 5,502 Drove Alone 4,202 76.36% Car Pooled 293 5.33% Public Transportation 244 4.43% Walked 124 2.25% Bicycle 50 0.92% Other Means 120 2.18% Worked at Home 470 8.54% 2023 Est. Workers Age 16+ by Travel Time to Work* Less than 15 minutes 967 15 to 29 Minutes 1,571 30 to 44 Minutes 1,536 45 to 59 Minutes 570 60 or more Minutes 328 2023 Est. Avg. Travel Time to Work in Minutes* 31.72 12E27CC01400 Sitewise Online Pop-Facts: Demographic Snapshot (Part 2) Pop-Facts: Demographic Snapshot (Part 2) 12E27CC01400 0 - 1 mi
12E27CC01400 Sitewise Online
Pop-Facts: Demographic Snapshot (Part 2)
Pop-Facts:
12E27CC01400
2023 Est. Occupied Housing Units by Tenure 4,640 Owner-Occupied 2,619 56.45% Renter-Occupied 2,021 43.55% 2023 Occupied Housing Units: Avg. Length of Residence Owner-Occupied 12 Renter-Occupied 5
Demographic Snapshot (Part
2)
0
- 1 mi
2023 Est. Owner Occupied Housing Units by Value 2,619 Value Less than $20,000 34 1.30% Value $20,000 to $39,999 27 1.03% Value $40,000 to $59,999 20 0.75% Value $60,000 to $79,999 6 0.24% Value $80,000 to $99,999 2 0.06% Value $100,000 to $149,999 15 0.56% Value $150,000 to $199,999 3 0.12% Value $200,000 to $299,999 36 1.39% Value $300,000 to $399,999 170 6.49% Value $400,000 to $499,999 428 16.34% Value $500,000 to $749,999 948 36.17% Value $750,000 to $999,999 607 23.18% Value $1,000,000 to $1,499,999 217 8.30% Value $1,500,000 to $1,999,999 30 1.14% Value $2,000,000 or more 77 2.92% 2023 Est. Median All Owner-Occupied Housing Unit Value $650,059 2023 Est. Housing Units by Units in Structure 4,930 1 Unit Attached 228 4.62% 1 Unit Detached 2,625 53.24% 2 Units 0 0.00% 3 or 4 Units 118 2.39% 5 to 19 Units 639 12.96% 20 to 49 Units 260 5.27% 50 or More Units 933 18.92% Mobile Home or Trailer 128 2.60% Boat, RV, Van, etc. 0 0.00% Dominant structure type 1 Unit Detached 2023 Est. Housing Units by Year Structure Built 4,930 Housing Units Built 2014 or Later 243 4.93% Housing Units Built 2010 to 2013 476 9.65% Housing Units Built 2000 to 2009 1,041 21.11% Housing Units Built 1990 to 1999 926 18.79% Housing Units Built 1980 to 1989 811 16.45% Housing Units Built 1970 to 1979 868 17.62% Housing Units Built 1960 to 1969 400 8.11% Housing Units Built 1950 to 1959 119 2.41% Housing Units Built 1940 to 1949 22 0.44% Housing Units Built 1939 or Earlier 24 0.49% 2023 Est. Median Year Structure Built** 1992 Dominant Year Structure Built 2000 to 2009 12E27CC01400 Sitewise Online Pop-Facts: Demographic Snapshot (Part 2) Pop-Facts: Demographic Snapshot (Part 2) 12E27CC01400 0 - 1 mi
12E27CC01400
Sitewise Online
Pop-Facts: Demographic Snapshot (Part 2)
Pop-Facts: Demographic Snapshot (Part 2)
Copyright © Claritas, LLC 2023. All rights reserved.
* This row intentionally left blank. No Total Category.
**1939 will appear when at least half of the Housing Units in this reports area were built in 1939 or earlier.
12E27CC01400 0 - 1 mi
12E27CC01400 Sitewise Online Pop-Facts: Census Demographic Overview (Part 1) Pop-Facts: Census Demographic Overview (Part 1) 12E27CC01400 0 - 1 mi Population 2028 Projection 12,477 2023 Estimate 11,713 2020 Census 11,515 2010 Census 9,787 Growth 2023-2028 6.53% Growth 2020-2023 1.72% Growth 2010-2020 17.66% 2020 Population by Single-Classification Race 11,515 White Alone 7,355 63.87% Black or African American Alone 347 3.01% American Indian and Alaska Native Alone 107 0.93% Asian Alone 1,801 15.64% Native Hawaiian and Other Pacific Islander Alone 127 1.10% Some Other Race Alone 503 4.37% Two or More Races 1,042 9.05% 2020 Population By Ethnicity 11,515 Not Hispanic or Latino 10,339 89.79% Hispanic or Latino 1,176 10.21% 2020 Hispanic or Latino by Single-Classification Race 1,176 White Alone 260 22.11% Black or African American Alone 18 1.55% American Indian and Alaska Native Alone 34 2.92% Asian Alone 14 1.19% Native Hawaiian and Other Pacific Islander Alone 1 0.10% Some Other Race Alone 438 37.25% Two or More Races 410 34.88% 2010 Population by Sex 9,787 Male 4,782 48.86% Female 5,005 51.14% Male/Female Ratio 0.96
12E27CC01400
Sitewise Online
Pop-Facts: Census Demographic Overview (Part 1)
Pop-Facts:
12E27CC01400 0 - 1 mi
2010 Population by Age 9,787 Age 0 to 4 581 5.93% Age 5 to 9 643 6.57% Age 10 to 14 638 6.52% Age 15 to 17 370 3.78% Age 18 to 20 366 3.74% Age 21 to 24 551 5.63% Age 25 to 34 1,308 13.37% Age 35 to 44 1,314 13.43% Age 45 to 54 1,432 14.63% Age 55 to 64 1,252 12.79% Age 65 to 74 675 6.90% Age 75 to 84 368 3.76% Age 85 and over 288 2.94% Age 16 and over 7,804 79.74% Age 18 and over 7,555 77.19% Age 21 and over 7,189 73.45% Age 65 and over 1,332 13.61% 2010 Median Age 38.32
Census Demographic Overview (Part 1)
2010 Male Population by Age 4,782 Age 0 to 4 303 6.33% Age 5 to 9 315 6.60% Age 10 to 14 324 6.78% Age 15 to 17 208 4.34% Age 18 to 20 176 3.67% Age 21 to 24 254 5.31% Age 25 to 34 682 14.27% Age 35 to 44 640 13.38% Age 45 to 54 713 14.91% Age 55 to 64 614 12.84% Age 65 to 74 335 7.01% Age 75 to 84 142 2.97% Age 85 and over 76 1.59% 2010 Median Age, Male 37.02 2010 Female Population by Age 5,005 Age 0 to 4 278 5.56% Age 5 to 9 327 6.54% Age 10 to 14 314 6.28% Age 15 to 17 163 3.25% Age 18 to 20 190 3.80% Age 21 to 24 297 5.93% Age 25 to 34 626 12.50% Age 35 to 44 674 13.47% Age 45 to 54 719 14.36% Age 55 to 64 638 12.75% Age 65 to 74 340 6.80% Age 75 to 84 226 4.52% Age 85 and over 212 4.24% 2010 Median Age, Female 39.56
Sitewise Online Pop-Facts: Census Demographic Overview (Part 1) Pop-Facts: Census Demographic Overview (Part 1) 12E27CC01400 0 - 1 mi
Copyright © Claritas, LLC 2023. All rights reserved. 12E27CC01400
12E27CC01400 Sitewise Online Pop-Facts: Census Demographic Overview (Part 2) Pop-Facts: Census Demographic Overview (Part 2) 12E27CC01400 0 - 1 mi Households 2028 Projection 4,975 2023 Estimate 4,640 2020 Census 4,517 2010 Census 3,902 Growth 2023-2028 7.22% Growth 2020-2023 2.73% Growth 2010-2020 15.76% 2010 Households by Household Type 3,902 Family Households 2,518 64.53% Non-family Households 1,384 35.47% 2010 Group Quarters Population 46 2010 Hispanic or Latino Households 239 6.12% 2010 Households by Household Size 3,902 1-person 1,087 27.86% 2-person 1,317 33.77% 3-person 609 15.61% 4-person 487 12.47% 5-person 230 5.89% 6-person 107 2.75% 7-or-more-person 65 1.66%
2010 Households by Type and Presence of Children 3,902 Married-Couple Family, own children 815 20.90% Male Householder, own children 82 2.09% Female Householder, own children 212 5.44% Married-Couple Family, no own children 1,159 29.70% Male Householder, no own children 86 2.19% Female Householder, no own children 164 4.20% Non-family Households 1,384 35.47% 2010 Households by Presence of People Under Age 18 3,902 HH with 1 or More People Under Age 18: 1,205 30.89% Households with No People Under Age 18: 2,696 69.11% HH with 1 or More People Under Age 18: 1,205 Married-Couple Family 856 71.02% Other Family, Male Householder 96 7.92% Other Family, Female Householder 240 19.89% Nonfamily, Male Householder 9 0.77% Nonfamily, Female Householder 5 0.39% Households with No People Under Age 18: 2,696 Married-Couple Family 1,116 41.41% Other Family, Male Householder 72 2.66% Other Family, Female Householder 139 5.16% Nonfamily, Male Householder 621 23.03% Nonfamily, Female Householder 748 27.75% 2010 Occupied Housing Units by Tenure 3,902 Owner-Occupied 2,183 55.96% Renter-Occupied 1,718 44.04%
© Claritas,
2023.
Sitewise Online Pop-Facts: Census Demographic Overview (Part 2) Pop-Facts: Census Demographic Overview (Part 2) 12E27CC01400 0 - 1 mi
Copyright
LLC
All rights reserved. 12E27CC01400
Total
trade including food and drink (NAICS 44, 45 and 722) $292,449,503 $132,760,710 $159,688,793
Total retail trade (NAICS 44 and 45) $259,860,721 $111,853,541 $148,007,180
Motor vehicle and parts dealers (NAICS 441) $59,074,140 $17,376,012 $41,698,128
Automobile dealers (NAICS 4411) $48,706,692 $13,099,447 $35,607,244
New car dealers (NAICS 44111) $43,520,510 $8,769,458 $34,751,051
Used car dealers (NAICS 44112) $5,186,181 $4,329,990 $856,192
Other motor vehicle dealers (NAICS 4412) $5,249,920 $1,742,683 $3,507,237
Recreational vehicle dealers (NAICS 44121) $1,930,532 $1,378,310 $552,222
Motorcycle, boat, and other motor vehicle dealers (NAICS 44122) $3,319,388 $364,373 $2,955,016
Boat dealers (NAICS 441222) $1,224,783 $176,995 $1,047,788
Motorcycle, ATV, and all other motor vehicle dealers (NAICS 441228) $2,094,605 $187,377 $1,907,228
Automotive parts, accessories, and tire stores (NAICS 4413) $5,117,530 $2,533,882 $2,583,648
Automotive parts and accessories stores (NAICS 44131) $3,225,066 $1,281,087 $1,943,979
Paint
Hardware
Other
Lawn
Outdoor
Nursery,
Food
Grocery
Supermarkets and other grocery (except convenience) stores (NAICS 44511)
Convenience stores (NAICS 44512)
Specialty
$
$478,985
$21,483,881 $10,335,401
12E27CC01400
Online Retail Market Power Opportunity Gap Report By Retail Store Types Retail Market Power Opportunity Gap Report By Retail Store Types 12E27CC01400 0 - 1 mi 2023 Demand 2023 Supply Opportunity Gap/Surplus
Sitewise
retail
Tire dealers (NAICS 44132) $1,892,464 $1,252,795 $639,669 Furniture and home furnishings stores (NAICS 442) $5,496,622 $3,361,266 $2,135,356 Furniture stores (NAICS 4421) $3,110,463 $1,884,986 $1,225,477 Home furnishings stores (NAICS 4422) $2,386,159 $1,476,280 $909,879 Floor covering stores (NAICS 44221) $1,213,669 $1,137,542 $ 76,127 Other home furnishings stores (NAICS 44229) $1,172,490 $338,738 $833,752 Window treatment stores (NAICS 442291) $ 68,290 $ 87,772 -$19,482 All other home furnishings stores (NAICS 442299) $1,104,200 $250,966 $853,234 Electronics and appliance stores (NAICS 443) $4,102,611 $3,695,957 $406,654 Household appliance stores (NAICS 443141) $866,002 $483,932 $382,070 Electronics stores (NAICS 443142) $3,236,609 $3,212,025 $ 24,584
material and garden equipment and supplies dealers (NAICS 444) $18,579,744 $13,171,354 $5,408,390
material and supplies dealers (NAICS 4441) $16,183,815 $13,171,354 $3,012,461 Home centers (NAICS 44411) $9,161,724 $5,674,516 $3,487,208
Building
Building
$539,087
and wallpaper stores (NAICS 44412)
$390,491 $148,597
$1,351,694 $753,533
stores (NAICS 44413)
$598,161
$5,131,310 $6,352,815
building material dealers (NAICS 44419)
-$1,221,504
garden equipment
supplies
$2,395,928
0
and
and
stores (NAICS 4442)
$
$2,395,928
$478,985
0
power equipment stores (NAICS 44421)
$1,916,943 $ 0
garden center, and farm supply stores (NAICS 44422)
$1,916,943
$37,112,590
and beverage stores (NAICS 445)
$23,995,836 $13,116,754
$33,230,200
stores (NAICS 4451)
$23,690,629 $9,539,571
$31,819,282
$1,410,918
$2,206,749 -$795,831
$960,546
food stores (NAICS 4452)
$305,207 $655,339
Meat
Fish
Fruit
Other
Sporting
Sporting
General
markets (NAICS 44521) $295,253 $136,329 $158,925
and seafood markets (NAICS 44522) $115,901 $ 0 $115,901
vegetable
$199,829
$199,829
and
markets (NAICS 44523)
$ 0
specialty food stores (NAICS
$349,563 $168,878 $180,685
goods and confectionery and nut stores (NAICS 445291 + 445292) $184,679 $ 66,711 $117,968 All other specialty food stores (NAICS 445299) $164,884 $102,167 $ 62,717 Beer, wine, and liquor stores (NAICS 4453) $2,921,844 $ 0 $2,921,844
and personal care stores (NAICS 446) $15,150,220 $2,001,567 $13,148,653 Pharmacies and drug stores (NAICS 44611) $13,003,383 $578,288 $12,425,095 Cosmetics, beauty supplies, and perfume stores (NAICS 44612) $898,789 $496,181 $402,608 Optical goods stores (NAICS 44613) $428,370 $120,252 $308,119 Other health and personal care stores (NAICS 44619) $819,678 $806,847 $ 12,831 Food (health) supplement stores (NAICS 446191) $289,727 $282,855 $ 6,873 All other health and personal care stores (NAICS 446199) $529,950 $523,993 $ 5,958 Gasoline stations (NAICS 447) $20,641,996 $2,255,782 $18,386,214 Clothing and clothing accessories stores (NAICS 448) $12,588,893 $1,848,734 $10,740,159 Clothing stores (NAICS 4481) $8,616,219 $728,726 $7,887,493 Men's clothing stores (NAICS 44811) $338,057 $124,546 $213,511 Women's clothing stores (NAICS 44812) $1,710,190 $119,031 $1,591,158 Children's and infants' clothing stores (NAICS 44813) $297,311 $122,799 $174,512 Family clothing stores (NAICS 44814) $5,043,338 $118,922 $4,924,415 Clothing accessories stores (NAICS 44815) $447,472 $122,505 $324,968 Other clothing stores (NAICS 44819) $779,851 $120,923 $658,928
stores (NAICS 4482) $1,398,818 $537,913 $860,905
luggage, and leather goods stores (NAICS 4483) $2,573,856 $582,095 $1,991,761 Jewelry stores (NAICS 44831) $1,669,498 $312,618 $1,356,880 Luggage and leather goods stores (NAICS 44832) $904,358 $269,477 $634,881
44529)
Baked
Health
Shoe
Jewelry,
goods, hobby, musical instrument, and book stores (NAICS 451) $4,144,349 $4,367,946 -$223,596
goods, hobby, and musical instrument stores (NAICS 4511) $3,650,082 $4,091,890 -$441,807
goods stores (NAICS 45111) $2,446,825 $2,592,512 -$145,686 Hobby, toy, and game stores (NAICS 45112) $919,813 $871,155 $ 48,658 Sewing, needlework, and piece goods stores (NAICS 45113) $122,837 $361,104 -$238,267 Musical instrument and supplies stores (NAICS 45114) $160,607 $267,118 -$106,512 Book stores and news dealers (NAICS 4512) $494,268 $276,056 $218,211 Book stores (NAICS 451211) $460,257 $276,056 $184,201 News dealers and newsstands (NAICS 451212) $ 34,010 $ 0 $ 34,010
Sporting
merchandise stores (NAICS 452) $32,726,253 $26,093,826 $6,632,427 Department stores (NAICS 4522) $4,399,738 $3,421,332 $978,406 Other general merchandise stores (NAICS 4523) $28,326,515 $22,672,494 $5,654,021 Warehouse clubs and supercenters (NAICS 452311) $25,674,016 $21,718,460 $3,955,555 All other general merchandise stores (NAICS 452319) $2,652,500 $954,034 $1,698,466 12E27CC01400 Sitewise Online Retail Market Power Opportunity Gap Report By Retail Store Types Retail Market Power Opportunity Gap Report By Retail Store Types 12E27CC01400 0 - 1 mi 2023 Demand 2023 Supply Opportunity Gap/Surplus
Miscellaneous
Florists (NAICS 4531)
Office
Office
Gift,
Used
Other
All
$5,525,879
$1,156,195
store retailers (NAICS 453)
$4,369,684
$258,413
0
$
$258,413
$1,023,771
supplies, stationery, and gift stores (NAICS 4532)
$555,210 $468,560
$430,759 $279,495
supplies and stationery stores (NAICS 45321)
$151,263
novelty,
souvenir stores (NAICS
$593,012 $275,715 $317,297
and
45322)
merchandise
$800,890 $1,076,838 -$275,948
stores (NAICS 4533)
miscellaneous store retailers (NAICS
$3,442,806 $2,737,635 $705,171
and pet supplies stores (NAICS 45391) $1,123,944 $980,459 $143,485 Art dealers (NAICS 45392) $495,631 $ 73,458 $422,172 Manufactured (mobile) home dealers (NAICS 45393) $340,621 $295,387 $ 45,233 All other miscellaneous store retailers (NAICS 45399) $1,482,610 $1,388,330 $ 94,280 Tobacco stores (NAICS 453991) $443,906 $457,599 -$13,693
4539)
Pet
other miscellaneous store retailers
stores) (NAICS 453998) $1,038,704 $930,731 $107,973 Non-store retailers (NAICS 454) $44,717,422 $9,315,576 $35,401,846 Electronic shopping and mail-order houses (NAICS 4541) $42,769,846 $9,042,916 $33,726,931 Vending machine operators (NAICS 4542) $231,713 $ 0 $231,713 Direct selling establishments (NAICS 4543) $1,715,864 $272,661 $1,443,203 Fuel dealers (NAICS 45431) $1,024,882 $272,661 $752,221 Other direct selling establishments (NAICS 45439) $690,982 $ 0 $690,982 Food services and drinking places (NAICS 722) $32,588,782 $20,907,169 $11,681,613 Special food services (NAICS 7223) $2,539,362 $157,326 $2,382,037 Food service contractors (NAICS 72231) $2,017,514 $157,326 $1,860,189 Caterers (NAICS 72232) $471,041 $ 0 $471,041 Mobile food services (NAICS 72233) $ 50,807 $ 0 $ 50,807 Drinking places (alcoholic beverages) (NAICS 7224) $1,102,360 $ 0 $1,102,360 Restaurants and other eating places (NAICS 7225) $28,947,060 $20,749,843 $8,197,217 Full-service restaurants (NAICS 722511) $14,450,909 $6,542,906 $7,908,003 Limited-service restaurants (NAICS 722513) $12,300,544 $12,591,998 -$291,454 Cafeterias, grill buffets, and buffets (NAICS 722514) $313,564 $ 64,426 $249,139 Snack and nonalcoholic beverage bars (NAICS 722515) $1,882,042 $1,550,513 $331,529 GAFO* $59,059,751 $39,368,284 $19,691,468 General Merchandise Stores-452 $32,726,253 $26,093,826 $6,632,427 Clothing & Clothing Accessories Stores-448 $12,588,893 $1,848,734 $10,740,159 Furniture & Home Furnishings Stores-442 $5,496,622 $3,361,266 $2,135,356 Electronics & Appliance Stores-443 $4,102,611 $3,695,957 $406,654 Sporting Goods, Hobby, Book, Music Stores-451 $4,144,349 $4,367,946 -$223,596 Office Supplies, Stationery, Gift Stores-4532 $1,023,771 $555,210 $468,560
GAFO (General merchandise, Apparel, Furniture and Other) represents sales at stores that sell merchandise normally sold in department stores. This category is not included in Total Retail Sales Including Eating and Drinking Places.
Sitewise Online Retail Market Power Opportunity Gap Report By Retail Store Types Retail Market Power Opportunity Gap Report By Retail Store Types 12E27CC01400 0 - 1 mi 2023 Demand 2023 Supply Opportunity Gap/Surplus
(except tobacco
*
12E27CC01400
12E27CC01400
Retail Market Power data is derived from two major sources of information. The demand data is derived from the Consumer Expenditure Survey (CE Survey or CEX), which is fielded by the U.S. Bureau of Labor Statistics (BLS). The supply data is derived from the Census of Retail Trade (CRT), which is made available by the U.S. Census. Additional data sources are incorporated to create both supply and demand estimates.
The difference between demand and supply represents the opportunity gap or surplus available for each merchandise line in the specified reporting geography. When this difference is positive (demand is greater than the supply), there is an opportunity gap for that merchandise line; when the difference is negative (supply is greater than demand), there is a surplus.
Copyright © 2023 Environics Analytics. All rights reserved.
Sitewise Online Retail Market Power Opportunity Gap Report By Retail Store Types Retail Market Power Opportunity Gap Report By Retail Store Types
0 - 1 mi 2023 Demand 2023 Supply Opportunity Gap/Surplus
12E27CC01400
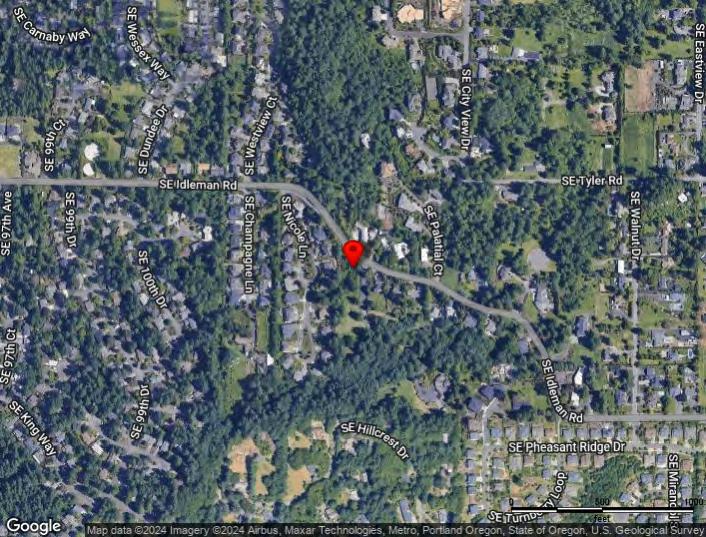
Powered by Sitewise Data Source: Kalibrate TrafficMetrix Traffic Listing 12E27CC01400 March 26, 2024 Map # Street Cross Street Dir. Volume Type/Year Dist. (mi) 1. Southeast Idleman Road SE 97th Ave W 4,970 Current Year 0.4 2. SE Idleman Rd SE Forton Pl E 5,892 Current Year 0.5 3. SE Hillcrest Rd SE 100th Ave E 580 Published (2000) 0.5 4. SE 92nd Avenue SE Idleman Rd N 1,632 Current Year 0.6 5. Southeast Causey Avenue SE William Otty Rd SE 3,061 Current Year 0.6 6. SE Stevens Ct SE Top O Scott St S 2,868 Current Year 0.6 7. SE Stevens Road SE Top O Scott St S 3,166 Current Year 0.6 8. SE Hillcrest St SE Stevens Ct E 197 Current Year 0.6 9. SE Idleman Road SE 92nd Ave E 5,093 Current Year 0.6 10. SE Bob Schumacher Rd SE Old Town Ct S 8,073 Current Year 0.6 11. SE 92nd Ave SE Bob Schumacher Rd S 9,805 Current Year 0.7 12. SE Johnson Creek Boulevard SE Scott PkLn SW 3,679 Current Year 0.7 13. SE 92nd Avenue SE Otty Pl S 9,634 Current Year 0.7 14. SE Causey Ave SE Stevens Ct E 3,062 Current Year 0.7 15. SE Idleman Rd SE Tyler Rd SW 2,000 Published (2000) 0.8 16. Johnson Creek SE Hunters Bluff Ave E 4,281 Current Year 0.8