Vol. 20 No. 3 Winter 2015
GlobalCommerce Tennessee
and
the
s
Mapping Immigration Tennessee’s Foreign-Born Population
by Steven G. Livingston
I
mmigration joins foreign investment and trade as one of the great avenues of globalization. As trade and foreign investment have grown in Tennessee, so has the number of people arriving from abroad. Once among the American states with the smallest foreignborn populations, today over 300,000 people living in Tennessee have come from another country. Close to one-third have arrived during the past decade.
The state’s immigrant community, however, is geographically quite concentrated. Most state immigrants are found in a handful of communities, led by the Nashville area. In 2013, 4,275 of the 8,380 new permanent residents that came to Tennessee located in Nashville and surrounding areas. That’s over
Economy
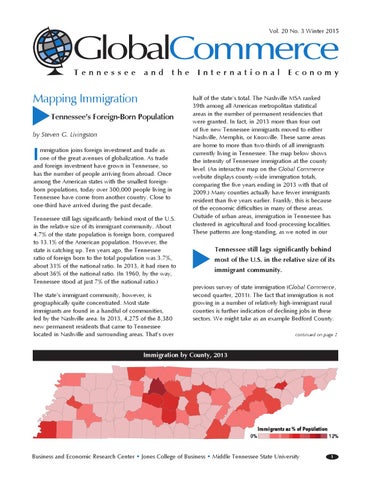
half of the state’s total. The Nashville MSA ranked 39th among all American metropolitan statistical areas in the number of permanent residencies that were granted. In fact, in 2013 more than four out of five new Tennessee immigrants moved to either Nashville, Memphis, or Knoxville. These same areas are home to more than two-thirds of all immigrants currently living in Tennessee. The map below shows the intensity of Tennessee immigration at the county level. (An interactive map on the Global Commerce website displays county-wide immigration totals, comparing the five years ending in 2013 with that of 2009.) Many counties actually have fewer immigrants resident than five years earlier. Frankly, this is because of the economic difficulties in many of these areas. Outside of urban areas, immigration in Tennessee has clustered in agricultural and food-processing localities. These patterns are long-standing, as we noted in our
s
Tennessee still lags significantly behind most of the U.S. in the relative size of its immigrant community. About 4.7% of the state population is foreign born, compared to 13.1% of the American population. However, the state is catching up. Ten years ago, the Tennessee ratio of foreign born to the total population was 3.7%, about 31% of the national ratio. In 2013, it had risen to about 36% of the national ratio. (In 1960, by the way, Tennessee stood at just 7% of the national ratio.)
International
Tennessee still lags significantly behind most of the U.S. in the relative size of its immigrant community.
previous survey of state immigration (Global Commerce, second quarter, 2011). The fact that immigration is not growing in a number of relatively high-immigrant rural counties is further indication of declining jobs in these sectors. We might take as an example Bedford County. continued on page 2
Immigration by County, 2013
Immigrants as % of Population 0%
Business and Economic Research Center • Jones College of Business • Middle Tennessee State University
12%
1
Foreign-Born as % of Population, Tennessee and U.S., 2004–2013 14% 13% 12% 6%
4% Tennessee U.S. 3%
New Tennessee Permanent Residents, by Year, 2004–2013 10K
8K
6K
4K
2K
2004
2005
Immigration
2006
2007
2008
continued from page 1
It continues to have a relative high ratio of immigrants, particularly because of the processing industry there. But in recent years the number of immigrants has dropped substantially following a decline in available jobs. Manufacturing employment in Bedford County overall has fallen 20% over the past decade. We might note that long-term immigrants (“permanent residents”) are dwarfed by the numbers of short-term foreign visitors to Tennessee. Over 180,000 people visited Tennessee from abroad in 2013, about 14,000 of them as students. This is more than 20 times the number that sought a new home here. Many people believe that Tennessee immigration is overwhelmingly from Mexico, but today that is far from 2
2009
2010
2011
2012
2013
the truth. Only 11% of the state’s 2013 immigrants (940 people) are from Mexico. This compares to 13% for the entire U.S. In fact, the state welcomed almost twice as many new immigrants from Asia as from the Americas. Many also believe immigration is surging into the state, which is also not quite accurate. The number of new arrivals has remained quite steady throughout our new century, at around 8,000 to 9,000 a year, peaking in 2006. The primary cyclical pattern, as one might expect, is the condition of the economy. In good times, when jobs are plentiful, immigration rises. And when jobs grow scarce, as after the financial crash, it slows. The goal of most immigrants is to become Americans. Figuring out their rate of success is not easy. For most permanent residents, there is a minimum five-year wait continued on page 3
Business and Economic Research Center • Jones College of Business • Middle Tennessee State University
Immigration
continued from page 2
to become naturalized. (It’s less if you’re a spouse of an American.) But of course it can take much longer. If we make a crude “naturalization rate” calculation, we find the number of newly naturalized citizens is about half the number of permanent residents that arrived in Tennessee five years earlier. This ratio has held pretty steady over the years, though it has bounced around a bit. It’s just slightly below the rate for the entire U.S. In 2013, Tennessee ranked 22nd among states in the number of foreign born that became American citizens. A final topic always of interest is unauthorized or illegal immigration. Accurate statistics of its size are notoriously difficult to find. However, the Migration Policy Institute estimates it to be in the neighborhood of 119,000 for the state of Tennessee. This would mean about 30% of Tennessee’s foreign-born residents fall into this category. The institute also estimates that 33,000 unauthorized immigrants live in Davidson County and another 24,000 in Shelby. These two counties thus account for over half of this population. It’s interesting that the Memphis area appears to have by far the highest ratio of unauthorized immigrants to foreign-born residents: 40%. The reason for this is not immediately apparent. Since close to 60% of the illegal immigration to Tennessee comes from Mexico, it is likely due to characteristics of the Memphis economy and its existing immigrant community. As with immigration more generally, the consensus is that unauthorized immigration has slowed in recent years and might now be better termed as “steady” than the more apocalyptic terms one sometimes hears.
The number of immigrants remains relatively small compared to the whole population, and its rate of growth is not changing much.
Tennessee Export and Industry Size New New Permanent Naturalized Residents Citizens Community
It is easy to either overstate or understate the impact of immigration on Tennessee. The number of immigrants remains relatively small compared to the whole population, and its rate of growth is not changing much. That said, the absolute number of immigrants has been steadily rising, transforming many communities around the state. For many Tennesseans, immigrant neighbors or coworkers are their most direct encounter with globalization. There is every evidence such encounters will become ever more frequent in the years ahead. n
4,275 2,612 Nashville-Murfreesboro-Franklin 1,779 1,006 Memphis* 833 430 Knoxville 463 262 Chattanooga* 244 216 Clarksville* 136 74 Johnson City 107 169 Kingsport-Bristol-Bristol* 101 57 Sevierville 100 92 Cleveland 83 52 Columbia 54 54 Cookeville 50 37 Shelbyville 46 19 Tullahoma 45 38 Morristown 27 16 Athens 25 15 Greeneville 24 6 Dyersburg 17 4 Brownsville 17 13 Union City* 16 6 Humboldt 16 54 Jackson 15 7 Harriman 14 16 McMinnville 14 Undisclosed Newport 13 6 Crossville 13 9 Martin 7 9 Lawrenceburg 7 5 Lewisburg 7 3 Paris 6 Undisclosed LaFollette
Data: U.S. Census, Department of Homeland Security, Migration Policy Institute.
* Includes neighboring states.
Business and Economic Research Center 1301 E. Main Street, Box 102 Murfreesboro, TN 37132 www.mtsu.edu/berc • 615.898.2610
Author: Steven G. Livingston Editor/Designer: Sally Ham Govan MTSU is an AA/EEO employer. 3
TENNESSEE’S LEADING TRADE PARTNERS
s
Canada Mexico China Japan Belgium Singapore Netherlands United Kingdom 3rd Quarter 2014 3rd Quarter 2013
Brazil Australia $300
$600
$900
$1,200
$1,500
$1,800
$2,100
(Exports in millions)
TENNESSEE TRADE-WEIGHTED DOLLAR INDEX January 2008 = 100
120
110
s
100
90
ec
D
4
08 D
ec
09 D
ec
10 D
ec
11 D
ec
12 D
ec
13
ec
14
D
Business and Economic Research Center • Jones College of Business • Middle Tennessee State University
TENNESSEE MONTHLY EXPORTS Real Exports in $ Billions
Nominal Growth Rate (%)
4.0
s
3.5 3.0 2.5 2.0 30%
1.5 1.0
p Se
-10%
4
-0
p Se
6
-0
p Se
8
-0
p Se
0
-1
p Se
2
-1
p Se
4
-1
(Seasonally adjusted, expressed in 2014 dollars)
TENNESSEE MONTHLY IMPORTS In $ Millions
U.S. Imports in $ Millions
$7,000
$6,000 $180,000
$5,000
$160,000
$140,000
$4,000 Tennessee Imports U.S.
$3,000
p Se
s
$200,000
8
-0
p Se
9
-0
p Se
0
-1
p Se
1
-1
p Se
2
-1
p Se
3
-1
$120,000
p Se
4
-1
Business and Economic Research Center • Jones College of Business • Middle Tennessee State University
5
TENNESSEE’S LARGEST EXPORT SECTORS
3rd Quarter 2014
Value of Change from Change from Exports Last Year Last Quarter
Medical Equipment Motor Vehicle Parts Motor Vehicles Computer Equipment Basic Chemicals Synthetic Fibers & Filaments Auto, Industrial, & Electromedical Instruments
$867,743,395 -4.1% -2.7% $716,895,569 1.5% 4.9% $639,042,371 10.8% -12.6% $534,677,414 7.1% -6.0% $555,501,791 -1.0% -6.7% $483,496,816 3.8% 1.6% $400,470,604 7.8% 2.2%
WHAT’S HOT AND WHAT’S NOT*
3rd Quarter 2014
*Among Tennessee’s top 100 exported goods
Sectors with the Greatest Growth
Value of Exports
Growth
Decline
Automobiles $392,450,024 219.6% Heavy Coated Paperboard $18,093,449 180.1% Flywheels and Pulleys $14,200,098 118.7% Scanners, Magnetic/Optical Readers $23,638,936 112.6% Miscellaneous Electrical Machinery $29,967,187 102.6%
Sectors with the Greatest Decline Otherwise Unclassified Computers $9,791,548 -63.8% Discs, Tapes, and Other Optical Media $44,456,127 -56.6% Ash Containing Precious Metals $5,764,624 -49.8% Trucks and Large SUVs $220,283,774 -46.4% Nonwovens between 70 and 150 g/m2 $12,909,833 -45.9%
FASTEST-CHANGING EXPORT DESTINATIONS*
3rd Quarter 2014
*Among countries averaging > $5m sales/quarter
Value of Exports
Gain
Decline
Countries with the Greatest Growth Jordan Norway Bahrain Russia Denmark
$7,867,785 151.8% $10,889,593 94.5% $13,633,311 91.9% $82,340,338 89.4% $8,949,966 78.2%
Countries with the Greatest Decline Luxembourg Honduras Indonesia Qatar Turkey
6
$154,620 -99.0% $8,271,242 -69.8% $38,245,652 -38.6% $14,946,303 -37.5% $80,673,135 -34.2%
Business and Economic Research Center • Jones College of Business • Middle Tennessee State University
T E N N E S S E E
I N T E R N A T I O N A L
T
ennessee exports rose modestly in the third quarter, to $8.24 billion. This was a gain of 4% from the third quarter of 2013, just about identical to the national gain of 4.2%. Unfortunately all of the gain was due to a very strong July. State exports actually fell in the latter two months of the quarter. Though not helped by the soaring dollar, the Tennessee slowdown was more due to continuing slow global economic growth combined with large losses in several export sectors.
Though a few other commodities suffered significant reverses, including excavation equipment, nonwoven fabrics, cellulose, and tires, the large majority of Tennessee export industries were able to forge gains for the quarter, even if in many cases rather small ones. The automotive industry continued to lead the gainers. A steep fall in truck and heavy SUV shipments was more than countered by a large rise in car and light SUV exports. As a result, total vehicle exports rose from $533 million to $602 million. Canada accounted for the lion’s share of those gains, though China, Korea, and Russia (!) also saw significant upticks in Tennessee vehicle shipments. The odd Russian figure is presumably due to Volkswagen and its Russian auto plant. Automotive engine exports were up around 20% (to $200 million). With the exception of automotive instruments, most other auto-related goods posted positive numbers as well. Medical equipment and medical-related exports maintained their pole position as the state’s largest export industry, although it was not a particularly good quarter. While pharmaceuticals (up $22 million to $144 million), medicaments, orthopedic goods, and artificial joints made gains, there were losses almost everywhere else in the
3rd Quarter 2014
sector. Surgical catgut fared the worst, with its exports falling from $136 million to $104 million. The electronics sector fared better. Computer-product and telephony exports were both up over 10%. Electrical equipment was similarly strong, with shipments rising nearly 50% (from $83 million to $123 million). Tennessee’s other major export industries, chemicals, synthetic fibers, aircraft (and parts), and regulating/ diagnostic instruments, did not experience much change from a year earlier.
s
The major loss was in cotton shipments. The value of the state’s cotton exports fell by close to $100 million for the quarter ($225 million in the third quarter of 2013 but only $133 million in the 3rd quarter of 2014). The loss was global with Chinese exports off by half, Indonesia’s more than half, and Turkey’s by a full two-thirds. Most of the state’s poorest-performing markets were its traditional large cotton markets. The Chinese cotton stockpile and resulting decision to cut back imports does not bode well for the near future. The other sizable slide occurred in the shipment of optical media (DVDs and such), which fell by nearly $60 million (to $44 million). These exports go overwhelmingly to Canada.
T R A D E
Slow global economic growth and large losses in several sectors slowed state export growth.
Globally, Tennessee continues to feel the effects of Europe’s economic doldrums. State exports fell about 2% in the euro zone (to $965 million). The big decline in cotton exports meant in general a poor quarter in Asia. China, however, shrugged off the cotton losses. Thanks to a variety of industrial sectors, notably including automobiles, Tennessee’s total exports to China were up 6% (to $617 million). South Korea grew as well. Japan was another story. State exports there declined nearly $100 million, making it the state’s poorest-performing large market. About half of the loss was in the medical sector (explaining that industry’s weak quarter). The other half was due to a large decline in photovoltaic-cell (solar panel) sales. Though there was plenty of churn in South America, with exports to Chile dropping while those to Colombia soared, overall the continent barely moved. Tennessee shipments in the third quarter of 2013 were $564 million; in 2014 they were just $8 million more. The NAFTA market, finally, was steady if not spectacular. Exports to Mexico rose $101 million for the quarter (to $1.208 billion), while those to Canada increased $29 million (to $2.145 billion). That Canadian performance is actually better than it looks, for this figure includes a drop of nearly $80 million in goods sent back for repair or other reasons not involving an original sale. In sum, it could have been better, and it has been over the previous several quarters. But it could have been worse. State exports continue to eke out gains despite a sluggish world economy and a now-rising dollar. In such an environment it’s hard to ask for too much more. n
Business and Economic Research Center • Jones College of Business • Middle Tennessee State University
7