47
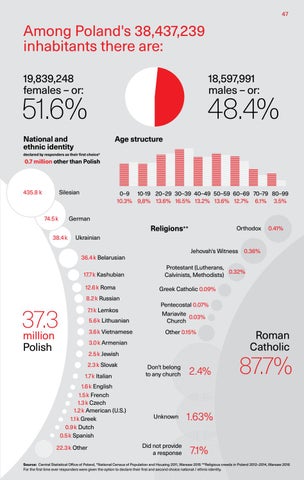
Among Poland's 38,437,239 inhabitants there are: 19,839,248 females – or:
18,597,991 males – or:
51.6%
48.4%
National and ethnic identity
Age structure
declared by responders as their first choice*
0.7 million other than Polish
435.8 k Silesian
74.5 k
0–9 10-19 20–29 30–39 40–49 50–59 60–69 70–79 80–99 10.3% 9,8% 13.6% 16.5% 13.2% 13.6% 12.7% 6.1% 3.5%
German
Religions** 38.4 k
Orthodox 0.41%
Ukrainian Jehovah's Witness 0.36%
36.4 k Belarusian 17.7 k Kashubian 12.6 k Roma 8.2 k Russian
37.3 million
7.1 k Lemkos 5.6 k Lithuanian 3.6 k Vietnamese
Protestant (Lutherans, 0.32% Calvinists, Methodists) Greek Catholic 0.09% Pentecostal 0.07% Mariavite 0.03% Church Other 0.15%
3.0 k Armenian
Polish
2.5 k Jewish 2.3 k Slovak 1.7 k Italian 1.6 k English 1.5 k French 1.3 k Czech 1.2 k American (U.S.) 1.1 k Greek 0.9 k Dutch 0.5 k Spanish 22.3 k Other
Don't belong to any church
Unknown
Did not provide a response
2.4%
Roman Catholic
87.7%
1.63% 7.1%
Source: Central Statistical Office of Poland, *National Census of Population and Housing 2011, Warsaw 2015 **Religious creeds in Poland 2012–2014, Warsaw 2016 For the first time ever responders were given the option to declare their first and second choice national / ethnic identity.