


Mountain View, CA


Mountain View, CA

Mountain View, California Annual Comprehensive Financial Report
For the Fiscal Year Ended June 30, 2025

Prepared by: Finance and Administrative Services Department
This page intentionally left blank

December 9, 2025
500 Castro Street, P.O. Box 7540
Mountain View, CA 94039-7540
650-903-6301 | MountainView.gov
Honorable Mayor, City Council, and Members of the Mountain View Community:
I submit for your information and consideration the Annual Comprehensive Financial Report (ACFR) of the City of Mountain View (City) for the fiscal year ended June 30, 2025.
The local economy is beginning to show signs of slowing. While the City’s major revenues have generally remained stable and, in some cases, benefited from inflationary trends and higher interest rates, these factors are not expected to continue at the same pace. As a result, future growth in the City’s major revenue sources is anticipated to be modest, with some areas experiencing minimal increases or potential softening in the near future. Thanks to the leadership of the City Council and through the support and hard work of the Executive Leadership team and our outstanding City employees, we have provided an exceptional level of service to our community while maintaining fiscal stability during the fiscal year.
While revenues have been strong in recent years, expenditures are expected to increase at a faster pace than revenue growth, creating a more challenging long-term fiscal outlook. As a result, we remain cautiously optimistic about the future fiscal health of the City. However, continued uncertainty related to inflationary pressures, elevated interest rates, shifting national economic policies, and global geopolitical conflicts further clouds the economic picture. Collectively, these factors contribute to the likelihood of slower, more moderate growth in the years ahead.
The currentGeneralOperating Fund Forecast indicates that the City hassufficient financial resources to maintain the Mountain View of today. However, building the Mountain View of tomorrow will require continued efforts to enhance and diversify the City’s revenue streams, ensuring long-term fiscal stability and accomplishing the bold initiatives the City is advancing.
During the fiscal year, on November 5, 2024, Mountain View residents overwhelmingly supported the visionfor the Mountain View of tomorrow and passedaproposedballotmeasure, Measure G,by over 72%. Measure G creates an additional tier to the existing property transfer tax for transactions over $6.0 million, providing a newrevenue source to help the Cityinvest in key community priorities.
PerCityCouncildirection,this additionalsourceofrevenuewillbededicatedtothefollowingfunding priorities for the next 10 years:
•35.0% to 40.0% for Public Safety Facilities;
•30.0% to 35.0% for Parks, Open Space, and Biodiversity;
Honorable Mayor, City Council, and Members of the Mountain View Community
December 9, 2025
Page 2 of 14
•20.0% to 25.0% for Affordable Housing; and
•5.0% to 15.0% for other general governmental services, including road maintenance, active transportation, small business support, and homeless support services, among others.
It is my pleasure to present the City’s Annual Comprehensive Financial Report (ACFR) for the fiscal year ended June 30, 2025. The ACFR has been prepared in accordance with the principles and standards for financial reporting established by the Governmental Accounting Standards Board (GASB) and in compliance with City Charter, Section 1106.
Althoughtheauditisconductedbyanindependentcertifiedpublicaccountingfirm,Citymanagement assumes full responsibility for the accuracy of the data, as well as the completeness and fairness of the presentation, including all disclosures. We believe the data, as presented, is accurate in all materialrespects, that its presentation fairlyshows the financial position and the results of the City’s operations as measured by the financial activity of the City’s various funds, and, in conjunction with the included notes, willprovide the reader with an understanding of the City’s financial activities and status.
To provide a basis for making these representations, City management has established a comprehensive internal control framework that is designed to protect the government’s assets from loss, theft, or misuse and to compile sufficiently reliable information for the preparation of the City’s financialstatementsinaccordancewithaccountingprinciplesgenerallyacceptedintheUnitedStates of America (GAAP). Because the cost of internal controls should not outweigh its benefits, the City’s comprehensive framework of internalcontrols hasbeen designed to providereasonable,rather than absolute, assurance that the financial statements will be free from material misstatement.
The City’s books, financial records, and financial statements have been audited by Badawi & Associates, a firm of independent licensed certified public accountants, selected by and reporting to the City Council. The objective of the independent audit is to provide reasonable assurance that the financial statements of the City and related entities are free of material misstatement. The independent auditor concluded, based upon their audit, that there was a reasonable basis for rendering an unmodified “clean” opinion on the City’s basic financial statements as of, and for, the fiscal year ended June 30, 2025, and they are fairly presented in conformity with GAAP. The independent auditor’s report is presented at the beginning of the financial section of this report, on Page 1.
GAAP requires management to provide a narrative introduction, overview, and analysis to accompany the basic financial statements in a section entitled "Management’s Discussion and Analysis" (MD&A). This letter of transmittal is designed to complement the MD&A and should be read in conjunction with it. The City’s MD&A can be found immediately following the report of the
Honorable Mayor, City Council, and Members of the Mountain View Community
December 9, 2025
Page 3 of 14
independentauditors. Thenotes tothefinancialstatementsareprovidedinthefinancialsectionand are considered essential to fair presentation and adequate disclosure.
The ACFR is divided into the following sections:
The Introductory Section includes this letter of transmittal, an overview of the organizational structure of the City, and prior awards received.
The Financial Section includes the following:
•Independent Auditor’s Report.
•Management’s Discussion and Analysis.
•Basic Financial Statements—Includes the government-wide financial statements that present an overview of the City’s entire financial operations and the fund financial statements that present financial information for each of the City’s major funds as well as other governmental, proprietary, and custodial funds.
•Notes to BasicFinancialStatements—The notesprovide additional information that isessential to a full understanding of the data provided in the government-wide and fund financial statements.
•Required Supplementary Information—Includes schedules required to be presented, showing information related to the City’s pension plans and other postemployment benefits plan.
•Other Supplementary Information—Includes the Budgetary Schedule of the Park Land Dedication Capital Projects Fund, Combining Statements and Schedules of the nonmajor governmental funds, internal service funds, and custodial funds.
The Statistical Section includes tables containing historical financial data, debt statistics, and miscellaneous social and economic data of the City that may be of interest to potential investors in the City’s bonds and to other readers. The data includes 10-year revenue and expenditure information as well as 10 years of net position/fund balance information.
This ACFR includes the results of financial activities of the primary government, which encompasses several enterprise activities as well as all of its component units: the Mountain View Shoreline Regional Park Community (Shoreline Community) and the City of Mountain View Capital Improvements Financing Authority (Financing Authority). Separate financial statements for the Shoreline Community are included following the Statistical Section. There is no legal requirement for a separate component unit report for the Financing Authority.
Honorable Mayor, City Council, and Members of the Mountain View Community
December 9, 2025
Page 4 of 14
The City was incorporated on November 7, 1902. The City Charter was originally approved by voters in 1952 and requires the City to operate under a Council-Manager form of government. Seven Councilmembers are elected at-large for four-year terms that are staggered, so three or four seats are filled at the general municipal election in November of every even-numbered year. Continuous service on the City Council is limited to two consecutive terms. Each year, in January, Council elects one of its members as Mayor and another as Vice Mayor.
With a population of approximately 86,513 and occupying just over 12 square miles, Mountain View is situated in Silicon Valley, about 36 miles southeast of the City of San Francisco and 15 miles northwest of the City of San Jose.
The City provides the following full range of municipal services, which are reflected in this report:
•General government (city management, legal, human resources, information technology, and financial activities);
•Public safety (police and fire services);
•Public works (engineering, design, and utility maintenance);
•Communitydevelopment(landuse,developmentreview,inspections,andaffordablehousing); and
•Culture and recreation (library, parks, recreation, performing arts, and golf course).
The City also provides water, wastewater, and solid waste utility enterprise activities, and the financial information regarding these activities is included in this report.
The financial reporting entity includes all funds of the primary government (i.e., the City) as well as its component units. The seven-member City Council serves as the governing body of the Mountain View Shoreline Regional Park Community and the City of Mountain View Capital Improvements Financing Authority, although these agencies are legal entities separate from the City. These two agencies are considered component units of the City and are blended in the reporting entity. However,this does not mean the City assumes theobligations or liabilities ofthese entities, and they are budgeted and accounted for separately from the City.
No other agencies or activities associated with the City, or utilizing a name similar to the City, meet the established criteria for inclusion in the reporting entity and, accordingly, are excluded from this report.
Honorable Mayor, City Council, and Members of the Mountain View Community
December 9, 2025
Page 5 of 14
In accordance with the City Charter, the City Council is required to adopt an annual budget by July 1 of each fiscal year for the ensuing year, which begins on that date. The adopted budget establishes the legal level of budgetary control at the fund and department level, meaning that total appropriations for each fund and department may not be exceeded without City Council authorization.
Transfers and adjustments betweendepartments or funds requireCityCouncil approval. Inaddition, pursuant to the City Charter, any amendment to the adopted budget be approved by at least five votes of the seven-member City Council.
The City is centrally located in Silicon Valley and is serviced by several major freeways (U.S. 101, Interstate 280, State Route 85, and State Route 237) connecting the City to three international airports, shipping, and rail lines in the BayArea. Mountain View is also aregional transportation hub and has transitstops for the Caltraincommuter train and Santa ClaraValley TransportationAuthority (VTA) light rail system.
Despite the strong revenue growth realized in FY 2024–25 compared to the prior fiscal year, this performanceisconsideredanexception,andrevenuegrowthisexpectedtomoderate insubsequent years. Overall, total General Fund revenue increased from $221.1 million in FY 2023–24 to $236.9 million in FY 2024–25, an increase of $15.8 million, or 7.1%. The General Fund’s above-trend growth was primarily driven by higher-than-expected property taxes, the use of money and property (including investment and rental income), and other taxes, such as transient occupancy taxes and utility users’ taxes. Except for these outperforming categories, most General Fund revenues remained relatively stable, and sales tax revenues declined by $3.3 million, or 13.5%, compared to the prior fiscal year. Nearly half of this decline was attributable to the timing and recording of sales tax receipts in the City’s accounting records
ThelocalbusinesscommunitycontinuestoexperiencelingeringeffectsfromtheCOVID-19pandemic. Asbusinessesadaptto hybridandremoteworkforcestrategies,commercialrealestatevacancyrates remain elevated and corporate layoffs persist. According to Colliers, a commercial real estate firm, office vacancy rates in Silicon Valley were estimated at 15.9% between July and September 2025, down slightly from 17.2% a year earlier.
Another indicator of the local economy’s health is the unemployment rate. The unemployment rate in Mountain View in August 2025 was estimated to be 4.1% compared to the prior-year rate of 3.5% for the same month, reflecting a softening in employment in the local region. Unemployment rates in the area are expected to continue rising as corporate layoffs persist.
Honorable Mayor, City Council, and Members of the Mountain View Community
December 9, 2025
Page 6 of 14
MountainViewCalifornia
Despite various financial challenges that have arisen in the past, the City has a history of maintaining prudent fiscal practices and budget discipline that has enabled the City to consistently maintain its AAA credit rating. The rating reflects the City’s sizable property tax base, substantial revenue generated annually from numerous commercial and residential leases in which the City is the lessor, and a positive financial position supported by strong reserve levels and a very modest debt burden.
The economic vitality of the City relies upon a strong and diversified business community that is flexible enough to withstand economic challenges. As part of the City’s economic development efforts, the City works to attract and retain companies with growth potential, making the City a desirable location for the corporate community. As a result, Mountain View continues to be recognized as aprime location in SiliconValley,where it isboth desirable to live and work. Mountain View’s innovation economy is home to major technology companies, including Google, Intuit, LinkedIn, Microsoft, Samsung, Siemens Medical Solutions, and Waymo. Mountain View has also quickly become a hub for autonomous vehicle and drone delivery services. Downtown Mountain View is a key location for businesses, particularly start-up companies, due to its diverse range of retailers, restaurants, and convenient access to public transportation.
The City is also committed to preserving its existing services and programs while investing in the future through prudent budgeting and infrastructure development. During the past decade, the City has experienced a strong economy, which, together with sound fiscal planning, has enabled the City to increase resources where needed and pay down pension liabilities, as well as fully fund its other postemployment benefit obligations. It has also enabled the maintenance of adequate reserves during economic downturns.
Honorable Mayor, City Council, and Members of the Mountain View Community
December 9, 2025
Page 7 of 14
Property tax accounts for 37.9% of total General Fund revenues and is a key indicator of the City’s economic outlook. For reference, property tax revenue accounted for 36.7% of total General Fund revenues in Fiscal Year 2023-24, continuing a trend in which property taxes have become a larger portion of total General Fund revenues. Property tax revenue in the General Fund totaled $89.8 million in Fiscal Year 2024-25 compared to $81.1 million in Fiscal Year 2023-24, an increase of $8.7 million, or 10.7%. Although property tax revenue has experienced significant growth over the past five years, future growth is expected to be modest.
$0.0
FY2019-20FY2020-21FY2021-22FY2022-23FY2023-24FY2024-25 PropertyTaxRevenue-GeneralFund
Source: City of Mountain View ACFR
Honorable Mayor, City Council, and Members of the Mountain View Community
December 9, 2025
Page 8 of 14
The median sales price of single-family residences was $2.5 million for the quarter ended September 30, 2025, down slightly from $2.6 million a year earlier. As shown in the chart below, housing prices have remained relatively stable over the past two years, following a decline from a peak of $2.9 million for the quarter ended March 31, 2022.
$3,000,000
$2,500,000
$2,000,000
$1,500,000
$1,000,000
$500,000
$0
Source: HdL Coren & Cone
Honorable Mayor, City Council, and Members of the Mountain View Community
December 9, 2025
Page 9 of 14
Even with median sales prices hovering above $2.5 million and the average 30-year fixed mortgage rate having peaked at nearly 8% in October 2023 before settling to just above 6% currently, the numberofhomesalesinthelocalhousingmarkethasremainedsteady. Therewere259single-family home sales in Fiscal Year 2024-25, compared to 261 in Fiscal Year 2023-24, a nominal decrease. Source: HdL Coren & Cone
Honorable Mayor, City Council, and Members of the Mountain View Community
December 9, 2025
Page 10 of 14
Use of money and property, which consists primarily of lease revenue and investment earnings, is an importantsourceofGeneralFundrevenue,accountingfor23.2%oftotalGeneralFundrevenues. For reference, this category accounted for 23.3% of total General Fund revenues in Fiscal Year 2023-24, reflecting a stable trend. In Fiscal Year 2024-25, this revenue source generated $55.0 million, an increase of $3.6 million, or 7.0%, compared to Fiscal Year 2023-24. This revenue source is projected to continue growing in Fiscal Year 2025-26 as the City’s investment portfolio benefits from higher interest rates and annual increases in lease agreements take effect.
$60.0
$50.0
$40.0
$30.0
$20.0
$10.0
$0.0
FY2018-19FY2019-20FY2020-21FY2021-22FY2022-23FY2023-24FY2024-25
Source: City of Mountain View ACFR
Honorable Mayor, City Council, and Members of the Mountain View Community
December 9, 2025
Page 11 of 14
Sales tax is another important General Fund revenue source, accounting for 8.9% of total General Fundrevenues. Forcomparison,salestaxrepresented11.1%oftotalGeneralFundrevenues inFiscal Year2023-24,reflectingadecliningtrend. Salestaxrevenuetotaled$21.2millioninFiscalYear 202425, compared to $24.5 million in Fiscal Year 2023-24, a decrease of $3.3 million, or 13.5%. Nearly half of this decline was attributable to the timing and recording of sales tax receipts in the City’s accounting records. Sales tax revenue is projected to increase slightly for Fiscal Year 2025-26, reflecting the anticipated opening of new sales tax-generating businesses during the fiscal year.
$20.0
$15.0
$10.0
$5.0
$0.0
Source: City of Mountain View ACFR
Honorable Mayor, City Council, and Members of the Mountain View Community
December 9, 2025
Page 12 of 14
The City annually prepares a five-year forecast for its General Operating Fund and periodically develops a Long-Range Financial Forecast to project revenue and expenditure trends for the next 10 years. As part of the Fiscal Year 2025-26 Adopted Budget, a Five-Year Financial Forecast (Forecast) was developed for Fiscal Years 2025-26 through 2029-30. Even with fluctuating economic variables, a financial forecast helps identify long-term financial trends, potential fiscal imbalances, emerging challenges, opportunities, and future requirements – information that supports the City’s ongoing commitment to fiscal sustainability. While accurately forecasting revenues is challenging due to the variable nature of the City’s revenue sources and their sensitivity to regional, state, national, and global economic conditions, it is possible to identify reasonable financial trends and develop a conceptual financial outlook to support informed decision-making. The Forecast provides a valuable tool to guide the City as it continues to balance expenditures with available revenues.
The General Fund Forecast projects a nominal positive ending operating balance of approximately $0.7 million for Fiscal Year 2025-26. However, modest operating deficits are projected in the subsequent fiscal years. Should these deficits materialize, maintaining adequate operating and emergency reserves will be critical to helping the City navigate the period and withstand potential future economic downturns.
$1.0
$0.0
($1.0)
($2.0)
($3.0)
($4.0)
FY2025-26FY2026-27FY2027-28FY2028-29FY2029-30
In summary, local economic indicators suggest a flattening of revenues, with slower growth anticipated in Fiscal Year 2025-26, following several years of strong performance. Ongoing uncertainty related to inflation, interest rates, national and state economic policies, and geopolitical conditions contributestothis morecautious outlook. Incontrast,expendituresare expectedto grow at a faster pace than revenues for the foreseeable future, driven largely by rising operational costs.
Honorable Mayor, City Council, and Members of the Mountain View Community
December 9, 2025
Page 13 of 14
The City Council has established a financial and budgetary policy framework which is reviewed and updated as necessary by the City Council. A comprehensive and consistent set of financial and budgetary policies provides a basis for sound financial planning, identifies appropriate directions for service-level developments, aids budgetary decision-making, and serves as an overall framework to guide financial management and operations of the City.
The City’s adoption of financial policies also promotes public confidence and increases the City’s credibility in the eyes of bond-rating agencies and potential investors. Such policies also provide the resources to react to potential financial emergencies in a prudent manner.
Article XIIIB of the California State Constitution, which became effective in Fiscal Year 1979-80, and which was modified (by Proposition 111) in November 1989, establishes, by formula, an appropriation limit for governmental agencies. Using the appropriations of Fiscal Year 1978-79 as the base year, the limit is adjusted for the growth in inflation and population during each subsequent fiscal year. Inflation is measured as the year-over-year growth in per-capita personal income,while population growth is based on aweighted growthmeasure that blends growth in the civilian population with growth in K-12 and community college average daily attendance. Article XIIIB also sets the guidelines as to what is to be included in the appropriation limits.
The City’s appropriation limit for Fiscal Year 2024-25 was $378,697,009; the City’s actual appropriations, subject to the limit, were $138,771,739, which is far below the limit. The Fiscal Year 2024-25 appropriation limit increased from $356,727,282 in Fiscal Year 2023-24 due primarily to the increase of 3.62% in California’s per-capita personal income over the prior year, one of the factors used in calculating the change in the appropriation limit.
Honorable Mayor, City Council, and Members of the Mountain View Community
December 9, 2025
Page 14 of 14
The Government Finance Officers Association (GFOA) awarded a Certificate of Achievement for Excellence in Financial Reporting to the City for its Annual Comprehensive Financial Report for the fiscal year ended June 30, 2024. This was the 35th consecutive year the City has received this prestigious award. In order to be awarded a Certificate of Achievement, the City had to publish an easily readable and efficiently organized ACFR that satisfied both GAAP and applicable legal requirements. The GFOA award is valid for a one-year period only. I believe our current ACFR continues tomeetthe program’srequirements,andwearesubmitting it to theGFOA to determine its eligibility for another certificate.
In addition, the City also received the GFOA’s Distinguished Budget Presentation Award for the City’s annual budget document for Fiscal Year 2024-25. In order to qualify for this Distinguished Budget Presentation Award, the government’s budget document had to be judged proficient as a policy document, a financial plan, an operations guide, and a communication device.
Special recognition is extended to Arn Andrews, Assistant City Manager; Derek Rampone, Finance and Administrative Services Director; Grace Zheng, Assistant Finance and Administrative Services Director; and the entire staff of the Finance and Administrative Services Department for their dedication to all City departments, residents, and customers on a daily basis. The preparation of this report could not have been achieved without the skillful, dedicated, and efficient services of the entire staff of the Finance and Administrative Services Department. In particular, Helen He, Accounting Manager; Janet Shum, Senior Accountant; and Marichi Valle, Accountant, were instrumental in preparing the ACFR accurately and in a timely manner. Every member of the department deserves recognition and thanks for their commitment to the City and their profession. I would also like to thank the members of the City Council and Council Finance Committee for their leadershipandpolicyguidanceinmanagingthefinancialoperationsoftheCityinafiscallyresponsible manner that continues to serve in the best interests of the residents of the City.
Respectfully submitted,

Kimbra McCarthy City Manager

Ellen Kamei Mayor
Emily Ann Ramos Vice Mayor
Chris Clark
Alison Hicks
John McAlister
Lucas Ramirez
Patricia Showalter
Councilmember
Councilmember
Councilmember
Councilmember
Councilmember
Kimbra McCarthy City Manager
Jennifer Logue City Attorney
Heather Glaser City Clerk
Audrey Seymour Ramberg
Arn Andrews
Assistant City Manager
Assistant City Manager
Lenka Wright Chief Communications Officer
Danielle Lee Chief Sustainability and Resiliency Officer
Christian Murdock Community Development Director
Roger Jensen CIO/Information Technology Director
John Marchant Community Services Director
Kimberly Thomas Deputy City Manager
Derek Rampone Finance and Administrative Services Director
Juan Diaz Fire Chief
Wayne Chen Housing Director
Maxine Gullo Human Resources Director
Tracy Gray Library Director
Michael Canfield Police Chief
Jennifer Ng Public Works Director
City Manager’s Office
Mountain View Residents
Mountain View City Council
CityManager CityClerk CityAttorney
Development
City Boards, Commissions & Committees
Environmental Planning Commission
Board of Library Trustees
Parks and Recreation Commission
Rental Housing Committee
Bicycle/Pedestrian Advisory Committee
Downtown Committee
Human
Performing Arts Committee


This page intentionally left blank


To the Honorable Mayor and Members of the City Council of the City of Mountain View Mountain View, California
Opinions
We have audited the financial statements of the governmental activities, the business-type activities, each major fund, and the aggregate remaining fund information of the City of Mountain View (City), as of and for the year ended June 30, 2025, and the related notes to the financial statements, which collectively comprise City’s basic financial statements as listed in the table of contents.
In our opinion, the accompanying financial statements present fairly, in all material respects, the respective financial position of the governmental activities, the business-type activities, each major fund, and the aggregate remaining fund information of the City, as of June 30, 2025, and the respective changes in financial position and, where applicable, cash flows thereof and the respective budgetary comparison for the General Fund, Shoreline Regional Park Community Fund, and the Housing Fund, for the year then ended in accordance with accounting principles generallyaccepted in theUnited States of America.
We conducted our audit in accordance with auditing standards generally accepted in the United States of America (GAAS) and the standards applicable to financial audits contained in Government Auditing Standards, issued by the Comptroller General of the United States. Our responsibilities under those standards are further described in the Auditor’s Responsibilities for the Audit of the Financial Statements section of our report. We are required to be independent of the City and to meet our other ethical responsibilities, in accordance with the relevant ethical requirements relating to our audit. We believe that the audit evidence we have obtained issufficientand appropriate to provide a basis for our audit opinions.
Management is responsible for the preparation and fair presentation of the financial statements in accordance with accounting principles generally accepted in the United States of America, and for the design, implementation, and maintenance of internal control relevant to the preparation and fair presentation of financial statements that are free from material misstatement, whether due to fraud or error.

In preparing the financial statements, management is required to evaluate whether there are conditions or events, considered in the aggregate, that raise substantial doubt about the City’s ability to continue as a going concern for twelve months beyond the financial statement date, including any currently known information that may raise substantial doubt shortly thereafter.

To the Honorable Mayor and Members
of the City Council of the City of Mountain View
Mountain View, California
Page 2
Our objectives are to obtain reasonable assurance about whether the financial statements as a whole are free from material misstatement, whether due to fraud or error, and to issue an auditor’s report that includes our opinions. Reasonable assurance is a high level of assurance but is not absolute assurance and therefore is not a guarantee that an audit conducted in accordance with GAAS will always detect a material misstatement when it exists. The risk of not detecting a material misstatement resulting from fraud is higher than for one resulting from error, as fraud may involve collusion, forgery, intentional omissions, misrepresentations, or the override of internal control. Misstatements are considered material if there is a substantial likelihood that, individually or in the aggregate, they would influence the judgment made by a reasonable user based on the financial statements.
In performing an audit in accordance with GAAS, we:
Exerciseprofessional judgment and maintain professional skepticism throughout the audit.
Identify and assess the risks of material misstatement of the financial statements, whether due to fraud or error, and design and perform audit procedures responsive to those risks. Such procedures include examining, on a test basis, evidence regarding the amounts and disclosures in the financial statements.
Obtain an understandingof internal control relevant to the audit in order to design audit procedures that are appropriate in the circumstances, but not for the purpose of expressing an opinion on the effectiveness of the City’s internal control. Accordingly, no such opinion is expressed.
Evaluate the appropriateness of accounting policies used and the reasonableness of significant accounting estimates made by management, as well as evaluate the overall presentation of the financial statements.
Conclude whether, in our judgment, there are conditions or events, considered in the aggregate, that raise substantial doubt about the City’s ability to continue as a going concern for a reasonable period of time.
We are required to communicate with those charged with governance regarding, among other matters, the planned scope and timing of the audit, significant audit findings, and certain internal control–related matters that we identified during the audit.
To the Honorable Mayor and Members of the City Council of the City of Mountain View
Mountain View, California
Page 3
Accounting principles generally accepted in the United States of America require that the management’s discussion and analysis, and the required pension and OPEB information schedules, be presented to supplement the basic financial statements. Such information is the responsibility of management and, although not a part of the basic financial statements, is required by the Governmental Accounting Standards Board who considers it to be an essential part of financial reporting for placing the basicfinancial statements in an appropriate operational, economic, or historical context. We have applied certain limited procedures to the required supplementary information in accordance with auditing standards generally accepted in the United States of America, which consisted of inquiries of management about the methods of preparing the information and comparing the information for consistency with management’s responses to our inquiries, the basic financial statements, and other knowledge we obtained during our audit of the basic financial statements. We do not express an opinion or provide any assurance on the information because the limited procedures do not provide us with sufficient evidence to express an opinion or provide any assurance.
Our audit was conducted for the purpose of forming opinions on the financial statements that collectively comprise the City’s basic financial statements. The individual and combining fund financial statements and schedules are presented for purposes of additional analysis and are not a required part of the basicfinancial statements.
The individual and combining fund financial statements and schedules are the responsibility of management and were derived from and relates directly to the underlying accounting and other records used to prepare the basic financial statements. Such information has been subjected to the auditing procedures applied in the audit of the basic financial statements and certain additional procedures, including comparing and reconciling such information directly to the underlying accounting and other records used to prepare the basic financial statements or to the basic financial statements themselves, and other additional procedures in accordance with auditing standards generally accepted in the United States of America. In our opinion, the individual and combiningfund financial statements and schedules are fairly stated, in all material respects, in relation to thebasic financial statements as a whole.
Management is responsible for the other information annual financial report. The other information comprises the introductory section, statistical section, and component unit financial statements section but does not include the basic financial statements and our auditor's report thereon. Our opinions on the basic financial statements do not cover the other information, and we do not express an opinion or any form of assurance thereon. In connection with our audit of the basic financial statements, our responsibility is to read the other information and consider whether a material inconsistency exists between the other information and the basic financial statements, or the other information otherwise appears to be materially misstated. If, based on the work performed, we conclude that an uncorrected material misstatement of the other information exists,we are required to describe it in our report.
To the Honorable Mayor and Members of the City Council of the City of Mountain View
Mountain View, California
Page 4
In accordance with Government Auditing Standards, we have also issued our report dated December 9, 2025 on our consideration of the City’s internal control over financial reportingand on our tests of its compliance with certain provisions of laws, regulations, contracts, and grant agreements and other matters. The purpose of that report is solely to describe the scope of our testing of internal control over financial reporting and compliance and the results of that testing, and not to provide an opinion on the effectiveness of internal control over financial reporting or on compliance. That report is an integral part of an audit performed in accordance with Government Auditing Standards in considering the City’s internal control over financial reporting and compliance.

Badawi & Associates, CPAs
Emeryville, California
December 9, 2025
Management’s Discussion and Analysis (MD&A) (Unaudited)
For the Fiscal Year Ended June 30, 2025
This section of the Cityof Mountain View’s (City) Annual Comprehensive Financial Report (ACFR) presents a narrative overview and analysis of the financial activities of the City for the fiscal year ended June 30, 2025. We encourage readers to review this information in conjunction with the Letter of Transmittal and the Basic Financial Statements. It is important to recognize that the financial statements reflect past results, whereas the City’s operating budget focuses on future goals and the allocation of resources.
Key financial highlights for the fiscal year are outlined below. Details can be found in the Government-WideFinancialAnalysisandtheFinancialAnalysisoftheCity’sFundssectionsofthis MD&A.
• The assets and deferred outflows of resources of the City exceeded its liabilities and deferred inflows of resources at the close of the fiscal year ended June 30, 2025 by $1.7 billion (net position). Of this amount, $248.6 million represents unrestricted net position, which may be used to meet the City’s ongoing obligations.
• Total net position increased by $96.7 million, compared to an increase of $98.8 million in the prior fiscal year - a decrease of 2.2%. Of this year’s increase, $79.2 million was attributable to governmental activities and $17.5 million to business-type activities. The beginning net position was restated downward by $5.1 million due to the implementation of Governmental Accounting Standards Board (GASB) Statement No. 101. Citywide revenues increased by $22.7 million, while expenses increased by $19.8 million.
• Total outstanding long-term debt increased by $7.2 million in the current fiscal year. The increase was driven primarily by a $5.5 million increase in compensated absences associated with the implementation of GASB 101 and a $4.6 million increase in Subscription-based Information Technology Arrangement (SBITA) liabilities related to new Axon camera storage and Arctic Wolf security software agreements. These increases were partially offset by scheduled debt service payments.
• Net pension liabilities decreased by $14.6 million,compared to an increase of $12.9 million in the prior fiscal year. This reduction was primarily driven by strong investment returns during the reporting period and contributions that exceeded the plans’ annual costs and expenses. Net other post-employment benefit (OPEB) liabilities decreased by $1.9 million during the fiscal year. This decrease was driven by positive investment earnings and contributions to the plan that exceeded the plan’s annual costs and expenses.
• Governmental funds reported total fund balances of $1.1 billion, an increase of $60.9 million, or 5.9% from the prior fiscal year. The increase was driven primarily by the General Fund ($27.2 million) and the Shoreline Regional Park Community (SRPC) Fund ($20.3 million), where revenues exceeded expenditures during the fiscal year.
• The General Fund ended the fiscal year with a total fund balance of $265.8 million, an increaseof$27.2million,or11.4%fromthepriorfiscalyear. Ofthisamount,$162.1million, or 61.0%, is unassigned and available to support the City’s current and future needs. The unassigned fund balanceis designated for futureone-time expenditures, payments toward unfunded liabilities, and emergency reserves, and represents 78.8% of total General Fund expendituresforthefiscalyearendedJune30,2025–upfrom70.6%inthepriorfiscalyear.
This Discussion and Analysis is intended to provide an overview of the City’s basic financial statements. The City’s basic financial statements include three key components: (1) government-wide financial statements; (2) fund financial statements; and (3) notes to the basic financial statements. This report also includes required supplementary information and other supplementary schedules that provide additional context and detail beyond the basic financial statements .
The government-wide financial statements are designed to provide readers with a comprehensiveoverviewoftheCity’sfinances,presentedinamannersimilartothatofaprivatesector business.
The Statement of Net Position presents information on all of the City’s assets, deferred outflows of resources, liabilities, and deferred inflows of resources, with the difference between them reported as net position. Over time, increases or decreases in net position may serve as a useful indicator of whether the overall financial position of the City is improving or deteriorating.
The Statement of Activities presents information showing how the City’s net position changed during the most recent fiscal year. All changes in net position are reported as soon as the underlying event giving rise to the change occurs, regardless of the timing of related cash flows. Thus,revenues and expenses are reported inthisstatementfor certain items thatwillonlyresult in cash flows in future fiscal periods, such as revenues related to uncollected taxes and expenses pertaining to earned, but unused, vacation and sick leave.
Both of the government-wide financial statements distinguish between the functions of the City thatareprincipallysupportedbytaxesandintergovernmentalrevenues(governmentalactivities) and other functionsthat are intendedto recoverall or a significant portion oftheir coststhrough user fees and charges (business-type activities). Governmental activities include general government, public safety, public works, community development, and culture and recreation
services. Business-type activities consist of the City’s water, wastewater, and solid waste enterprise operations (enterprise funds).
The government-wide financial statements include not only the City itself (known as the primary government) but also two legally separate entities for which the City is financially accountable: (1) Mountain View Shoreline Regional Park Community (Shoreline Community or SRPC); and (2) City of Mountain View Capital Improvements Financing Authority (Financing Authority). Although legally separate from the City, these component units are blended with the primary government because they have the same governing board as the City and because of their financial relationship with the City. In addition, separate financial statements for the Shoreline Community component unit are included within the City’s ACFR.
The fund financial statements are designed to report information about groupings of related accounts, which are used to maintain control over resources that have been segregated for specific activities or objectives. The City, like other State and local governments, uses fund accounting to ensure and demonstrate compliance with finance-related legal requirements. All of the funds of the City can be divided into the following three categories: governmental funds, proprietary funds, and fiduciary funds.
Governmental funds are used to account for essentially the same functions reported as governmental activities in the government-wide financial statements. However, unlike the government-wide financial statements, governmental fund financial statements focus on nearterm inflows and outflows of spendable resources as well as on balances of spendable resources available at the end of the fiscal year. Such information may be useful in determining what financial resources are available in the near future to finance the City’s programs.
Becausethefocusofgovernmentalfundsisnarrowerthanthatofthegovernment-widefinancial statements, it is useful to compare the information presented for governmental funds with similar information presented for governmental activities in the government-wide financial statements. By doing so, readers may better understand the long-term impact of the government’s near-term financing decisions. Both the governmental funds Balance Sheet and the governmental funds Statement of Revenues, Expenditures, and Changes in Fund Balances provide a reconciliation to facilitate this comparison between governmental funds and governmental activities.
The City maintains several individual governmental funds organized according to their type (special revenue, debt service, and capital projects funds). Information is presented separately in thegovernmentalfunds BalanceSheet and inthe governmentalfundsStatement ofRevenues, Expenditures, and Changes in Fund Balances for the General Fund, Shoreline Regional Park CommunityFund,HousingFund, GeneralCapitalProjectsFund, andParkLandDedication Capital Projects Fund, all of which are considered to be major funds. Data from the remaining governmental funds are combined into a single, aggregated presentation. Individual fund data
foreachof these nonmajor governmentalfundsisprovided in the form of combining statements elsewhere in this report.
The City adopts an annual appropriated budget for most of its funds, with the exception of the General Capital Projects Fund, which is budgeted on a project basis. Budgetary comparison statements and schedules are provided for these funds to demonstrate compliance with the adopted and amended budgets.
Proprietary funds are used to account for activities in which the City charges fees to customerswhetherexternalusersorinternaldepartments- forthe servicesprovided. Thesefundspresent financial information similar to that found in the government-wide financial statements, but in greater detail. The City maintains two types of proprietary funds.
Enterprise funds are used to report the same functions presented as business-type activities in the government-wide financial statements. The City uses enterprise funds to accountfor itswater,wastewater,and solidwasteoperations,allofwhichareconsidered to be major funds of the City.
Internal service funds are used to accumulate and allocate costs internally among the City’s various functions. The City uses internal service fundsto account for its equipment maintenance and replacement, Retirees’ Health Plan, Employee Benefits Plan, and various other self-insurance liability programs. Because these services predominantly benefit governmental rather than business-type functions, they have been included withingovernmentalactivitiesinthegovernment-widefinancialstatements. Theinternal service funds are combined into a single, aggregated presentation in the proprietary funds financial statements. Individual fund data for the internal service funds is provided in the form of combining statements elsewhere in this report.
Fiduciary funds are used to account for fiduciary activities and resources held for the benefit of individuals, organizations, or other governments that are not part of the City. These are comprised of custodial funds, which are not required to be reported in pension (and other employeebenefit)trustfunds,investmenttrustfunds,orprivate-purposetrustfundsandinclude custodial balances and activities of the City’s labor unions and Center for Performing Arts. Since the resources of these funds are not available to support the City’s own programs, they are not reflected in the government-wide financial statements.
Notes to the Basic Financial Statements
Thenotesprovideadditionalinformationessentialtoacomprehensiveunderstandingofthedata presented in the government-wide and fund financial statements.
Required Supplementary Information includes schedules required to be presented showing information related to the City’s pension plans and other post-employment benefits plan.
Other Supplementary Information includes the combining statements and schedules of the nonmajor governmental funds, internal service funds, and custodial funds.
Analysis of Net Position
A condensed summary of the City’s net position for governmental and business-type activities is as follows:
CondensedStatementofNetPosition (DollarsinThousands) Total GovernmentalActivitiesBusiness-TypeActivities
248,621229,305 $1,447,412$1,368,186$264,622$247,167$1,712,034$1,615,353
Approximately42.3%oftheCity’snetposition,or$724.3 million,reflectsitsinvestmentincapital assets (e.g., land, buildings, other improvements, etc.) less any related outstanding debt used to acquire or construct those assets. These capital assets are used to provide services to the communityand arenotavailablefor futurespending. AlthoughtheCity’sinvestment isreported
net of related debt, the resources required to repay that debt must come from other funding sources, as the capital assets themselves cannot be liquidated to satisfy these obligations.
The largest portion of the City’s net position, 43.2% or $739.1 million, consists of resources that are subject to external restrictions. Restricted net position is limited in use for specific purposes, includingcapitalprojects,debtservice,Low-and-moderate-incomehousingprograms,andstreet and road improvements.
The remaining 14.5% of the City’s net position, or $248.6 million, represents unrestricted net position, which may be used to meet the City’s ongoing operational and financial obligations.
The City’s total assets increased by $62.9 million compared to the prior fiscal year. This increase includes a $42.3 million increase in capital assets and a $20.6 million increase in current and other assets. This growth is primarily attributable to a $45.1 million increase in cash and investments and a $3.1 million increase in loans receivable, partially offset by a $27.7 million decrease in leases receivable.
The City’s total liabilities decreased by $37.4 million from the prior fiscal year. Current liabilities declined by $26.6 million, largelydueto the reclassification of aportion ofunearned revenuesto deferred inflow of resources related to leases. Non-current liabilities decreased by $10.8 million, driven primarily by a $14.6 million reduction in the net pension liability. This decrease was partially offset by an increase of $5.5 million in Compensated Absences, largely attributed to the implementation of GASB 101.
The changes in net position for governmental and business-type activities are as follows:
CondensedStatementofActivities (DollarsinThousands)
386,565366,808
101,79898,822
$1,447,4121,368,186 $ 264,622$247,167$ 1,712,034$ $1,615,353 Total
Program revenues, such as charges for services, operating grants and contributions, and capital grantsandcontributions,aregeneratedby,orrestrictedforusein,therelatedactivities. General revenues consist primarily of taxes and other revenues that are not specifically tied to individual activities. All tax revenues and investment earnings are classified as general revenues.
The following charts provide a graphical comparison of governmental revenues by source for Fiscal Years 2024-25 and 2023-24:

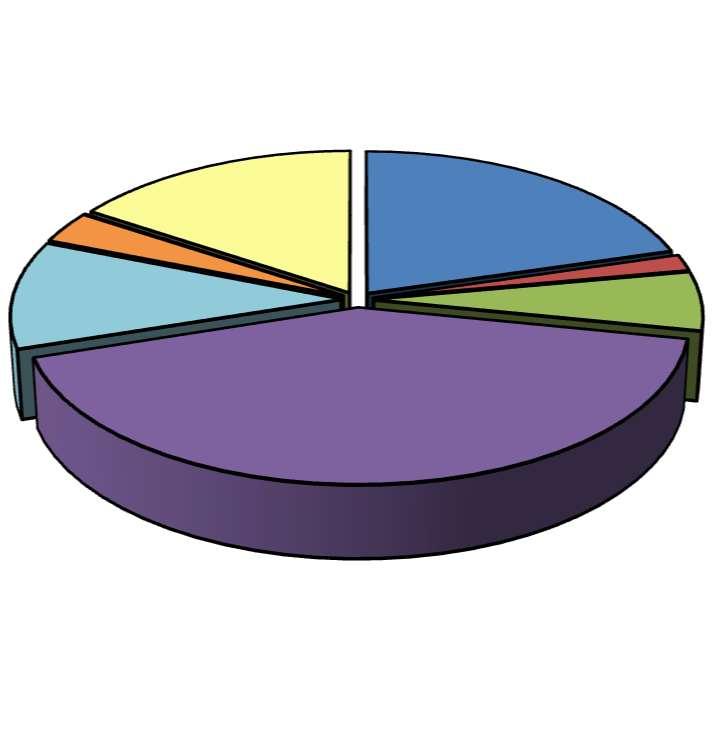
Total Governmental Revenues increased to $382.1 million, a $15.7 million increase compared to the prior fiscal year.
Revenue Highlights:
• Chargesforservices($70.3million),propertytaxes($164.3million),andinvestmentincome ($71.0 million) were the three largest revenue sources for governmental activities. Combined, these totaled $305.6 million, or 80.0% of total revenues.
• Property taxes increased by $10.7 million over the prior fiscal year, reflecting continued strong growth in assessed values across both residential and commercial real estate.
• Investment incomeincreasedby$13.4million,primarily duetounrealizedgainsandhigher interest earnings resulting from sustained elevated interest rates during the fiscal year.
• Capital grants and contributions decreased by $8.8 million, primarily because several significant one-time grants were received in Fiscal Year 2023-24. These included a $2.3 million Measure B reimbursement from VTA for the El Camino Real Bike and Pedestrian Improvement Project (CIP 22-29), a $1.7 million Santa Clara County grant for the Magical Bridge Playground Project (CIP 18-36), and a $2.3 million CDBG grant for the Crestview Hotel project. Comparable levels of grant funding were not received in the current fiscal year.
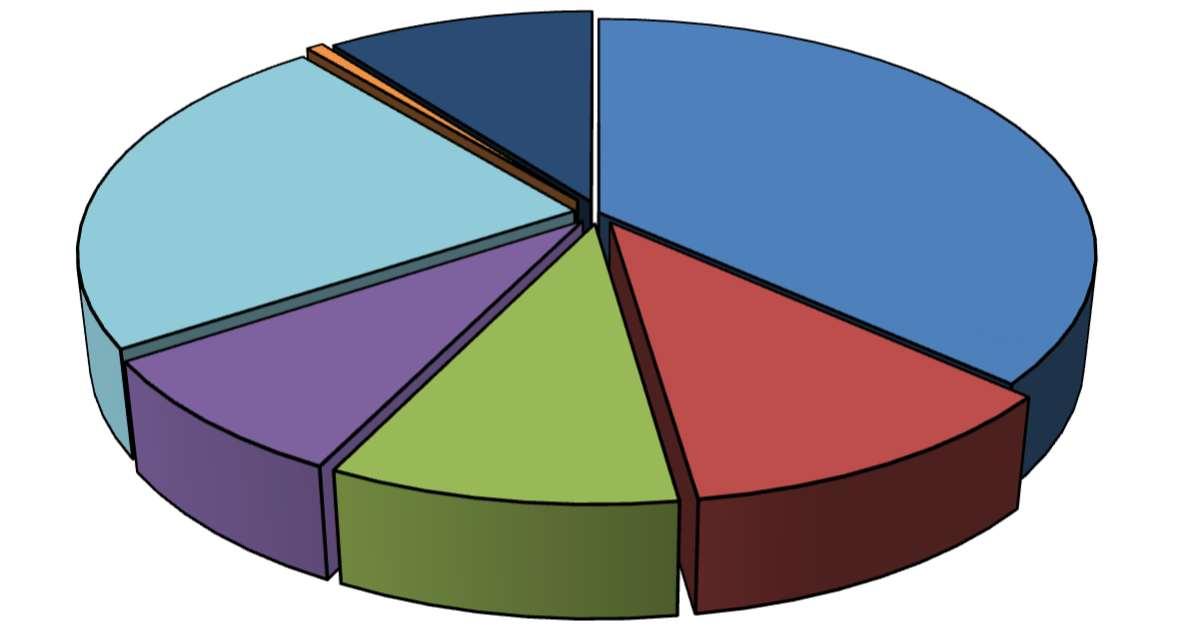
The following charts provide a graphical comparison of the City’s governmental expenses by function for Fiscal Years 2024-25 and 2023-24. Please note that these expenses do not include capitaloutlays,as such amounts are capitalizedand addedto the City’s capitalassetsratherthan reported as current period expenses.
FiscalYear2024-25 GovernmentalActivities
Expense Highlights
Totalexpenses increased to $295.8 million in the currentfiscal year, an increase of $16.1 million, or 5.7%, compared to the prior fiscal year. The increase is driven primarily by higher salaries and benefits, including pension and OPEB expenses, resulting from adjustments required under
GASB Statement No. 68 and No. 75. Salaries and benefit costs also rose due to an increase in Council-approved authorized positions, cost-of-living adjustments, and higher benefit costs.
Business-typeactivitiesincreasedtheCity’snetpositionby$17.5 millioncomparedtoanincrease of $13.6 million from the prior fiscal year. The significant key factors are as follows:
• Water net position increased by $6.9 million, primarily due to net operating income of $4.1 million and investment income of $2.3 million.
• Wastewater net position increased by $9.5 million, primarily due to net operating income of $6.0 million, investment income of $2.3 million, and transfers in of $1.1 million.
• Solid waste net position increased by $1.5 million, primarily due to investment income of $1.1 million.
As noted earlier, the City uses fund accounting to ensure and demonstrate compliance with finance-related legal requirements.
Governmental Funds—ThefocusoftheCity’sgovernmentalfundsistoreportnear-terminflows, outflows,andbalancesofresourcesavailablefor spending. Thisinformationisparticularlyuseful in assessing the City’s short-term financing needs and fiscal capacity. In particular, unassigned fund balance serves as an important indicator of the resources the City has available for discretionary spending at the end of the fiscal year. The City’s governmental fund types include the General Fund, Special Revenue Funds, Debt Service Funds, and Capital Projects Funds.
As of June 30, 2025, the City’s governmental funds reported combined ending fund balances of $1.1 billion, an increase of $60.9 million compared to the prior fiscal year. The most significant contributors to this change include increases of:
$27.2 million in the General Fund
$20.3 million in the Shoreline Regional Park Community Fund
$6.8 million in the Housing Fund
$9.6 million in the General Capital Project fund
These increases were partially offset by a $3.7 million decrease in the Park Land Dedication Capital Project Fund.
Total fund balance includes an unassigned fund balance of $162.1 million, which is available for spending at the City’s discretion. The remaining fund balance consists of nonspendable ($6.7 million),restricted($811.6 million),committed ($113.0 million),andassigned($4.9 million) amounts, none of which are available for new discretionary spending purposes.
Duringthefiscalyear,totalgovernmentalfundrevenueswere$379.5 million,whileexpenditures were $320.3 million, resulting in revenues exceeding expenditures by $59.2.
The General Fund is used to account for all revenues and expenditures necessary to support the City’s basic governmental activities that are not required to be reported in other funds.
At June 30, 2025, the General Fund’s unassigned fund balance was $162.1 million, an increase of $28.8 million from the prior fiscal year.
AsameasureoftheGeneralFund’sliquidity,itisusefultocomparebothunassignedfundbalance andtotalfundbalancetototalfundexpenditures. Theunassignedfundbalanceof$162.1 million represents 61.0% of total fund balance and 78.8% of General Fund expenditures of $205.9 Million. Total fund balance represents 129.1% of expenditures for the same period, demonstrating a strong liquidity position.
The fund balance of the City’s General Fund increased by $27.2 million during the current fiscal year. Total General Fund revenues increased to $236.9 million, an increase of $15.8 million over the prior fiscal year. The growth was primarily driven by an $8.6 million increase in property tax revenues and an $8.2 million increase in other taxes, partially offset by a $3.3 million decline in sales tax revenues.
The increase inpropertytax revenuesreflects continued strong growth in assessed valuesacross both secured and unsecured rolls in the residential and commercial real estate markets. The increase in other taxes was largely attributable to a $2.6 million rise in transient occupancy tax (TOT), a $3.4 million increase in utility user tax, and a $2.0 million increase in property conveyance tax. Additionally, the passage of a new property transfer tax tier in the November 2024 election and the reclassification of property conveyance tax from the Conveyance and Construction Tax Special Revenue Fund to the General Fund contributed to the overall increase in General Fund revenues.
Conversely, sales tax revenues declined due to several factors, including adjustments related to the timing and recording of sales tax receipts in the City’s accounting records, the relocation of Synopsys outside the City, multiple retail store closures, and reduced consumer spending— excluding restaurants and hotels, which continued to perform well.
General Fund expenditures increased by $16.9 million compared to the prior fiscal year, driven primarilybyan$11.6millionincreaseinsalariesandbenefitsanda$4.2millionincreaseincapital outlay. Theriseinsalaries andbenefits reflectspositionsadded inFiscalYear 2024-25, meritand market salary adjustments, and higher pension contributions.
The increase in capital outlay is primarily related to SBITA assets associated with Axon’s camera data storage software and Arctic Wolf security software. It is important to note that the
recognition of capital outlay for a SBITA does not indicate that the full cost is paid upfront. Instead, the subscription costs are paid over time; however, GASB Statement No. 96 require the City to record the full value of the subscription as both an asset and a liability in the year the agreement is executed.
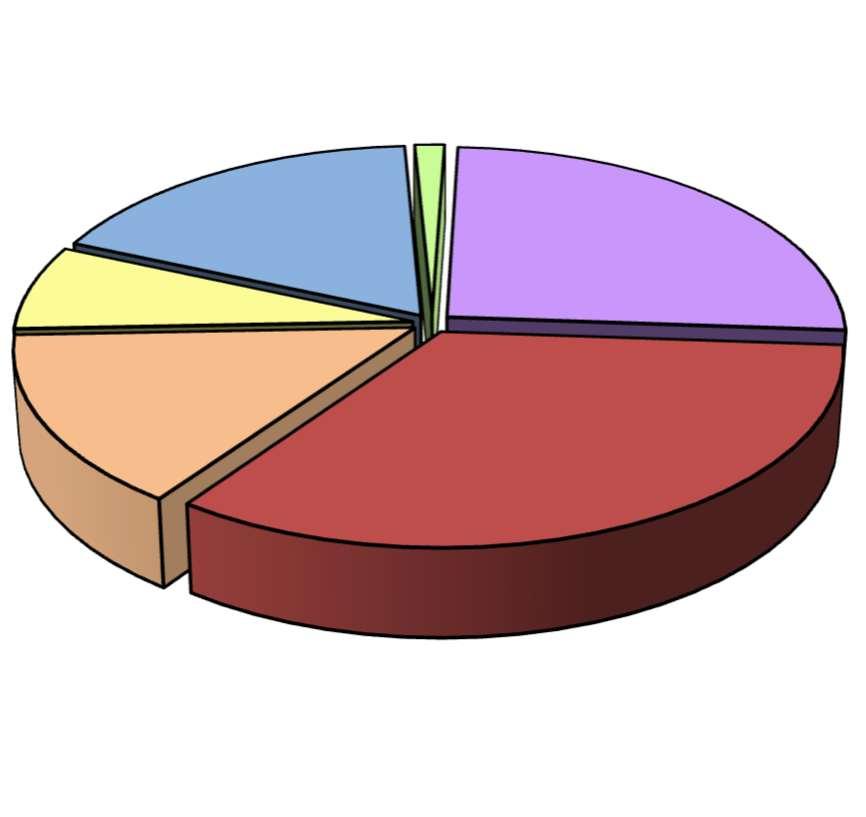
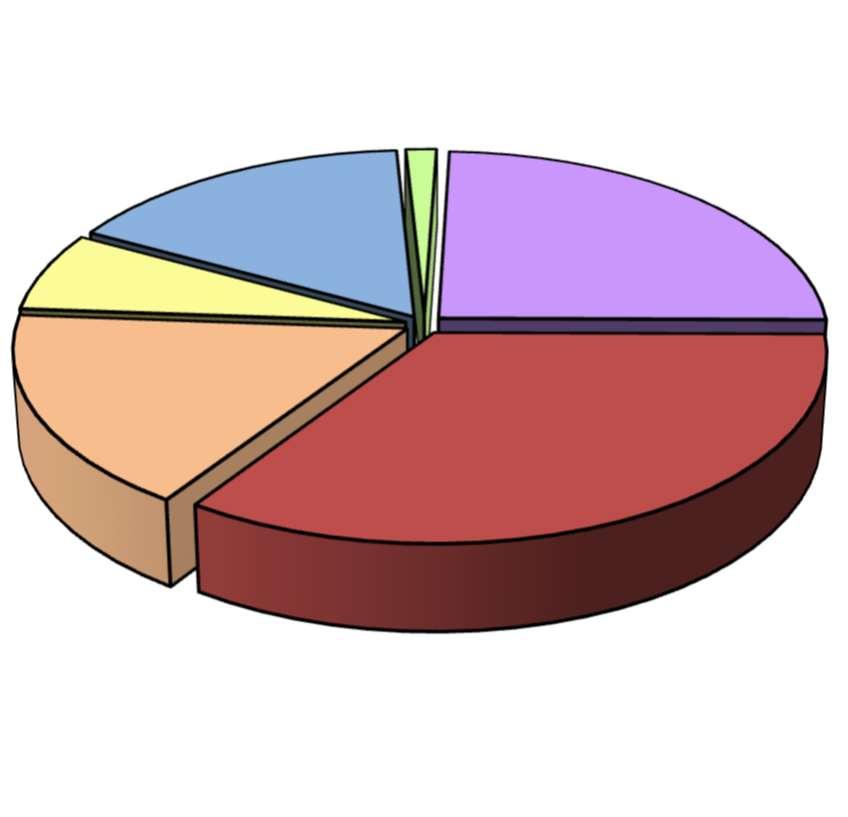
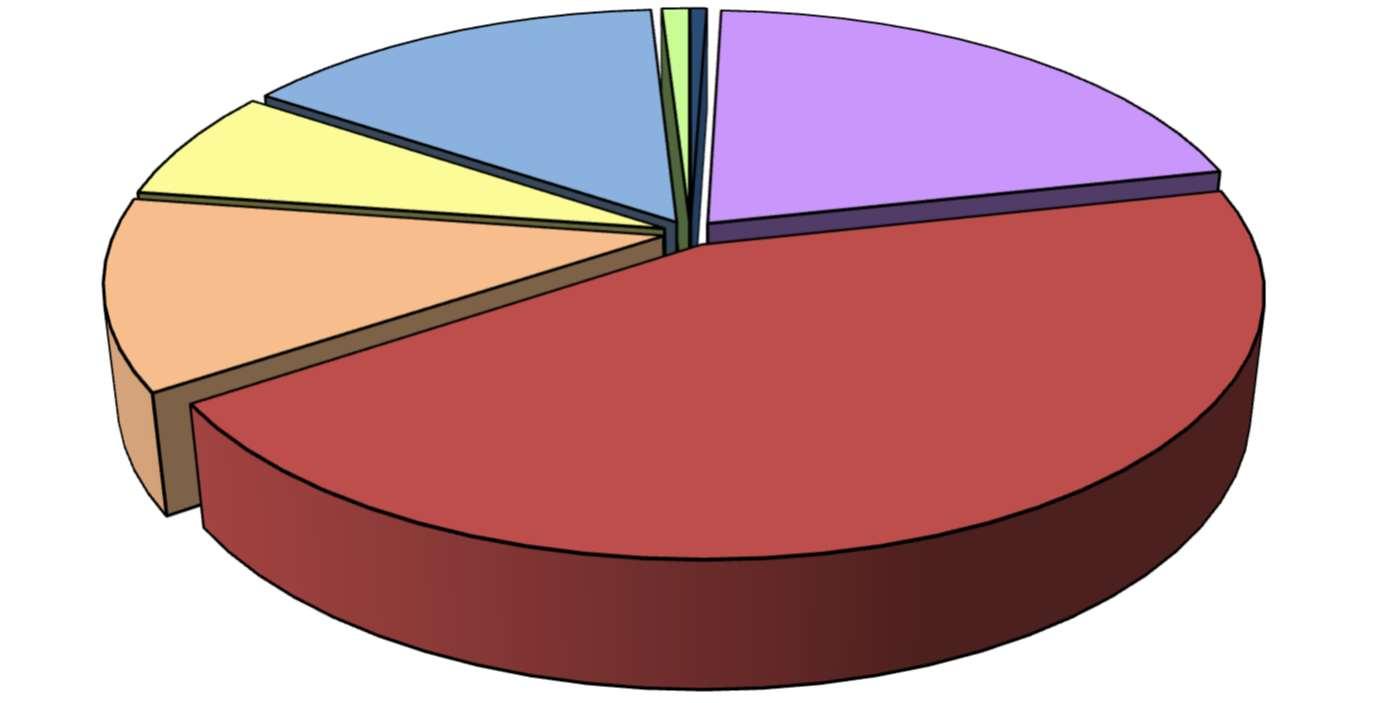
The following charts provide a graphical comparison of General Fund revenues by source and expenditures by function for the fiscal years ended June 30, 2025 and 2024:
FiscalYarear2024-25GeneralFund

FiscalYear2023-24GeneralFund
FiscalYear2024-25GeneralFund ExpensesbyType
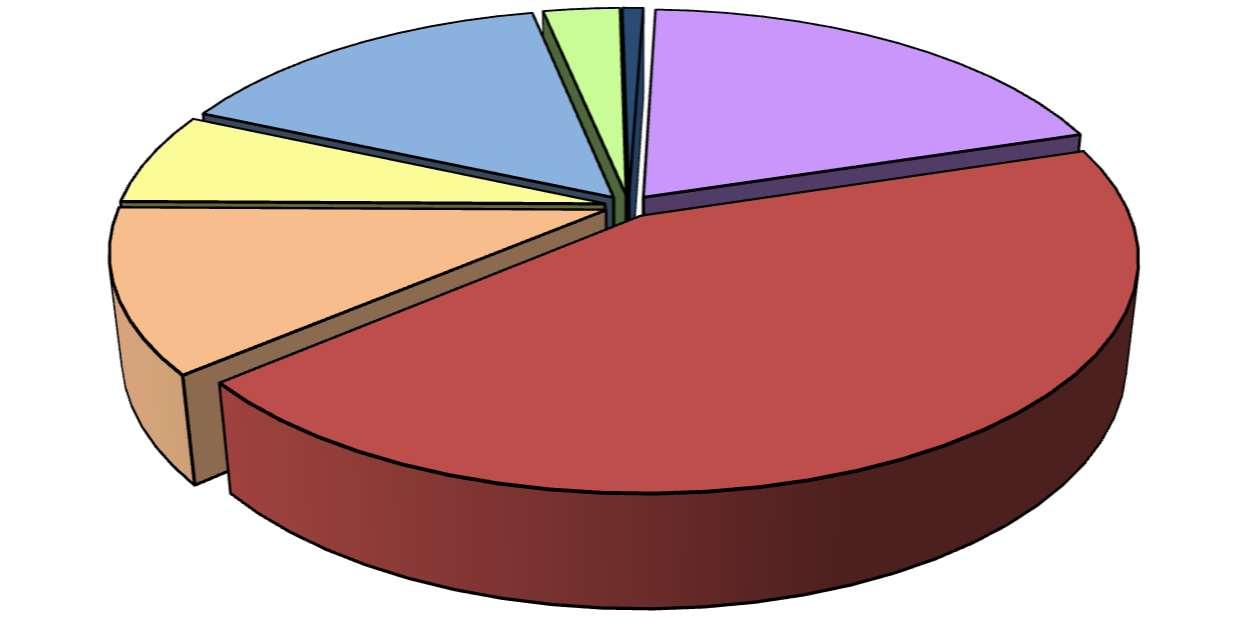
FiscalYear2023-24GeneralFund
The Shoreline Regional Park Community Fund receives property tax revenues generated from properties located within the Shoreline Community. The fund accounts for all revenues and expenditures associatedwithactivitiesand improvementswithintheShoreline Communityarea.
Revenuestotaled$82.4 millionforthefiscalyearendedJune30,2025,anincreaseof$3.8 million compared to the prior fiscal year. The increase was primarily driven by a $2.1 million rise in property tax revenues and a $1.6 million increase in investment earnings, reflecting higher assessed property values and elevated interest earnings and unrealized gains during Fiscal Year 2024-25.
Expenditures were $34.4 million, up from $31.2 million in the prior fiscal year. Of this total, $27.0 million was expended on general government activities – an increase of $1.6 million from the prior fiscal year.
In addition, $33.2 million was transferred out to support capital improvement projects and debt service payments, which is consistent with the $33.7 million transferred in the prior fiscal year.
The fund balance at June 30, 2025, was $129.4 million, and remains restricted for expenditures benefiting the Shoreline Community.
The Housing Fund accounts for fees paid by developers to provide for increasing and improving the supply of extremely low-, very low-, low-, and moderate-income housing (affordable housing).
Revenues were $8.7 million for the fiscal year ended June 30, 2025, a decrease of $0.9 million from the prior fiscal year. The fund balance of $192.8 million is restricted for future affordable housing projects.
The General Capital Projects Fund accounts for all general capital improvement activities.
Revenues were $22.6 million for the fiscal year ended June 30, 2025, an increase of $0.5 million fromthepriorfiscalyear.Investmentearningsincreasedby$5.0million,partiallyoffsetbya$4.2 million decrease in intergovernmental revenue. The decrease in intergovernmental revenue is primarilyduetotheabsenceof severalone-timegrantsreceivedin thepriorfiscalyear,including a $1.7 million grant from Santa Clara County for the Magical Bridge Playground project and $2.3 million in Silicon Valley Transportation Measure B grant funding.
Expenditures totaled $54.9 million, consistent with the prior fiscal year. These expenditures were used to support capital outlay projects, including:
Water and Sewer Main Replacement 101 at Two Locations (CIP 20-41)
Fire Station 5 Classroom/Training Construction (CIP 20-35)
Stevens Creek Trail Bridge Over Central Expressway and Evelyn Avenue - Deck Replacement and Painting (CIP 22-35)
The fund balance at June 30, 2025, was $328.5 million, and is available to fund approved capital projects.
The Park Land Dedication Capital Projects Fund accounts for revenues derived from fees on residential subdivisions, which are restricted for use on park and recreation projects.
Revenues were $3.3 million for the fiscal year ended June 30, 2025, a decrease of $0.5 million from the prior fiscal year. No expenditures were incurred in the prior year. In the current year, expenditures totaled $6.0 million, primarily due to the purchase of the property located at 939 San Rafael Avenue.
ThefundbalanceatJune30,2025,was$61.7 million,and isavailabletofundparkandrecreation projects.
Proprietary Funds—The City’s proprietary funds statements provide information similar to that presented in the government-wide financial statements but with greater detail.
At the end of the fiscal year, the unrestricted net positions for the Water, Wastewater, and Solid WasteFundswere$67.2 million,$75.2 million,and$17.3 million,respectively. Thetotalincrease in net position for the enterprise funds was $17.5 million, which reflects a $17.9 million increase during the fiscal year, partially offset by a $0.4 million restatement of the beginning balance due to the implementation of GASB Statement No. 101.
Net operating income increased for both the Water and Wastewater Funds when compared to the prior fiscal year. The Water Fund’s net operating income of $4.1 million, increased by $4.4 million, primarily because the $4.0 million minimum water purchase obligation payment was made in the prior fiscal year, while no such payment was required in Fiscal Year 2024-25. The Wastewater Fund’s net operating income of $6.0 million increased by $0.7 million over the prior year.
The Solid Waste Fund reportednegative net operating income of $0.5 million, adecrease of $1.9 million from the prior fiscal year. This decline was primarily due to a $1.6 million increase in charges from the SMaRT (Sunnyvale Materials Recovery and Transfer) Station.
Additional factors affecting the finances of the enterprise funds are discussed earlier in the analysis of the City’s business-type activities.
The City’s internal service funds reported an unrestricted net position of $34.8 million as of June 30, 2025.
Fiduciary Funds—The City maintains fiduciary funds to account for fiduciary activities and for assets held by the City in a custodial capacity for the benefit of external agencies or employees. As of June 30, 2025, the assets of the custodial funds totaled $450,000, a decrease of $220,000 from the prior fiscal year. The decrease is primarily attributable to the reclassification of the Flexible Benefit Plan from a fiduciary fund to the General Fund.
Differences between the original and final amended Fiscal Year 2024-25 General Fund budget resulted in a $1.6 million increase in budgeted revenues, primarily within Other Revenues, and a $10.4 million increase in expenditure appropriations. Of the expenditure adjustments, $8.2 millionreflectsprior-yearencumbrancesthatautomaticallycarriedforwardatthebeginning of the fiscal year, as required by the City Charter. An additional $1.8 million in appropriations was established for the payment of compensated absences. The remaining adjustments were made midyear to address operational needs not anticipated at the time of budget adoption, as well as to appropriate grants or reimbursements received during the fiscal year.
General Fund actual revenues are $40.9 million or 20.9% higher than the final amended budget for the fiscal year. The positive variance is primarily attributable to the following revenues exceeding expectations:
• Investment and lease interest income—$21.8 million higher (primarily due to noncash mark-to-market accounting adjustments for unrealized portfolio gains).
• Property tax revenues—$10.2 million higher (driven largely by $9.5 million in Excess Educational Revenue Augmentation Fund property tax, which is not a guaranteed revenue source and remains subject to legislative changes).
• Other taxes—$4.5 millionhigher (resulting fromunbudgeted property transfer taxrevenue of $2.0 million and higher-than-expected utility user tax and transient occupancy tax revenues of $1.1 million and $0.9 million, respectively).
• Charges for services —$2.5 million higher (primarily due to higher-than-expected administrative cost recovery related to capital projects of $2.0 million)
Also contributing to the large variance is the City’s practice of analyzing and projecting revenues throughout the fiscal year, but only adjusting the budgets of the City’s largest revenue sources when needed. In addition, the City generally does not budget for uncertain or one-time revenues, such as Excess Educational Revenue Augmentation Funds (ERAF) and various reimbursements,nordoes itadjustthebudgetaftersuchrevenuesarereceived. Thesepractices can result in budgeted amounts that are significantly lower than actual revenues.
Actual General Fund expenditures were $27.8 million lower than the final amended budget for the fiscal year. This variance is primarily attributable to continued salary and benefit savings
resulting from vacant positions, as well as budgeted amounts for limited-period funding, onetime programs, and nondepartmental costs that were included in the final amended budget but were not fully expended during the fiscal year. As the City continues to accelerate recruitment for newly authorized and recently vacated positions, actual salary and benefit expenditures are expected to more closely align with budgeted levels. Since vacancy savings are not formally budgeted,butinsteadassumed aspart ofnormaloperations,thesesavingsalsocontributetothe variance from budget.
As a result of higher-than-expected revenuesand expenditure appropriationsthat werenotfully expended, the General Fund realized a positive budget-to-actual variance.
Capital Assets
The City’s capital assets for its governmental and business-type activities totaled $755.5 million (net of accumulated depreciation and amortization) as of June 30, 2025. Capital assets include land, construction in progress, buildings, improvements other than buildings, machinery and equipment, lease assets, subscription-based IT arrangement (SBITA) assets, and infrastructure. The total net increase in capital assets for the fiscal year was $42.3 million, or 5.9%.
The change in capital assets, net of depreciation, for governmental and business-type activities are summarized as follows:
CapitalAssets (DollarsinThousands)
Major capital asset activities during the fiscal year included the following:
• Total capital assets increased by $42.3 million, resulting from $80.0 million in capital asset additions, offset by a $37.7 million increase in accumulated depreciation and amortization.
• Construction in progress increased by $40.6 million. Significant projects worked on and/or completed during the year included:
Water and Sewer Main Replacement 101 at Two Locations (CIP 20-41)
Fire Station 5 Classroom/Training Construction (CIP 20-35)
All Inclusive Playground (CIP 18-36)
Rengstorff Park Maintenance and Tennis Buildings Replacement Design & Construction (CIP 21-48)
Additional information about the City’s capital assets is provided in Note 6 to the financial statements.
As of June 30, 2025, the City had $171.6 million of outstanding noncurrent liabilities related to governmental activities and $11.6 million related to business-type activities, totaling $183.2 million. Noncurrent liabilities outstanding as of June 30, 2025, with a comparison to the prior year and the net change, are as follows:
(DollarsinThousands)
TheincreaseinnoncurrentliabilitieswasprimarilydrivenbyhigherSBITAliabilitiesresultingfrom two new software agreements entered into during the fiscal year, an increase in compensated
absences due to the implementation of GASB Statement No. 101, and higher claims liabilities. These increases were partially offset by scheduled debt service payments.
The City Charter limits bonded indebtedness for General Obligation bonds to 15.0% of the total assessed valuation of all real and personal property within the City. The City has no general obligation debt outstanding as of June 30, 2025 and has maintained its underlying “AAA” issuer credit rating from Standard & Poor’s since July 2014.
Business-type activities debt consists of water revenue bonds, a reclaimed water loan with the City of Palo Alto, and a wastewater direct financing agreement.
Additional information regarding the City’s noncurrent liabilities can be found in Note 7 to the financial statements.
All of the factors discussed below were considered in preparing the City’s budget for Fiscal Year 2025-26.
• The local economy is beginning to show signs of slowing. While the City’s major revenues have generally remained stable and, in some cases, benefited from inflationary trends and higher interest rates, these factors are not expected to continue at the same pace. As a result,futuregrowthintheCity’smajorrevenuesourcesisanticipatedtobemodest,withsome areas experiencing minimal increases or potential softening in the near future. Ongoing uncertainty related to inflation, interest rates, national and state economic policies, and geopolitical conditions contributes to this more cautious outlook and slower projected growth.
• The County Assessor has cautioned that the 2025 assessment roll may show declines in commercial property values. In Mountain View, 11 commercial properties sold in 2024 for less than their prior purchase prices, with declines ranging from $80,000 to $80.3 million. Assessment appeals are projected to reduce General Operating Fund revenue by $2.3 million. Slower home sales, sustained high home prices, and commercial valuation correctionsarereflectedinthe FY2025–26AdoptedBudget.Overall,propertytaxrevenues are expected to increase 4.8 percent, a notably slower rate than in recent years.
• Sales tax revenue is projected to increase slightly for Fiscal Year 2025-26, reflecting the anticipated opening of new sales tax-generating businesses during the fiscal year. Forecast years beyond Fiscal Year 2025-26 anticipate a return to normal growth, with annual increases of approximately 3%.
• Business license revenue is projected to decline 4.5% due to known and potential layoffs. Utility Users Tax (UUT) revenue is projected to be 8.1% higher than the current fiscal year when excluding the $1.1 million in prior year revenue recognized in Fiscal Year 2024-25,
primarilydue tohigher energy-related collections. Transient Occupancy Tax (TOT) revenue is expected to increase slightly relative to the current fiscal year, excluding the late payments received in the prior fiscal year.
• Cost-of-service studies were completed for all three utility funds during Fiscal Year 202324. As a result, utility rates were adjusted to reflect the true cost of providing services rather than applying across-the-board rate increases. The Fiscal Year 2025-26 adopted rates for the Water, Wastewater, and Solid Waste Management Funds vary due to multiyear implementation of rate structure adjustments, with impacts differing by account type and billed usage. Effective July 1, 2025, the adopted rates reflect total revenue increases of 5% for the Water Fund, 6% for the Wastewater Fund, and 3% for the Solid Waste Fund.
These financial statements are intended to provide residents, taxpayers, investors, and creditors with a general overview of the City’s finances. Questions concerning any of the information provided in this report or requests for additional financial information should be directed to the Finance and Administrative Services Department, 500 Castro Street, P.O. Box 7540, Mountain View, California, 94039-7540, or financeadmin@mountainview.gov.
This page intentionally left blank
This page intentionally left blank
June 30, 2025 (Dollars in Thousands)
For the year ended June 30, 2025 (Dollars in Thousands)
Program Revenues
General Revenues:
Taxes:
Property taxes
Sales taxes
Transient occupancy taxes
Utility users tax
Nonregulatory franchise and business, unrestricted
Intergovernmental - not restricted to specific programs
Investment income
Total taxes
Transfers
Total general revenues and transfers
Change in net position
Net position - beginning of year
Restatements
Beginning of year, as restated
Net position - end of year
(Expense) Revenue
and Changes in Net Position
GovernmentalBusiness-Type
This page intentionally left blank
Governmental Fund Financial Statements
Proprietary Fund Financial Statements
Fiduciary Fund Financial Statements
Governmental Funds
June 30, 2025 (Dollars in Thousands)
This page intentionally left blank
Reconciliation of the Governmental Funds Balance Sheet to the Government-Wide Statement of Net Position
June 30, 2025
(Dollars in Thousands)
Amounts reported for governmental activities in the statement of net position are different because:
Capitalassetsusedingovernmentalactivitieswerenotcurrentfinancialresources. Therefore,theywerenotreportedintheGovernmentalFundsBalanceSheet. Exceptfortheinternalservicefundsreportedbelow,thecapitalassetswere adjusted as follows:
Internalservicefundswereusedbymanagementtochargethecostsofcertain activities,suchasinsurance,toindividualfunds.Theassetsandliabilitiesofthe InternalservicefundswereincludedingovernmentalactivitiesintheGovernmentWide Statement of Net Position.
IntheGovernment-WideFinancialStatements,deferredemployercontributionsfor pensionandOPEB,certaindifferencesbetweenactuarialestimatesandactual results,andotheradjustmentsresultingfromchangesinassumptionsandbenefits are deferred in the current year.
Long-termliabilitieswerenotdueandpayableinthecurrentperiod.Therefore, they were not reported in the Governmental Funds Balance Sheet.
For the year ended June 30, 2025 (Dollars in Thousands)
This page intentionally left blank
For the year ended June 30, 2025 (Dollars in Thousands)
Amounts reported for governmental activities in the Government-Wide Statement of Activities were different because:
Net Change in Fund Balances - Total Governmental Funds 60,866 $
Governmental funds reported capital outlay as expenditures. However, in the Government-Wide Statement of Activities, thecostofthoseassetswasallocatedovertheirestimatedlivesasdepreciationexpense.Thiswastheamountofcapital assets recorded in the current period, net of the amount related to internal service funds. 62,988
DepreciationexpenseoncapitalassetswasreportedintheGovernment-WideStatementofActivities,butdidnotrequire theuseofcurrentfinancialresources.Therefore,depreciationexpensewasnotreportedasexpendituresinthe governmental funds, net of the amount related to internal service funds. (30,502)
Accrued compensated leave payments were reported as expenditures in the governmental funds, however expense is recognized in the Government-Wide Statement of Activities based on earned leave accruals. (304)
Repaymentsoflong-termdebtarerecognizedasexpendituresinthegovernmentalfunds.Inthegovernment-wide statements,repaymentsoflong-termliabilitiesarereportedasreductionsofliabilities.Expendituresforrepaymentof principal portion of long-term debt were not reported in the Government-Wide Statement of Activities. 3,293
CurrentyearemployerpensionandOPEBcontributionsarerecordedasexpendituresinthegovernmentalfunds, however,theseamountsarereportedasadeferredoutflowofresourcesintheGovernment-WideStatementofNet Position. 42,427
Pension and OPEB expense reported in the Government-Wide Statement of Activities does not require the use of current financial resources, and therefore is not reported as expenditures in governmental funds. (51,092)
Some expenses reported in the statement of activities do not require the use of current financial resources and therefore are not reported as expenditures in governmental funds
Internalservicefundswereusedbymanagementtochargethecostsofcertainactivities,suchasinsuranceandfleet management,toindividualfunds.Thenetrevenueoftheinternalservicefundswasreportedwithgovernmental activities. (4,103)
Change in Net Position of Governmental Activities 83,905 $
For the year ended June 30, 2025 (Dollars in Thousands)
SOURCES (USES):
Statement of Revenues, Expenditures and Changes in Fund Balances - Budget and Actual
Shoreline Regional Park Community
For the year ended June 30, 2025 (Dollars in Thousands)
Statement of Revenues, Expenditures and Changes in Fund Balances - Budget and Actual Housing Fund
For the year ended June 30, 2025 (Dollars in Thousands)
Budgeted Amounts
FINANCING SOURCES (USES):
FUND BALANCES:
June 30, 2025 (Dollars in Thousands)
Business-Type Activities
of Revenues, Expenses and Changes in Net Position
Proprietary Funds
For the year ended June 30, 2025 (Dollars in Thousands)
Business-Type Activities
For the year ended June 30, 2025 (Dollars in Thousands)
RECONCILIATION OF OPERATING INCOME (LOSS) TO NET CASH PROVIDED BY (USED IN) OPERATING ACTIVITIES:
Adjustments to reconcile operating
Fiduciary Funds
June 30, 2025
(Dollars in Thousands)
For the year ended June 30, 2025 (Dollars in Thousands)
This page intentionally left blank
This page intentionally left blank.
For the Year Ended June 30, 2025
The City of Mountain View (City) was incorporated in 1902 and is a charter city, having had its charter granted by the State of California in 1952. The City operates under the Council-Manager form of government and provides the following services: public safety (police, fire, and paramedic), public works, utilities (water, wastewater, and solid waste), community development, cultural and recreation services and administration and support services.
The accompanying basic financial statements present the financial activities of the City, which is the primary government presented, alongwith the financialactivitiesof itscomponent units,whichare entitiesfor which the City is financially accountable. Although they are separate legal entities, blended component units are in substance part of the City's operations and are reported as an integral part of the City's financial statements. The City's component units, which are described below, are all blended.
The Mountain View Shoreline Regional Park Community (Shoreline Community) - is a separate government entity created for the purpose of developing approximately 1,550 acres of bayfront lands. The Shoreline Community’s governing board is the same as the City and the City’s management has operational responsibility for the Shoreline Community. Its financial activities have been blended in the accompanying financial statements in the Shoreline Regional Park Community Special Revenue Fund and the nonmajor debt service funds. Separate financial statements for the Shoreline Community are also included as a component of the City’s Annual Comprehensive Financial Report.
The City of Mountain View Capital Improvements Financing Authority (Financing Authority) - is a separate government entity whose purpose is to assist with the financing or refinancing of certain public capital improvements within the City. The Financing Authority’s governing board is the same as the City, the Financing Authority provides services solely to the City, and a financial benefit/burden relationship exists between the City and the Financing Authority. Its financial activities have been blended in the accompanying financial statements in the nonmajor debt service funds. Separate financial statements for the Financing Authority are not required and therefore, not issued.
The City’s basic financial statements are prepared in conformity with accounting principles generally accepted in the United States of America. The Governmental Accounting Standards Board (GASB) is the acknowledged standard setting body for establishing accounting and financial reporting standards followed by governmental entities. These standards require that the financial statements described below be presented.
The Statement of Net Position and the Statement of Activities display information about the primary government (the City and its component units). These statements include the financial activities of the overall City government, except for fiduciary activities.Eliminations have been made to minimize the double counting of internal activities. These statements distinguish between the governmental and business-type activities of the City. Governmental activities generally are financed through taxes, intergovernmental revenues and other nonexchange transactions. Business-type activities are financed in whole or in part by fees charged to external parties.
For the Year Ended June 30, 2025
(Continued)
Government-Wide Financial Statements (Continued)
The Statement of Activities presents a comparison between direct expenses and program revenues for each segmentof the business-type activitiesofthe City andfor each functionofthe City’s governmental activities. Direct expenses are those that are specifically associated with a program or function and, therefore, are clearly identifiable to a particular function. Program revenues include (a) charges paid by the recipients of goods or services offered by the programs, (b) grants and contributions that arise from mandatory and voluntary nonexchange transactions with other governments, organizations, or individuals that are restricted for use in a particular program, and (c) grants and contributions of capital assets or resources that are restricted for capital purposes. Revenues that are not classified as program revenues, including all taxes, are presented as general revenues.
The fund financial statements provide information about the City's funds, including fiduciary funds and blended component units. Separate statements for each fund category - governmental, proprietary, and fiduciary - are presented. The emphasis of fund financial statements is on major individual governmental and enterprise funds, each of which is displayed in a separate column. All remaining governmental and enterprise funds are aggregated and reported as nonmajor funds.
Proprietary fund operating revenues, such as charges for services, result from exchange transactions associated with the principal activity of the fund. Exchange transactions are those in which each party receives and givesupessentiallyequalvalues.Nonoperating revenues, suchas contributions and investment income, result from nonexchange transactions or ancillary activities.
Major funds are defined as funds that have either assets combined with deferred outflow of resources, liabilities combined with deferred inflow of resources, revenues or expenditures/expenses equal to 10.0 percent of their fund-type total and 5.0 percent of the grand total of governmental and enterprise funds. Major governmental and business-type funds are identified and presented separately in the fund financial statements. All other funds, called nonmajor funds, are combined and reported in a single column, regardless of their fund-type. The General Fund is always a major fund, and the City may select other funds it believes should be presented as major funds.
The City reports major governmental funds in the basic financial statements as follows:
General Fund - This is the City’s primary operating fund. It accounts for all financial resources of the general government, except those required to be accounted for in another fund.
Shoreline Regional Park Community Fund (Special Revenue) - This fund receives property tax revenues on properties within the Shoreline Community. The fund accounts for the revenues and expenditures of the Shoreline Community.
Housing Fund (Special Revenue) - This fund accounts for fees paid by developers to provide for increasing and improving the supply of extremely low, very low, low, and moderate income housing (affordable housing).
Notes to Basic Financial Statements
For the Year Ended June 30, 2025
(Continued)
General Capital Projects Fund (Capital Projects) - This fund accounts for all capital improvement projects activities.
Park Land Dedication Capital Projects Fund (Capital Projects) - This fund accounts for revenues derived from fees on residential subdivisions used for park and recreation projects.
The City reports all of its enterprise funds as major funds in the accompanying financial statements:
Water Fund – This fund accounts for the revenues and expenses related to the operation, maintenance and capital outlay required to supply, distribute and meter water. The City has agreements with the San Francisco Public Utilities Commission and the Santa Clara Valley Water District for the supply of wholesale water.
Wastewater Fund– Thisfundaccountsforthe revenuesandexpensesrelatedtothe operation,maintenance and capital outlay required to provide wastewater services. The City has an agreement with the City of Palo Alto to purchase treatmentcapacity at the Palo Alto Regional Water Quality Control Plant (Treatment Plant).
Solid Waste Fund – This fund accounts for the revenues and expenses related to disposal services, recycling operations, other solid waste operations, capital outlay and certain costs related to maintenance of the closed landfill sites. Collection operations are provided by an outside private contractor. The City has an agreement with the City of Sunnyvale for disposal transfer capacity at the Sunnyvale Materials and Recovery Transfer (SMaRT®) Station.
The City also reports the following fund types:
Internal Service funds – These funds account for equipment maintenance and replacement, workers’ compensation insurance, unemployment self-insurance, liability self-insurance, retirees’ health plan, and employee benefits plan, all of which are provided to other funds on a cost-reimbursement basis.
Custodial funds – These funds are fiduciary funds used to report fiduciary activities that are not required to be reported in pension (and other employee benefit) trust funds, investment trust funds, or private purpose trust funds. These include custodial balances and activities of the labor unions and Center for Performing Arts. The financial activities of these funds are excluded from the government-wide financial statements, but are presented in separate fiduciary fund financial statements.
The government-wide, proprietary fund, and fiduciary fund financial statements are reported using the economic resources measurement focus and the full accrual basis of accounting. Revenues are recorded when earned and expenses are recorded at the time liabilities are incurred, regardless of when the related cash flows take place.
For the Year Ended June 30, 2025
Governmental fundsarereportedusingthecurrentfinancial resourcesmeasurement focusandthemodified accrual basis of accounting. Under this method, revenues are recognized when measurable and available. The City considers all revenues, except sales taxes, reported in the governmental funds to be available if the revenues are collected within sixty days after fiscal year end. A ninety-day availability period is used for sales taxes in order to include the State of California (State) final distribution of sales taxes revenue for the fiscal year. Expenditures are recorded when the related fund liability is incurred, except for principal and interest on long-term debt, claims and judgments, landfill containment costs and compensated absences, which are recognized as expenditures to the extent they have matured and are due and payable at year end. Capital asset acquisitions are reported as expenditures in governmental funds. Proceeds from long-term debt issuance and leases financing are reported as other financing sources.
Non-exchange transactions, in which the City gives or receives value without directly receiving or giving equal value in exchange, include property taxes, grants, entitlements and donations. On the accrual basis, revenues from property taxes are recognized in the fiscal year for which the taxes are levied. Revenues from grants, entitlements and donations are recognized in the fiscal year in which all eligibility requirements have been satisfied.
Those revenues susceptible to accrual are property taxes, sales taxes, certain intergovernmental revenues, transient occupancy taxes, utility user taxes, earned grant entitlements, special assessments due within the current fiscal year and investment revenue. All other revenue items are considered to be measurable and available only when cash is received.
Grant revenuesare recognizedinthe fiscalyearinwhich all eligibility requirementsare met.Under the terms of grant agreements, the City may fund certain programs with a combinationof cost -reimbursement grants, categorical block grants and general revenues. Thus, both restricted and unrestricted net position may be available to finance program expenditures. The City’s policy is to first apply restricted grant resources to such programs, followed by general revenues if necessary.
Certain indirect costs are included in program expenses reported for individual functions and activities.
As a general rule, the effect of interfund activity has been eliminated in the preparation of the governmentwide financial statements. Exceptions to this general rule are charges between the government’s businesstype activities and various other functions of the government. Elimination of these charges would distort the direct costs and program revenues reported for the various functions concerned.
Amounts reported as program revenues include 1) charges to customers or applicants for goods or services, 2) operating grants and contributions and 3) capital grants and contributions, including special assessments. Internally dedicatedresources and taxes are reportedas general revenues rather than as program revenues.
For the Year Ended June 30, 2025
Proprietary funds distinguish operating revenues and expenses from nonoperating items. Operating revenues and expenses generally result from providing services and producing and delivering goods in connection with a proprietary fund’s principal ongoing operations. The principal operating revenues of the City’s enterprise funds and internal service funds are charges to customers for sales and services. The City also recognizes as operating revenue the portion of connection fees intended to recover the cost of connectingnew customersto thesystem.Operatingexpensesforenterprise fundsandinternalservice funds include the cost of sales and services, administrative expenses and depreciation on capital assets. All revenues and expenses not meeting this definition are reported as nonoperating revenues and expenses.
When both restricted and unrestricted resources are available for use, it is the City’s policy to use restricted resources first, then unrestricted resources as they are needed.
Inventories are valued at cost (first in, first out). Inventories of the General Fund consist of expendable supplies held for consumption. The cost is recorded as expenditures at the time individual inventory items are consumed. Inventories of the Shoreline Golf Links Nonmajor Special Revenue Fund consist of merchandise held for resale to consumers. The cost is recorded as expenditures at the time individual inventory items are sold. Inventories of supplies are reported at cost, whereas inventories held for resale are reported at lower of cost or market.
Certain payments to vendors for services applicable to future accounting periods are recorded as prepaids in both the government-wide financial and fund financial statements. The City follows consumption method of recognizing revenue and as such prepaid amounts are expensed during the periods benefited.
The County of Santa Clara (County) assesses properties and it bills, collects, and distributes property taxes to the City. The County remits to the City the entire amount levied and handles all delinquencies, retaining interest and penalties. Secured and unsecured property taxes are levied on July 1 for the fiscal year.
Secured property tax becomes a lien on January 1 and is due in two installments, on November 1 and February 1. It becomes delinquent after December 10 and April 10, respectively. Unsecured property tax bills are distributed in July and are due upon receipt, and become delinquent after August 31. Collection of delinquent accounts is the responsibility of the County, which retains all penalties.
The term “unsecured” refers to taxes on personal property other than real estate, land and buildings and are secured by liens on the property owner. Property tax revenues are recognized by the City in the fiscal year they are levied, provided they become available as defined above.
Notes to Basic Financial Statements
For the Year Ended June 30, 2025
Compensated absences, representing earned but unused vacation, sick leave pay and related costs, are reported in the Statement of Net Position. The City implemented GASB Statement No. 101, Compensated Absences during fiscal year 2024-25. Liabilities for leave are assumed to be accrued using the first in, first out method, meaning the leave that was earned previously is used or paid or settled first. The City has recorded a liability only when it is more likely than not that the leave will be taken or paid for. All compensated absences and related costs are accrued when incurred in the government-wide and proprietary fund financial statements. The City uses the vesting method for the calculation of compensated absences.
In addition to assets, the Statement of Net Position and Balance Sheets report a separate section for deferred outflows of resources. This separate financial statement element, deferred outflows of resources, represents a consumption of net assets or fund balance that applies to a future period(s) and so will not be recognized as an outflow of resources (expense/expenditure) until then.
In addition to liabilities, the Statement of Net Position and Balance Sheets report a separate section for deferred inflows of resources. This separate financial statement element, deferred inflows of resources, represents an acquisition of net assets or fund balance that applies to a future period(s) and so will not be recognized as an inflow of resources (revenue) until that time.
For purposes of measuring the net pension liability and net OPEB liability, deferred outflows/inflows of resources related to pension and OPEB, pension and OPEB expenses, information about the fiduciary net position of the City’s Pension and OPEB plans, and additions to/deductions from the plans’ fiduciary net positions have been determined on the same basis as they are reported by the California Public Employees’ Retirement System (CalPERS) and the California Employer’s Retiree Benefit Trust (CERBT) Fund Program, respectively. For this purpose, benefit payments (including refunds of employee contributions) are recognizedwhen due and payable inaccordancewiththe benefitterms.CalPERS plan member contributions are recognized in the period in which the contributions are due. Investments are reported at fair value. The governmental activities’ share of net pension liability and net OPEB liability are typically liquidated by the General Fund.
The City adopted new accounting standards in order to conform to the following Governmental Accounting Standards Board Statements in Fiscal Year 2024-25:
1. In June 2022, the GASB issued Statement No. 101, Compensated Absences. The objective of this statement is to better meet the information needs of financial statement users by updating the recognition and measurement guidance for compensated absences. That objective is achieved by aligning the recognition and measurement guidance under a unified model and by amending certain previously required disclosures. Implementation of these requirements has significant impact on the City’s Sick leave balance. The City restated its beginning fund balances in accordance with GASB 100Accounting Changes and Error Corrections as part of implementing this standard. See disclosure in Note 15.
For the Year Ended June 30, 2025
In December 2024, the GASB issued Statement No. 102, Certain Risk Disclosures. The objective of this Statement is to provide users of government financial statements with essential information about risks related to a government’s vulnerabilities due to certain concentrations or constraints. Implementation of these requirements did not have a significant impact on the City’s financial statements for the fiscal year ended June 30, 2025.
The City is currently analyzing its accounting practices to identify the potential impact on the financial statements for the GASB statements as follows:
1. In April 2025, the GASB issued Statement No. 103, Financial Reporting Model Improvements. The objective of this Statement is to improve key components of the financial reporting model to enhance its effectiveness in providing information that is essential for decision making and assessing a government’s accountability. The requirements of this statement are going to be effective for the City’s fiscal year ending June 30, 2026.
2. In September 2025, the GASB issued Statement No. 104, Disclosure of Certain Capital Assets – The primaryobjectiveofthisStatement isto provide usersof governmentfinancial statements withessential information about certain types of capital assets. This Statement requires certain types of capital assets to be disclosed separately in the capital assets note disclosures required by Statement 34. Lease assets recognized in accordance with Statement No. 87, Leases, and intangible right-to-use assets recognized in accordance with Statement No. 94, Public-Private and Public-Public Partnerships and Availability Payment Arrangements, should be disclosed separately by major class of underlying asset in the capital as-sets note disclosures. Subscription assets recognized in accordance with Statement No. 96, Subscription-Based Information Technology Arrangements, also should be separately disclosed. In addition, this Statement requires intangible assets other than those three types to be disclosed separately by major class. The requirements of this statement are going to be effective for the City’s fiscal year ending June 30, 2026.
The preparation of financial statements in conformity with accounting principles generally accepted in the United States of America (GAAP) requires management to make estimates and assumptions that affect the reported amounts of assets and liabilities and disclosure of contingent assets and liabilities at the date of the financial statements and the reported amounts of revenues and expenditures/expenses during the reporting period. Actual results could differ from those estimates.
Notes to Basic Financial Statements
For the Year Ended June 30, 2025
The City adopts an annual budget before July1 for the ensuing fiscal year for the General Fund and all Special Revenue Funds except for the Deferred Assessments Fund.
No annual budgets are adopted for the Debt Service Funds. Repayment of the debt is authorized by the adoption of the indenture provisions for the life of the debt.
The Storm Drain Construction and Park Land Dedication Capital Projects Funds are budgeted annually. All other Capital Projects Funds are budgeted on a project basis. Such budgets are based on a project time frame, rather than a fiscal year operating time frame, whereby unused appropriations continue until project completion.
Budget appropriations become effective on each July 1. The City Council may amend the budget during the fiscal year. The legal level of budgetary control has been established at the fund and department level, meaning that total appropriations for each fund and department may not be exceeded without City Council authorization. Appropriations lapse at the end of the fiscal year to the extent they have not been expended or encumbered.
All Governmental Fund Type annual budgets are presented on a basis consistent with the basic financial statements prepared in accordance with GAAP.
Budgeted revenue amounts represent the original budget modified by adjustments authorized during the fiscal year. Budgeted expenditure amounts represent original appropriations adjusted for supplemental appropriations during the fiscal year and reappropriated amounts for encumbrances, grants, and donations outstanding at the end of each prior fiscal year.
The City Council must approve appropriation increases to departmental budgets; however, management may transfer Council-approved budgeted amounts within fund and departmental expenditure classifications. Judgments, settlements and certain accrual entries are not subject to budgetary control and expenditures exceeding budget due to these items do not constitute a violation of budget policy or control. Supplemental appropriations were approved during the course of the fiscal year as needed.
Under encumbrance accounting, purchase orders, contracts and other commitments for the expenditure of monies are recorded in order to reserve that portion of the applicable appropriation. Encumbrance accounting is employed asan extension of formal budgetary integration. Encumbrances outstanding at fiscal year-end are automatically reappropriated for inclusion in the following fiscal year’s budget.
Notes to Basic Financial Statements
For the Year Ended June 30, 2025
The City pools cash from all sources and all funds, except restricted cash and investments, so the pool of funds can be invested consistent with goals for safety and liquidity, while maximizing yield. Cash is pooled so individual funds can make expenditures at any time.
For custodial credit risk, California law requires banks and savings and loan institutions to pledge government securities with a fair value of 110.0 percent of the City’s cash on deposit, or first trust deed mortgage notes with a fair value of 150.0 percent of the deposit, as collateral for these deposits. Under California law, this collateral is held in a separate investment pool by another institution in the City’s name and places the City ahead of general creditors of the institution.
The City invests in individual investments and in investment pools. Individual investments are evidenced by specific identifiable securities instruments, or by an electronic entry registering the owner in the records of the institution issuing the security, called the book entry system. In order to increase security, the City employs the trust department of a bank as the custodian of certain City managed investments, regardless of their form.
The City’s investments are carried at fair value. The carrying value of these investments are periodically adjusted to reflect their fair value at each fiscal year end and the effects of these adjustments are included as income or expense for that fiscal year.
Investment income is allocated among funds on the basis of average daily cash and investment balances in each fund, unless there are specific legal or contractual requirements to do otherwise.
Cashandinvestments withanoriginalmaturityof three monthsorlessareconsidered to be cashequivalents in the proprietary fund statements of cash flows because these assets are highly liquid and are expended to liquidate liabilities arising during the fiscal year.
For the Year Ended June 30, 2025
Cash and investments are classified in the financial statements based on whether or not their use is restricted under the terms of debt instruments. Investments are carried at fair value as of June 30, 2025. Cash and investments are as follows (dollars in thousands):
Cash and investments as of June 30, 2025, consist of the following (dollars in thousands):
The California Government Code and the City’s Investment Policy authorize the investment types in the following table, provided the credit ratings of the issuers are acceptable to the City; and approved percentages and maximum maturities are not exceeded. The table also identifies certain provisions of the California Government Code, or the City’s Investment Policy where the City’s Investment Policy is more restrictive, that addresses interest rate risk, credit risk and concentration of credit risk. This table does not address investments of debt proceeds held by bond trustee that are governed by the provisions of debt agreements of the City, rather than the general provisions of the California Government Code or the City’s Investment Policy.
For the Year Ended June 30, 2025
C. Investments Authorized by the California Government Code and the City’s Investment Policy (Continued)
The City’s Investment Policy and the California Government Code allow the City to invest in the following:
MunicipalBondsIssuedbytheCityoranyofits
(A)Thepolicyrequiresaminimumof25percentofthetotalportfoliotobeinvestedinU.S.TreasuryObligations.The policydoesnotspecifyamaximumforthistypeofinvestment.
(B)ThepolicyallowsonlymunicipalbondsissuedbytheCityofMountainVieworitscomponentunitsatlimitsand maturitiesasapprovedbytheCityCouncil.
D. Investments Authorized by Debt Agreements
The City must maintain required amounts of cash and investments with trustees or fiscal agents under the terms of certain debt issues. These funds are unexpended bond proceeds or are pledged as reserves to be used if the City fails to meet its obligations under these debt issues. The investment of debt proceeds held by bond trustee is governed by provisions of the debt agreements, rather than the general provisions of the California Government Code or the City’s Investment Policy. These debt agreements do not address interest rate, credit, and concentration of credit risks.
For the Year Ended June 30, 2025
D. Investments Authorized by Debt Agreements (Continued)
The investment types that are authorized for investments held by bond trustee are as follows:
AuthorizedInvestmentType
U.S.TreasuryObligations
U.S.AgencySecurities
DepositAccounts,FederalFundsandBanker's Acceptances
FDICInsuredCertificatesofDeposit
CommercialPaper
MoneyMarketMutualFunds
StateandLocalAgencyBonds
InsurerApprovedInvestmentContracts
InsurerApprovedOtherFormsofInvestmentsIncluding RepurchaseAgreements
LocalAgencyInvestmentFund(LAIF)
JointPowerAuthority(JPA)InvestmentPools
Maximum
Maturity
NoLimit
NoLimit
180days
NoLimit
180days
NoLimit
NoLimit
NoLimit
NoLimit
NoLimit
NoLimit
Certificateofdeposit 2years
Interest rate risk is the risk that changes in market interest rates will adversely affect the fair value of an investment. Generally, the longer the maturity of an investment, the greater the sensitivity of its fair value to changes in market interest rates. One of the ways the City manages its exposure to interest rate risk is by purchasing a combination of shorter term and longer term investments and by timing cash flows from maturities so a portionof the portfolio is maturing or coming close to maturity evenly over time as necessary to provide the cashflow and liquidity needed for operations. The Citymonitors theinterest rate risk inherent in its portfolio by measuring the modified duration (modified duration is a measure of a fixed income’s cash flows using present values, weighted for cash flows as a percentage of the investments’ full price) of its portfolio. The City monitors interest rate risk inherent in investments held by the trustee by using specific identification.
For the Year Ended June 30, 2025
The City’s interest rate risk by investment type and fair value is as follows (dollars in thousands):
HeldbytheCity:
HeldbyBondTrustee:
Through the City’s Investments Policy, the City manages its exposure to fair value losses arising from increasing interest rates by limiting the modified duration of its investment portfolio to within 15.0 percent of the modified duration of a benchmark portfolio as defined in the Investment Policy. As of June 30, 2025, the allowed modified duration ranged from 1.67 to 2.27 years and the actual is within this range.
Investments in municipal bonds shown above represent the City’s investment in the Shoreline Regional Park Community 2018 Revenue Bonds. The balance as of June 30, 2025, is stated at amortized cost, which approximates fair value.
The City is a participant in the Local Agency Investment Fund (LAIF) that is regulated by California Government Code Section 16429 under the oversight of the Treasurer of the State. The City reports its investment in LAIF at the fair value amount provided by LAIF, which is the same as the value of the pool share. The balance available for withdrawal is based on the accounting records maintained by the State, which are recorded on an amortized cost basis. LAIF is part of the State’s PooledMoney Investment Account (PMIA). The total balance of the PMIA is approximately $178.1 billion as of June 30, 2025. Of that amount, 97.04 percent was invested in nonderivative financial products and 2.96 percent in structured notes and asset backed securities. As of June 30, 2025, LAIF had an average maturity of 248 days.
Mutual Money Market Funds investments are available for withdrawal on demand and as of June 30, 2025, have an average maturity of less than 60 days.
For the Year Ended June 30, 2025
Generally, credit risk is the risk that an issuer of an investment will not fulfill its obligation to the holder of the investment. This is measured by the assignment of a rating by a nationally recognized statistical rating organization. The City’s Investment Policy isto apply the prudent investor’s standard inmanaging the overall portfolio. The standard states that investments shall not be made for speculation but shall be made with judgment and care, which investors of prudence, discretion and intelligence exercise considering the safety of principal, liquidity, and return on investment in this priority order. As of June 30, 2025, the City’s investment inmoney market mutual funds, and supranationalsecuritiesareratedAAA by Standard &Poor’s. U.S. agency securities are rated AA by Standard & Poor’s. The medium-term notes are rated between A and AA by Standard & Poor’s. The U.S. Treasury obligations are exempt from credit rating disclosure. The Municipal Bonds - Shoreline Regional Park Community 2018 Revenue Bonds are rated A+ by Standard & Poor’s. The Local Agency Investment Fund was not rated as of June 30, 2025.
The City’s Investment Policy regarding the amount that can be invested in any one issuer is stipulated by the California Government Code. However, the City is required to disclose investments that represent a concentration of 5.0 percent or more of investments in any one issuer other than U.S. Treasury obligations, money market mutual funds and external investment pools. As of June 30, 2025, those investments held by the City consisted of the following (dollars in thousands):
The City categorizes its fair value measurements within the fair value hierarchy established by generally accepted accounting principles. The hierarchy is based on the valuation inputs used to measure fair value of the assets. Level 1 inputs are quoted prices in an active market for identical assets; Level 2 inputs are significant other observable inputs; and Level 3 inputs are significant unobservable inputs. As of June 30, 2025, All of the City’s investments are measured using level 2 inputs, except for investments in LAIF and money market mutual funds, which are not subject to the fair value hierarchy. Investments measured using level 2 inputs are valued using prices determined by the use of matrix pricing techniques maintained by the pricing vendors for these investments. Matrix pricing isused to value investmentsbased on the investments’ relationship to benchmark quoted prices.
Notes to Basic Financial Statements
For the Year Ended June 30, 2025
As of June 30, 2025, the City’s loans and notes receivable are as follows (dollars in thousands):
BillWilsonCenter
EastEvelynAffordableHousing
901EElCaminoReal
950WElCaminoReal(PAH)
ElCaminoWestAffordableStudios
MVLot12HousingPartners
NorthShorelineHousing
PaloAltoHousing
RengstorffAffordableHousing
SanAntonioPlaceLP
SanVeronPark
SierraVistaApartmentsAffordanceHousing
The City engages in programs designed to encourage construction or improvement of housing for persons with extremely low to moderate income or other such projects. Under these programs, grants or loans are provided under favorable terms to homeowners or developers who agree to spend these funds in accordance with the City’s terms. The City does not expect to collect these loans in the near term, and most of the loan terms are deferred to the future. Any proceeds collected are restricted by grant requirements and thus these balances have been offset by a restriction of fund balance in the fund financial statements. Due to the nature of the repayment structures of the City’s housing loans, the City is not accruing interest on these loans. Interest revenue is recognized upon receipt.
These loan programs are funded by Community Development Block Grants (CDBG) funds, Home Investment Partnership Act (HOME) grant funds, Housing Fund, General Fund, and former Mountain View Revitalization Authority (Authority). With the dissolution of the Authority effective January 31, 2012, the City became the Housing Successor Agency.The balancesofthe loanswere transferredto the Housing SuccessorSpecialRevenue Fund (Housing Successor) of the City.
Notes to Basic Financial Statements
For the Year Ended June 30, 2025
On December 5, 2008, the City loaned $133,000 to The Bill Wilson Center, a nonprofit corporation, for the acquisition and operation of a youth and counseling services shelter. The loan was funded by CDBG funds and is due in 30 years and has a term of 3.0 percent simple interest. As of June 30, 2025, the amount of the loan outstanding is $133,000.
The City administers a housing rehabilitation loan program initially funded with CDBG funds. Under this program, individuals with incomes below a stated level are eligible to receive low-interest loans for rehabilitation work on their home. These loans are secured by deeds of trust, which may be subordinated with the prior written consent of the City. The loan repayments may be amortized over the life of the loans, deferred to maturity or combination of both. There are three such loans outstanding totaling $95,000 as of June 30, 2025.
C. Central Park Apartments
On July 1, 1998, the City and Housing Successor funds loaned $2.2 million to the Coalition for the acquisition and rehabilitation of a 149-unit apartment complex known as Central Park Apartments at 90 Sierra Vista Avenue to be used to provide housing for very-low- to low income seniors. The entire project was initially funded by three loans: $388,000 from Housing set aside funds to be repaid over nine years, commencing in Fiscal Year 1998-99 and bearing 3.0 percent annual interest; $1.2 million of CDBG funds to be repaid over 36 years commencing in FiscalYear 2012-13 and bearing 3.0 percent annual interest; and $612,000 from HOME grant funds to be repaid over 21 years commencing in Fiscal Year 2004-05 and bearing 3.0 percent annual interest.
On August 19, 2004, the City loaned $498,000 to the Coalition for the rehabilitation of the Central Park Apartments. The loanwas funded by CDBG funds to be repaidover16 years commencing in Fiscal Year 201718 and bearing 1.2 percent annual interest. This CDBG loan was fully paid off during Fiscal Year 2025.
On April 17, 2006, the City approved a $748,000 loan to the Coalition for the construction of the New Central Park Apartments. The loan was funded by CDBG funds with zero percent interest and repayment is deferred until January 1, 2054, or upon the repayment of the $1.3 million HOME loans described below.
On June 1, 2007, the City approved a loan of $1.3 million to fund the development cost of 104 apartments. The loan was funded by HOME grant funds with zero percent interest and repayment is deferred until the later of January 1, 2041, or upon repayment of the $851,000 Housing Successor’s loan. The HOME loan was fully paid off during Fiscal Year 2024.
On July 24, 2007, the City approved a $405,000 loan to the Coalition for the development of the New Central Park Apartments. The loan was funded by CDBG funds with zero percent interest and final payment is deferred until July 1, 2063. As of June 30, 2025, the amount of this CDBG loan is $367,000.
City of Mountain View Notes to Basic Financial Statements
For the Year Ended June 30, 2025
On April 23, 2013, the City approved an additional loan of $275,000 from CDBG funds to the Coalition. The loan was used to upgrade the utilities and install energy-efficient hot water heaters in the original 149-unit apartment complex. The loan bears annual interest at 1.5 percent, with repayment deferred until calendar year 2034 or upon repayment of the $498,000 CDBG loan.
As of June 30, 2025, the total outstanding balance of all loans related to Central Park apartments is $1.8 million
On May 31, 2016, the City entered into a loan agreement with Evelyn Avenue Family Apartments, LP for an affordable housing development at 779 East Evelyn Avenue. The total loan amount is $21.7 million and was funded by Housing funds. The loan has a 55-year term with 3.0 percent simple interest rate. As of June 30, 2025, the amount of the loan outstanding is $21.7 million.
In January 2021, the City Council voted to work with the County of Santa Clara to facilitate the acquisition and rehabilitation ofthe Crestview Hotel, locatedat 901 East El Camino Real, to meet various housing needs. Since then, the City Council has approved to loan up to $9.1 million to Jamboree Housing Corporation for this affordable housing project. This loan is to be funded by HOME grant funds, CDBG grants funds, Housing funds, and federal grants for the amounts of$3.6 million, $3.8million, $878,000,and $750,000, respectively. The term of the loan is 3.0 percent interest for 55 years. As of June 30, 2025, the amount of the loan outstanding is $8.0 million.
On June 1, 2020, the City entered into a loan agreement with 950 El Camino Real, L.P. (950 ECR) for an affordable housing development at 950 West El Camino Real. The total loan amount is $22.8 million and was funded by Housing funds. The loan has a 55-year term with 3.0 percent simple interest rate.
During the year ended June 30, 2020, 950 ECR entered into a loan agreement with a third party. The City’s loanis subordinate tothe third-partyloan.950 ECR,thethirdparty,andtheCity enteredinto asubordination agreement in which the City is required to holdback loan proceed of $4.7 million and deposit into a segregated bank account. During Fiscal Year 2022-23, the holdback loans proceed was disbursed to 950 ECR. As of June 30, 2025, the amount of the loan outstanding is $22.8 million.
On January 22, 2013, the City approved an agreement to loan up to $3.5 million to First Community Housing to acquire 0.48 acre of property located at 1581-1585 El Camino Real West. The loan was funded by HOME grant funds and Housing funds for the amounts of $920,000 and $2.5 million, respectively. The term of the loan is 3.0 percent interest for 55 years. As of June 30, 2025, the amount of the loan outstanding is $3.5 million.
For the Year Ended June 30, 2025
The City has an Employee Homebuyer Program to provide home buying and relocation assistance to eligible City employees. The program was funded by General Fund and the notes have terms of thirty years and interest based on applicable federal rate. Payment is deducted from the employee’s biweekly paycheck. As of June 30, 2025, there is one employee loan and the outstanding balance is $2.0 million.
On April 18, 2011, the City approved an agreement to loan up to $1.3 million to ROEM Development Corporation (ROEM) to acquire a long-term ground lease of property known as 135 Franklin Street. The loan was funded by CDBG funds at 4.0 percent interest and a term of 55 years.
On April 18, 2011, the City approved an agreement to loan up to $10.6 million to ROEM for the development of an affordable family rental housing development to be located at the property mentioned above. The loan was funded by Housing Successor funds with 4.0 percent interest and a term of 55 years.
On April 18, 2011, the City approved an agreement to loan up to $646,000 from the Housing fund to ROEM for the same project mentioned above. The loan was funded with 4.0 percent interest and a term of 55 years.
On November 1, 2011, the full loan was assigned to Franklin Street Family Apartments. As of June 30, 2025, the total outstanding balance of all loans related to Franklin Street Family Apartments is $12.5 million.
On December 11, 1991, the City loaned $380,000 to the Mid-Peninsula Housing Coalition (Coalition) for predevelopment and land acquisition costs related to the development of a 107- unit affordable senior housing complex located at 375 Oaktree Drive. On May 1, 1993, the City amended the loan agreement and loaned the Coalition an additional $215,000 for the purpose of paying park and recreation fees required prior to occupancy of the land. On February 12, 1996, excess funds not used were returned to the City in the amount of $78,000. The loan balance of $517,000 was funded by CDBG funds.
On May21, 2013, the City approved another modification to extend the loan term to May31,2038, reducing the annual simple interest rate from 6.0 percent to 3.0 percent effective June 1, 2013, and restructured the repayment to be based on 50.0 percent of the residual receipts. The loan balance and accrued interest will become payable on May 31, 2038.
On April 21, 2015, the City awarded $340,000 in CDBG funds and $185,000 in HOME funds for rehabilitation activities. The CDBG and HOME loans are to be repaid by January 31, 2066 and January 31, 2071, respectively, with zero percent interest.
As of June 30, 2025, the total outstanding amount of all loans related to Ginzton Terrace is $666,000.
For the Year Ended June 30, 2025
On February 21, 2001, the City loaned $100,000 to the HomeSafe Santa Clara L.P. for the construction of a 25-unit apartment complex at 611 El Camino Real, Santa Clara, to provide affordable housing for women and children who are victims of domestic violence. The loan was funded by $100,000 of HOME grant funds. The loan bears simple interest at3.0 percent, but repayment of interestand principal is deferred for 55 years unless during the term of the loan, the apartments no longer meet the affordability test for very low to lowincome victims of domestic violence, or if the property is sold or transferred. The loan is collateralized by a first deed of trust. As of June 30, 2025, the amount of the loan outstanding is $100,000.
On December 8, 2020, the City Council approved a prefunding of $1.3 million from Housing funds for use in predevelopment activities related to affordable housing developments at 1188 Armand Drive. The City enteredinto an affordable housing loanagreement, effective asof December 1, 2022, with Avenida Armand, L.P. to provide construction/permanent loan to the developer in the amount of $15.0 million. The term of the loan is 3.0 percent interest for 55 years. As of June 30, 2025, the amount of the loan outstanding is $14.7 million.
On December 23, 1980, the City loaned $55,000 to Mid-Peninsula Support Network for the acquisition and rehabilitation of a residential structure for the purpose of providing temporary shelter for battered parents and their children. The loanwas funded by CDBG funds and becomes payable upon demand by the City upon failure to comply with the terms of the loan agreement. The loan carries a 12.0 percent annual interest rate and shall accrue beginning 30 days following the date of demand. The loan is collateralized by a first deed of trust. As of June 30, 2025, the amount of the loan outstanding is $55,000.
On June 22, 2021, the City Council approved a prefunding of $1.3 million from Housing funds for use in predevelopment activities related to affordable housing developments at 1265 Montecito Ave. The City executed a predevelopment loan agreement on July 1, 2022 with Montecito, L.P. The term of the loan is no interest and matures on the earlier of i) December 31, 2025, and ii) the date of closing for any construction/permanent loan provided by the City. During the Fiscal year 2024-25, Montecito L.P made an additional draw amounting to $7.8 million. As of June 30, 2025, the amount of the loan outstanding is $12.8 million.
On March 2, 2024, the City entered into a predevelopment loan agreement of $1.3 million with MV Lot 12 Housing Partners, L.P. for funding of predevelopment activities on a 1.5-acre real property bounded by California, Bryant, and Mercy Streets. The loan was funded by Housing funds, and the term of the loan is 3.0 percent simple interest and matures on the earlier of i) March 2, 2026, and ii) the date of closing for any construction/permanent loan provided by the City. As of June 30, 2025, the amount of the loan outstanding is $1.0 million.
Notes to Basic Financial Statements
For the Year Ended June 30, 2025
OnApril1,2019,the Cityenteredinto anagreementtoloanupto $8.2millionto MP Shorebreeze Associates, L.P. for the development of an affordable multi-family residential rental development to be located at 460 North Shoreline Boulevard. The $8.2 million loan was funded by HOME grant funds, CDBG grants funds, and Housing funds for the amounts of $421,000, $96,000, and $7.6 million, respectively. The term of the loan is 3.0 percent interest for 55 years. As of June 30, 2025, the amount of the loan outstanding is $8.2 million.
On December 20, 2015, the City entered into a predevelopment funding agreement with Palo Alto Housing Corporation for predevelopment activities at 1701 West El Camino Real. This prefunding loan of $1.0 million was funded from Housing funds. On April 3, 2017, the City entered into a permanent loan agreement with 1701 ECR, LP where the outstanding principal balance of the predevelopment loan was rolled over into the permanent loan. The approved total amount of loan funded by Housing funds for this housing development was $8.0 million, with 3.0 percent simple interest rate commencing upon City’s issuance of a final certificate of occupancy. As of June 30, 2025, the amount of the loan outstanding is $8.0 million.
On May 1, 1997, the City loaned $132,000 to Project Match for the acquisition of the house located at 1675 South Wolfe Road, Sunnyvale, to provide affordable housing for low-income seniors. The loan was funded by HOME grant funds. The loan is to be repaid over a 30-year period at 3.0 percent annual simple interest. Interest and principal amounts are deferred. The loan is collateralized by a second deed of trust. As of June 30, 2025, the amount of the loan outstanding is $132,000.
On June 3, 2013, the City approved an agreement to loan up to $9.0 million to ROEM for the development of an affordable family rental housing development to be located at 819 North Rengstorff Avenue. The loan was funded by Housing funds with 3.0 percent interest and a term of 55 years. As of June 30, 2025, the amount of the loan outstanding is $8.2 million.
On April 25, 2002, the City approved an agreement to loan up to $5.3 million to Charities Housing Development Corporation (Corporation) for development of an efficiency studios housing project to provide affordable housing for very-low to low-income persons. On July 1, 2004, the Corporation assigned to the San Antonio Place LP all of the rights and obligations under the agreements. The loan amount was amended to loan up to $5.5 million on December 1, 2006, which would be funded by $2.5 million of CDBG funds, $2.2 million of HOME grant funds and $809,000 of the Housing Successor funds. The loan is provided at zero percent interest with repayment deferred for 55 years unless the San Antonio Place LP no longer meets the terms and conditions of the agreement. As of June 30, 2025, the amount of the loan outstanding is $5.5 million.
Notes to Basic Financial Statements
For the Year Ended June 30, 2025
On December 1, 2009, the City amended an agreement with San Veron Corporation to loan up to $898,000 to renovate one hundred twenty-four affordable Town home units for very-low and low- income households. The loan was funded by HOME grant funds, however, the construction did not occur until Fiscal Year 2012-13. On July 1, 2013, the City approved and authorized the provision of increasing the loan amount to $1.1 million, and to be drawn from the HOME grant funds. As of June 30, 2025, the amount of the loan outstanding is $187,000.
On February 1, 1999, the City approved to loan up to $100,000 to Sierra Vista I Limited Partnership/Charities Housing Corporation for the development and renovation of a 34-unit affordable apartment complex to low and moderate income families to be located at 1909 Hackett Avenue. An additional loan in the amount of $255,000 wasapprovedonJanuary 16,2007.The loanswere fundedby CDBG fundswith6.0percent interest and a term of September 2019 and January 2032, respectively.
On September 24, 2013, the City approved an amendment to the loan agreements with Charities Housing Corporation. This CDBG loan funding will bear interest at 3.3 percent, compound annually on September 1. The term of the loan will be 57 years, maturing on October 1, 2070. As of June 30, 2025, the amount of the loans outstanding is $238,000.
On December 1, 2009, the City approved to loan up to $255,000 to SR Fountains Limited Partnership for the rehabilitation of 124 existing units at The Fountains Apartments property located at 2005 San Ramon Avenue. The loan was funded by HOME grant funds with zero percent interest and repayment is deferred until December 1, 2019. In 2010 and 2012, the City approved an additional $466,000 and $305,000, respectively, loan to SR Fountains Limited Partnership.
On April 19, 2016, the City authorized an additional $675,000 loan from CDBG funds. This loan bears no interestandrepayment is deferred untilDecember 31,2026.SubsequentlyonMay2,2017, theCityawarded an additional $450,000 in CDBG funding, increasing this deferred loan to a total of $1.1 million. An amendment to the loan agreement was entered on June 1, 2018, with no changes to the key loan terms.
As of June 30, 2025, the total outstanding balance of all loans related to SR Fountains LP is $1.0 million.
On August 16, 2000, the City loaned $124,000 to the Stoney Pine Charities Housing Corporation for the construction of a 23-unit apartment complex at 212 North Mathilda Avenue and 271-283 West California Avenue, Sunnyvale, to provide affordable housing for very low income persons with developmental disabilities. The loan was funded by $9,000 of CDBG funds and $115,000 of HOME grant funds. The loans bear simple interest at 3.0 percent, but repayment of interest and principal is deferred for 40 years. The loans and accumulated interest remain deferred unless during the term of the loan, or after 40 years, the apartments no longer meet the affordability test for very low-income persons with developmental disabilities, or if the property is sold or transferred. The loan is collateralized by a second deed of trust. As of June 30, 2025, the amount of the loan outstanding is $124,000.
Notes to Basic Financial Statements
For the Year Ended June 30, 2025
On May 20, 2003, the City approved to loan up to $390,000 to MP Tyrella Associates for the development and renovation of an affordable apartment complex to low and moderate income families to be located at 449 Tyrella Avenue. The loan was funded by CDBG funds with 3.0 percent interest and a term of 55 years.
On April 22, 2014, the City awarded MP Tyrella Associates additional loans of $172,000 from CDBG funds and $653,000 from HOME funds to rehabilitate 56 existing rental units. The loan agreement for CDBG funds was executed on July 1, 2015, with 3.0 percent simple interest and is due in 50 years. The loan agreement from HOME funds was executed on July 1, 2015, with 3.0 percent simple interest and is due in 43 years.
On August 1, 2022, the City entered into anamended and restated secured promissory note agreement with MP Tyrella Associates and the loan funded by CDBG funds and HOME funds were amended to $819,000 and $771,000, respectively. The loan has a 3.0 percent interest and a term of 55 years. As of June 30, 2025, the total outstanding balance of all loans related to Tyrella Gardens is $1.6 million.
A. Current Interfund Balances
Current interfund balances arise in the normal course of business and are expected to be repaid shortly after the end of the fiscal year. As of June 30, 2025, there is no outstanding interfund balances.
B. Interfund Advances
Advances are not expected to be repaid within the next fiscal year. As part of the City’s capital projects budgeting and funding process, resources from enterprise funds are advanced to the General Capital Projects Fund where the project costs are budgeted for and incurred. These advances are reduced as funds are expended on enterprise fund projects. Any unspent advances will be repaid to the enterprise fund upon the completion of the projects. As of June 30, 2025, the General Capital Projects Fund has outstanding advances of $26.2 million, $32.9 million, and $654,000 from the Water, Wastewater, and Solid Waste enterprise funds, respectively.
C. Internal Balances
Internal balances are presented only in the government-wide financial statements. They represent the net receivables and payables remaining after the elimination of all such balances within governmental and business-type activities.
For the Year Ended June 30, 2025
With Council approval, resources may be transferred from one City fund to another. The purpose of the majority of transfers is to allocate resources from the fund that receives them to the fund where they will be spent without a requirement for repayment. Less often, a transfer may be made to open or close a fund.
Transfers between funds during the fiscal year ended June 30, 2025, are as follows (dollars in thousands):
Notes to Basic Financial Statements
For the Year Ended June 30, 2025
The purposes for these transfers are as follows:
A. To fund debt service payments.
B. To transfer remaining balances on completed capital improvement projects, interest back to original funding source, and other funds.
C. Recurring transfers for capital, operating costs, or equipment replacement.
All capital assets, including intangible assets, are valued at historical cost or estimated historical cost if actual historical cost is not available. Donated capital assets, donated works of art and similar items, and capital assets received in a service concession arrangement arevalued at their acquisitionvalue. The City defines capital assets as assets with an initial individual cost of more than $100,000 for land and infrastructure, $25,000 for buildings and improvements other than buildings, and $5,000 for others, and an estimated useful life in excess of two years.
Depreciation is provided using the straight-line method, which means the cost of the asset is divided by its expected useful life in years and the result is charged to expense each fiscal year until the asset is fully depreciated. The City has assigned the useful lives to capital assets as follows:
Buildings 25to50years
Improvementsotherthanbuildings 5to50years
Machineryandequipment 3to20years
Trafficsignals 20years
Streetlights 50years
Bridgesandculverts 60years
Sidewalks,curbs,andgutters 40years
Streetsandroads 40years
Intangibleright-to-useleaseassets 5years
Intangibleright-to-useSBITAassets 3to10years
Major outlays for capital assets and improvements are capitalized as projects are constructed.
For the Year Ended June 30, 2025
Capital assets activity for the fiscal year ended June 30, 2025, is as follows (dollars in thousands):
(31,747)(2,920) 1,499-(33,168)
(10,086)(625) --(10,711)
(7,341)(156) --(7,497)
(7,113)(312) --(7,425)
Sidewalks,curbsandgutters (84,390)(2,856) 49-(87,197)
Streetsandroads (198,869)(7,455) 22-(206,302)
Intangibleright-to-useleaseassets (660)(644) --(1,304)
Intangibleright-to-useSBITAassets (1,040)(815) 421-(1,434)
Totalaccumulateddepreciation/amortization (652,205)(30,502) 1,991-(680,716)
Netcapitalassetsbeingdepreciated/amortized 299,338(15,878) (31)13,067296,496
GovernmentalActivitiesCapitalAssets,Net $602,82537,923$ $(31)-$640,717 $
For the Year Ended June 30, 2025
A. Capital Asset Activities (Continued)
B. Depreciation Allocation
Depreciation expense is charged to functions and programs based on their usage of the related assets. The amounts allocated to each function for the fiscal year ended June 30, 2025,
thousands):
Notes to Basic Financial Statements
For the Year Ended June 30, 2025
The City has active construction projects that include land; improvements other than buildings; buildings; infrastructure; and water, wastewater, and solid waste improvements. Commitments for construction, as of June 30, 2025, are as follows (dollars in thousands):
SpentRemaining toDateCommitment
Governmentalactivities:
Totalgovernmentalactivities
Business-typeactivities:
Waterprojects
4,619
$150,36213,527 $
$20,401$1,042
Wastewaterprojects 17,609 1,698
SolidWasteprojects 875 3
$38,885$2,743
Commitments are funded from 1) revenues received directly by the capital projects fund and 2) general fund, special revenue fund and enterprise fund revenues transferred to the capital projects fund.
The Los Altos School District (LASD) intended to acquire an approximately 11.65-acre site (Property) within the City for the construction of a new school facility. Of the total site, 9.65-acre of the property (School Site) will be retained by LASD to develop as a school site and for joint use recreational purposes with the City. The remaining 2.0-acre open space (Open Space Park) is planned to be developed into a community park and recreational facilities. On December 11, 2018, the City Council authorized a contribution of $43.0 million toward the site acquisition, of which $23.0 million is for the School Site and $20.0 million is for the Open Space Park.
On July 16, 2019, the City executed a funding and joint use agreement with LASD outlining the City’s involvement in the development of the School Site and the opportunities for use of certain joint use recreational facilities during non-school days and non-school hours serving the community. During the year ended June 30, 2020, LASD acquired the Property and the City contributed $23.0 million to LASD.
On November 19, 2019, the City entered into a property transfer agreement where LASD agrees to transfer the title of the Open Space Park to the City upon the acquisition of the Property and the completion of pretransfer duediligence activities.AsofJune30,2025,pre-transfer due diligenceactivitieswere notcompleted and the $20.0 million payment made by the City for the Open Space Park was reported as deposits and prepaid items.
For the Year Ended June 30, 2025
The City generally incurs long-term debt to finance projects or purchase assets, which will have useful lives equal to or greater than the related debt. The City’s debt issues and other liability transactions are summarized below and discussed in detail thereafter.
Noncurrent liabilities activities for the fiscal year ended June 30, 2025, are as follows (dollars in thousands):
Governmentalactivities
RevenueBonds:
ShorelineRegionalParkCommunity2018 RevenueBondsSeriesA 5.0%,dueFiscalYear2048-49
ShorelineRegionalParkCommunity2018 RevenueBondsSeriesB 3.36%to4.24%,dueFiscalYear2031-3210,315
ShorelineRegionalParkCommunity2022 RefundingRevenueBondsSeriesA 4.83%,dueFiscalYear2039-40
ThechangeincompensatedabsencesliabilityispresentedasaNetChange
WastewaterDirectFinancingArrangement3.4%,dueFiscalYear2033-34
ThechangeincompensatedabsencesliabilityispresentedasaNetChange
For the Year Ended June 30, 2025
B. Descriptions of Noncurrent Liabilities
2018 Revenue Bonds Shoreline Regional Park Community - On December 19, 2018, the Shoreline Community issued 2018 Revenue Bonds, Series A (Tax-Exempt) and Series B (Taxable) (2018 Bonds) of $53.5 million and $10.3 million, respectively. Proceeds from the 2018 Bonds were used to provide funds to acquire and construct certain capital improvements of benefit to the Shoreline Community. The 2018 Bonds are special obligations of the Shoreline Community and are secured by a portion of all taxes levied upon all taxable property within the Shoreline Community. Principal payments are payable annually on August 1 and interest payments semiannually on August 1 and February 1 from property tax revenues generated within the Shoreline Community. The Shoreline Community is considered to be in default if the Shoreline Community fails to pay the principal of and interest on the outstanding bonds when they become due and payable. If an event of default has occurred and is continuing, the trustee may, and if requested in writing by the owners of a majority in aggregate principal amount of the bonds then outstanding, declare the accreted value and principal of the bonds, together with the accrued interest, to be due and payable immediately.
2022 Refunding Revenue Bonds Shoreline Regional Park Community - On November 22, 2022, the Shoreline Community issued the 2022 Bonds of $21.6 million through private placement. Proceeds from the 2022 Bonds were used to fully refund the outstanding 2011 Bonds of $21,100,000. The 2022 Bonds are special obligations of the Shoreline Community and are secured by a portion of all taxes levied upon all taxable property within the Shoreline Community. Principal payments are payable annually on August 1 and interest payments semi-annually on August 1 and February 1 from property tax revenues generated within the Shoreline Community. The refunding resulted in net present value savings of $1.1 million. The Shoreline Community is considered to be indefault if the Shoreline Community fails to paythe principal of and interest on the outstanding bonds when they become due and payable. If an event of default has occurred and is continuing, the trustee may, and if requested in writing by the owners of a majority in aggregate principal amount of the bonds then outstanding, declare the accreted value and principal of the bonds, together with the accrued interest, to be due and payable immediately.
Compensated Absences - Compensated absences are liquidated by the fund that has recorded the liability. The long-term portion of governmental activities compensated absences is liquidated by contributions from various funds, but primarily the General Fund.
Landfill Containment - The City is responsible for managing and controlling methane gas and containment of leachate at three former City-operated landfill sites.
Pursuant to a Postclosure Maintenance Plan filed with the State, the City is obligated for additional postclosure care costs for two of its landfill sites. The estimated costs of postclosure care are subject to changes such as the effects of inflation, revision of laws and other variables. The estimated amount of this obligation as of June 30, 2025, is approximately $48.0 million. Annual revenues from the Solid Waste Enterprise Fund will fund the postclosure care costs. In accordance with a State-mandated Financial Assurance Mechanism (FAM), the City has pledged Solid Waste Enterprise Fund revenues in the amount of $3.1 million as of June 30, 2025, for postclosure care costs on these two landfill sites. A third landfill site maintained by the City did not require a FAM to be established for the closure of the site and the City’s postclosure care cost is not estimable.
Notes to Basic Financial Statements
For the Year Ended June 30, 2025
B. Descriptions of Noncurrent Liabilities (Continued)
Claims Liabilities - The City has established various self-insurance programs to account for and finance its uninsured risks of loss. Estimated liabilities are recorded for claims when it is probable that a loss has occurred and the amount of the loss can be reasonably determined. Further discussion on the City’s claim liabilities and Risk Management is included in Note 10.
2004 Water Revenue Bonds - On September 29, 2004, the City issued $9.7 million of 2004 Water Revenue Bonds, 2004 Series A, to fund the construction of Graham Reservoir. Water fund revenues are pledged to pay the debt service on the bonds. Principal payments are payable annually on June 1 and interest payments semi-annually on June 1 and December 1 from Water Fund Revenues. The City is considered to be in default if the City fails to pay the principal of and interest on the outstanding bonds when they become due and payable and such default has continued for a period of thirty days. Upon the occurrence and during the continuance of any event of default, the trustee may, and upon written notice from the owners of amajority in aggregate principal amount of the bonds then outstanding, declare the principal of the bonds, together with the accrued interest, to be due and payable immediately.
City of Palo Alto Loan – The Cities of Palo Alto and Mountain View began a joint project to construct a reclaimed water pipeline (Project) in 2004. In October 2007, the City of Palo Alto approved a $9.0 million loan agreement with the State Water Resources Control Board (SWRCB) to finance a portion of the Project. Under the terms of the loan agreement, the Project received $7.5 million in proceeds. The additional $1.5 million due on the loan represents in-substance interest. Payments are due annually on the loan for twenty years following the completion of the construction. The City agreed to repay the City of Palo Alto a $6.0 million share of this loan to finance $5.0 million of the costs of the Project within the City under the same terms as the original loan agreement with SWRCB. The City will pay $300,000 annually for twenty years. The project has been completed and payments on the loan commenced on June 30, 2010. There are no acceleration provisions in the event of a payment default for this loan.
Wastewater Direct Financing Arrangement – On November 1, 2018, the City executed an Installment Sale Agreement between the City and the Financing Authority and an Assignment Agreement between the Financing Authority and Opus Bank to provide funds for Wastewater infrastructure capital projects. The financing arrangement is for up to $10.1 million with a maximum term of 15 years. Wastewater fund revenues are pledged to pay the debt service on the direct financing arrangement. Principal payments are payable annually on December 1 and interest payments semi-annually on June 1 and December 1 from Wastewater Fund Revenues. The City is considered to be in default if the City fails to pay the installment payments when they become due and payable. If an event of default has occurred and is continuing, the lender has the right to declare all unpaid installment payments, principal and accrued interest, to be due and payable immediately.
The pledge of future tax increment revenues ends upon repayment of the $137.0 million in remaining debt service on the Shoreline Community’s Revenue Bonds, which is scheduled to occur in Fiscal Year 2048-49. For the fiscal year ended June 30, 2025, tax increment revenues amounted to $73.2 million, which represented coverage of 12.6 over the $5.8 million in debt service.
Notes to Basic Financial Statements
For the Year Ended June 30, 2025
The pledgeof future waterfund revenuesends upon repayment ofthe $3.7 million in remaining debt service on the Water Revenue Bonds and City of Palo Alto Loan, which are both scheduled to occur in Fiscal Year 2028-29. For the fiscal year ended June 30, 2025, Water Fund revenues including operating revenues, nonoperating interest earnings, capital contributions – developer fees, and transfers in amounted to $51.1 million and operating expenses, excluding depreciation or amortization amounted to $38.1 million. Net Revenues available for debt service amounted to $13.0 million, which represented coverage of 14.0 over the $929,000 in debt service.
The pledge of future wastewater fund revenues ends upon repayment of the $7.7 million in remaining debt service on the Wastewater Direct Financing Arrangement, which are scheduled to occur in Fiscal Year 203334. For the fiscal year ended June 30, 2025, Wastewater Fund revenues including operating revenues, nonoperating interest earnings, capital contributions – developer fees, and transfers in amounted to $39.1 million and operating expenses, excluding depreciation or amortization amounted to $25.6 million. Net Revenues available for debt service amounted to $13.5 million, which represented coverage of 15.8 over the $852,000 in debt service.
Annual debt service requirements to maturity are as follows (dollars in thousands):
Business-typeActivities (ExcludingWastewater DirectFinancing Arrangement)
There are a number of limitations, covenants and restrictions contained in the various bond indentures. The City is in compliance with all material limitations, covenants and restrictions.
NOTE 8 PENSION PLANS
Plan Descriptions – All qualified regular and probationary employees are eligible to participate in either the City’s Miscellaneous (all other) or Safety (police and fire) plans (Plans), agent multiple-employer defined benefit
plans administered by CalPERS, which acts as a
and administrative agent for its participating member employers. Benefit provisions under the Plans are established by State statute and City resolution. CalPERS issues publicly available reports that include a full description of the pension plans regarding
and
information that can be found on the CalPERS website at www.calpers.ca.gov.
For the Year Ended June 30, 2025
A. General Information about the Pension Plans (Continued)
Benefits Provided – CalPERS provides service retirement and disability benefits, annual cost-of-living adjustments and death benefits to planmembers,who mustbe public employeesand beneficiaries.Benefits are based on years of credited service, age at retirement and compensation. The cost-of-living adjustments for the CalPERS plans are applied as specified by the Public Employees’ Retirement Law. The California Public Employees’ Pension Reform Act (PEPRA), which became effective in January 2013, changes the way CalPERS retirement and health benefits are applied, and places compensation limits on members. As such, members who established CalPERS membership on or after January 1, 2013 are known as “PEPRA” members.
The Plans’ provisions and benefits in effect as of June 30, 2025, are summarized as follows:
HireDate
Priorto Onorafter
January1,2013January1,2013
Benefitformula 2.7%55 2.0%@62
Benefitvestingschedule 5yearsservice5yearsservice
Benefitpayment MonthlyforlifeMonthlyforlife
HireDate
Priorto Onorafter
January1,2013January1,2013
Benefitformula 3%@50 2.7%@57
Benefitvestingschedule 5yearsservice5yearsservice
Benefitpayment MonthlyforlifeMonthlyforlife
Retirementage 50+ 50+
Employees Covered – Employees covered by the benefit terms for each Plan as of June 30, 2024, the most recent actuarial valuations information available, are as follows:
Notes to Basic Financial Statements
For the Year Ended June 30, 2025
Contributions – Section 20814(c) of the California Public Employees’ Retirement Law requires the employer contribution rates for all public employers to be determined on an annual basis by the CalPERS actuary and shall be effective on the July 1 following notice of a change in the rate. The actuarially determined rate is the projected amount necessary to finance the costs of benefits earned by employees during the year, with an additional amount to finance any unfunded accrued liability. The City is required to contribute the difference betweenthe actuariallydetermined rate andthe contribution rateof employees.For the purpose of increasing the funded status of the Plans, the City contributed $2.7 million and $1.6 million in excess of the actuarially determined contributions for the Miscellaneous and Safety Plans, respectively, during the fiscal year ended June 30, 2025.
The City’s net pension liability for each Plan is measured as the total pension liability, less the pension plan’s fiduciary net position. The net pension liability of each of the Plans is measured as of June 30, 2024, using an annual actuarial valuation as of June 30, 2023 using standard update procedures. A summary of principal assumptions and methods used to determine the net pension liability is shown below.
Actuarial Assumptions – The total pension liabilities in the June 30, 2023 actuarial valuations were determined using actuarial assumptions as follows:
MiscellaneousandSafetyPlans
ValuationDate June30,2023
MeasurementDate June30,2024
ActuarialCostMethod
ActuarialAssumptions:
ProjectedSalaryIncrease
PostRetirementBenefitIncrease
MortalityRateTable
Entry-AgeNormalCostMethod
VariesbyEntryAgeandService
ThelessorofcontractCOLAor2.30%until PurchasingPowerProtectionAllowanceFlooron purchasingpowerapplies,2.30%thereafter.
DerivedusingCalPERSmembershipData forallFunds(1)
(1)ThemortalitytableusedwasdevelopedbasedonCalPERS’specificdata.Theprobabilitiesofmortalityarebasedonthe 2021CalPERSExperienceStudyandReviewofActuarialAssumptions.Mortalityratesincorporatefullgenerationalmortality improvementusing80%ofScaleMP-2020publishedbytheSocietyofActuaries.Formoredetailsonthistable,pleaserefer tothe2021experiencestudyreportfromNovember2021thatcanbefoundontheCalPERSwebsite.
Allotheractuarialassumptions usedinthe June30,2023 actuarialvaluationwerebasedonthe2021 CalPERS Experience Study for the period from 2001 to 2019, including updates to salary increase, mortality and retirement rates. Further details of the 2021 CalPERS Experience Study can be found on the CalPERS website under Forms and Publications.
Change of Assumptions – There were no assumption changes in measurement period 2024.
For the Year Ended June 30, 2025
Discount Rate – The discount rate used to measure the total pension liability was 6.90 percent. The projection of cash flows used to determine the discount rate assumed that the contributions from plan members will be made at the current member contribution rates and that contributions from employers will be made at statutorily required rates, actuarially determined. Based on those assumptions, the plan’s fiduciary net position was projected to be available to make all projected future benefit payments of current plan members. Therefore, the long-term expected rate of return on plan investments was applied to all periods of projected benefit payments to determine the total pension liability.
The long-term expected rate of return on pension plan investments was determined using a building-block method in which expected future real rates of return (expected returns, net of pension plan investment expense and inflation) are developed for each major asset class.
In determining the long-term expected rate of return, CalPERS took into account both short-term and longterm market return expectations. Using historical returns of all of the funds’ asset classes, expected compound (geometric) returns were calculated over the next 20 years using a building-block approach. The expectedrate of return wasthen adjusted to account for assumed administrativeexpense of 10 basis points. The expected real rates of return by asset class are as follows:
(1)-Anexpectedinflationof2.30%usedforthisperiod.
(2)-Figuresarebasedonthe2021AssetLiabilityManagementstudy.
For the Year Ended June 30, 2025
The changes in the net pension liability for each Plan are as follows (dollars in thousands): Miscellaneous Plan:
Notes to Basic Financial Statements
For the Year Ended June 30, 2025 NOTE 8 PENSION PLANS(Continued)
Changes in the Net Pension Liability (Continued)
Sensitivity of the Net Pension Liability to Changes in the Discount Rate – The net pension liability of the City for each Plan, calculated using the discount rate for each Plan, as well as what the City’s net pension liability would be if it were calculated using a discount rate that is one percentage point lower or one percentage point higher than the current rate are as follows (dollars in thousands):
Pension Plan Fiduciary Net Position – Detailed information about each pension plan’s fiduciary net position is available in the separately issued CalPERS financial reports.
Pension Expenses and Deferred Outflows/Inflows of Resources Related to Pensions
For the fiscal year ended June 30, 2025, the City recognized pension expense of $25.1 million and $23.5 million for the Miscellaneous and Safety Plans, respectively.
The City reported deferred outflows of resources related to pensions by sources for the fiscal year ended June 30, 2025 as follows (dollars in thousands):
Miscellaneous Plan: Safety Plan:
DeferredDeferred OutflowsofInflowsof ResourcesResources
Pensioncontributionssubsequenttomeasurementdate $20,934-$
6,071-
$36,818-$ DeferredDeferred OutflowsofInflowsof ResourcesResources
Pensioncontributionssubsequenttomeasurementdate
$17,508-$ Differencesbetweenactualandexpectedexperience 4,940Changesinassumptions -Netdifferencesbetweenprojectedandactualearningsonplaninvestments 4,987-
Total $27,435-$
Total-AllPlans $64,253-$
For the Year Ended June 30, 2025
As of June 30, 2025, the City reported $20.5 million and $17.5 million as deferred outflows of resources related to contributions subsequent to the measurement date for the Miscellaneous and Safety Plans, respectively, whichwill be recognized as a reduction of the net pension liability in the fiscal year ending June 30, 2025. Net amounts reportedas deferred outflows of resources and deferred inflows of resources related to pensions will be recognized as pension expense are as follows (dollars in thousands):
Plan Descriptions – By Council resolution and through agreements with its labor units, the City provides certain health care benefits for retirees (spouse and dependents are not included for CalPERS Miscellaneous employees, but are included for CalPERS Safety employees in the CalPERS Health Program governed by the Public Employees’ Medical and Hospital Care Act (PEHMCA)) under a single employer defined benefit OPEB plan. In December 2008, the City entered into an agreement with CalPERS to participate in the CERBT, an agent multiple-employer other postemployment benefits plan, to fund the City’s OPEB. CERBT, administrated by CalPERS, is managed by an appointed board not under the control of the City Council. CERBT issues a publicly available financial report that can be found on the CalPERS website at www.calpers.ca.gov.
The City also offers a Defined Contribution (DC) Plan to eligible miscellaneous employees. If an employee elects to participate in the DC Plan, the City makes contributions on behalf of the employee into a Health Savings Account (HSA). Employees who have elected the DC Plan are not included in the City’s actuarial valuation for OPEB.
EmployeesCovered – Employees covered by the benefit terms asof June 30, 2024, the most recent actuarial valuations information available, are as follows:
For the Year Ended June 30, 2025
A. General Information about the OPEB Plan (Continued)
Benefits Provided – The City provides medical and vision OPEB benefits. The City provided OPEB by group and eligibility is as follows:
MVFFSafety POASafety
FireandPolice Managers
SEIUClericaland Technical
July1,1990through June30,2007
PriortoJuly1,1992100%ofsinglepremium
July1,1992andlater85%ofsinglepremium
85%ofsinglepremium
July1,2007 andlater* 85%ofsinglepremiumfor anyopenCityHMOplan
Priorto September1,1989 5 September1,1989 throughJune30,2007
July1,2007andlater*
Priorto September1,1989 5
September1,1989 throughJune30,2007
July1,2007andlater*
PriortoAugust1,19895
EAGLESand
Unrepresented
85%ofsinglepremiumfor anyopenCityHMOplan
PriortoMarch1,1993100%ofsinglepremium
March1,1993through June27,199885%ofsinglepremium
AfterJune27,1998
100%ofanysingleHMOpremium; 85%ofanysinglePPOpremium
85%ofsinglepremiumfor anyCityHMOplan
PriortoMarch1,1993100%ofsinglepremium
March1,1993andlater85%ofsinglepremium
15PriortoJanuary1,1997NoCoverageorBenefits
August1,1989through June30,2007 January1,1997 andlater
5,butless than10 50%ofsinglepremium 10,butless than15 65%ofsinglepremium
15ormore 85%ofsinglepremium
July1,2007andlater*15 Any 85%ofsinglepremiumfor anyopenCityHMOplan
Greater than5,but lessthan10
UnrepresentedJuly1,2024andlater* Atleast10 butlessthan 15
anyopenCityHMOplan
65%ofsinglepremiumfor anyopenCityHMOplan
15ormoreAny 85%ofsinglepremiumfor anyopenCityHMOplan
*ThefollowingemployeesmaywaivetheDefinedBenefitplanandinlieuwillbeenrolledintheDefinedContribution plan(describedabove):
▪Non-SwornPOAhiredJuly1,2015andlater
▪SEIUhiredJuly1,2010andlater
▪EAGLESandUnrepresentedhiredJuly1,2007andlater
Notes to Basic Financial Statements
For the Year Ended June 30, 2025
Contributions – The City’s OPEB funding policy is to contribute 100 percent or more of the actuarially determined contribution each year. For the fiscal year ended June 30, 2025, the City's contributions totaled $6.7 million, which is approximately $2.5 million above the actuarially determined contributions. This amount includes $2.0 million from the implied subsidy.
The City’snet OPEB liability ismeasuredasthetotalOPEB liability, lessthe OPEBplan’s fiduciarynet position. The net OPEB liability is measured as of June 30, 2024 using an annual actuarial valuation as of June 30, 2024.
Actuarial Assumptions – The total OPEB liability as of June 30, 2025 were determined using actuarial assumptions as follows:
ValuationDate
MeasurementDate
June30,2023
June30,2024
ActuarialCostMethod Entry-AgeNormalCostMethod
ActuarialAssumptions:
Healthcarecosttrendrates
6.0%in2026,fluctuatingdownto3.9%by2075
Mortality 2021CalPERSExperienceStudy
MortalityInprovement MWScale2022
(1) Demographic actuarial assumptions used are based on the 2021 CalPERS Experience Study for the period from 1997 to 2019, except for using the MacLeod Watts Scale 2022 applied generationally from 2015 as the basis to project future morality improvements.
Change in Assumptions – There were no changes in assumptions during measurement.
Discount Rate - The discount rate used to measure the total OPEB liability is 5.6 percent. The projection of cash flows used to determine the discount rate assumed that the City's contribution will be made equal to the actuarially determined contribution. Based on those assumptions, the OPEB plan's fiduciary net position was projected to be available to make all projected OPEB payments for current active and inactive employees. Therefore, the long-term expected rate of return on OEPB plan investments is applied to all periods of projected benefit payments to determine the total OPEB Liability.
For the Year Ended June 30, 2025
The long-term expected rate of return for OPEB plan investments is 5.60 percent. Using historical returns of all the funds’ asset classes, expected compound geometric returns were calculated over the short-term (15 years) and the long-term (6-20 years) using a building-block approach. The long-term expected real rate of return by asset class and the target allocation are as follows:
ToderivetheexpectedfuturetrustreturnspecificallyfortheCity,wefirstadjustedCalPERS' futurereturnexpectationstoalignwiththe2.5%generalinflationassumptionusedinthisreport. Thenapplyingtheplanspecificbenefitpayments(asdeterminedfromtheJune30,2023,valuation) toCalPERS'bifurcatedreturnexpectation,wedeterminedthesingleequivalentlong-termrateof returntobe6.2percent.TheDistrictislessoptimisticaboutfutureexpectedreturnsandapproved5.6%astheexpectedreturnonassets.
The changes in the net OPEB liability (asset) are as follows (dollars in thousands):
Notes to Basic Financial Statements
For the Year Ended June 30, 2025
C. Changes in the Net OPEB Liability (Asset) (Continued)
Sensitivity of the Net OPEB Liability (Asset) to Changes in the Discount Rate – The net OPEB liability of the City, calculated using the discount rate of 5.60 percent, as well as what the City’s net OPEB liability would be if it were calculated using a discount rate that is one percentage point lower or one percentage point higher than the current rate are as follows (dollars in thousands):
Sensitivity of the Net OPEB Liability (Asset) to Changes in the Healthcare Cost Trend Rates – The net OPEB liability of the City, as well as what the City'snet OPEB liability would be if it were calculated using healthcare cost trend rates that are one percentage point lower or one percentage point higher than the current rate are as follows (dollars in thousands):
OPEB Plan Fiduciary Net Position – Detailed information about the OPEB plan’s fiduciary net position is available in the separately issued CERBT financial report.
D. OPEB Expenses and Deferred Outflows/Inflows of Resources Related to OPEB
For the fiscal year ended June 30, 2025, the City recognized OPEB Expenses of $5.6 million.
The City reported deferred outflows of resources and deferred inflows of resources related to OPEB by sources for the fiscal year ended June 30, 2025 are as follows (dollars in thousands):
Notes to Basic Financial Statements
For the Year Ended June 30, 2025
As of June 30, 2025, the City reported$6.7 million as deferred outflows of resources related to contributions for OPEB subsequent to the measurement date, which will be recognized as a reduction of the net OPEB liability in the fiscal year ending June 30, 2026. Net amounts reported as deferred outflows of resources and deferred inflows of resources related to OPEB will be recognized as OPEB expense are as follows (dollars in thousands):
FiscalYear
EndingJune30
The City is exposed to various risks of loss related to torts, errors and omissions, injuries to employees or others, and unemployment. The City has established various self-insurance programs to account for and finance its uninsured risks of loss. Under the self-insurance programs, the City retains the risk of loss up to a maximum of $1.0 million for general liability and property claims, $750,000 for workers' compensation claims with statutory excess insurance and actual costs incurred for unemployment.
For general liability claims, the City has excess liability coverage through the Authority for California Cities Excess Liabilities (ACCEL) to cover the riskof loss for claims in excess of $1.0 millionper incident. ACCEL is a joint powers authority of medium-sized California municipalities, which pools catastrophic general liability, automobile liability and public officials’ errors and omissions losses. Amounts of settlements have not exceeded insurance coverage in the past three years.
Charges to the General Fund and other insured funds are determined from an analysis of self- insured claims costs and reserve requirements and are recorded as operating expenditures or expenses of such funds and operating revenues of the various internal service funds.
Estimated liabilities are recorded for claims in cases where such amounts are reasonably determinable and where the liability is likely for claims which are incurred through the end of the fiscal year but not reported until after that date. The estimated liability is determined based upon historical claims data discounted at 2.0 percent annually and independently determined estimates of the amounts needed to pay prior and current year claims.
Notes to Basic Financial Statements
For the Year Ended June 30, 2025
Changes in accrued self-insurance claims for the fiscal year ended June 30 are as follows (dollars in thousands):
The City has not significantly reduced its insurance coverage from the prior fiscal year. Furthermore, settlements have not exceeded insurance coverage for the past three fiscal years.
The City entered into various lease agreements as either a lessor or lessee for land, equipment, and other asset classes. As a lessee, the City is required to recognize a lease liability and an intangible right-to-use lease asset. As a lessor, the City is required to recognize a lease receivable and a deferred inflow of resources. The City defines leases as balances with an initial individual value of more than $200,000.
As a lessor, the City entered into lease agreements with various lease terms. Most leases include periodic adjustments to the lease amount at determined intervals. For the year ended June 30, 2025, the City received an immaterial amount of variable and other payments from the lease arrangements.
Information about lease revenues and interest revenues recognized during the year ended June 30, 2025, as well as lease receivable and lease related deferred inflows of resources as of June 30, 2025 are as follows (dollars in thousands):
For the Year Ended June 30, 2025
A. City as Lessor (Continued)
The annual lease receipt schedule for the lease receivables is as follows (dollars in thousands):
B. City as Lessee
As a lessee, the City entered into lease agreements with various lease terms. For the year ended June 30, 2025, the City had not paid any variable and other payments for the lease arrangement. As of June 30, 2025, the leased liabilities balance was $3.3 million.
The annual debt service requirement for the leases liabilities is as follows (dollars in thousands):
For the Year Ended June 30, 2025
SFX Entertainment, Inc. ‐ On May 10, 2006, the City, the Shoreline Community, and SFX Entertainment, Inc. (SFX), wholly owned by Live Nation, entered into an Amended and Restated Amphitheatre Ground Lease Agreement (Agreement) for the period from March 15, 2006 through December 31, 2020. SFX excised the first five-year option to extend the lease with an expiration date of December 31, 2025. A second five-year option is at the discretion of the City. The lessee is required to pay annual base rent to the City, due in nine equal installments in the months of April through December. Beginning March 15, 2018, the lease payment shall increase 2.0 percent annually. As of June 30, 2025, the amount of lease receivable is $12.2 million.
Google LLC. (Google) - On March 7, 1995, the City, as lessor, entered into a 55-year lease with Silicon Graphics, Inc. (SGI), an entity not affiliated with the City (1995 Lease). This lease provides for the rental of City land located within the Shoreline Community upon which SGI constructed a 500,000 square foot corporate campus. On December 12, 1996, the City, as lessor, entered into another 55-year lease with SGI (1997 Lease). This lease provides for the rental of City land located within the Shoreline Community upon which SGI constructed a second 556,000 square foot facility. On April 19, 2001, SGI assigned the two lease agreements described above to Goldman Sachs, Inc., an entity not affiliated with SGI or the City. Goldman Sachs assigned the agreements to WXIII/Crittenden Realty C, LLC on May 22, 2001, which assigned the agreements to Google on June 29, 2006. The 1995 Lease and 1997 Lease provide for rent increases of 4.0 percent per annum and the rent is to be adjusted every 10 years to the greater of 6.0 percent of the then fair value of the property or the initial base rent. As of June 30, 2025, the amount of lease receivable for the 1995 Lease and 1997 Lease are $261.6 million and $287.3 million, respectively.
On August 31, 2007, the City, as lessor, entered into a 55-year lease with Google (2007 Lease). The lease provides for rent increases of 3.0 percent per annum and the rent is to be adjusted every 10 years to the greater of 7.0 percent of the then fair value of the property or the initial base rent. The revalued monthly rent shall not exceed 165.0 percent of the monthly rent payable during the initial year of the prior escalation period. As of June 30, 2025, the amount of lease receivable for the 2007 Lease is $108.6 million.
In Fiscal Year 2017-18, the City Council approved the development for the Charleston East site and approved the sublease of Parking Lots C & D between Google and SFX through December 31, 2025 to provide temporary parking space during the Charleston East Site construction. In exchange for the City’s consent to accept the sublease between Google and SFX, starting January 1, 2021, the City receives payment of $2.3 million annually with annual adjustments of 4% through December 31, 2025. On June 29, 2024, an amendment was signed and starting July 1, 2024, the City receives payment of $930,000 annually with annual adjustments of 2% through December 31, 2025. As of June 30, 2025, the amount of lease receivable is $480,000.
Notes to Basic Financial Statements
For the Year Ended June 30, 2025
NOTE 11 LEASES (Continued)
C. Significant Lease Arrangements (Continued)
MV 101 Development, LLC - On April 1, 2015, the City, as lessor, entered into a DDA and a 55-year ground lease with MV 101 Development, LLC, (MV 101), an entity not affiliated with the City. The DDA provides for the development of 6.69 acres of land owned by the City, at 750 Moffett Boulevard, commonly referred to as Ameswell (formerly Moffett Gateway) in conjunction with adjacent land formerly owned by Caltrans and acquired by MV 101, with a hotel, office building and joint parking structure. The ground lease provides for the rental of the City land for 55 years with four 10-year extensions. The agreement also provides for office building minimum rent upon the issuance of a building permit at $140 per buildable square foot at 5.0 percent of the fair value of the land, with increases of 3.0 percent per annum. Commencing with the 16th operating year and every 10 years thereafter, the building minimum base rent shall be increased or decreased to the current market rate based on 5.0 percent of the then current fair value of the property or the initial base rent, whichever is higher and adjusted thereafter by the annual CPI. As of June 30, 2025, the amount of lease receivable is $61.7 million.
NOTE 12 SUBSCRIPTION-BASEDINFORMATION TECHNOLOGY
The City entered into various agreements for SBITA. The City is required to recognize a SBITA liability and an intangible right-to-use SBITA asset. The City defines SBITA as balances with an initial individual value of more than $200,000.
For the year ended June 30, 2025, the City had not paid any variable and other payments for the SBITA. As of June 30, 2025, the SBITA liabilities balance was $4.9 million.
The annual debt service requirement for the SBITA liabilities is as follows (dollars in thousands):
GovernmentalActivities
Axon Enterprise Inc
In Fiscal year 2024-25, the City entered into an agreement with Axon Enterprise Inc. (Axon) for the purchase and use of Axon devices and services, whichincludes hardware provided by Axon and Axon’s web and cloud services, as well asother professional services. The term of the agreement is10 yearswith anadditional5-yearextension. The annual payment ranges from $390,000 to $429,000. The SBITA asset and liability related to the Axon agreement is $4.9 million. As of June 30, 2025, the amount of SBITA liability is $4.6 million.
For the Year Ended June 30, 2025
Net position is the excess of all assets and deferred outflows of resources over all liabilities and deferred inflows of resources, regardless of fund. Net position is divided into three captions on the Statement of Net Position. These captions apply only to net position, which is determined at the Government-wide level and proprietary funds and are described as follows:
Net investment in capital assets – This caption groups all capital assets, including infrastructure, into one component of net position. Accumulated depreciation and the outstanding balances of debt, including debt related deferred outflows and inflows of resources that are attributable to the acquisition, construction or improvement of these assets reduce the balance in this category.
Restricted – This caption represents net position, which is restricted as to use by the terms and conditions of agreements with outside parties, governmental regulations, laws or other restrictions which the City cannot unilaterally alter. These principally include developer fees received for use on capital projects, grant funds, funds restricted fordebt service, and funds restricted to low and moderate income housing purposes.
Unrestricted – This caption represents net position of the City not restricted for any project or purpose.
Governmental fund balances represent the assets and deferred outflows of resources less the liabilities and deferred inflows of resources of each fund. Governmental funds report fund balance in classifications based primarily on the extent to which the City is bound to honor constraints on how specific amounts in the funds can be spent. For programs with multiple funding sources, the City prioritizes and expends funds in the following order: Restricted, Committed, Assigned and Unassigned. Each category in the following hierarchy is ranked according to the degree of spending constraint as follows:
Nonspendable fund balances are amounts that cannot be spent because they are either (a) not in spendable form; or (b) legally or contractually required to be maintained intact.
Restricted fund balances have external restrictions imposed by creditors, grantors, contributors, laws, regulations, or enabling legislation, which requires the resources to be used only for a specific purpose. Nonspendable amounts subject to restrictions are included along with spendable resources.
Committed fund balances have constraints imposed by resolution of the City Council, which may only be altered by resolution of the City Council. Nonspendable amounts subject to Council commitments are included along with spendable resources.
Assigned fund balances are amounts constrained by the City’s intent to be used for a specific purpose, but are neither restricted nor committed. Intent is expressed by the City Council or its designees and may be changed at the discretion of the City Council or its designees. The City Council has not delegated the authority to make assignments of fund balance. This category also includes residual fund balances of Special Revenue, Capital Projects and Debt Service Funds, which have not been restricted or committed.
Unassignedfundbalancerepresentsresidualamountsthathavenot been restricted, committedor assigned. This includes the residual general fund balance and residual fund deficits, if any, of other governmental funds.
For the Year Ended June 30, 2025
B. Fund Balances (Continued)
For the Year Ended June 30, 2025
The City Council adopted reserve policies and additional council actions which includes commitments of fund balances as follows:
1. The Development Services fund balances shall be used to fund the future obligations of the City’s development activity.
2. The General Fund Budget Contingency Reserve shall be used to provide one-timefinancial resources during uncertain economic conditions. This reserve may be used for such things as the transitioning of positions to be eliminated, the phasing out of certain expenditures, smoothing of employee benefit changes, or anticipated or unanticipated revenue declines, as approved by City Council.
3. The General Fund Earned Lease Revenue Reserve Shall be used to accumulate the rent from the ground lease of a portion of the City’s Charleston East property to Google LLC (Google). Google prepaid $30.0 million as rent for the initial approximately 52-year lease term. The intent is for this reserve to accumulate the rent, as it is earned, to fund one-time expenses of the City.
4. The General Fund Property Management Reserve shall be used to provide a source of funds for obligations, which could arise from the City's leasing of property including legal services, certain responsibilities identified in land leases, environmental testing, or other costs normally incurred by a lessor.
5. The Graham Site Maintenance Reserve shall be used to fund the maintenance obligations, per the agreement with the school district, of the Graham Sports Complex, including the playing field at Graham Middle School beneath which the City has a reservoir.
6. The General Fund Transportation Reserve shall be used for the purpose of major priority transportation projects to mitigate traffic congestion, improve infrastructure, and meet the needs of the City, as authorized by the City Council.
7. The General Fund Capital Improvement Reserve, to be funded with a goal of a minimum balance of $5,000,000, shall be used for the funding of unanticipated priority capital improvement projects authorized by the City Council. To the extent possible, General Operating Fund carryovers remaining from the end of the fiscal year, not designated for other reserve purposes, may be applied to this reserve.
8. The General Fund Open Space Acquisition Reserve shall be used for the purpose of acquiring open space to meet the needs of the City and as authorized by the City Council. Proceeds from excess City-owned properties shall fund this reserve as directed by City Council.
9. The General Fund Strategic Property Acquisition Reserve shall be used for the purpose of setting aside specific funds for the City to use for the acquisition of strategic property(ies).
10. The Childcare Commitment Reserve shall be used to fund low-income subsidies for Childcare.
11. The Compensated Absences Reserve shall fund the disbursements of terminated or retired employees for accrued vacation and sick leave or other accrued leave as applicable. This Reserve shall be funded at a minimum of 80.0% of the accrued liabilities of the City for compensated absences such as vacation and vested sick leave.
Notes to Basic Financial Statements
For the Year Ended June 30, 2025
(Continued)
12. The Parental Leave Reserve will be reviewed annually and maintained at a level adequate to meet estimated benefit liabilities.
13. The Employee Loan Reserve shall be used to provide a source of funds for the employee homebuyer and relocation assistance programs administrated by Council Policy D-13
14. The General Special Purpose Reserve is designated for resources the City has received to be spent on specific purposes, such as revenue received from the Tree Mitigation Fees, which shall be used for tree planting-related expenses.
15. The Shoreline Golf Links Reserve shall be used to fund Shoreline Golf Links and related golf course operations and improvements.
The City’s Financial and Budgetary Policy requires the City to strive to maintain the following fund balances/net position:
1. The General Fund Reserve at 20 to 25 percent of General Fund appropriations.
2. The General Fund Capital Improvement Reserve to be funded with a goal of a minimum balance of $5.0 million.
3. The Compensated Absences Reserve shall be funded at a minimum of 80 percent of the accrued liabilities of the City for compensated absences such as vacation and vested sick leave.
4. The Shoreline RegionalPark Community SpecialRevenue Fund shallmaintain areserveof25 percent of operating expenditures; the landfill reserve shall be incrementally increased to accumulate funds to rebuild the landfill system based on the most recent Landfill Master Plan. The reserve shall have adequate balance to rebuild the landfill system, in case of a catastrophic event; and the sea level rise reserve is to be incrementally increased to accumulate funds for projects identified in the most recent Shoreline Sea Level Rise Study. The contributed amount shall be determined annually based on the available resources,timeline of the projects, and results of the Shoreline Sea Level Rise Study.
5. The Enterprise Fund Reserves shall maintain a minimum 10 percent of operating budget for emergency, a minimum of 5 percent operating budget for contingency and a goal of 10 percent of operating budget for rate stabilization.
6. The Equipment Replacement Reserve shall be maintained to fund the replacement of capital equipment.
7. The Workers’ Compensation Self-Insurance Reserve shall be maintained at 70 percent confidence level for the projected liabilities as determined by an actuarial valuation to be conducted at least once every three years.
Notes to Basic Financial Statements
For the Year Ended June 30, 2025
NOTE 13 NET POSITION AND
(Continued)
D. Minimum Fund Balance / Net Position Policies (Continued)
8. The Liability Self-Insurance Reserve shall be maintained at a 70 percent confidence level for the projected liabilities as determined by an actuarial valuation to be conducted at least once every three years.
9. The Unemployment Self-Insurance Reserve and the Employee Benefit Plan Reserve shall be reviewed annually and maintained at a level adequate to meet estimated benefit liabilities.
In 2013, CalRecycle regulations required the City to create a reserve, in whole or incrementally, for potential corrective actions associated with a non-water release event at the landfill site. The estimated costs of the corrective actions are adjusted annually by an inflation factor approved by CalRecycle. On June 25, 2013, the City Council approved to restrict funds for landfill containment in the Landfill reserve of the Shoreline Community Fund. The City estimated the costs for the corrective actions to be $1.2 million for the fiscal year ended June 30, 2025, and $13.0 million to rebuild a new landfill system. As of June 30, 2025, the City restricted $13.0 million for landfill containment and planned to increase the balance to accumulate funds to rebuild the landfill system based on the most recent Landfill Master Plan.
NOTE 14 COMMITMENTSANDCONTINGENCIES
A. Encumbrances
The City’s outstanding encumbrances as of June 30, 2025, are as follows (dollars in thousands):
Assigned
B. Litigation
The City is a defendant in several lawsuits and other matters arising in the normal course of operations. The City's management and legal counsel are of the opinion the potential claims against the City not covered by insurance resulting from such litigation would not materially affect the financial position of the City. FundBalance AmountClassification
Notes to Basic Financial Statements
For the Year Ended June 30, 2025
The City of Mountain View conveys all of its wastewater for treatment to the Palo Alto Regional Water Quality Control Plant (Treatment Plant) owned and administered by the City of Palo Alto. The Treatment Plant is governed by a Partners Agreement between the City of Palo Alto, the City of Mountain View, and the City of Los Altos. As part of the Agreement, the City purchases treatment capacity at the Treatment Plant. The Agreement provides that the City will purchase capacity through December 31, 2060, and for the City of Palo Alto to set service charges annually with quarterly billings based on estimated use. A reconciliation of actual to estimated charges is completed annually. For the fiscal year ending June 30, 2025, these costs totaled $16.4 million, which is included as a component of cost of sales and services expenses in the Wastewater Enterprise Fund.
The Agreement has been amended from time to time. Recent addenda include provisions for large capital improvement projects at the treatment plant and a portion of the Joint Interceptor System for which debt was issued by the City of Palo Alto and the Partners agreed to pay their share of debt based on capacity rights. Each Partner’s share of debt is included in the annual budget provided by the City of Palo Alto and is billed through the quarterly billings. For the fiscal year ended June 30, 2025, the City’s share of debt services totaled to $624,000.
On May 19, 2025, the City executed an amendment with the City of Palo Alto for the Advanced Water Purification System (AWPS) Construction project. The total project cost is approximately $60.0 million, with the City agreeing to contribute $22.0 million asa cashpayment to helpreduce the debt. Ofthis,$17.0 million will be paid in Fiscal Year 2025-26, and the remaining $5.0 million is anticipated to be paid in Fiscal Year 2026-27.
Palo Alto has applied for a State Revolving Fund (SRF) loan and plans to use between $10.5 million to $12.9 million, depending on the status of a separate U.S. Bureau of Reclamation grant fund for the project, with an interest rate of 1.7%. Loan payments are expected to begin after the project is completed, around Fiscal Year 2027-28, and the debt payments will be included in the City of Palo Alto's quarterly billings.
During Fiscal Year 1992-93, the City entered into a Memorandum of Understanding (MOU) with the City of Sunnyvale to obtain solid waste and recycling services at the SMaRT® Station. The MOU provides that the City has a capacity share of 23.45 percent of this facility for 30 years which expired during Fiscal Year 202122.The City entered into anew MOUwith the City of Sunnyvale with an effectivedate of December22, 2021 and termination date of December 31, 2036. Annual service charges are determined based on actual perton charges. For the fiscal year ended June 30, 2025, these costs totaled $8.0 million.
Notes to Basic Financial Statements
For the Year Ended June 30, 2025
On June 30, 2013, the Shoreline Community entered into an Education Enhancement JPA with the Mountain View Los Altos Unified High School District (MVLAUHSD) and the Mountain View Whisman School District (MVWSD) effective July 1, 2013, for a period of 10 years, superseding any prior agreements dating back to the first such agreement in 2006. The purpose of the Education Enhancement JPA is to create an Education Enhancement Reserve in which funds provided by the Shoreline Community are used to enhance the educational and technology capacity of students in the districts, which will contribute to the availability of a local technology workforce to further the objectives of the Shoreline Community. The agreement provides for minimum annual payments, which commenced with the fiscal year ended June 30, 2014, and have increased annually based on growth in property tax revenues in the preceding fiscal year. Each subsequent fiscal year increases based on growth in property tax revenues in the preceding fiscal year. The Agreement expired in June 2023. In May 2023, the Shoreline Community and the school districts extended the Agreement until June 30, 2024. An amendment to the 2023 EER Agreement, dated June 13, 2024, for a three-year extension was finalized in October 2024. In May 2025, a new EER Agreement was executed by all parties to supersede any prior agreements and will remain effective through June 30, 2035.
For the fiscal year ended June 30, 2025, the Shoreline Community paid a total of $12.0 million in contributions to the school districts, including $7.3 million to MVWSD and $4.7 million to MVLAUHSD.
Pursuant to an agreement between the City, the Shoreline Community, and the County dated June 22, 2005, the Shoreline Community is annually obligated to pay the County from tax revenues, an amount equal to the County’s total retirement tax override levies and pass-through an additional amount of taxes that would have been allocated to the County in the absence of the existence of the Shoreline Community. For the fiscal year ended June 30, 2025, $2.8 million and $3.5 million in retirement tax override levies and pass-through payments, respectively, were paid to the County.
The City contractswiththeCity and Countyof SanFranciscofor the purchaseofwater from the HetchHetchy System operated by the San Francisco Public Utilities Commission (SFPUC). The City is also a member of the Bay Area Water Supply and Conservation Agency (BAWSCA), which represents the interests of all the 24 cities and water districts, as well as two private utilities, that purchase wholesale water from the SFPUC.
Under the 2009 25-year agreement with the SFPUC, a minimum water delivery level is included. On June 21, 2017, the City entered an agreement to permanently transfer all rights, title and interest of 1.0 MGD of annual Individual Supply Guarantee to the Cityof EastPalo Alto (EPA). After SFPUC approvedthe agreement, the City received a one-time payment of $5.0 million in Fiscal Year 2017-18 from EPA for the 1.0 MGD water rights. During the Fiscal year 2024-25 the SFPUC and a supermajority of the BAWSCA member agencies ratified the minimum purchase requirements and as a result of this ratification the City is no longer required to make minimum water purchase.
Notes to Basic Financial Statements
For the Year Ended June 30, 2025
G. Bay Area Water Supply and Conservation Agency Revenue Bonds Surcharge (Continued)
In addition, under the agreement, the SFPUC issues revenue bonds and the debt service (which also includes an interest component) is paid for through rates over the life of the bonds. Prior assets under the previous agreement were transferred to the new agreement and assigned a life with an agreed upon rate of return of 5.13 percent.
BAWSCA issued Revenue Bonds (Bonds) in the principal amount of $335.8 million in January 2013 to prepay the capital cost recovery payment obligation and fund a stabilization fund. The Bonds mature in October 2034 and are secured by surcharges to the monthly water purchase charges imposed upon the participating members. The Bonds are not a debt obligation of any member, and BAWSCA’s failure to pay its Bonds would not constitute a default by any participating member.
The City paid its surcharge of $1.2 million during the fiscal year ended June 30, 2025, which is included as a component of cost of sales and services expenses in the Water Enterprise Fund. The surcharge for Fiscal Year 2025-26 is estimated to be $1.4 million.
In 1992, as a way of solving its own budget shortfalls, the State enacted legislation that shifted partial financial responsibility for funding K-14 education to local government. Property tax revenues belonging to cities, counties, and special districts were shifted to the Education Revenue Augmentation Fund (ERAF). When the State shifts more local property tax than required, these funds are returned to cities, counties and special districts and are known as excess ERAF.
In November 2021, the County notified cities that the California School Boards Association and its Education Legal Alliance filed a lawsuit against the Controller of the State of California (SCO), disputing the calculation and disbursement of excess ERAF funds. As a result, the County estimates that 20 to 30 percent of ERAF disbursed to all cities over three years is subject to litigation. This case has since been resolved in favor of the SCO.
The City’s primary concern now is the County’s upcoming audit with the SCO, expected to take place in late 2025 or early 2026, following the conclusion of the SCO’s audit of San Francisco. The County has strongly encouraged each agency to reserve a portion of its excess ERAF distributions going back to Fiscal Year 202021. The estimated at-risk percentages, based on the completed SCO audit findings for Marin County, are:
Fiscal Year 2020-21 through 2023-24: 22%
Fiscal Year 2024-25: 20%
Fiscal Year 2025-26: 18%
The City estimates that approximately $9.0 millionis at risk as of June 30, 2025. ERAF revenue for Fiscal Year 2025-26 is projected to be $9.8 million, net of the 18% at-risk amount.
The City has currently set aside $2.7 million as a liability for the potential ERAF clawback. Combined with the eligible $9.8 million in ERAF revenue the City is projected to receive for fiscal year 2025-26, the City would have $3.5 million more than the potential clawback amount, assuming the SCO audit does not conclude in the City’s favor.
For the Year Ended June 30, 2025
A. Restatements due to the implementation of GASB Statement No. 101, Compensated Absences
For the year ended June 30, 2025, the City implemented GASB Statement No. 101, Compensated Absences, which requires recognition of a liability as leave is earned and likely to be used or paid. Adoption of this Statement will enhance the relevance and reliability of information about the liability for compensated absences. The implementation represents a change in accounting principle and resulted in a restatement of the opening balance of compensated absences reported in the Statement of Net Position. This change affected the compensated absence line item within Governmental and Business Type Activities as well as Water, Wastewater, Solid Waste and Internal Services funds to reflect previously unrecognized liabilities, and the opening balance net position was restated retrospectively as presented above.
B. Restatements due to Change in Reporting Entity
During the fiscal year 2024-25 the City changed reporting of Flexible Benefits Plan from Custodial Funds to General Fund.Asa result,the beginningrestrictedcashandaccountspayableincreasedby$177,000 respectively in the General Fund and restricted cash and accounts payable by decreased by the same amounts in the Flexible Benefits Plan. There was no overall impact on the Net position of the General Fund. However, this led to a decrease in the beginning net position of the total Custodial Funds which was overstated by $177,000 in the previous year.
This page intentionally left blank
Required Supplementary Information
For the year ended June 30, 2025 (Dollars in Thousands)
Schedule of Changes in the Net Pension Liability and Related Ratios - Miscellaneous Plan Last Fiscal 10 Years*
NET POSITION
Notes to the Schedule:
BenefitChanges-Thefiguresabovegenerallyincludeanyliabilityimpactthatmayhaveresultedfromvoluntarybenefitchanges thatoccurredonorbeforetheMeasurementDate.However,offersofTwoYearsAdditionalServiceCredit(a.k.a.Golden Handshakes)thatoccurredaftertheValuationDatearenotincludedinthefiguresabove,unlesstheliabilityimpactisdeemedtobe materialbytheplanactuary.In2022,SB1168increasedthestandardretireelumpsumdeathbenefitfrom$500to$2,000forany death occurring on or after July 1, 2023. The impact, if any, is included in the changes of benefit terms.
Changeinassumptions-Duringmeasurementperiod2014,thediscountratewas7.50%.Duringmeasurementperiod2015,the discountratewasincreasedfrom7.50%to7.65percent.Thereisnochangeindiscountrateduringmeasurementperiod2016. Duringmeasurementperiod2017,thediscountratewasreducedfrom7.65%to7.15percent.Duringmeasurementperiod2018, demographicassumptionsandinflationratewerechangedinaccordancetothe2017CalPERSExperienceStudy.Therewereno changesinassumptionsduringmeasurementperiods2019,2020,and2021.Duringmeasurementperiod2022,thediscountrate wasreducedfrom7.15%to6.90%,inflationratewasreducedfrom2.50%to2.30%,anddemographicassumptionswerechangedin accordance with the 2021 CalPERS Experience Study. There were no assumption changes in 2023 or 2024.
Required Supplementary Information
For the year ended June 30, 2025 (Dollars in Thousands)
Schedule of Changes in the Net Pension Liability and Related Ratios - Safety Plan Last Fiscal 10 Years*
Notes to the Schedule:
BenefitChanges-Thefiguresabovegenerallyincludeanyliabilityimpactthatmayhaveresultedfromvoluntarybenefitchanges thatoccurredonorbeforetheMeasurementDate.However,offersofTwoYearsAdditionalServiceCredit(a.k.a.Golden Handshakes)thatoccurredaftertheValuationDatearenotincludedinthefiguresabove,unlesstheliabilityimpactisdeemedto bematerialbytheplanactuary.In2022,SB1168increasedthestandardretireelumpsumdeathbenefitfrom$500to$2,000for any death occurring on or after July 1, 2023. The impact, if any, is included in the changes of benefit terms.
Changeinassumptions-Duringmeasurementperiod2014,thediscountratewas7.50%.Duringmeasurementperiod2015,the discountratewasincreasedfrom7.50%to7.65%.Thereisnochangeindiscountrateduringmeasurementperiod2016.During measurementperiod2017,thediscountratewasreducedfrom7.65%to7.15%.Duringmeasurementperiod2018,demographic assumptionsandinflationratewerechangedinaccordancetothe2017CalPERSExperienceStudy.Therearenochangein assumptionsduringmeasurementperiods2019,2020,and2021.Duringmeasurementperiod2022,thediscountratewasreduced from7.15%to6.90%,inflationratewasreducedfrom2.50%to2.30%,anddemographicassumptionswerechangedinaccordance with the 2021 CalPERS Experience Study. There were no assumption changes in 2023 or 2024.
Required Supplementary Information
For the year ended June 30, 2025 (Dollars in Thousands)
Schedule of Employer Pension Contributions - Miscellaneous and Safety Plans
Fiscal Year Ended June 30, Miscellaneous
Fiscal Year Ended June 30,
The actuarial methods and assumptions used to set the actuarially determined contributions for the fiscal year ended June 30, 2025 were as follows:
ADC for fiscal year
Actuarial valuation date
Actuarial cost method
June 30, 2025
June 30, 2023
Entry-Age Normal Cost Method Asset valuation method
value of assets
by entry age and services
Investment rate of return
Retirement age
Mortality improvement
6.80%, net of pension plan investment and administrative expenses, includes inflation.
The probabilities of retirement are based on the 2021 CalPERS Experience Study.
The probabilities of mortality are based on the 2021 CalPERS Experience Study.
Required Supplementary Information
For the year ended June 30, 2025 (Dollars in Thousands)
Schedule of Changes in the Net OPEB Liability and Related Ratios
Changeinassumptions-Duringmeasurementperiod2019,thediscountratewasreducedfrom6.50percentto6.25percent.Demographic assumptionswerechangeinaccordancetothe2017CalPERSExperienceStudy.Thereisnochangeinassumptionsduringmeasurementperiod 2020.Duringthemeasurementperiod2021,thediscountratewasreducedfrom6.25percentto6.00percent.Inflationratewasreducedfrom2.75 percentto2.50percent.Otherassumptionsincludingprojectedsalaryincrease,postretirementbenefitincrease,andotherdemographic assumptionswerealsochanged.Duringthemeasurementperiod2022,thediscountratewasreducedfrom6.00percentto5.60percent.During themeasurementperiod2023,thehealthcarecosttrendrateschangedto6.5%in2025,fluctuatingdownto3.9%by2075andinvestmentrateof return reduced from 6.00% to 5.60%. For FY 2025 no assumptions were changed.
*Fiscal year ended June 30, 2018 was the first year of implementation of GASB Statement No. 75, therefore only eight years of information is shown.
Required Supplementary Information
For the year ended June 30, 2025 (Dollars in Thousands)
Schedule of Employer OPEB Contributions Fiscal Year Ended June 30,
The actuarial methods and assumptions used to set the actuarially determined contributions for the fiscal year ended June 30, 2025 were as follows:
ADC for fiscal year
Actuarial valuation date
Actuarial cost method
June 30, 2025
June 30, 2023
Entry-Age Normal Cost Method Asset valuation method
value of assets
Post Retirement Benefit Increase
Mortality
Mortality Improvement
For medical plan premiums: 6.0% for the year beginning, fluctuating down to 3.90% by 2075
Based on 2021 CalPERS Experience Study
Based on MacLeod Watts Scale 2022
This page intentionally left blank
This page intentionally left blank
Schedule of Revenues, Expenditures and Changes in Fund Balances - Budget and Actual
Park Land Dedication Capital Project
For the year ended June 30, 2025 (Dollars in Thousands)
This page intentionally left blank
June 30, 2025
The Gas Tax Fund accounts for gas tax revenues received from the State and expended for construction and maintenance of City streets.
TheOtherStreetsandTransportationFund(FormerlyVehicleRegistrationFeesFund)accountsforfeesthatvoters approvedtocollectfromvehicleregistrationsaccountsforvotersapprovedvehicleregistrationsfeesandsalestaxesused to fund local road improvements and repairs, and enhance transit, highways, expressways and active transportation.
The Construction Tax Fund accounts for revenues from excise tax imposed on the construction of buildings and mobile homelotsforthesolepurposeofraisingrevenueformunicipalpurposes.Theserevenuesareusedforacquisition, improvement, maintenance, expansion or implementation of the Capital Improvements Program.
The Other Developer Fees Fund accounts for revenues to be used to encourage development and rejuvenation of areas served by transit facilities.
The CSFRA / Rental Housing Committee Fund accounts for the activities related to stabilize rents and provide just cause eviction protections for certain rental units in the City.
The Mobile Home Rent Stabilization Ordinance Fund accounts for the activities related to stabilize rents and protect the rights for both the mobile home residents and the mobile park owners in the City.
The Housing Successor Fund accounts for the activities related to the housing assets assumed by the City as Housing SuccessortotheformerRevitalizationAuthority.TheactivitiesaregovernedbyCaliforniaredevelopmentlawandmust be used to provide housing for people with low and moderate incomes.
The Shoreline Golf Links Fund accounts for revenues from user fees at Shoreline Golf Links and related golf course operations and improvements.
The Downtown Benefit Assessment District Fund accounts for revenue received for offstreet parking, fees paid in-lieu of providingparkingintheDistrictandforannualadvaloremrateanddirectassessmentsleviedagainsttheproperty owners within the
City of Mountain View
June 30, 2025
(Continued)
The General Special Purpose Fund accounts for fees paid for replacement trees and the CASp training program.
The Police Asset Forfeitures Fund accounts for funds derived from criminal assets seized by police, primarily from illegal narcotics sales activity.
TheGrantsFundaccountsforgrantsreceived,includingCommunityDevelopmentBlockGrants,HomeInvestment PartnershipActGrants,andotherHousingrelatedgrants,theLocalLawEnforcementBlockGrantProgram,the Supplemental Law Enforcement Services Grants and Traffic Safety grants
The Cable Television Fund accounts for Public, Education and Government (PEG) fees collected by the cable providers and restrictedforPEGchannelsupport.TheCitypassesaportionofthesefundsthroughtoathirdpartytoprovidepublic, governmental and educational access television services.
TheDeferredAssessmentsFundaccountsforaprogramwhichallowscertainpropertyownerstodeferupto100percent of any special assessment levied on their property. The assessment becomes due upon certain specified occurrences.
The Shoreline Regional Park Community 2018 Revenue Bonds Fund accounts for the resources used for the purpose of payingtheprincipal,interestandrelatedcostsontheShorelineRegionalParkCommunity2018RevenueBondsSeriesA and Series B as they become due.
The Shoreline Regional Park Community 2022 Revenue Bonds Fund accounts for the resources used for the purpose of payingtheprincipal,interestandrelatedcostsontheShorelineRegionalParkCommunity2022RefundingRevenue Bonds Series A as they become due.
City of Mountain View
June 30, 2025
The Special Assessments Fund accounts for resources financed by special assessments levied against property receiving special benefits, contributions from other funds for general benefits and certain reserve requirements.
The Storm Drain Construction Fund accounts for revenues derived from off-site drainage fees used for storm drain projects in the Capital Improvements Program.
Nonmajor Governmental Funds
June 30, 2025 (Dollars in Thousands)
Nonmajor Governmental Funds
June 30, 2025 (Dollars in Thousands)
Combining Statement of Revenues, Expenditures and Changes in Fund Balances
Nonmajor Governmental Funds
For the year ended June 30, 2025 (Dollars in Thousands)
Combining Statement of Revenues, Expenditures and Changes in Fund Balances
Nonmajor Governmental Funds
For the year ended June 30, 2025 (Dollars in Thousands)
FINANCING SOURCES (USES):
Schedule of Revenues, Expenditures and Changes in Fund Balances - Budget and Actual Gas Tax
For the year ended June 30, 2025 (Dollars in Thousands)
Schedule of Revenues, Expenditures and Changes in Fund Balances - Budget and Actual
Other Streets and Transportation For the year ended June 30, 2025 (Dollars in Thousands)
Schedule of Revenues, Expenditures and Changes in Fund Balances - Budget and Actual Construction Tax
For the year ended June 30, 2025 (Dollars in Thousands)
FINANCING SOURCES (USES):
Schedule of Revenues, Expenditures and Changes in Fund Balances - Budget and Actual
For the year ended June 30, 2025 (Dollars in Thousands)
Schedule of Revenues, Expenditures and Changes in Fund Balances - Budget and Actual
CSFRA / Rental Housing Committee
For the year ended June 30, 2025 (Dollars in Thousands)
Schedule of Revenues, Expenditures and Changes in Fund Balances - Budget and Actual
For the year ended June 30, 2025 (Dollars in Thousands)
For the year ended June 30, 2025 (Dollars in Thousands)
Budgeted Amounts
Schedule of Revenues, Expenditures and Changes in Fund Balances - Budget and Actual
For the year ended June 30, 2025 (Dollars in Thousands)
For the year ended June 30, 2025 (Dollars in Thousands)
Schedule of Revenues, Expenditures and Changes in Fund Balances - Budget and Actual
General Special Purpose
For the year ended June 30, 2025 (Dollars in Thousands)
Schedule of Revenues, Expenditures and Changes in Fund Balances - Budget and Actual
For the year ended June 30, 2025 (Dollars in Thousands)
For the year ended June 30, 2025 (Dollars in Thousands)
Schedule of Revenues, Expenditures and Changes in Fund Balances - Budget and Actual
For the year ended June 30, 2025 (Dollars in Thousands)
Schedule of Revenues, Expenditures and Changes in Fund Balances - Budget and Actual
Deferred Assessments
For the year ended June 30, 2025 (Dollars in Thousands)
REVENUES:
EXPENDITURES:
Schedule of Revenues, Expenditures and Changes in Fund Balances - Budget and Actual
Storm Drain Construction
For the year ended June 30, 2025 (Dollars in Thousands)
EXPENDITURES:
June 30, 2025
The Equipment Maintenance and Replacement Fund accounts for equipment maintenance services provided to other funds and the replacement of certain equipment.
The Workers' Compensation Insurance Fund accounts for the City's self-insurance program for workers' compensation benefits and for the administration of safety and loss prevention programs.
The Unemployment Self-Insurance Fund accounts for State and Federal-mandated unemployment insurance benefits for employees.
The Liability Self-Insurance Fund accounts for the City's general liability self-insurance and property insurance programs.
The Retirees' Health Plan Fund accounts for the health plan contributions for retirees of the City and the funds set aside for future retirees' benefits.
The Employee Benefits Plan Fund accounts for the City's self-insurance vision and other benefits for City employees.
in Thousands)
Statement
For the year ended June 30, 2025 (Dollars in Thousands)
For the year ended June 30, 2025 (Dollars in Thousands)
RECONCILIATION OF OPERATING INCOME (LOSS) TO NET CASH PROVIDED BY (USED IN) OPERATING ACTIVITIES:
Adjustments to reconcile operating income (loss) to net cash provided by (used in) operating activities: Changes
This page intentionally left blank
City of Mountain View
June 30, 2025
The Fire Union Custodial Fund accounts for money received on behalf of the Fire Union used for union activities.
The Police Union Custodial Fund accounts for money received on behalf of the Police Union used for union activities.
The Center for the Performing Arts Custodial Fund accounts for money received by the Center for the Performing Arts on behalf of the event organizers.
June 30, 2025 (Dollars in Thousands)
For the year ended June 30, 2025 (Dollars in Thousands)
This page intentionally left blank
This page intentionally left blank
Statistical Section
For the Fiscal Year Ended June 30, 2025
This section of the City's Annual Comprehensive Financial Report presents detailed information as a context for understanding what the information in the financial statements, note disclosures, and required supplementary information says about the City's overall financial health.
Financial Trends
These schedules contain trend information to help the reader understand how the City's financial performance and well-being have changed over time.
Revenue Capacity
These schedules contain information to help the reader assess the City's most significant local revenue source, the property tax.
Debt Capacity
These schedules present information to help the reader assess the affordability of the City's current levels of outstanding debt and the City's ability to issue additional debt in the future.
Demographic and Economic Information
These schedules offer demographic and economic indicators to help the reader understand the environment within which the City's financial activities take place.
Operating Information
These schedules contain service and infrastructure data to help the reader understand how the information in the City's financial report relates to the services the City provides and the activities it performs.
Sources
Unless otherwise noted, the information in these schedules is derived from the Annual Comprehensive Financial Reports for the relevant year.
Net Position by Component
Last Ten Fiscal Years (Dollars in Thousands)
(1)The Unrestricted Net Position decreased in fiscal year ended June 30, 2018 due to the implementation of GASB No. 75.
(2)The Unrestricted Net Position restated in fiscal year ended June 30, 2021 due to the implementation of GASB No. 87.
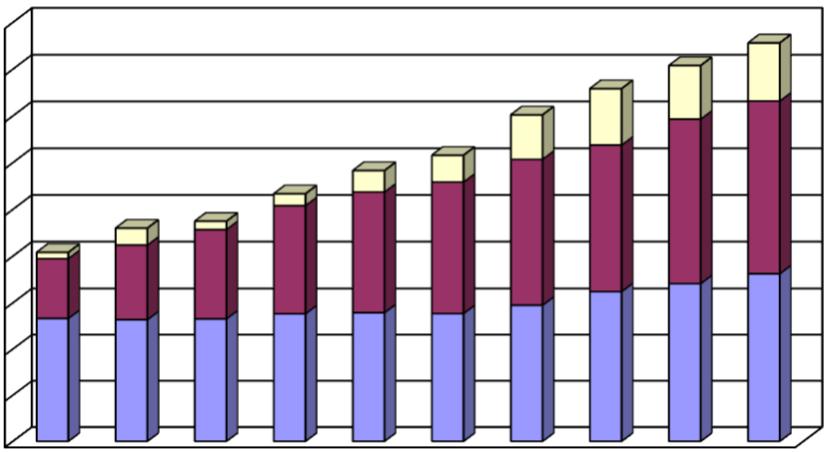
Expenses
Last Ten Fiscal Years (Dollars in Thousands)
Program Revenues
Net (Expense) Revenue
Changes in Net Position Last Ten Fiscal Years (Dollars in Thousands)
General Revenues and Other Changes in Net Position
Change in Net Position
Change
Fund Balances of Governmental Funds
Last Ten Fiscal Years (Dollars in Thousands)
Fund Balance for General Fund
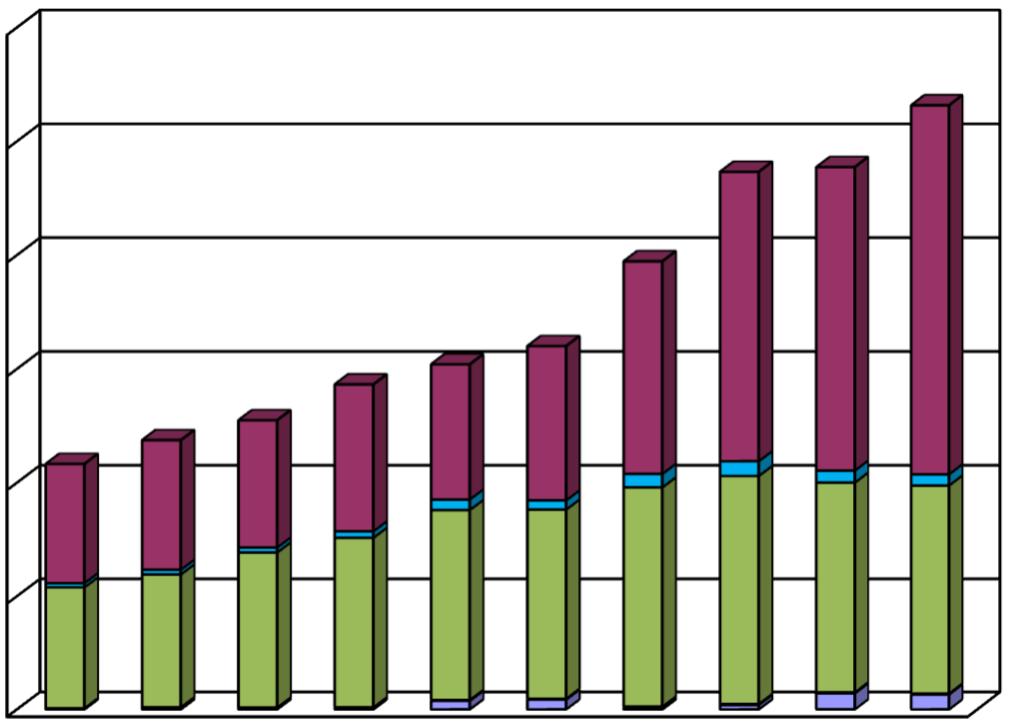
Last Ten Fiscal Years
Fiscal Year Ended June 30, (Dollars in Thousands)
Financing Sources (Uses)
Payment to refund bond escrow agent
Total other financing sources (uses)
(1)Beginning the fiscal year ended June 30, 2017, the City reclassified Developer fees & contributions from various line items. The City elected not to reclassify prior years' balances.
Fiscal Year Ended June 30,
Assessed Value of Taxable Property
Last Ten Fiscal Years (Dollars in Thousands)
2015-1612,697,503 $ 3,633,892 $ 3,381,658 $ 1,016,306 $ 2016-1714,015,191 4,794,1583,420,2981,125,702
2017-1815,613,793 5,376,7313,676,6161,072,122 2018-1916,641,242 6,027,2993,944,1041,087,814 2019-2018,323,758 6,408,1564,373,0201,386,810 2020-2120,011,424 6,971,5324,498,5461,936,547 2021-2221,255,921 7,778,6494,680,8792,537,478 2022-2323,103,147 8,136,1535,125,8513,454,199 2023-2424,560,282 8,893,3675,488,2943,771,063 2024-2526,642,137 9,551,2595,852,6613,739,636
Source:Santa Clara County Assessor
Note:Actual property value data not available in California.
(1)California cities do not set their own direct tax rate. The state constitution establishes the rate at 1 percent and allocates a portion of that amount, by an annual calculation, to all the taxing entities within a tax rate area. The City of Mountain View encompasses more than 15 tax rate areas.
($ 000)
Total Taxable Assessed Value
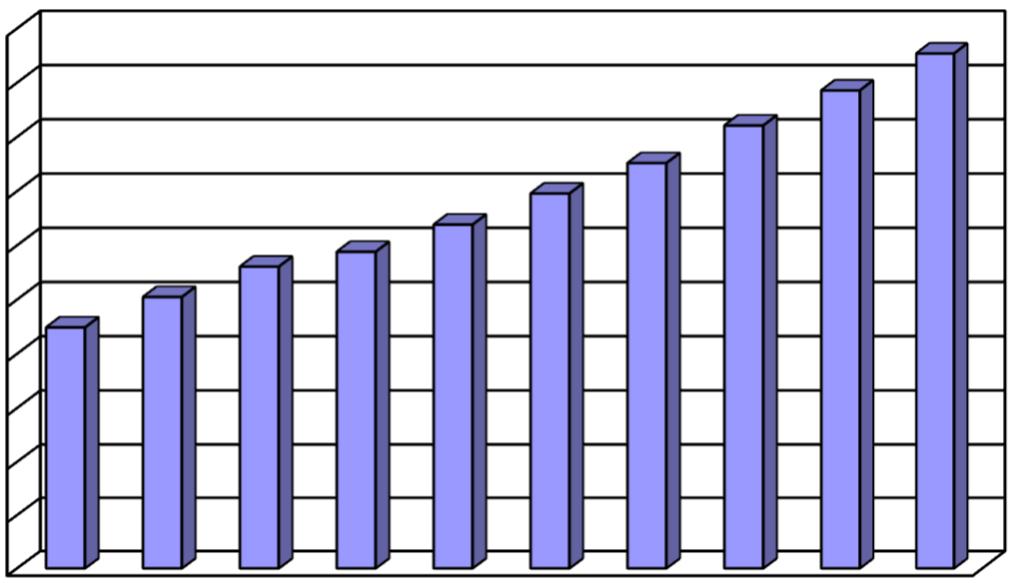
Less:Total Taxable Tax-ExemptAssessedTotal Direct UnsecuredPropertyValueTax Rate (1)
2,689,859 $ (993,411) $ 22,425,807 $ 1.00%
2,972,482(1,094,913) 25,232,9181.00%
3,437,332(1,145,258) 28,031,3361.00% 2,830,453(1,125,615) 29,405,2971.00% 2,816,506(1,400,344) 31,907,9061.00%
2,969,624(1,611,881) 34,775,7921.00% 2,815,937(1,487,266) 37,581,5971.00% 2,873,920(1,643,803) 41,049,4671.00%
3,220,524(1,650,242) 44,283,2881.00% 3,807,327(1,993,586) 47,687,3551.00%
Direct and Overlapping Property Tax Rates
Last Ten Fiscal Years (Rate per $100 of assessed value)
Overlapping Rates (1)
Source: County of Santa Clara
(1) Overlapping rates are those of local and county governments that apply to property owners within the City of Mountain View. Not all overlapping rates apply to all Mountain View property owners. These are voter approved levies in addition to the 1 percent State levy.
(2) The City's share of the basic state wide property tax rate can only be increased by a 2/3 vote of the City's residents.
Principal Property Tax Payers
Current Year and Nine Years Ago (Dollars in Thousands)
Source: Santa Clara County Assessor Fiscal Year Combined Tax Rolls. Ranking
Property Tax Levies and Collections
Last Ten Fiscal Years (Dollars in Thousands) PercentDelinquentTotal FiscalTaxesCurrentof LevyTaxTaxesPercent YearLevied (1)Collections (2)CollectedCollectionsCollectedof Levy
Source: City of Mountain View
(1) Levies include real and personal property. Amount excludes Special Assessments and the penalties and fees on delinquent Special Assessments.
(2) The City selected to participate in the "Teeter" plan offered by the County whereby cities receive 100 percent of the taxes levied in exchange for foregoing any interest and penalties collected on delinquent taxes. The "Teeter" plan does not apply to Special Assessment Districts.
This page intentionally left blank
Ratio
Last Ten Fiscal Years (Dollars in Thousands)
Sources:City of Mountain View
State of California, Department of Finance (population) U.S. Department of commerce, Bureau of the Census (income)
(1) Includes the City of Palo Alto Loan. See Note 7 for additional information.
(2) See Schedule 14 (Demographic Statistics) for personal income and population data.
(3) Includes 2018 SRPC Revenue Bonds, Series A and Series B (2018 Bonds).
(4) Fiscal Year 2022-23 restated to include SBITA liabilities.
(5) Personal income data for Fiscal Year 2024-25 is not available until May of 2026.
Outstanding Debt by Activity Type
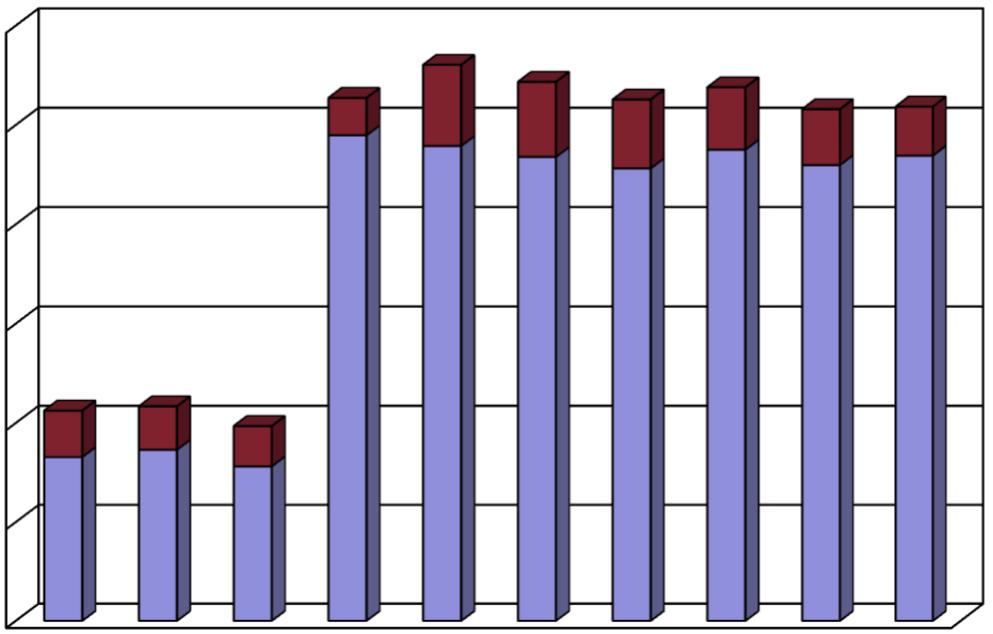
Ratio of General Bonded Debt Outstanding
Last Ten Fiscal Years (Dollars in Thousands) General Bonded Debt Outstanding
(1) Per capita numbers are restated as updated population numbers are available. (2) Total bonds outstanding increased due to issuance of 2018 SRPC Revenue Bonds, Series A and Series B.
Direct and Overlapping Governmental Activities Debt As of June 30, 2025 2024-25 Assessed Valuation: $47,687,354,998 (A)
$93,811,026 (2) (3)
$987,989,508 (3) (4)
(1) The percentage of overlapping debt applicable to the city is estimated using taxable assessed property value. Applicable percentages were estimated by determining the portion of the overlapping district's assessed value that is within the boundaries of the city divided by the district's total taxable assessed value.
(2) Includes unamortized premium of $5,006,027 for direct debt.
(3) Includes lease and SBITA liabilities.
(4) Excludes tax and revenue anticipation notes, enterprise revenue, mortgage revenue bonds and non-bonded capital lease obligations.
Source: California Municipal Statistics, Inc.
(A)The assessed valuation number provided by Santa Clara County Assessor.
Legal Debt Margin Information
Last Ten Fiscal Years (Dollars in Thousands)
Fiscal Year
(1) Source: Santa Clara County Assessor.
(2) The legal debt margin for the City of Mountain View, California, is calculated using a debt limit of 15 percent of the assessed value of property within the city limits.
Legal Debt Margin Calculation for Fiscal Year 2024-25
Assessed value (net) - June 30, 2025 (1)
Debt limit: 15% of assessed value
$47,687,355
$7,153,103
Less total bonded debt, general obligation -
Legal debt margin (2)
$7,153,103
Fiscal Year
2019-202020-212021-222022-232023-242024-25
$12,000 $14,000 $16,000 $18,000 ($ 000)
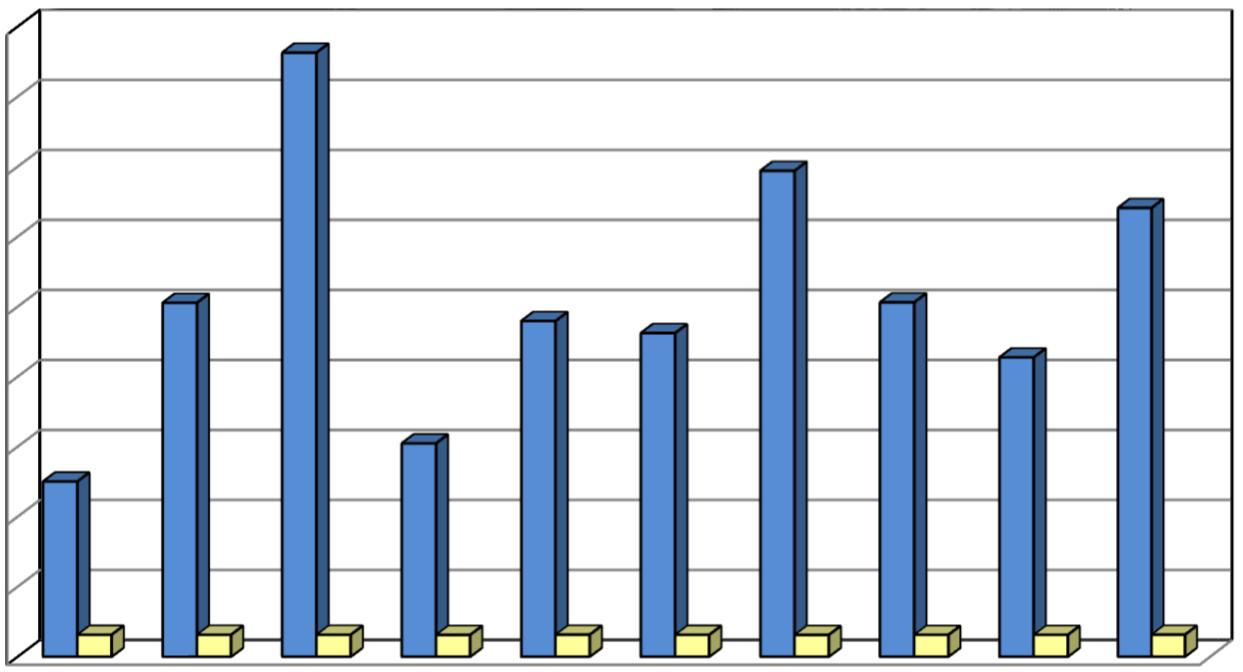
Note:
Debt Pledged-Revenue Coverage
Last Ten Fiscal Years (Dollars in Thousands)
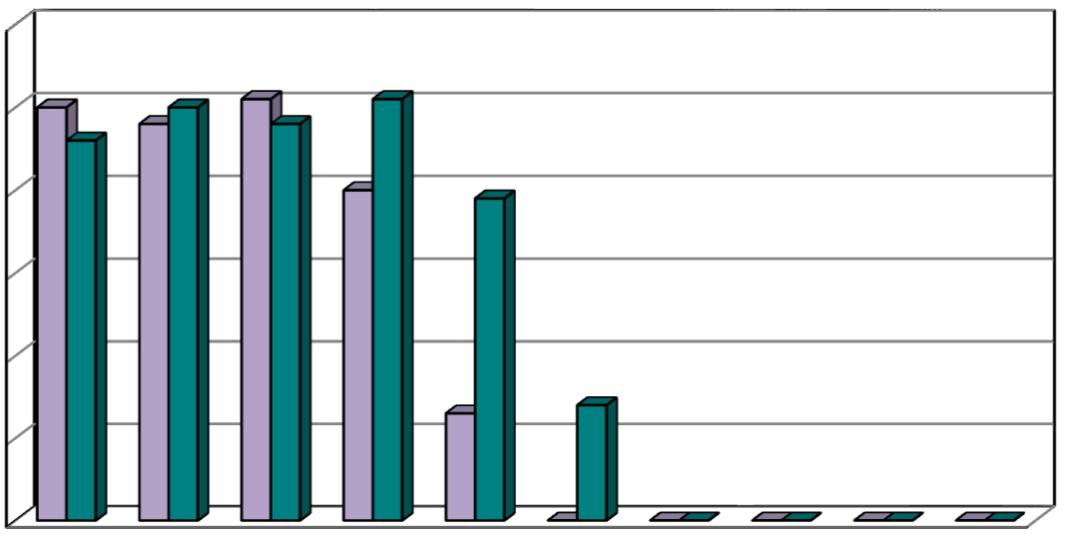


Note: Current fiscal year debt service is paid from prior year collections. (1) Collections include interest payments from property owners.
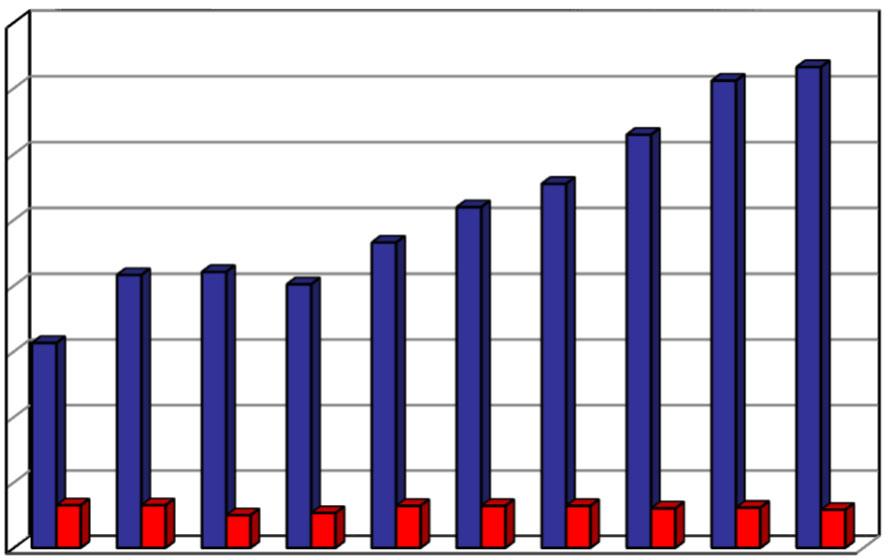
Debt Pledged-Revenue Coverage
$18,000 ($ 000) Wastewater Direct Financing Arrangement
$16,000
$14,000
$12,000
$10,000
$8,000
$6,000
$4,000
$2,000
$0
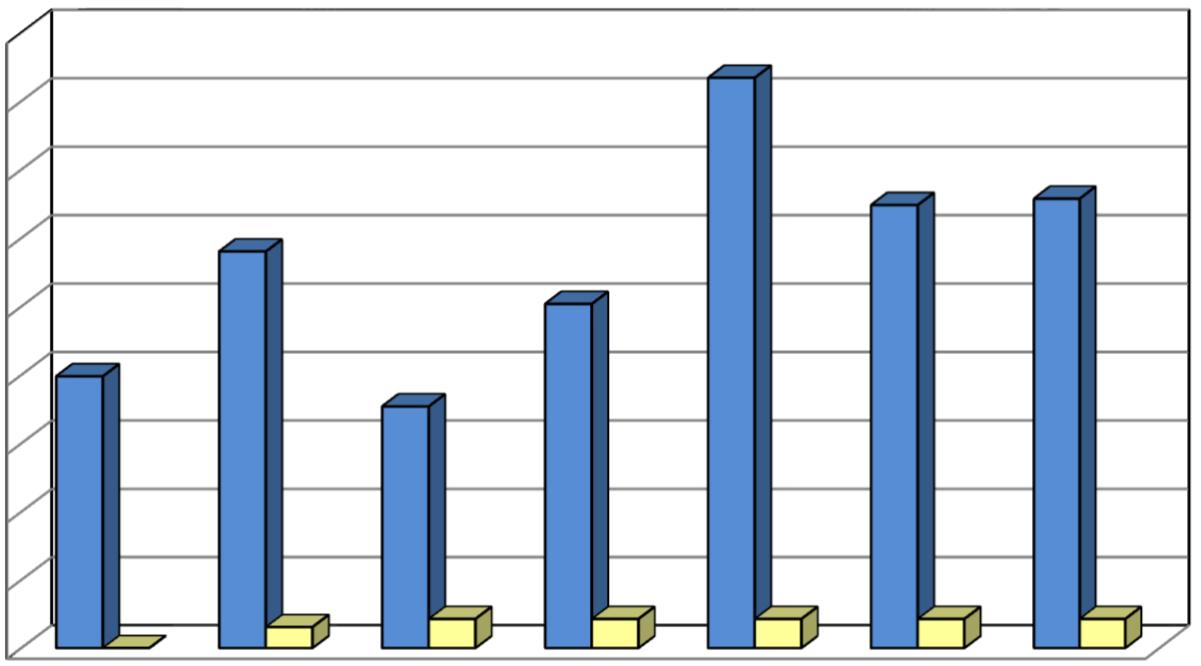
Last Ten Fiscal Years (Dollars in Thousands) Wastewater Direct Financing Arrangement
Service
Note: Details regarding the City's outstanding debt can be found in the notes to the financial statements.
(1) Fiscal Year 2018-19 was the first year of the Wastewater debt, therefore, only seven years of information is presented.
(2) Gross revenues include developer capital contribution fees, non-operating interest earnings, and transfers in.
(3) Operating costs exclude depreciation or amortization.
Demographic Statistics
Last Ten Fiscal Years (Dollars in Thousands)
PopulationPer Capita FiscalDensityPersonal PersonalSchoolUnemployment
YearPopulation (1)(Sq. Mile) (2)Income (3)Income (3)Enrollment Rate (%) (3)
2015-1679,4296,5116,433,749817,5774.0% 2016-1779,9666,5557,356,872927,6203.5% 2017-1880,1046,5668,010,4001007,6782.9%
2018-1980,9866,6388,746,4881087,7192.6% 2019-2082,3766,7529,555,6161167,5119.3% 2020-2183,1286,81410,307,8721247,4274.8% 2021-2283,8566,81811,655,9841397,2942.3% 2022-2384,4636,86712,078,2091437,1463.9% 2023-2486,5357,03513,066,7851517,2124.4% 2024-2586,5137,034(4)(4)7,2744.8%
Sources:Santa Clara County Office of Education. State of California, Department of Finance. U.S. Census Bureau.
(1) Population numbers are provisional estimates as of January 1st, revised annually.
(2) Population Density per square mile calculations are restated from 12.2 to 12.3 square miles starting Fiscal Year 2021-22.
(3) Per capita personal income and unemployment rate are for Santa Clara County. Personal income is the product of the countywide per capita amount and the City's population.
(4) Personal income data for Fiscal Year 2024-25 is not available until May of 2026.
Principal Employers
Current Year and Nine Years Ago
Source: City of Mountain View
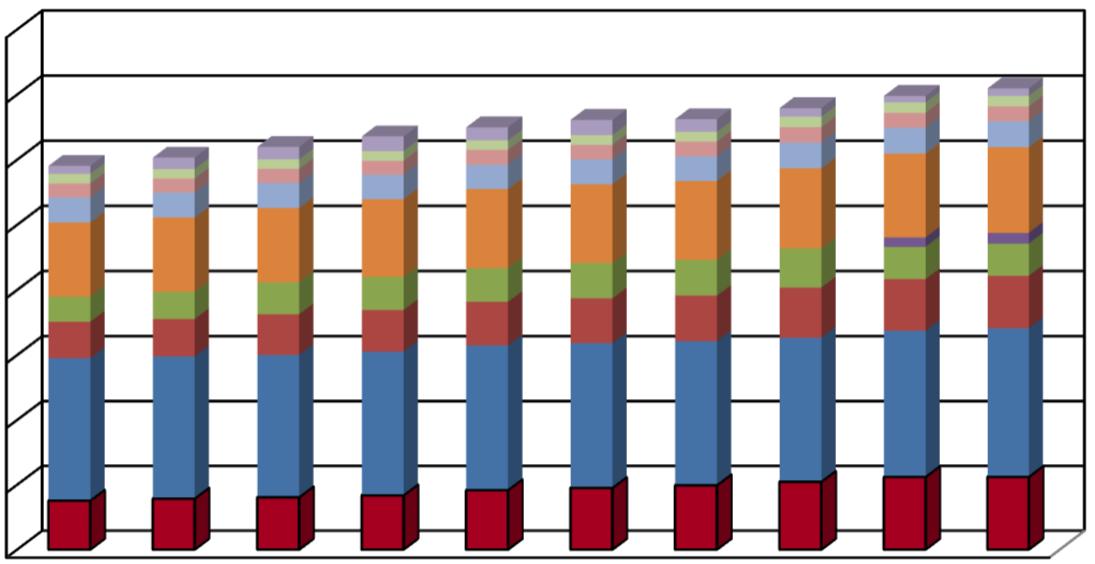
Operating Indicators by Function/Program Last Ten Fiscal Years
Source: City of Mountain View
(1) Variance, unless otherwise noted, due to the COVID-19 public health crisis and Shelter-in-Place restrictions.
(2) Beginning in the Fiscal Year ended June 30, 2016, includes total multi-family housing inspections completed by FEPD not previously accounted for.
(3) Lower due to vacancy and turnover in personnel, resulting in reduced staffing.
(4) For the Fiscal Year ended June 30, 2016, Police calls for service number is restated. Number of calls have decreased due to the different way the new CAD system records some activities.
(5) a new records management software (RMS).
Fiscal Year ended June 30, 2023 was restarted in Fiscal Year ended June 30, 2024 due to PD using
(6) The City was unable to advertise and bid the surface project; therefore, street resurfacing project was delayed.
(7) Methodology to estimate number of sewer connections changed to reflect more accurate count.
(8) Fiscal Year ended June 30, 2018 was restated in Fiscal Year ended June 30, 2019 due to incorrect figures reflected for the year.
(9) Includes curbside, multi-family, commercial and school recycling, yard waste, debris box recycling, MV Recycling Center, and recyclables recovered from refuse at the SMaRT station.
Fiscal Year Ended June 30,
2020 (1)2021 (1)2022 (1) 202320242025
6,1205,6046,7417,9797,8207,672 2,4981,4011,3211,288976953 1,7181,6051,8411,5401,2391,357
73,20193,101107,424110,453104,226100,800 40,25434,95339,19441,15143,14546,027
4,8734,2414,4884,916(5)4,8844,043 1,7321,1478411,134(5)1,3421,820 3,0731,3071,1311,2801,6642,025 6,7615592,0196,0476,5409,792 9.622.25-(6)-(6)2.295.90 2,0257806844,6173,4131,199
2,6062,3568,70911,15911,74913,395 276274396397560862 305283273260263250 9617421,2321,3101,3731,375
71581374
Capital Asset Statistics by Function/Program Last Ten Fiscal Years
Fiscal Year Ended June 30,
Source: City of Mountain View
(1)The miles of streets are based on the certified report dated May 22, 2019 derived from the updated database.
(2)Shoreline Athletic Fields converted 12 acres of Regional park acreage to City parks acreage in Fiscal Year ended June 30, 2016.
(3)Additions of Permanente Creek Trail Rock St to Middlefield Rd and Hetch-Hetchy Trail between N Whisman Rd and Tyrella Ave.
(4)Includes assets not owned by the City but maintained by the City.
(5)Includes Adobe Building and Immigrant House beginning Fiscal Year ended June 30, 2017.
(6)Reflects Teen Center as a separate category beginning Fiscal Year ended June 30, 2017.
(7)The miles of sanitary sewers are updated based on correction by GIS due to mischaracterization.
(8)The City of Mountain View owns treatment capacity at the Palo Alto Treatment Plant.
This page intentionally left blank
For the Fiscal Year Ended June 30, 2025 Prepared by: Finance and Administrative Services Department
This page intentionally left blank


To the Board of Directors
of the Mountain View Shoreline Regional Park Community
Mountain View, California
Opinions
We have audited the financial statements of the governmental activities and each major fund of the Mountain View Shoreline Regional Park Community (Shoreline Community), a component unit of the City of Mountain View, California (City) as of and for the year ended June 30, 2025, and the related notes to the financial statements, which collectively comprise the Shoreline Community’s basic financial statements as listed in the table of contents.
In our opinion, the accompanying financial statements present fairly, in all material respects, the respective financial position of the governmental activities and each major fund of the Shoreline Community, as of June 30, 2025, and the respective changes in financial position thereof and the budgetary comparison for the Shoreline Regional Park Community Fund for the year then ended in accordance with accounting principles generallyaccepted in the United Statesof America.
We conducted our audit in accordance with auditing standards generally accepted in the United States of America (GAAS) and the standards applicable to financial audits contained in Government Auditing Standards, issued by the Comptroller General of the United States. Our responsibilities under those standards are further described in the Auditor’s Responsibilities for the Audit of the Financial Statements section of our report. We are required to be independent of the ShorelineCommunity and to meet our other ethical responsibilities, in accordance with the relevant ethical requirements relating to our audit. We believe that the audit evidence we have obtained is sufficient and appropriate to provide a basis for our audit opinions.
The Management is responsible for the preparation and fair presentation of the financial statements in accordance with accounting principles generally accepted in the United States of America, and for the design, implementation, and maintenance of internal control relevant to the preparation and fair presentation of financial statements that are free from material misstatement, whether due to fraud or error.


To the Board of Directors
of the Mountain View Shoreline Regional Park Community
Mountain View, California
Page 2
In preparing the financial statements, management is required to evaluate whether there are conditions or events, considered in the aggregate, that raise substantial doubt about the Shoreline Community’s ability to continue as a going concern for twelve months beyond the financial statement date, including any currently known information that may raise substantial doubt shortly thereafter.
Our objectives are to obtain reasonable assurance about whether the financial statements as a whole are free from material misstatement, whether due to fraud or error, and to issue an auditor’s report that includes our opinions. Reasonable assurance is a high level of assurance but is not absolute assurance and therefore is not a guarantee that an audit conducted in accordance with GAAS will always detect a material misstatement when it exists. The risk of not detecting a material misstatement resulting from fraud is higher than for one resulting from error, as fraud may involve collusion, forgery, intentional omissions, misrepresentations, or the override of internal control. Misstatements are considered material if there is a substantial likelihood that, individually or in the aggregate, they would influence the judgment made by a reasonable user based on the financial statements.
In performing an audit in accordance with GAAS, we:
Exerciseprofessional judgment and maintain professional skepticism throughout the audit.
Identify and assess the risks of material misstatement of the financial statements, whether due to fraud or error, and design and perform audit procedures responsive to those risks. Such procedures include examining, on a test basis, evidence regarding the amounts and disclosures in the financial statements.
Obtain an understandingof internal control relevant to the audit in order to design audit procedures that are appropriate in the circumstances, but not for the purpose of expressing an opinion on the effectiveness of the Shoreline Community’s internal control. Accordingly, no such opinion is expressed.
Evaluate the appropriateness of accounting policies used and the reasonableness of significant accounting estimates made by management, as well as evaluate the overall presentation of the financial statements.
Conclude whether, in our judgment, there are conditions or events, considered in the aggregate, that raise substantial doubt about the Shoreline Community’s ability to continue as a going concern for a reasonable period of time.
We are required to communicate with those charged with governance regarding, among other matters, the planned scope and timing of the audit, significant audit findings, and certain internal control–related matters that we identified during the audit.
To the Board of Directors
of the Mountain View Shoreline Regional Park Community
Mountain View, California
Page 3
Accounting principles generally accepted in the United States of America require that the management’s discussion and analysis and the required pension and OPEB schedules, be presented to supplement the basic financial statements.Such information is the responsibility of management and, although not a part of the basic financial statements, is required by the Governmental Accounting Standards Board who considers it to be an essential part of financial reporting for placing the basic financial statements in an appropriate operational, economic, or historical context. We have applied certain limited procedures to the required supplementary information in accordance with auditing standards generally accepted in the United States of America, which consisted of inquiries of management about the methods of preparing the information and comparing the information for consistency with management’s responses to our inquiries, the basic financial statements, and other knowledge we obtained during our audit of the basic financial statements. We do not express an opinion or provide any assurance on the information because the limited procedures do not provide uswith sufficientevidence to express an opinion or provide any assurance.
Our audit was conducted for the purpose of forming opinions on the financial statements that collectively comprise the Shoreline Community’s basic financial statements. The Shoreline Regional Park Community Fund combining fund statements are presented for purposes of additional analysis and are not a required part of the basic financial statements.
The Shoreline Regional Park Community Fund combining fund statements are the responsibility of management and were derived from and relates directly to the underlying accounting and other records used to prepare the basic financial statements. Such information has been subjected to the auditing procedures applied in the audit of the basic financial statements and certain additional procedures, including comparing and reconciling such information directly to the underlying accounting and other records used to prepare the basic financial statements or to the basic financial statements themselves, and other additional procedures in accordance with auditing standards generally accepted in the United States of America. In our opinion, the Shoreline Regional Park Community Fund combining fund statements are fairly stated, in all material respects, in relation to the basic financial statements as a whole.
To the Board of Directors
of the Mountain View Shoreline Regional Park Community
Mountain View, California
Page 4
In accordance with Government Auditing Standards, we have also issued our report dated December 9, 2025 on our consideration of the Shoreline Community’s internal control over financial reporting and on our tests of its compliance with certain provisions of laws, regulations, contracts, and grant agreements and other matters. The purpose of that report is solely to describe the scope of our testing of internal control over financial reporting and compliance and the results of that testing, and not to provide an opinion on the effectiveness of internal control over financial reporting or on compliance.That report is an integral part of an audit performed in accordance with Government Auditing Standards in considering the Shoreline Community’s internal control over financial reporting and compliance.
Badawi & Associates, CPAs
Emeryville, California
December 9, 2025
Mountain View Shoreline Regional Park Community Management’s Discussion and Analysis (MD&A) (Unaudited) for the Fiscal Year Ended June 30, 2025
This section of the Mountain View Shoreline Regional Park Community’s (Shoreline Community or SRPC) basic financial statements presents a narrative overview and analysis of the financial activities of the Shoreline Community for the fiscal year ended June 30, 2025. We encourage readers to consider the information presented here in conjunction with additional information that has been furnished in the financial statements and our transmittal letter for the financial statements of the City of Mountain View (City).
The Shoreline Community’s principal revenue source is property taxes, which have historically fluctuated due to economic conditions that have resulted in changes in the commercial vacancy rate and assessed values. For Fiscal Year 2024-25, property taxes increased by $2.1 million or 2.9%. Fiscal Year 2024-25 financial highlights include the following:
• The Shoreline Community’s assets and deferred outflows of resources exceeded its liabilities and deferred inflows of resources for the fiscal year ended June 30, 2025 by $155.7 million (net position). Of this amount, $38.9 million reflects its net investment in capital assets, $117.1 million is restricted for Shoreline Community indebtedness, and negative $210,000 is unrestricted.
• The Shoreline Community’s total net position increased by $30.9 million during the fiscal yearcomparedtothepriorfiscalyearincreaseof$26.2 million. Thechangeisprimarilydue to a $6.7 million increase in capital contributions, $2.1 million increase in property revenues and a $1.5 million rise in investment earnings.
• Revenuesof$94.4 million,includingprogramrevenuesandgeneralrevenues,excludingnet transfers, are $10.4 million more than the prior fiscal year. The change is primarily due to the same reasons stated above.
• Shoreline Community expenses are $42.0 million, an increase of $2.7 million over the prior fiscal year.
• GovernmentalfundbalancesforthefiscalyearendedJune30,2025increased$20.2 million to $135.5 million, primarily due to higher property tax revenues and an excess of revenues over expenditures.
• Governmental fund revenues are $82.6 million for the fiscal year ended June 30, 2025, an increase of $3.7 million from the prior fiscal year, primarily due to higher property tax revenues and higher investment earnings, as mentioned before.
• Governmental fund expenditures are $40.3 million for the fiscal year ended June 30, 2025, an increase of $2.9 million from the prior fiscal year’s expenditures of $37.4 million.
• The Shoreline Community’stotalnoncurrent liabilities decreased by $2.1 million compared with the prior fiscal year, primarily due to the annual principal payment of bonds.
This discussion and analysis are intended to serve as an introduction to the Shoreline Community’s component unit basic financial statements. The Shoreline Community’s component unit basic financial statements comprise three components: (1) government-wide financial statements; (2) fund financial statements; and (3) notes to the basic financial statements. This report also contains required and other supplementary information.
The government-wide financial statements are designed to provide readers with a broad overview of the Shoreline Community’sfinances in amanner similar to aprivate-sector business.
The Statement of Net Position presents information on all of the Shoreline Community’s assets, deferred outflows of resources, liabilities, and deferred inflows of resources with the difference reported as net position. Over time, increases or decreases in net position may serve as a useful indicator of whether the financial position of the Shoreline Community is improving or deteriorating.
The Statement of Activities presents information showing how the Shoreline Community’s net position changed during the most recent fiscal year. All changes in net position are reported as soon as the underlying event giving rise to the change occurs, regardless of the timing of related cash flows. Thus, revenues and expenses are reported in this statement for some items that will only result in cash flows in future fiscal periods.
The fund financial statements are designed to report information about groupings of related accounts, which are used to maintain control over resources that have been segregated for specific activities or objectives. The Shoreline Community, like other state and local governments, usesfund accounting to ensure and demonstrate compliance with finance-related legal requirements.
Governmental funds are used to account for essentially the same functions reported as governmental activities in the government-wide financial statements. However, unlike the government-wide financial statements, governmental fund financial statements focus on nearterm inflows and outflows of spendable resources as well as on balances of spendable resources available at the end of the fiscal year. Such information may be useful in determining what financial resources are available in the near future to finance the Shoreline Community’s programs.
Becausethefocusofgovernmentalfundsisnarrowerthanthatofthegovernment-widefinancial statements, it is useful to compare the information presented for governmental funds with similar information presented for governmental activities in the government-wide financial statements. By doing so, readers may better understand the long-term impact of the government’s near-term financing decisions. Both the governmental funds Balance Sheet and the governmental funds Statement of Revenues, Expenditures, and Changes in Fund Balances provide a reconciliation to facilitate this comparison between governmental funds and governmental activities.
The Shoreline Community has three individual governmental funds. Information is presented separately in the governmental funds Balance Sheet and in the governmental funds Statement ofRevenues,Expenditures,andChangesinFundBalancesfortheSRPCFund,SRPC2018Revenue Bonds Fund, and SRPC 2022 Revenue Bonds Fund, all of which are reported as major funds.
TheShorelineCommunityadoptsanannualappropriatedbudgetfortheSRPCFund. Abudgetary comparison statement has been provided for this fund to demonstrate compliance with budget.
The notes provide additional information that is essential to a full understanding of the data provided in the government-wide and fund financial statements.
Required Supplementary Information includes schedules required to be presented showing information related to the SRPC’s cost-sharing arrangement with the City’s pension and other postemployment benefits (OPEB) plans.
Other Supplementary Information includes the Combining Statements of the SRPC Fund.
The Shoreline Community has presented its financial statements under the reporting model required accounting principles generally accepted in the United States of America. Two years of financial information and a comparative analysis of government-wide data are included in this MD&A.
A summary of the Shoreline Community’s net position is as follows:
CondensedStatementofNetPosition (DollarsinThousands)
$155,727$124,778
Asnotedearlier,netpositionmayserveasausefulindicator ofagovernment’sfinancialposition. For the Shoreline Community, assets and deferred outflows of resources exceeded liabilities and deferred inflows of resources by $155.7 million at the end of the fiscal year. The components of net position are as follows:
• Net investment in capital assets was $38.9 million, which was an increase of $13.1 million compared to the prior fiscal year. This increase was mainly due to increased capital assets and decreased debt outstanding during the current fiscal year.
• Another significant component of the Shoreline Community’s net position is $117.1 million in Restricted for Shoreline Community Indebtedness, which may be used to meet the Shoreline Community’s current and future obligations. The balance increased by $16.5 million from the prior fiscal year.
The Shoreline Community’s current and other assets increased $20.5 million, mainly due to an increase in cash and restricted cash.Thenetposition increased by $30.9 million compared tothe prior fiscal year, primarily due to revenues exceeding expenses by $53.1 million partially offset by net transfers out to the City totaling $22.2 million.
A summary of the Shoreline Community’s changes in net position is as follows:
CondensedStatementofActivities (DollarsinThousands)
The major component of the Shoreline Community’s current fiscal year revenues is $73.2 million of property taxes. This is an increase of $2.1 million when compared to the prior fiscal year due to increases in assessed property values. Program revenueswere $573,000, remaining relatively consistent with the prior fiscal year. Capital contributions increased by $6.7 million, primarily duetothe$3.5millionexpenditureontheFireStation5Classroom/TrainingConstructionProject (CIP 20-35) in this fiscal year. Investment earnings were $8.8 million, an increase of $1.5 million compared to the prior fiscal year, driven by a rise in the fair market value of the investment portfolio and relatively high interest income due to elevated interest rates.
Expenses totaling $41.3 million increased $2.1 million when compared to the prior fiscal year. This was attributable primarily to increases in general government.
The change in net position is an increase of $30.9 million compared to the prior fiscal year increase of $26.2 million. The difference is due to the items mentioned above, notably the increases in property tax revenues and investment earnings.
As noted earlier, the Shoreline Community uses fund accounting to ensure and demonstrate compliance with finance-related legal requirements.
The focus of the Shoreline Community’s governmental funds is to provide information on nearterm inflows, outflows, and balances of resources that are available for spending. Such information is useful in assessing the Shoreline Community’s financing requirements.
As of June 30, 2025, the Shoreline Community’s funds reported combined fund balances of $135.5 million, an increase of $20.2 million from the prior fiscal year. The Committed Fund Balance increased by $845,000 while the Restricted Fund Balance increased by $19.3 million when compared to the prior fiscal year. The increase in the Restricted Fund Balance is mainly due to higher property tax revenues, which exceed expenditures as previously noted.
Revenues for the fiscal year ended June 30, 2025 totaled $82.6 million, an increase of $3.7 million, or 4.7%, when compared to the prior fiscal year. The increase is primarily due to increases in property tax revenues and investment earnings during the fiscal year. Expenditures totaling $40.3 million were $2.9 million higher compared to the prior fiscal year.
The SRPC Fund receives tax revenues on properties within the Shoreline Community. The fund accountsfor therevenuesand expendituresoftheShorelineCommunity. Atthe endofthefiscal year, its fund balance was $129.4 million. As a measure of the SRPC Fund’s liquidity, it may be useful to compare the total fund balance to total fund expenditures. The total fund balance represents 375.6% of the total fund expenditures of $34.4 million.
The fund balance of the SRPC Fund increased by $20.3 million during the current fiscal year. Key factors contributing to this increase are as follows:
• Total revenues are $82.4 million in the current fiscal year, an increase of $3.8 million from the prior fiscal year. The increase is primarily attributable to higher property tax revenues and unrealized gains on the investment portfolio.
• Expenditures for the year total $34.4 million, representing an increase of $3.2 million compared to the previous fiscal year. This rise is primarily attributable to higher contributions to the school districts, increased retirement override and pass-through payments to Santa Clara County, and rising salaries and benefits costs.
• The transfer out to the City, primarily for capital projects, remained consistent with the prior year. The transfer in from the City decreased by $3.5 million, mainly due to fewer refunds from the General Capital Projects Fund for completed CIP projects in the current fiscal year compared to the prior year.
The SRPC 2018 Revenue Bonds Fund accounts for the resources used for the purpose of paying the principal, interest, and related costs on the SRPC 2018 Revenue Bonds as they become due.
Debt service expenditures included $985,000 in principal retirement and $3.0 million in interest and fiscal charges for the fiscal year ended June 30, 2025. Both the principal repayment and the interest charges are comparable to the prior fiscal year.
The SRPC 2022 Revenue Bonds Fund was created in Fiscal Year 2022-23 and accounts for the resources used for the purpose of paying the principal, interest, and related costs on the SRPC 2022 Revenue Bonds as they become due. Debt service expenditures included $875,000 in principalretirement and $968,000 ininterest andfiscalcharges forthe fiscalyear endedJune 30, 2025. Both the principal repayment and the interest charges are moderately lower than the prior fiscal year.
A summary of Shoreline Community’s capital assets is as follows:
For the fiscal year ended June 30, 2025, capital assets, net of accumulated depreciation, totaled $110.6 million, an increase of $8.1 million compared to prior fiscal year. At June 30, 2025, construction commitments were $4.7 million. Additional information about the Shoreline Community’s capital assets is discussed in Note 6 to the Basic Financial Statements.
As of June 30, 2025, the Shoreline Community has $85.5 million of outstanding noncurrent liabilities. During the fiscal year, the Shoreline Community’s total long-term debt decreased by $2.1 million compared with the prior fiscal year, primarily due to the scheduled principal retirementof$2.1million. Standard&Poor’s(S&P)raisedtheShorelineCommunity’sunderlying credit rating from “A” to “A+” in November 2018. The Shoreline Community’s noncurrent liabilities are discussed in Note 7 to the Basic Financial Statements.
Property taxes for the Shoreline Community are expected to increase moderately for the upcomingfiscalyear,comparedtotheJuly1,2024 taxroll,due tothe2.0CCPIappliedtosecured property. Propertyvaluesarerisingduetothehighdevelopmentdemand inthecommunity,but therearealsopendingappealsfiledbyownersofpropertyintheShorelineCommunitythatcould impact future property tax revenues if successful.
These financial statements are intended to provide citizens, taxpayers, investors, and creditors withageneraloverviewoftheShorelineCommunity’sfinances. Questionsconcerninganyofthe information provided in this report or requests for additional financial information should be directed to the Finance and Administrative Services Department, 500 Castro Street, P.O. Box 7540, Mountain View, California, 94039-7540, or FinanceAdmin@mountainview.gov.
This page intentionally left blank
This page intentionally left blank
Position
June 30, 2025
(Dollars in Thousands)
This page intentionally left blank
For the year ended June 30, 2025 (Dollars in Thousands)
This page intentionally left blank
This page intentionally left blank
Sheet
Governmental Funds
June 30, 2025 (Dollars in Thousands)
Reconciliation of the Governmental Funds Balance Sheet to the Government-Wide Statement of Net Position
June 30, 2025
(Dollars in Thousands)
Amounts reported for governmental activities in the statement of net position are different
Capitalassetsnetofdepreciationhavenotbeenincludedasfinancialresourcesin governmental fund activity.
Interestpayableonlong-termdebtdoesnotrequiretheuseofcurrentfinancialresourcesand, therefore,interestpayableisnotaccruedasaliabilityinthebalancesheetofgovernmental funds. (1,633)
DeferredoutflowsandinflowsofresourcesforpensionandOPEBitemsingovernmental activitiesarenotfinancialresourcesand,therefore,arenotreportedinthegovernmental funds.
Noncurrentliabilities,includingbondspayable,arenotdueandpayableinthecurrentperiod and therefore are not reported in the governmental funds.
of Revenues, Expenditures and Changes in Fund Balances Governmental Funds
For the year ended June 30, 2025 (Dollars in Thousands)
Reconciliation of the Statement of Revenues, Expenditures, and Changes in Fund Balances of Governmental Funds to the Government-Wide Statement of Activities
For the year ended June 30, 2025 (Dollars in Thousands)
Net Change in Fund Balances - Total Governmental Funds 20,168 $
Amounts reported for governmental activities in the Government-Wide Statement of Activities were different because:
Governmentalfundsreportcapitaloutlayasexpenditures.However,inthestatementofactivities, thecostofthoseassetsisallocatedovertheirestimatedusefullivesandreportedasdepreciation expense.
the
Pension and OPEB contributions made subsequent to the measurement date are expenditures in the governmental funds, but reported as deferred outflows of resources in the government-wide financial statements. 1,470
Pension and OPEB expenses reported in the statement of activities do not require the use of current financial resources and, therefore, are not reported as expenditures in governmental funds. (916)
The repayment of principal of long-term debt consumes the current financial resources of governmental funds. 1,860
Someexpensesreportedinthestatementofactivitiesdonotrequiretheuseofcurrentfinancial resources and
Statement of Revenues, Expenditures and Changes in Fund Balances - Budget and Actual
Shoreline Regional Park Community Fund
For the year ended June 30, 2025 (Dollars in Thousands)
OTHER FINANCING SOURCES (USES):
Budgeted Amounts
This page intentionally left blank
This page intentionally left blank.
For the Year Ended June 30, 2025
The Mountain View Shoreline Regional Park Community (Shoreline Community) was established in 1969 pursuant to the provisions of the Mountain View Shoreline Regional Park Community Act (Act). The purpose of the Shoreline Community is to provide for the development of approximately 1,550 acres of Bayfront lands.
The Shoreline Community is an integral part of the City of Mountain View (City). The Shoreline Community's Board (Board) is comprised of the same members as the City Council and the City's management has operational responsibility of the Shoreline Community. Therefore, the Shoreline Community is considered a blended component unit of the City and its financial activities are included within the City's annual comprehensive financial report.
The Shoreline Community's primary source of revenue is property taxes, which are computed and allocated to the Shoreline Community as follows:
The assessed valuation of all property within the Shoreline Community's boundaries is determined and "frozen" for allocation purposes on the date of adoption by the Shoreline Community of a designation of a "base year" assessment roll. Shoreline Community designated the fiscal year ended 1977-78 as the base year.
Increments in property taxes resulting from any increase in assessed values after the adoption of the Shoreline Community are allocated to the Shoreline Community; all property taxes on the "frozen" assessed valuation of the property are allocated to the City and other taxing entities receiving taxes within the Shoreline Community's boundaries.
The Shoreline Community has no power to levy or collect taxes. Any legislative property tax reduction would lower the amount of tax revenues that would otherwise be available to pay principal and interest on debt or loans from the City and any increase in the tax rate or assessed valuation or any elimination of present exemptions would increase the amount of tax revenues available for this purpose. The Shoreline Community is also authorized to finance the North Bayshore Plan from other sources, including assistance from the City, the State and federal governments, interest income and the issuance of Shoreline Community debt.
The Shoreline Community's basic financial statements are prepared in conformity with accounting principles generally accepted in the United States of America (GAAP). The Governmental Accounting Standards Board (GASB) is the acknowledged standard setting body for establishing accounting and financial reporting standards followed by governmental entities. These standards require that the financial statements described below be presented.
Government-wide Statements - The Statement of Net Position and the Statement of Activities display information about the financial activities of the primary government (the Shoreline Community). Eliminations have been made to minimize the double counting of internal activities.
Notes to Basic Financial Statements
For the Year Ended June 30, 2025
A. Basis of presentation (Continued)
The Statement of Activities presents a comparison between direct expenses and program revenues for each function of the Shoreline Community's activities. Direct expenses are those that are specifically associated with a program or function and, therefore, are clearly identifiable to a particular function. Program revenues include (a) charges paid by the recipients of goods or services offered by the programs, and (b) grants and contributions of capital assets or resources that are restricted for capital purposes. Revenues that are not classified as program revenues, including all taxes, are presented as general revenues.
Fund Financial Statements - The fund financial statements provide information about the Shoreline Community's funds. The emphasis of fund financial statements is on major individual funds, each of which is displayed in a separate column.
B. Major Funds
The Shoreline Community reports major governmental funds in the basic financial statements as follows:
Shoreline Regional Park Community Fund (General) - This fund receives property tax revenues on properties within the Shoreline Community. The fund accounts for the revenues and expenditures of the Shoreline Community. This is the operating fund of the Shoreline Community.
Shoreline Regional Park Community 2018 Revenue Bonds Fund (Debt Service) - This fund accounts for the resources used for the purpose of paying the principal, interest and related costs on the Shoreline Regional Park Community 2018 Revenue Bonds (Series A and Series B) as they become due.
Shoreline Regional Park Community 2022 Revenue Bonds Fund (Debt Service) - This fund accounts for the resources used for the purpose of paying the principal, interest and related costs on the Shoreline Regional Park Community 2022 Refunding Revenue Bonds Series A as they become due.
The government-wide, proprietary fund, and fiduciary fund financial statements are reported using the economic resources measurement focus and the full accrual basis of accounting. Revenues are recorded when earned and expenses are recorded at the time liabilities are incurred, regardless of when the related cash flows take place.
Governmental funds are reported using the current financial resources measurement focus and the modified accrual basis of accounting. Under this method, revenues are recognized when measurable and available. The Shoreline Community considers all revenues reported in the governmental funds to be available if the revenues are collected within sixty days after fiscal year end.
Expenditures are recorded when the related fund liability is incurred, except for principal and interest on general long-term debt which are recognized as expenditures to the extent they have matured and are due and payable at year end. Capital asset acquisitions are reported as expenditures in governmental funds. Proceeds from long-term debt issuance and acquisitions under capital leases are reported as other financing sources.
For the Year Ended June 30, 2025
Non-exchange transactions, in which the Shoreline Community gives or receives value without directly receiving or giving equal value in exchange, include property taxes, grants, entitlements and donations. On the accrual basis, revenues from property taxes are recognized in the fiscal year for which the taxes are levied. Revenues from grants, entitlements and donations are recognized in the fiscal year in which all eligibility requirements have been satisfied.
Those revenues susceptible to accrual are property taxes, earned grant entitlements, and investment revenue. All other revenue items are considered to be measurable and available only when cash is received.
The Shoreline Community may receive funding for specific programs that is restricted to the operations of these programs. The Shoreline Community also receives unrestricted revenues from different funding sources. When restricted program expenses are incurred, it is the Shoreline Community's policy to first apply revenues from the restricted sources to these programs and then apply unrestricted general revenue. Certain indirect costs are included in program expenses reported for individual functions and activities.
The County of Santa Clara (County) assesses properties and bills, collects, and distributes property taxes to the Shoreline Community. The County remits to the Shoreline Community the entire amount levied above the frozen base and handles all delinquencies, retaining interest and penalties. Secured and unsecured property taxes are levied on July 1 for the fiscal year.
Secured property tax becomes a lien on January 1 and is due in two installments, on November 1 and February 1. It becomes delinquent after December 10 and April 10, respectively. Unsecured property tax bills are distributed in July and are due upon receipt, and become delinquent after August 31. Collection of delinquent accounts is the responsibility of the County, which retains all penalties.
The term "unsecured" refers to taxes on personal property other than real estate, land and buildings and are secured by liens on the property owner. Unsecured may also include the property taxes paid in lieu on leased property. Property tax revenues are recognized by the Shoreline Community in the fiscal year they are levied, provided they become available as defined above.
In addition to assets, the Statement of Net Position reports a separate section for deferred outflows of resources. This separate financial statement element, deferred outflows of resources, represents a consumption of net assets or fund balance that applies to a future period(s) and so will not be recognized as an outflow of resources (expense/expenditure) until then.
In addition to liabilities, the Statement of Net Position reports a separate section for deferred inflows of resources. This separate financial statement element, deferred inflows of resources, represents an acquisition of net assets or fund balance that applies to a future period(s) and so will not be recognized as an inflow of resources (revenue) until that time.
For the Year Ended June 30, 2025
For purposes of measuring the net pension liability and net OPEB liability, deferred outflows/inflows of resources related to pension and OPEB, and pension and OPEB expenses, information about the fiduciary net position of the City's Pension and OPEB plans and additions to/deductions from the plans' fiduciary net positions have been determined on the same basis as they are reported by the California Public Employees' Retirement System (CalPERS) and the California Employer's Retiree Benefit (CERBT) Trust Fund, respectively. For this purpose, benefit payments (including refunds of employee contributions) are recognized when due and payable in accordance with the benefit terms. CalPERS plan member contributions are recognized in the period in which the contributions are due. Investments are reported at fair value. The Shoreline Community's financial statements reflect its proportionate share of the Pension and OPEB liabilities, deferred outflows/inflows of resources and expenses.
The Community adopted new accounting standards in order to conform to the following Governmental Accounting Standards Board Statements in Fiscal Year 2024-25:
1. In June 2022, the GASB issued Statement No. 101, Compensated Absences. The objective of this statement is to better meet the information needs of financial statement users by updating the recognition and measurement guidance for compensated absences. That objective is achieved by aligning the recognition and measurement guidance under a unified model and by amending certain previously required disclosures. Implementation of these requirements did not have a significant impact on the Community’s financial statements for the fiscal year ended June 30, 2025.
2. In December 2024, the GASB issued Statement No. 102, Certain Risk Disclosures. The objective of this Statement is to provide users of government financial statements with essential information about risks related to a government’s vulnerabilities due to certain concentrations or constraints. Implementation of these requirements did not have a significant impact on the Community’s financial statements for the fiscal year ended June 30, 2025.
The Community is currently analyzing its accounting practices to identify the potential impact on the financial statements for the GASB statements as follows:
1. In April 2025, the GASB issued Statement No. 103, Financial Reporting Model Improvements. The objective of this Statement is to improve key components of the financial reporting model to enhance its effectiveness in providing information that is essential for decision making and assessing a government’s accountability. The requirements of this statement are going to be effective for the Community’s fiscal year ending June 30, 2026.
For the Year Ended June 30, 2025
G. Effects of New GASB Pronouncements (Continued)
2. In September 2025, the GASB issued Statement No. 104, Disclosure of Certain Capital Assets – The primary objective of this Statement is to provide users of government financial statements with essential information about certain types of capital assets. This Statement requires certain types of capital assets to be disclosed separately in the capital assets note disclosures required by Statement 34. Lease assets recognized in accordance with Statement No. 87, Leases, and intangible right-to-use assets recognized in accordance with Statement No. 94, Public-Private and Public-Public Partnerships and Availability Payment Arrangements, should be disclosed separately by major class of underlying asset in the capital as-sets note disclosures. Subscription assets recognized in accordance with Statement No. 96, Subscription-Based Information Technology Arrangements, also should be separately disclosed. In addition, this Statement requires intangible assets other than those three types to be disclosed separately by major class. The requirements of this statement are going to be effective for the Community’s fiscal year ending June 30, 2026.
The preparation of financial statements in conformity with accounting principles generally accepted in the United States of America (GAAP) requires management to make estimates and assumptions that affect the reported amounts of assets and liabilities and disclosure of contingent assets and liabilities at the date of the financial statements and the reported amounts of revenues and expenditures/expenses during the reporting period. Actual results could differ from those estimates.
The Shoreline Community adopts an annual budget before July 1 for the ensuing fiscal year for the Shoreline Regional Park Community Fund.
No annual budgets are adopted for the Shoreline Community's Debt Service Funds. Repayment of the debt is authorized by the adoption of the indenture provisions for the life of the debt.
Budget appropriations become effective each July 1. The Board may amend the budget during the fiscal year. The legal level of budgetary control has been established at the fund and department level. Appropriations generally lapse at the end of the fiscal year to the extent they have not been expended or encumbered.
The Shoreline Regional Park Community Fund's annual budget is presented on a basis consistent with the basic financial statements prepared in accordance with GAAP.
Budgeted revenue amounts represent the original budget modified by adjustments authorized during the fiscal year. Budgeted expenditure amounts represent original appropriations adjusted for supplemental appropriations during the fiscal year and reappropriated amounts for encumbrances and donations outstanding at the end of each prior fiscal year.
The Shoreline Community's Board must approve appropriation increases to departmental budgets; however, management may transfer Board-approved budgeted amounts within fund and departmental expenditure classifications. Judgments, settlements and accrual entries are not subject to budgetary control and expenditures exceeding budget due to these items do not constitute a violation of budget policy or control. Supplemental appropriations were approved during the course of the fiscal year as needed.
For the Year Ended June 30, 2025
B. Encumbrance Accounting
Under encumbrance accounting, purchase orders, contracts and other commitments for the expenditure of monies are recorded in order to reserve that portion of the applicable appropriation. Encumbrance accounting is employed as an extension of formal budgetary integration. Encumbrances outstanding at fiscal year-end are automatically reappropriated for inclusion in the following fiscal year's budget.
A. Classification
Cash and investments are classified in the financial statements, based on whether or not their use is restricted under the terms of debt instruments. Investments are carried at fair value as of June 30, 2025. Cash and investments are as follows (dollars in thousands):
The Shoreline Community's cash and investments of $126.9 million are invested in the City's cash and investments pool. Restricted cash and investments are held by bond trustee and are invested in money market mutual funds.
The City Council is responsible for the regulatory oversight of the City 's cash and investments pool. The City's Investment Policy and the California Government Code permit investments in the following: Securities issued by the U.S. Government or as an agency of the U.S. Government, mortgage-backed securities, commercial paper, banker's acceptances, medium term notes issued by U.S. corporations, mutual funds invested in U.S. government securities, negotiable certificates of deposit, municipal bonds issued by the City or any of its component units, the Local Agency Investment Fund (LAIF), and Supranational securities.
As of June 30, 2025, the City's cash and investments pool was comprised primarily of investments in securities issued by the U.S. Government and its agencies, medium term notes, supranational securities, LAIF, bonds issued by the Shoreline Community, and money market mutual funds. The City's cash and investments pool is unrated and has a modified duration of 1.88 years. Additional information regarding the interest rate, credit, concentration of credit risks and fair value hierarchy of the City's cash and investments pool can be found in the notes to the City's basic financial statements.
The Shoreline Community must maintain required amounts of cash and investments with trustees or fiscal agents under the terms of its debt issues. These funds are pledged as reserves to be used if the Shoreline Community fails to meet its obligations under these debt issues. The investment of debt proceeds held by bond trustee is governed by provisions of the debt agreements, rather than the general provisions of the California Government Code or the City' s Investment Policy. These debt agreements do not address interest rate, credit and concentration of credit risks.
For the Year Ended June 30, 2025
The investment types that are authorized for investments held by bond trustee are as follows:
Maximum
Authorized Investment TypeMaturity
U.S. Treasury ObligationsNo Limit
U.S. Agency SecuritiesNo Limit
Deposit Accounts, Federal Funds and Banker's Acceptances180 days
FDIC Insured Certificates of DepositNo Limit
Commercial Paper180 days
Money Market Mutual FundsNo Limit
State and Local Agency BondsNo Limit
Insurer Approved Investment ContractsNo Limit
Insurer Approved Other Forms of Investments Including
Repurchase AgreementsNo Limit
Local Agency Investment Fund (LAIF)No Limit
Certificate of deposit2 years
Interest rate risk is the risk that changes in market interest rates will adversely affect the fair value of an investment. Generally, the longer the maturity of an investment, the greater the sensitivity of its fair value to changes in market interest rates. The City monitors the interest rate risk inherent in its portfolio by measuring the modified duration (modified duration is a measure of a fixed income's cash flows using present values, weighted for cash flows as a percentage of the investments' full price) of its portfolio. The City monitors interest rate risk inherent in investments held by the trustee by using specific identification. The Shoreline Community's investments in money market mutual funds are available for withdrawal on demand and as of June 30, 2025, have an average maturity of less than 60 days.
Generally, credit risk is the risk that an issuer of an investment will not fulfill its obligation to the holder of the investment. This is measured by the assignment of a rating by a nationally recognized statistical rating organization. As of June 30, 2025, the Shoreline Community's investments in money market mutual funds are rated A+ by Standard & Poor's.
The Shoreline Community is required to disclose investments that represent a concentration of 5.0 percent or more of investments in any one issuer other than U.S. Treasury Obligations, money market funds and external investment pools. As of June 30, 2025, none of the Shoreline Community's investments are subject to concentration of credit risk disclosure.
For the Year Ended June 30, 2025
The Shoreline Community categorizes its fair value measurements within the fair value hierarchy established by generally accepted accounting principles. The hierarchy is based on the valuation inputs used to measure fair value of the assets. Level 1 inputs are quoted prices in an active market for identical assets; Level 2 inputs are significant other observable inputs; and Level 3 inputs are significant unobservable inputs. The Shoreline Community's investment in the U.S. Treasury Obligations are measured using level 2 inputs, while investment in the City's cash and investments pool and money market mutual funds are not subject to fair value hierarchy. Investments measured using level 2 inputs are valued using prices determined by the use of matrix pricing techniques maintained by the pricing vendors for these investments. Matrix pricing is used to value investments based on the investments' relationship to benchmark quoted prices.
With Board approval, resources may be transferred from one fund to another. The purpose of the majority of transfers is to allocate resources from the fund that receives them to the fund where they will be spent without a requirement for repayment. For the fiscal year ended June 30, 2025, Shoreline Regional Park Community Fund transferred $3.6 million, and $1.8 million, to the Shoreline Regional Park Community 2018 Revenue Bonds Fund, and Shoreline Regional Parking Community 2022 Revenue Bonds Fund, respectively, to fund debt service payments.
Transfers Between the Shoreline Community and the City
The City expends funds on capital projects on behalf of the Shoreline Community which transfers the required funds to the City prior to the commencement of the project. Any unspent funds are returned to the Shoreline Community upon completion of the project.
During the fiscal year ended June 30, 2025, the Shoreline Community transferred to the City $24.6 million to fund capital projects, $3.1 million for equipment replacements, and $48,000 for operating costs. The City transferred $5.6 million to the Shoreline Community to return interest earnings on available capital projects balances and unspent funds on completed capital projects.
All capital assets, including intangible assets, are valued at historical cost or estimated historical cost if actual historical cost is not available. Donated capital assets, donated works of art and similar items, and capital assets received in a service concession arrangement are valued at their acquisition value. The Shoreline Community defines capital assets as assets with an initial individual cost of more than $100,000 for land and infrastructure, $25,000 for buildings and improvements other than buildings, and $5,000 for others, and an estimated useful life in excess of two years.
For the Year Ended June 30, 2025
Depreciation is provided using the straight-line method, which means the cost of the asset is divided by its expected useful life in years and the result is charged to expense each fiscal year until the asset is fully depreciated. The Community has assigned the useful lives to capital assets as follows:
Major outlays for capital assets and improvements are capitalized as projects are constructed.
A. Capital Asset Activities
Capital assets activity for the fiscal year ended June 30, 2025, is as follows (dollars in thousands):
During the fiscal year ended June 30, 2025, the Shoreline Community transferred certain infrastructure including bridges and culverts; sidewalks, curbs and gutters; and streets and roads funded by the Shoreline Community totaling $1.6 million to the City in accordance with the Act.
Notes to Basic Financial Statements
For the Year Ended June 30, 2025
B. Depreciation Allocation
Depreciation expense is charged to functions and programs based on their usage of the related assets. The amounts allocated to each governmental activity function for the fiscal year ended June 30, 2025 are as follows (dollars in thousands):
C. Construction Commitments
The Shoreline Community has active construction projects that include land; improvements other than buildings; and infrastructure. Commitments with contractors for construction, as of June 30, 2025, are as follows (dollars in thousands):
Spent Remaining to DateCommitment
The Shoreline Community generally incurs long-term debt to finance projects or purchase assets, which will have useful lives equal to or greater than the related debt. The Shoreline Community's debt issues and transactions are summarized below and discussed in detail thereafter.
Notes to Basic Financial Statements
For the Year Ended June 30, 2025
A. Composition and Changes
Noncurrent liabilities activities for the fiscal year ended June 30, 2025, are as follows (dollars in thousands):
Regional Park Community 2022
2018 Revenue Bonds Shoreline Regional Park Community - On December 19, 2018, the Shoreline Community issued 2018 Revenue Bonds, Series A (Tax-Exempt) and Series B (Taxable) (2018 Bonds) of $53.5 million and $10.3 million, respectively. Proceeds from the 2018 Bonds were used to provide funds to acquire and construct certain capital improvements of benefit to the Shoreline Community. The 2018 Bonds are special obligations of the Shoreline Community and are secured by a portion of all taxes levied upon all taxable property within the Shoreline Community Principal payments are payable annually on August 1 and interest payments semi-annually on August 1 and February 1 from property tax revenues generated within the Shoreline Community. The Shoreline Community is considered to be in default if the Shoreline Community fails to pay the principal of and interest on the outstanding bonds when become due and payable. If an event of default has occurred and is continuing, the trustee may, and if requested in writing by the owners of a majority in aggregate principal amount of the bonds then outstanding, declare the accreted value and principal of the bonds, together with the accrued interest, to be due and payable immediately.
For the Year Ended June 30, 2025
B. Descriptions of Noncurrent Liabilities (Continued)
2022 Refunding Revenue Bonds
Shoreline Regional Park Community - On November 22, 2022, the Shoreline Community issued the 2022 Bonds of $21.6 million through private placement. Proceeds from the 2022 Bonds were used to fully refund the outstanding 2011 Bonds of $21,100,000. The 2022 Bonds are special obligations of the Shoreline Community and are secured by a portion of all taxes levied upon all taxable property within the Shoreline Community. Principal payments are payable annually on August 1 and interest payments semi-annually on August 1 and February 1 from property tax revenues generated within the Shoreline Community. The refunding resulted in net present value savings of $1.1 million. The Shoreline Community is considered to be in default if the Shoreline Community fails to pay the principal of and interest on the outstanding bonds when they become due and payable. If an event of default has occurred and is continuing, the trustee may, and if requested in writing by the owners of a majority in aggregate principal amount of the bonds then outstanding, declare the accreted value and principal of the bonds, together with the accrued interest, to be due and payable immediately.
C. Debt Service Requirements
The pledge of future tax increment revenues ends upon repayment of the $137.0 million in remaining debt service on the Shoreline Community's Revenue Bonds, which is scheduled to occur in Fiscal Year 2048-49. For the fiscal year ended June 30, 2025, tax increment revenues amounted to $73.2 million, which represented coverage of 12.6 over the $5.8 million in debt service.
Annual debt service requirements to maturity are as follows (dollars in thousands):
For the Year Ended June 30, 2025
Plan Descriptions – All qualified regular and probationary employees are eligible to participate in the City's Miscellaneous Plan (Plan), agent multiple-employer defined benefit pension plan administered by the California Public Employees' Retirement System (CalPERS), which acts as a common investment and administrative agent for its participating member employers. Benefit provisions under the Plan are established by State statute and City resolution. CalPERS issues publicly available reports that include a full description of the pension plans regarding benefit provisions, assumptions and membership information that can be found on the CalPERS website at www.cal pers.ca.gov. The Shoreline Community participates in a cost-sharing arrangement in the City's Plan and a proportionate share of pension balances are allocated to the Shoreline Community.
Benefits Provided – CalPERS provides service retirement and disability benefits, annual cost-of- living adjustments and death benefits to plan members, who must be public employees and beneficiaries. Benefits are based on years of credited service, age at retirement and compensation. The cost-of-living adjustments for the CalPERS plans are applied as specified by the Public Employees' Retirement Law. The California Public Employees' Pension Reform Act (PEPRA), which became effective in January 2013, changes the way CalPERS retirement and health benefits are applied, and places compensation limits on members. As such, members who established CalPERS membership on or after January 1, 2013, are known as "PEPRA" members.
The Plans’ provisions and benefits in effect at June 30, 2025, are summarized as follows:
Miscellaneous
Prior to On or after
Hire Date
January 1, 2013January 1, 2013
Benefit formula 2.7% 55 2.0% @ 62
Benefit vesting schedule 5 years service5 years service
Benefit payment Monthly for lifeMonthly for life
Contributions – Section 20814(c) of the California Public Employees' Retirement Law requires the employer contribution rates for all public employers to be determined on an annual basis by the CalPERS actuary and shall be effective on the July 1 following notice of a change in the rate. The actuarially determined rate is the projected amount necessary to finance the costs of benefits earned by employees during the year, with an additional amount to finance any unfunded accrued liability. The Shoreline Community is required to contribute its proportionate share of the difference between the actuarially determined rate and the contribution rate of employees. For Fiscal Year 2024-25, the Shoreline Community recognized $942,000 as contributions for pension.
For the Year Ended June 30, 2025
The Shoreline Community's net pension liability in the Plan is measured as the proportionate share of the City's net pension liability. The net pension liability of the Plan is measured as of June 30, 2024, and the total pension liability used to calculate the net pension liability was determined by an actuarial valuation as of June 30, 2023 using standard update procedures. The Shoreline Community's proportion of the net pension liability was based on the projection of the Shoreline Community's long-term share of contributions to the pension plan relative to the projected contributions of all participating City funds, actuarially determined.
The change in the Shoreline Community's proportionate share of the net pension liability as of June 30, 2025 and 2024, (measurement dates of June 30, 2024 and 2023, respectively) for the Plan are as follows (dollars in thousands):
Proportion of the City's Miscellaneous Plan Net Pension Liability
Actuarial Assumptions – The total pension liabilities in the June 30, 2023 actuarial valuations were determined using actuarial assumptions as follows:
Miscellaneous Plan
Valuation DateJune 30, 2023
Measurement DateJune 30, 2024
Actuarial Cost MethodEntry-Age Normal Cost Method
Actuarial Assumptions:
Projected Salary IncreaseVaries by Entry Age and Service Post Retirement Benefit IncreaseThe lessor of contract COLA or 2.30% until Purchasing Power Protection Allowance Floor on purchasing power applies, 2.30% thereafter.
MortalityDerived using CalPERS Membership Data for all Funds (1)
(1) The mortality table used was developed based on CalPERS’ specific data. The probabilities of mortality are based on the 2021 CalPERS Experience Study and Review of Actuarial Assumptions. Mortality rates incorporate full generational mortality improvement using 80% of Scale MP-2020 published by the Society of Actuaries. For more details on this table, please refer to the 2021 experience study report from November 2021 that can be fo und on the CalPERS website.
For the Year Ended June 30, 2025
All other actuarial assumptions used in the June 30, 2023 actuarial valuation were based on the 2021 CalPERS Experience Study for the period from 2001 to 2019, including updates to salary increase, mortality and retirement rates. Further details of the 2021 CalPERS Experience Study can be found on the CalPERS website under Forms and Publications.
Change of Assumptions – There were no assumption changes in measurement period 2024.
Discount Rate – The discount rate used to measure the total pension liability was 6.90 percent. The projection of cash flows used to determine the discount rate assumed that the contributions from plan members will be made at the current member contribution rates and that contributions from employers will be made at statutorily required rates, actuarially determined. Based on those assumptions, the plan’s fiduciary net position was projected to be available to make all projected future benefit payments of current plan members. Therefore, the long-term expected rate of return on plan investments was applied to all periods of projected benefit payments to determine the total pension liability.
The long-term expected rate of return on pension plan investments was determined using a building-block method in which expected future real rates of return (expected returns, net of pension plan investment expense and inflation) are developed for each major asset class.
In determining the long-term expected rate of return, CalPERS took into account both short-term and longterm market return expectations. Using historical returns of all of the funds’ asset classes, expected compound (geometric) returns were calculated over the next 20 years using a building-block approach. The expected rate of return was then adjusted to account for assumed administrative expense of 10 basis points. The expected real rates of return by asset class are as follows:
(1) - An expected inflation of 2.30% used for this period.
(2) - Figures are based on the 2021 Asset Liab ility Management study.
For the Year Ended June 30, 2025
Sensitivity of the Net Pension Liability to Changes in the Discount Rate - The Shoreline Community's proportionate share as of the measurement date, calculated using the discount rate of 6.90 percent, as well as what the Shoreline Community's net pension liability would be if it were calculated using a discount rate that is one percentage point lower or one percentage point higher than the current rate are as follows (dollars in thousands):
Shoreline Community's proportionate share of the City's Miscellaneous Plan
For the fiscal year ended June 30, 2025, the Shoreline Community recognized pension expense of $1,131,000. The Shoreline Community reported deferred outflows of resources related to pensions by sources for the fiscal year ended June 30, 2025 are as follows (dollars in thousands):
As of June 30, 2025, the Shoreline Community reported $942,000 as deferred outflows of resources related to contributions subsequent to the measurement date which will be recognized as a reduction of the net pension liability in the fiscal year ending June 30, 2025. Net amounts reported as deferred outflows of resources and deferred inflows of resources related to pensions will be recognized as pension expense are as follows (dollars in thousands):
Notes to Basic Financial Statements
For the Year Ended June 30, 2025
Plan Descriptions – By Council resolution and through agreements with its labor units, the City provides certain health care benefits for retirees (spouse and dependents are not included for CalPERS Miscellaneous employees, but are included for CalPERS Safety employees in the CalPERS Health Program governed by the Public Employees' Medical and Hospital Care Act (PEHMCA)) under a single employer defined benefit OPEB plan. In December 2008, the City entered into an agreement with CalPERS to participate in CERBT, an agent multiple-employer other postemployment benefits plan, to fund the Citys OPEB. CERBT is administrated by CalPERS, is managed by an appointed board not under the control of the City Council. CERBT issues a publicly available financial report that can be found on the CalPERS website at www.calpers.ca.gov. The Shoreline Community participates in a cost-sharing arrangement in the City's OPEB plan and a proportionate share of OPEB balances are allocated to the Shoreline Community.
The City also offers a Defined Contribution (DC) Plan to eligible miscellaneous employees. If an employee elects to participate in the DC Plan, the City makes contributions on behalf of the employee into a Health Savings Account (HSA). Employees who have elected the DC Plan are not included in the City's actuarial valuation for OPEB.
Benefits Provided – The City provides medical and vision OPEB benefits. Additional information regarding the benefits provided for the City's OPEB plan can be found in the notes to the City's basic financial statements.
Contributions – The City's OPEB funding policy is to contribute 100 percent or more of the actuarially determined contribution each year. For the fiscal year ended June 30, 2025, the Shoreline Community's contributions totaled $528,000.
The Shoreline Community's net OPEB liability in the City's OPEB Plan is measured as the proportionate share of the City's net OPEB liability. The City's net OPEB liability is measured as of June 30, 2024 was determined by an actuarial valuation as of June 30, 2023 using standard update procedures. The Shoreline Community's proportion of the net OPEB liability was based on the projection of the Shoreline Community's long-term share of contributions to the OPEB plan relative to the projected contributions of all participating City funds, actuarially determined.
The change in the Shoreline Community's proportionate share of the net OPEB liability as of June 30, 2025 and 2024 (measurement dates of June 30, 2024 and 2023, respectively) for the OPEB Plan is as follows (dollars in thousands):
For the Year Ended June 30, 2025
Actuarial Assumptions – The total OPEB liability as of June 30, 2024 were determined using actuarial assumptions as follows:
Valuation Date June 30, 2023
Measurement Date June 30, 2024
Actuarial Cost Method
Actuarial Assumptions:
Entry-Age Normal Cost Method
Discount Rate 5.60%
Inflation 2.50%
Projected Salary Increase 3.00%
Healthcare cost trend rates
6.0% in 2026, fluctuating down to 3.9% by 2075
Mortality 2021 CalPERS Experience Study
Mortality Improvement MW Scale 2022
(1) Demographic actuarial assumptions used are based on the 2021 CalPERS Experience Study for the period from 1997 to 2019, except for using the MacLeod Watts Scale 2020 applied generationally from 2015 as the basis to project future morality improvements.
Change in Assumptions – There were no changes in assumptions during measurement.
Discount Rate - The discount rate used to measure the total OPEB liability is 5.6 percent. The projection of cash flows used to determine the discount rate assumed that the City's contribution will be made equal to the actuarially determined contribution. Based on those assumptions, the OPEB plan's fiduciary net position was projected to be available to make all projected OPEB payments for current active and inactive employees. Therefore, the long-term expected rate of return on OEPB plan investments is applied to all periods of projected benefit payments to determine the total OPEB Liability.
The long-term expected rate of return for OPEB plan investments is 5.6 percent. Using historical returns of all the funds' asset classes, expected compound geometric returns were calculated over the short -term (15 years) and the long-term (6-20 years) using a building-block approach:
The long-term expected real rate of return by asset class and the target allocation are as follows:
To derive the expected future trust return specifically for the City, we first adjusted CalPERS' future return expectations to align with the 2.5% general inflation assumption used in this report. Then applying the plan specific benefit payments (as determined from the June 30, 2023, valuation) to CalPERS' bifurcated return expectation, we determined the single equivalent long-term rate of return to be 5.60%.
Notes to Basic Financial Statements
For the Year Ended June 30, 2025
Sensitivity of the Net OPEB Liability (Asset) to Changes in the Discount Rate – The Shoreline Community ' s proportionate share of the net OPEB liability, calculated using the discount rate of 5.6 percent, as well as what the net OPEB liability would be if it were calculated using a discount rate that is one percentage point lower or one percentage point higher than the current rate are as follows (dollars in thousands):
Sensitivity of the Net OPEB Liability (Asset) to Changes in the Healthcare Cost Trend Rates – The net OPEB liability of the City , as well as what the City's net OPEB liability would be if it were calculated using healthcare cost trend rates that are one percentage point lower or one percentage point higher than the current rate are as follows (dollars in thousands):
For the fiscal year ended June 30, 2025, the Shoreline Community recognized OPEB income of $215,000. As of June 30, 2025, the Shoreline Community reported $1.6 million as deferred outflows of resources related to contributions for OPEB subsequent to the measurement date, which will be recognized as a reduction of the net OPEB liability in the fiscal year ending June 30, 2025.
The Shoreline Community is covered under the City's insurance program and therefore contributes its proportionate share of cost. The City is exposed to various risks of loss related to torts, errors and omissions, injuries to employees or others, and unemployment. The City has established various self-insurance programs to account for and finance its uninsured risks of loss. Under the self-insurance programs, the City retains the risk of loss up to a maximum of $1.0 million for general liability claims, $750,000 for workers' compensation claims with statutory excess insurance and actual costs incurred for unemployment.
For general liability claims, the City has excess liability coverage through the Authority for California Cities Excess Liabilities (ACCEL) to cover the risk of loss for claims in excess of $1.0 million per incident. ACCEL is a joint powers authority of medium-sized California municipalities, which pools catastrophic general liability, automobile liability and public officials' errors and omissions losses.
Additional information regarding the City's insurance program can be found in the notes to the City's basic financial statements
For the Year Ended June 30, 2025
Net position is the excess of all assets and deferred outflows of resources over all liabilities and deferred inflows of resources, regardless of fund. Net position is divided into three captions on the Statement of Net Position. These captions apply only to net position, which is determined at the Government-wide level and are described as follows:
Net investment in capital assets - This caption groups all capital assets, including infrastructure, into one component of net position. Accumulated depreciation and the outstanding balances of debt, including debt related deferred outflows and inflows of resources that are attributable to the acquisition, construction or improvement of these assets reduce the balance in this category.
Restricted - This caption represents net position, which is restricted as to use by the terms and conditions of agreements with outside parties, governmental regulations, laws or other restrictions which the Shoreline Community cannot unilaterally alter.
Unrestricted - This caption represents net position of the Shoreline Community not restricted for any project or purpose.
Governmental fund balances represent the assets and deferred outflows of resources less the liabilities and deferred inflows of resources of each fund. Governmental funds report fund balance in classifications based primarily on the extent to which the Shoreline Community is bound to honor constraints on how specific amounts in the funds can be spent. For programs with multiple funding sources, the Shoreline Community prioritizes and expends funds in the following order: Restricted, Committed, Assigned and Unassigned. Each category in the following hierarchy is ranked according to the degree of spending constraint as follows:
Nonspendable fund balances are amounts that cannot be spent because they are either (a) not in spendable form; or (b) legally or contractually required to be maintained intact.
Restricted fund balances have external restrictions imposed by creditors, grantors, contributors, laws, regulations, or enabling legislation, which requires the resources to be used only for a specific purpose. Nonspendable amounts subject to restrictions are included along with spendable resources. As of June 30, 2025, the Shoreline Community has restricted fund balances of $124.7 million for Shoreline Community indebtedness and $5.8 million for debt service.
Committed fund balances have constraints imposed by resolution of the Board, which may only be altered by resolution of the Board. Nonspendable amounts subject to Board commitments are included along with spendable resources. As of June 30, 2025, the Shoreline Community has committed fund balances of $4.6 million for capital projects.
For the Year Ended June 30, 2025
Assigned fund balances are amounts constrained by the Board's intent to be used for a specific purpose, but are neither restricted nor committed. Intent is expressed by the Board or its designees and may be changed at the discretion of the Board or its designees. The Board has not delegated the authority to make assignments of fund balance. This category also includes residual fund balances which have not been restricted or committed.
Unassigned fund balance represents residual fund deficits.
The Shoreline Regional Park Community Special Revenue Fund shall maintain a reserve of 25 percent of operating expenditures; the landfill reserve shall be incrementally increased to accumulate funds to rebuild the landfill system based on the most recent Landfill Master Plan. The reserve shall have adequate balance to rebuild the landfill system, in case of a catastrophic event; and the sea level rise reserve is to be incrementally increased to accumulate funds for projects identified in the most recent Shoreline Sea Level Rise Study. The contributed amount shall be determined annually based on the available resources, timeline of the projects, and results of the Shoreline Sea Level Rise Study.
In 2013, CalRecycle regulations required the City to create a reserve, in whole or incrementally, for potential corrective actions associated with a non-water release event at the landfill site. The estimated costs of the corrective actions are adjusted annually by an inflation factor approved by CalRecycle. On June 25, 2013, the City Council approved to restrict funds for landfill containment in the Landfill reserve of the Shoreline Community Fund. The City estimated the costs for the corrective actions to be $1.2 million for the fiscal year ended June 30, 2025, and $13.0 million to rebuild a new landfill system. As of June 30, 2025, the City restricted $13.0 million for landfill containment and planned to increase the balance to accumulate funds to rebuild the landfill system based on the most recent Landfill Master Plan.
Notes to Basic Financial Statements
For the Year Ended June 30, 2025
A. Encumbrances
The Shoreline Community's outstanding encumbrances as of June 30, 2025, are $430,000 recorded as part of restricted fund balance.
On June 30, 2013, the Shoreline Community entered into an Education Enhancement JPA with the Mountain View Los Altos Unified High School District (MVLAUHSD) and the Mountain View Whisman School District (MVWSD) effective July 1, 2013, for a period of 10 years, superseding any prior agreements dating back to the first such agreement in 2006. The purpose of the Education Enhancement JPA is to create an Education Enhancement Reserve in which funds provided by the Shoreline Community are used to enhance the educational and technology capacity of students in the districts, which will contribute to the availability of a local technology workforce to further the objectives of the Shoreline Community. The agreement provides for minimum annual payments, which commenced with the fiscal year ended June 30, 2014, and have increased annually based on growth in property tax revenues in the preceding fiscal year. Each subsequent fiscal year increases based on growth in property tax revenues in the preceding fiscal year. The Agreement expired in June 2023. In May 2023, the Shoreline Community and the school districts extended the Agreement until June 30, 2024. An amendment to the 2023 EER Agreement, dated June 13, 2024, for a three-year extension was finalized in October 2024. In May 2025, a new EER Agreement was executed by all parties to supersede any prior agreements and will remain effective through June 30, 2035.
For the fiscal year ended June 30, 2025, the Shoreline Community paid a total of $12.0 million in contributions to the school districts, including $7.3 million to MVWSD and $4.7 million to MVLAUHSD.
Pursuant to an agreement between the City, the Shoreline Community, and the County dated June 22, 2005, the Shoreline Community is annually obligated to pay the County from tax revenues, an amount equal to the County’s total retirement tax override levies and pass-through an additional amount of taxes that would have been allocated to the County in the absence of the existence of the Shoreline Community. For the fiscal year ended June 30, 2025, $2.8 million and $3.5 million in retirement tax override levies and pass-through payments, respectively, were paid to the County.
Required Supplementary Information
For the year ended June 30, 2025 (Dollars in Thousands)
Note to schedule:
BenefitChanges-Thefiguresabovegenerallyincludeanyliabilityimpactthatmayhaveresultedfromvoluntary benefitchangesthatoccurredonorbeforetheMeasurementDate.However,offersofTwoYearsAdditionalService Credit(a.k.a.GoldenHandshakes)thatoccurredaftertheValuationDatearenotincludedinthefiguresabove,unless theliabilityimpactisdeemedtobematerialbytheplanactuary.In2022,SB1168increasedthestandardretiree lumpsumdeathbenefitfrom$500to$2,000foranydeathoccurringonorafterJuly1,2023.Theimpact,ifany,is included in the changes of benefit terms.
ChangeInassumptions-Duringmeasurementperiod2014,thediscountratewas7.50%.Duringmeasurementperiod 2015,thediscountratewasincreasedfrom7.50%to7.65%.Thereisnochangeindiscountrateduringmeasurement period2016.Duringmeasurementperiod2017,thediscountratewasreducedfrom7.65%to7.15%.During measurementperiod2018,demographicassumptionsandinflationratewerechangedinaccordancetothe2017 CalPERSExperienceStudy.Therewerenochangesinassumptionsduringmeasurementperiods2019,2020,and2021. Duringmeasurementperiod2022,thediscountratewasreducedfrom7.15%to6.90%,inflationratewasreduced from2.50%to2.30%,anddemographicassumptionswerechangedinaccordancewiththe2021CalPERSExperience Study. There were no changes in assumptions during measurement period 2023 and 2024.
6/30/20206/30/20216/30/20226/30/20236/30/20246/30/2025 201920202021202220232024
Required Supplementary Information
For the year ended June 30, 2025 (Dollars in Thousands)
Schedule of the Shoreline Community Pension Contributions
Fiscal Year Ended June 30,2016201720182019
Theactuarialmethodsandassumptionsusedtosettheactuariallydeterminedcontributionsforthe fiscal year ended June 30, 2025 were as follows:
ADC for fiscal year
June 30, 2025
Actuarial valuation date June 30, 2024
Actuarial cost method Entry-Age Normal Cost Method
Asset valuation method Actuarial value of assets
Investment rate of return
Retirement age
Mortality improvement
6.8%, net of pension plan investment and administrative expenses, includes inflation.
The probabilities of retirement are based on the 2021 CalPERS Experience Study.
The probabilities of mortality are based on the 2021 CalPERS Experience Study.
Required Supplementary Information
For the year ended June 30, 2025 (Dollars in Thousands)
Note to schedule:
ChangeInassumptions-Duringmeasurementperiod2019,thediscountratewasreducedfrom6.50%to6.25%. Demographicassumptionswerechangeinaccordancetothe2017CalPERSExperienceStudy.Thereisnochangein assumptionsduringmeasurementperiod2020.Duringthemeasurementperiod2021,thediscountratewasreduced from6.25%to6.00%.Inflationratewasreducedfrom2.75%to2.50%.Otherassumptionsincludingprojectedsalary increase,postretirementbenefitincrease,andotherdemographicassumptionswerealsochanged.Duringthe measurementperiod2022,thediscountratewasreducedfrom6.00%to5.60%.Duringthemeasurementperiod 2023,thehealthcarecostrendrateswerechangedto6.5%in2025,fluctuatingdownto3.9%by2075,Mortalitywas changedtobasedon2021CalPERSExperienceStudy,andMortalityImprovementwaschangedtobasedonMWScale 2022. There were no assumption changes during FY 2024.
*FiscalyearendedJune30,2018wasthefirstyearofimplementationofGA5BStatementNo.75,thereforeonlyeight years of information is shown.
Required Supplementary Information
For the year ended June 30, 2025
(Dollars in Thousands)
Schedule of the Shoreline Community OPEB Contributions
Fiscal Year Ended June 30,2017201820192020
required
The actuarial methods and assumptions used to set the actuarially determined contributions for the fiscal year ended June 30, 2023 were as follows:
ADC for fiscal year
Actuarial valuation date
June 30, 2025 June 30, 2023
Actuarial cost method Entry-Age Normal Cost Method
Post Retirement Benefit Increase
Mortality
For medical plan premiums: 6.50% for the year beginning, fluctuating down to 3.90% by 2075
Based on Mortality Improvement
Based on MacLeBased on MacLeod Watts Scale 2022
*Fiscal year ended June 30, 2017 was the first year of implementation of GASB Statement No. 75, therefore only nine years of information is shown.
20212022202320242025
This page intentionally left blank
This page intentionally left blank
Mountain View Shoreline Regional Park Community
Shoreline Regional Park Community Fund
June 30, 2025
The AdministrativeFund inaccordancewiththeAct,accountsformoneysmaybetransferredfromtheSpecialFundfor deposit to pay for the administrative expenses and overhead of the Shoreline Community.
The SpecialFund inaccordancewiththeAct,accountsforalltaxrevenuesreceivedbytheShorelineCommunityare depositedintheSpecialFundandwillbeusedtopaytheprincipalofandinterestonloans,advances,orother indebtedness of the Shoreline Community.
The NorthBayshoreImpactFeeFund accountsfortherevenuescollectedforfeesadoptedtoassistwithfunding improvements in the Shoreline Community.
Shoreline Regional Park Community Fund
June 30, 2025 (Dollars in Thousands)
Combining Statement of Revenues, Expenditures and Changes in Fund Balances
Shoreline Regional Park Community Fund
For the year ended June 30, 2025 (Dollars in Thousands)
This page intentionally left blank
REPORT ON INTERNAL CONTROL OVER FINANCIAL REPORTING AND ON COMPLIANCE AND OTHER MATTERS BASED ON AN AUDIT OF FINANCIAL STATEMENTS PERFORMED IN ACCORDANCE WITH GOVERNMENT AUDITING STANDARDS
Independent Auditor’s Report

BoardofDirectorsofthe
MountainViewShorelineRegionalParkCommunity CityofMountainView,California
We have audited, in accordance with auditing standards generally accepted in the United States of America and the standards applicable to financial audits contained in Government Auditing Standards issued by the Comptroller General of the United States (Government Auditing Standards), the financial statements of the governmental activities and each major fund of the Mountain View Shoreline Regional Park Community (Shoreline Community), a component unit of the City of Mountain View (City), as of and for the year ended June 30, 2025, and the related notes to the financial statements, which collectivelycomprise the ShorelineCommunity’sbasic financialstatements,and have issuedour reportthereondatedDecember9,2025.
In planning and performing our audit of the financial statements, we considered the Shoreline Community’s internal control over financial reporting (internal control) as a basis for designing procedures that are appropriate in the circumstances for the purpose of expressing our opinion on the financial statements, but not for the purpose of expressing an opinion on the effectiveness of the Shoreline Community’s internal control. Accordingly, we do not express an opinion on the effectivenessoftheShorelineCommunity’sinternalcontrol.
A deficiency in internal control exists when the design or operation of a control does not allow management or employees in the normal course of performing their assigned functions, to prevent, or detect and correct misstatements on a timelybasis. A material weakness is adeficiency, or a combination of deficiencies, in internal control, such that there is a reasonable possibility that a material misstatement of the entity’s financial statements will not be prevented, or detected and corrected on a timely basis. A significant deficiency is a deficiency, or a combination of deficiencies, in internal control that is less severe than a material weakness, yet important enough to merit attention by those charged withgovernance.
Our consideration of internal control was for the limited purpose described in the first paragraph of this section and was not designed to identify all deficiencies in internal control that might be material weaknesses or significant deficiencies. Given these limitations, during our audit we did not identify any deficiencies in internal control that we consider to be material weaknesses. However, material weaknessesorsignificantdeficienciesmayexistthatwerenotidentified.

MountainViewShorelineRegionalParkCommunity
CityofMountainView,California
Page2
As part of obtaining reasonable assurance about whether the Shoreline Community’s financial statements are free from material misstatement, we performed tests of its compliance with certain provisions of laws, regulations, contracts, and grant agreements, noncompliance with which could have a direct and material effect on the financial statements. However, providing an opinion on compliancewiththoseprovisionswasnotan objectiveofourauditand,accordingly,wedonotexpress such an opinion. The results of our tests disclosed no instances of noncompliance or other matters that arerequiredtobereportedunder GovernmentAuditingStandards.
The purpose of this report is solely to describe the scope of our testing of internal control and compliance and the results of that testing, and not to provide an opinion on the effectiveness of the entity’s internal control or on compliance. This report is an integral part of an audit performed in accordance with Government Auditing Standards in considering the entity’s internal control and compliance.Accordingly,thiscommunicationisnotsuitableforanyotherpurpose.

Badawi&Associates,CPAs Emeryville,California December9,2025