IJSART - Volume 5 Issue
4 –APRIL 2019
ISSN [ONLINE]: 2395-1052
Modelling of Short Duration Isopluvial Map For Raichur District Karnataka Mohammed Badiuddin Parvez1, M .Inayathulla 2 1
Dept of Civil Engineering Professor, Dept of Civil Engineering 1, 2 UVCE, Bangalore University, Bangalore ,Karnataka, India. 2
Abstract- Everyoneacknowledges that it rains, runoff is generated for a design point of view we should know how much and how often it rains on our project location.Estimation of rainfall intensity is commonly required for the design of hydraulic and water resources engineering control structures. The present study aimed the Estimation of rainfall intensityin Raichur District using twenty five Rain gauge Station with 19 years of rainfall data (1998 to 2016). Log Normal Distribution, techniques are used to derived the rainfall intensity values of 2,5,10,15,30,60,120,720,1440 minutes of rainfall duration with different return period. The short duration IDF using daily rainfall data are presented, which is input for water resources projects. Isopluvial maps were developed for 25years, 50years, 75years and 100years return period
The scope of this study was to predict rainfall intensity for the stations using the data of 1998 to 2016 spread in Raichur District by using Log Normal distribution and Develop Isopluvial Maps of different duration and return period. II. MATERIALS AND METHODS 2.1 Study Area
Keywords- Isopluvial Maps, Log Normal Distribution, Rainfall Duration, Return Period, Rainfall Intensity. I. INTRODUCTION Short-term, high-intensity rainfall that occurs in inland areas with poor drainage often produces urban flash floods. Densely populated areas have a high risk for flash floods. During periods of heavy rainfall, storm drains may become overwhelmed and flood roads and buildings. Low spots, such as underpasses, underground parking garages, and basements are especially vulnerable to flash floods. Rainfall is an important component in the hydrologic cycle. Quantification of rainfall is needed for planning and designing of various water resource projects. Quantification of rainfall is generally done using isopluvial maps and intensity-durationfrequency (IDF) curves (Chow et al., 1988). IDF stands for Intensity-Duration Frequency. Rainfall intensity is defined as the ratio of the total amount of rain (rainfall depth) falling during a given period to the duration of the period It is expressed in depth units per unit time, usually as mm per hour . The number of times, during a specified period of years, that precipitation of a certain magnitude or greater occurs or will occur at a station is called frequency. (FAO, 2012). Page | 973
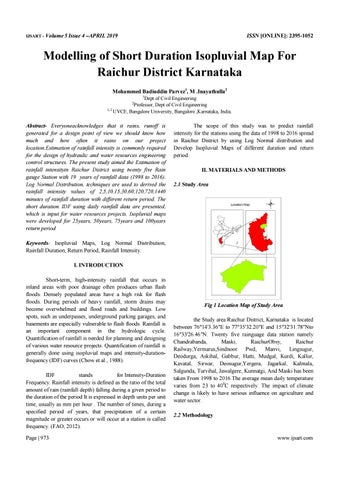
Fig 1 Location Map of Study Area the Study area Raichur District, Karnataka is located between 76°14'3.36"E to 77°35'32.20"E and 15°32'31.78"Nto 16°33'26.46"N. Twenty five rainguage data station namely Chandrabanda, Maski, RaichurObsy, Raichur Railway,Yermarus,Sindnoor Pwd, Manvi, Lingsugur, Deodurga, Askihal, Gabbur, Hatti, Mudgal, Kurdi, Kallur, Kavatal, Sirwar, Deosugur,Yergera, Jagarkal, Kalmala, Salgunda, Turvihal, Jawalgere, Kunnatgi, And Maski has been taken From 1998 to 2016.The average mean daily temperature varies from 23 to 400C respectively. The impact of climate change is likely to have serious influence on agriculture and water sector. 2.2 Methodology
www.ijsart.com