© October 2019 | IJIRT | Volume 6 Issue 5 | ISSN: 2349-6002
Estimation of Yield by Soil Conservation Service Curve Number Model for Watershed of Manvi Taluk Raichur District Karnataka Mohammed Badiuddin Parvez1, Amritha Thankachan2, Chalapathi k3, M .Inayathulla4 Research Scholar, Department of Civil Engineering, UVCE, Bangalore University, Bangalore, Karnataka, India 4 Professor, Department of Civil Engineering, UVCE, Bangalore University, Bangalore, Karnataka, India 1,2,3
Abstract- Runoff is one of the most significant hydrological variables used in most of the water resources applications. Physiographically the area is characterized by undulating topography with plains and valleys. The Soil Conservation Service Curve Numbers also known as hydrologic soil group method were used in this study. This method is adaptable and suitable approach for quick runoff estimation and is approximately easy to use with minimum data and it gives good result. From the study yearly rainfall and runoff were estimated easily. The study area covers an area of 466.02 km2, having maximum length of 36.5 km. The maximum and minimum elevation of the basin is 569 m and 341 m above MSL, respectively. Index terms- AMC Condition, Infiltration, Rainfall, Runoff
Curve
unit and the term is defined as “the total area of land above a given point on waterway that contributes runoff to the flow at that point”. The watershed management is to protect the proper utilization of all land, water and natural resources of watershed. 2 MATERIALS AND METHODS A Study Area
Number,
1. INTRODUCTION Runoff is one of the most important hydrologic variables used in most of the water resources applications. Reliable prediction of quantity and rate of runoff from land surface into streams and rivers is difficult and time consuming to obtain for ungauged watersheds, however, this information is needed in dealing with many watershed development and management problems. Conventional methods for prediction of river discharge require hydrological and metrological data. Experience has shown that SOI topomap data can be interpreted to derive thematic informations on land use/land cover, soil, vegetation, drainage, etc. which combined with conventionally measured climatic parameters (precipitation, temperature etc) and topographic parameters such as height, contour, slope provide the necessary inputs to the rainfall- runoff models. Watershed is a hydrologic
IJIRT 148701
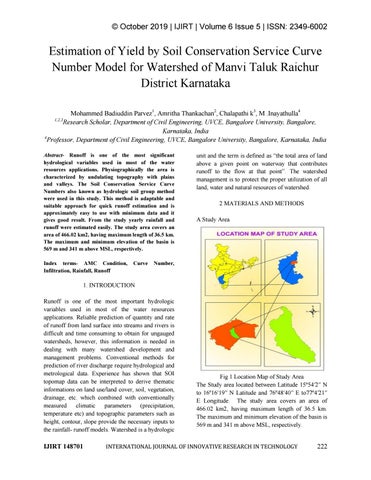
Fig 1 Location Map of Study Area The Study area located between Latitude 15º54′2′′ N to 16º16′19′′ N Latitude and 76º48′40′′ E to77º4′21′′ E Longitude. The study area covers an area of 466.02 km2, having maximum length of 36.5 km. The maximum and minimum elevation of the basin is 569 m and 341 m above MSL, respectively.
INTERNATIONAL JOURNAL OF INNOVATIVE RESEARCH IN TECHNOLOGY
222