© September 2019 | IJIRT | Volume 6 Issue 4 | ISSN: 2349-6002
Analysis of Landforms of a Mini Watershed of Manvi Taluk, Raichur District Karnataka Mohammed Badiuddin Parvez1, Chalapathi k2, M .Inayathulla2 1,2 Research Scholar, Department of Civil Engineering, UVCE, Bangalore University, Bangalore, Karnataka, India 3 Professor, Department of Civil Engineering, UVCE, Bangalore University, Bangalore, Karnataka, India Abstract- A landform is a natural or artificial feature of the solid surface of the Earth or other planetary body. Landforms together make up a given terrain, and their arrangement in the landscape is known as topography. The Study area located between Latitude 15º54′2′′ N to 16º16′19′′ N Latitude and 76º48′40′′ E to77º4′21′′ E Longitude. The study area covers an area of 466.02 km2, having maximum length of 36.5 km.The study of hypsometric properties of watershed using hypsometric integral (HI) and hypsometric curve retrieved in that, HI value is 0.51 and hence watershed falls under the Mature Stage Index terms- DEM, Drainage Hypsometry, Stream Frequency
Density,
GIS,
1. INTRODUCTION Manvi is a town located in the Raichur district of Karnataka State, India. Watershed is a natural hydrological entity from which runoff resulting from precipitation flows past a single point into large stream, river, lake or ocean. Morphometric analysis provides quantitative description of the basin geometry to understand initial slope or inequalities in the rock hardness, structural controls, recent diastrophism, geological and geomorphic history of drainage basin (Strahler, 1964). Morphometric analysis requires measurement of linear features, gradient of channel network and contributing ground slopes of the drainage basin. . A major emphasis in geomorphology over the past several decades has been on the development of quantitative physiographic methods to describe the evolution and behavior of surface drainage networks (Horton, 1945). The influence of drainage morphometry is very significant in understanding the landform processes, soil physical properties and erosional characteristics. The hypsometric analysis can be used
IJIRT 148631
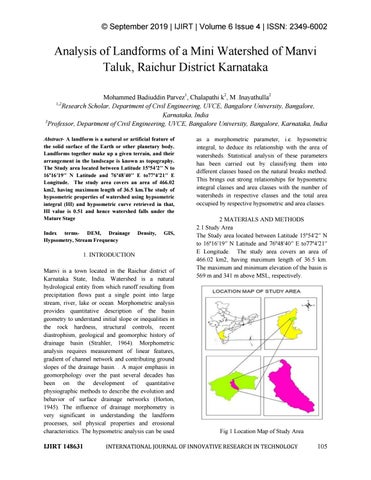
as a morphometric parameter, i.e. hypsometric integral, to deduce its relationship with the area of watersheds. Statistical analysis of these parameters has been carried out by classifying them into different classes based on the natural breaks method. This brings out strong relationships for hypsometric integral classes and area classes with the number of watersheds in respective classes and the total area occupied by respective hypsometric and area classes. 2 MATERIALS AND METHODS 2.1 Study Area The Study area located between Latitude 15º54′2′′ N to 16º16′19′′ N Latitude and 76º48′40′′ E to77º4′21′′ E Longitude. The study area covers an area of 466.02 km2, having maximum length of 36.5 km. The maximum and minimum elevation of the basin is 569 m and 341 m above MSL, respectively.
Fig 1 Location Map of Study Area
INTERNATIONAL JOURNAL OF INNOVATIVE RESEARCH IN TECHNOLOGY
105
Š September 2019 | IJIRT | Volume 6 Issue 4 | ISSN: 2349-6002
Fig 2 Stream order Map
Fig 3 DEM Map 2.2 Methodology 2.2.1 Morphometric analysis DEM data is used to calculate the flow direction a staple for determining many important hydrologic parameters stream network is determined by using Arc GIS tools. Quantitative morphometric analysis was carried out for watershed for linear aspects, areal aspects and relief aspects. The analysis was carried out using Arc GIS. 2.2.2 Hypsometric Analysis The curve shows how much area lies above and below marked elevation intervals. The areas used are therefore those of horizontal slices of the topography at any given level. This method produces a
IJIRT 148631
cumulative curve, any point on which expresses the total area (reduced to horizontal projection) lying above that plane. The curve can also be shown in non-dimensional or standardized form by scaling elevation and area by the maximum values. The non-dimensional hypsometric curve provides a hydrologist or a geomorphologist with a way to assess the similarity of watersheds. A hypsometric curve is a histogram or cumulative distribution function of elevations in a geographical area. Differences in hypsometric curves between landscapes arise because the geomorphic processes that shape the landscape may be different. Hypsometric curve is developed and maintained in a steady state as relief slowly diminishes. The monadnock phase with abnormally low hypsometric integral, when it does occur, can be regarded as transitory, because removal of the monadnock will result in restoration of the curve to the equilibrium form. From inspection of many natural hypsometric curves and the corresponding maps, A N Strahler estimates that transition from the inequilibrium (youthful) stage to the equilibrium (mature) stage corresponds roughly to a hypsometric integral of 60%, but that where monadnocks become conspicuous features the integrals drop below 35%. The hypsometric integral was estimated using the elevation-releif ratio method proposed by Pike and Wison (1971). The relationship is expressed as H =(( Emean-Emin))/((Emax-Emin)) Eq. (1) Where, Emean = mean elevation of the watershed Emin = minimum elevation within the watershed Emax = maximum elevation within thw watershed. 3 RESULTS 3.1 Morphometric analysis Quantitative Morphometric analyses were carried out for watershed. The results of Morphometric characteristics are presented in Tables 1 and 2. Table 1 Morphometric Parameters Sl No
Watershed Parameters
Units
Watershed 1
1 2
Watershed Area Perimeter of the Watershed
Sq.Km Km
466.02 143.49
INTERNATIONAL JOURNAL OF INNOVATIVE RESEARCH IN TECHNOLOGY
106
Š September 2019 | IJIRT | Volume 6 Issue 4 | ISSN: 2349-6002 3 4 5 6 7 8 9 10 11 12 13 14 15 16 17 18 19 20 21
Watershed Stream Highest Order Maximum Length of watershed Maximum width of Watershed Cumulative Stream Segment Cumulative Stream Length Drainage Density Constant of Channel Maintenance Stream Frequency Form Factor Shape Factor Circularity Ratio Elongation Ratio Compactness Coefficient Total Watershed Relief Relief Ratio Relative Relief Ruggedness Number Texture Ratio Length Of overland flow
No.
5 1
Km
42.57
Km
14.89
Km
470
Km
590.79
Km/Sq.km Sq.Km/Km
1.27 0.39
No/Sq.Km
1.01 0.26 3.89 0.28 0.57 1.87
2 3 4 5
m
6 7 8 9
341 341370 370400 400430 430460 460490 490520 520550 550569
0.00 58.8 0 133. 30 107. 54 69.7 0 55.3 7 30.6 6 9.21 1.44
569. 00 550. 00 520. 00 490. 00 460. 00 430. 00 400. 00 370. 00 341. 00
228.0 0 209.0 0 179.0 0 149.0 0 119.0 0 89.00 59.00 29.00 0.00
1. 00 0. 92 0. 79 0. 65 0. 52 0. 39 0. 26 0. 13 0. 00
0.00 58.80 192.1 0 299.6 4 369.3 4 424.7 1 455.3 7 464.5 8 466.0 2
0. 00 0. 13 0. 41 0. 64 0. 79 0. 91 0. 98 0. 99 1. 00
The study of hypsometric properties of Miniwatershed using hypsometric integral (HI) and hypsometric curve retrieved in that, HI value is 0.51 and hence the Mini-watershed falls under the mature stage.
228 0.0053 0.00158 0.00028 2.64 0.39
Table 2 Morphometric Characteristics Name
Stre am ord er
Mini Water shed
1 2 3 4 5
No. Of stre ams
Tot al leng th of stre ams (km )
Cumul ative length (km)
Me an stre am len gth (k m)
380 .00 74. 00 12. 00 3.0 0 1.0 0
293 .43 147 .32 90. 82 22. 85 36. 37
293.4 3 440.7 5 531.5 7 554.4 2 590.7 9
0.7 7 1.9 9 7.5 7 7.6 2 36. 37
Bifurc ation ratio (km)
5.14 6.17 4.00 3.00
Len gth rati o
2.5 8 3.8 0 1.0 1 4.7 8
Fig 4 Hypsometric Curve
3.2 Hypsometric analysis Table 3 Calculations of Percentage Hypsometric curve Sl No
Eleva tion
Are a
Altit ude
(m)
(sq. km)
(m)
IJIRT 148631
Eleva tion differ ence
e/ E
cumul ative area (Sq.k m)
a/ A
Fig5:Stream Order vs No of Streams
INTERNATIONAL JOURNAL OF INNOVATIVE RESEARCH IN TECHNOLOGY
107
Š September 2019 | IJIRT | Volume 6 Issue 4 | ISSN: 2349-6002 Ideas In Education Volume 5 Issue 3 2019 Page 1713-1727 [4] 8.Mohammed Badiuddin Parvez, Chalapathi K and M Inayathulla. " Geomorphological Analysis of Two Mini-Watersheds in Raichur City Karnataka" International Research Journal of Engineering and Technology (IRJET) Volume 6 Issue 6 June 2019 Page 2896-2901 [5] Schumn,S.A.(1956).Evolution of drainage systems and slopes in Badland, at Perth Amboy, NewJersey. Geological Society of America, Bulletin.67:597-646. Fig 6: Stream Order vs Mean stream length 4 CONCLUSIONS The length of overland flow in Watershed in the present study is less than 0.4. Hence, the Watersheds selected for study have Smaller flow paths associated with less infiltration and high runoff. The Drainage density is 1.27 km/km2 indicating Coarse texture. The shape ratio shows the watersheds are elongated to oval shape. Stream frequency is Low. The higher relative relief indicates that it is composed of resistant rock patches and lower relief ratio indicates less resistant patches of rocks. The study of hypsometric properties of Mini watershed using hypsometric integral (HI) and hypsometric curve retrieved in that, HI value is 0.51 and hence watershed falls under the Mature Stage. REFERENCES [1] A1 Saud M.Morphometric Analysis of Wadi Aurnah Drainage System Western Arabian Peninsula.(2009) [2] Mohammed Badiuddin Parvez, M .Inayathulla "MODELLING OF SHORT DURATION ISOPLUVIAL MAP FOR RAICHUR DISTRICT KARNATAKA" International Journal for Science and Advance Research In Technology, 5(4) [3] Mohammed Badiuddin Parvez, and M .Inayathulla. "Morphometry, Hypsometry Analysis and Runoff Estimation of Aam Talab Watershed Raichur, Karnataka" International Journal Of Advance Research And Innovative
IJIRT 148631
BIOGRAPHY Mohammed Badiuddin Parvez Is a life member of Indian Water Resources Society, ASCE Born in Gangavathi, Obtained his BE in Civil Engineering in the year 2009-2013 from UVCE, Banagalore and M.E with specialization on Water Resources Engineering during 2013-2015 from UVCE, Bangalore University and Pursuing Ph.D from Bangalore University. And has 3 years of teaching experience. Till date, has presented and published several technical papers in many National and International seminars, Journals and conferences. Chalapathi k Is a life member of Indian Water Resources Society. Born in Karnataka, Obtained his BE in Civil Engineering in the year 2008-2012 from GSKSJTI, Banagalore. and M.E with specialization on Water Resources Engineering during 2012-2014 from UVCE, Bangalore University and Pursuing Ph.D from Bangalore University. And has 3 years of teaching experience. Till date, has presented and published several technical papers in many National and International seminars and conferences. Dr M Inayathulla Is a life member of Environmental and Water Resources Engineering (EWRI), ASCE, WWI, ASTEE, ASFPM. Born in Karnataka, Obtained his BE in Civil Engineering in the year 1987-
INTERNATIONAL JOURNAL OF INNOVATIVE RESEARCH IN TECHNOLOGY
108
Š September 2019 | IJIRT | Volume 6 Issue 4 | ISSN: 2349-6002 1991 from UBDT, Davanagere and M.E with specialization on Water Resources Engineering during 1992-1994 from UVCE, Bangalore University and got Doctorate from Bangalore University in the year 1990-1995. Presently working as Professor at UVCE, Bangalore University, India. And has more than 25 years of teaching experience. Till date, has presented and published several technical papers in many National and International seminars and conferences.
IJIRT 148631
INTERNATIONAL JOURNAL OF INNOVATIVE RESEARCH IN TECHNOLOGY
109