
MARKETING COMMUNICATION & DIGITAL JUNE 2022 REPORT
EXECUTIVE SUMMARY EVOLUTION JUNE 22 VS MAY 22 WHAT’S NEW COMING NEXT • Press / Media : ➢ Maintaining a stable volume of articles while all main competitors have decreased theirs + increasing high scoring articles (+25% vs May) + participation in popular channels (>50k views) have resulted in an increase of Savills’ PR value in June • Digital : ➢ Traffic on VN corp. web outperformed Eng website for the 1st time, pageviews strongly increased (Eng/VN corp web) ➢ 43 new kw (Eng/VN) entered Top10 Google vs May, 31/135 focused kw entered Top10 Google ➢ Performance of social media both Linkedin & Facebook as all indicators continuously increased since Jan. • New homepage & new service pages (Advisory & Office-Retail) • Resi E-portfolio launch • EDM automation journey via SFMC • S22M promotion campaign • Techcombank Tower launch event • New service pages (Hotels) + optimized UX/UI on Resi website + project landing pages • ESG communication reinforcement • Office Wise release • Internal emag launch + internal Teams channel • Hotels Espresso Shot release • Indus Insider Q2 • QMR Q2
PRESS / MEDIA


Mr Su Ngoc Khuong on VNExpress Mr Su Ngoc Khuong interviewed with VOH


Ha Noi’s office market is increasingly diversified Commercial Leasing HN 28 CafeF, VOV, Tạp chí Tài chính, VIR Ms NguyetHoangMinh 7 03/06/2022
No Released Date Statement Department Total Coverage Highlight Owner 1 01/06/2022 Da Nang’s Real Estate Market Welcomes Many Branded Properties Residential 42 CafeF, Báo Xây dựng, Dân trí, VIR, Báo Đầu tư Mr Nguyen Duc Them 2 08/06/2022 Korean FDI flow to Viet Nam surged Business Development 49 VIR, VOV, CafeLand, Tạp chí Tài chính, Bộ Công thương Mr Andrew Lee 3 14/06/2022 Trends Influencing the Premium Office Market in Ha Noi Commercial Leasing HN 19 VIR, CafeF, Nhịp cầu Đầu tư Ms NguyetHoangMinh 4 16/06/2022 Understanding Ha Noi's office market in 2022 Commercial Leasing HN 22 VTV1, CafeF, Nhịp cầu Đầu tư, Báo Đầu tư Ms Hoang Nguyet Minh 5 25/06/2022 Green industrial real estate attracts FDI Industrial 18 Báo Đầu tư, Tạp chí Tài chính, Báo Công thương Mr Le Huy Dong 6 29/06/2022
Mr. John Campbell 8 07/06/2022
How will global supply chains drive warehouse investment Industrial 31 ZingNews, VTV, baoxaydung, CongThuong, CongLuan.
Remove the obstacles to real estate capitals Research 98 VNExpress, baoxaydungCafeLand,,ZingNews, DanTri. Mr. MacGregorNeil 9 15/06/2022
Real estate in the last 6 months of the year will be purified Research 57 CafeF, CafeLand, baoxaydung, VNExpress, NLD. Ms. Vo Thi Khanh Trang 11 23/06/2022 Green development in real estate Research / PM 22 MOC, CafeFcongthuongthoibaotaichinhvietnam,,tapchixaydung, Mr. Troy Griffiths
Ms. Tran Pham Phuong Quyen 10 22/06/2022
Savills: International brands invest in physical retail stores in the post covid19 pandemic Retail HCM 10 Vietnammoi, ZingNews, VNBusiness.
No Publication Reporter Topic Date Owner Coverage 1 Mekong Asean Times Ngoc Linh FDI flow into Vietnam 01/06 Mr Matthew Powell TBU 2 VTC1 Huong Thao Condominium 50 70 years limit 03/06 Mr Su Ngoc Khuong VTC1 3 Nha Dau Tu Thanh Van Da Nang’s office performance 06/06 Mr Matthew Powell TBU 4 CafeF Duong Nga Real estate investment 06/06 Mr Matthew Powell TBU 5 BizLive Tung Tax Avoidance 06/06 Mr Matthew Powell BizLive 6 CafeF Duong Nga Real estate: H1/2022 06/06 Mr Su Ngoc Khuong CafeF 7 VOV Thu Ring Road 4 13/06 Ms Do Thu Hang VOV 8 Forbes Magazine Tuyet An Deep C and industrial updates 16/06 Mr Le Huy Dong MagazineForbes 9 Batdongsan.com Thuy An Increase in real estate price 17/06 Ms Do Thu Hang Batdongsan 10 Vietnam Economic Times Ngoc Lan ESG in real estate 21/06 Mr Troy Griffiths Print 9
No Publication Reporter Topic Date Owner Coverage 11 VTC1 Huong Thao Real estate investment 21/06 Mr Nguyen Duc Them VTC1 12 VTV8 Quoc Thinh 23/06 Ms Do Thu Hang TBU 13 Vietnam Financial Times Hong Quyen Low liquidity and residential updates 23/06 Ms Do Thu Hang FinancialVietnamTimes 14 Business Forum Dieu Hoa Cut Loss in real estate 27/06 Ms Nguyen Thi Hong Van Business Forum 15 Vietnam Finance Tran Le FDI inflow in 2022 28/06 Mr Do Duy Thanh TBU 16 VTV8 Quoc Thinh Grade A office building 29/06 Ms Hoang Nguyet Minh VTV8 17 VTC1 Huong Thao Grade B apartment in Ha Noi 29/06 Ms Do Thu Hang VTC1 18 VTC1 Huong Thao When to invest in real estate 29/06 Ms Do Thu Hang VTC1 19 Bao Da Nang Giao Thuy Da Nang office market performance 29/06 Ms Hoang Nguyet Minh TBU 20 Zing News Thuy Tien Real estate in secondary hubs 30/06 Ms Do Thu Hang Zing News 10
5
Thanh Thuong Controlling big value real estate poses a big threat 29/06 Ms. Vo Thi Khanh Trang ZingNews VTV4 Thanh Hai M&A 30/06 Mr. Troy Griffiths VTV4 11 was collected from 1 June – 5 July
17
8
9
15
VTV1 Proposed changes to ownership laws 01/06 Mr. Su Ngoc Khuong VTV 1 (8:22) VOV Huy Hoang The lifespan of apartment 03/06 Mr. Su Ngoc Khuong VOV (2:06) ANTV Huy Trend for office rents in HCMC 10/05 Mr. Neil MacGregor ANTV (1:32) HTV Diem Removing Obstacles to Real Estate Capital 05/06 Ms. Neil MacGregor HTV (0:30)
6
ANTV Insurance companies invest in real estate 07/06 Mr. Su Ngoc Khuong ANTV (9:36)
10
16
13
Data
VNExpress Nguyen Hang Podcast: Should apply apartment ownership but need a road map 07/06 Mr. Su Ngoc Khuong VNExpress VOH Hoang Thanh Talk Show: Concern about the time-limit of apartment within 50 70 years 07/06 Mr. Su Ngoc Khuong VOH HTV Diem Proposal to divide the type of apartment 08/06 Mr. Su Ngoc Khuong HTV (3:32) NDH 17/06 Mr. Su Ngoc Khuong NDH VTV9 Ngoc Mai Residential Market 22/06 Ms. Vo Thi Khanh Trang VTV9 (6:45) VIR Bich Ngoc 23/06 Mr. John Campbell TBU VTV1 Quynh Nhu Ring Road 3 24/06 Mr. Su Ngoc Khuong VTV1 (1:11) 14 CafeLand Cash flow and trends in real estate market in 2022 28/06 Mr. Su Ngoc Khuong CafeLand TTXVN Kieu Ly New supply in residential market 29/06 Ms. Vo Thi Khanh Trang TBU ZingNews
11
12
No Publication Reporter Topic Date Owner Coverage 1 THPL Thao Which projects are eligible to receive land certificate for condotel, officetel? 01/06 Mr. Mauro Gasparotti THPL (2:15) 2
3
4
7
• Report showed Colliers and JLL were having a slight removal in brand volumes, featuring Real estate overview and Residential for sale as their primary attribution. Observably, these brands emphasized their leading speeches about real estate tendencies and new shifts in brand investment, especially worker’s housing, and northern investors pushed hard into southern markets (Binh Chau Ho Tram) to expand their reputations.
• Savills proudly maintained the top ranking brand and dominated others in SOV and YTD volumes. As always, the Real estate overview and Residential for sale contributed to the vast plurality of Savills, followed by Investment and Office with overall news about the leaderboard’s frontage based on the market commentary reports and prediction of new trends soon.
• Despite the slight drop in media articles, CBRE sustained second place with similar top fields as Savills. Looking at its major content, the Residential for sale highlighted this brand as brand in charge at Diamond Crown Hai Phong and Salto Residence.
• Last but not least, CWK enjoyed a 30% increment, highlighting the survey from Cushman & Wakefield showing that around 40 percent of gas emissions came from real estate, and the cold storage market was expected to grow at an annual rate of 12 percent to become US$295 million worth by 2025.
12 695 252 111 159 409 12 52 114 1 17 83 7 0 200 400 600 800 1000 Real estate ResidentialoverviewforsaleOffice ALL MEDIA TIER 1 164 70 23 34 89 9 13 19 0 7 17 0 0 50 100 150 200 Real estate ResidentialoverviewforsaleHospitality Total Volume SAVILLS CBRE COLLIERS CUSHMAN & WAKEFIELD JONES LANG LASALLE 1,440 691 195 187 30 1,236 753 249 272 23 0 500 1000 1500 2000 2500 3000 17% 8% 22% 31% 30%
What Business Lines Were Dominant? – Top 3 In June, Savills and CWK were the only ones with increased media volumes, while CBRE, Colliers, and JLL all witnessed slight decline. Real estate overview and Residential for sale were the top segmentation, followed by Office and Investment.


13 Total Volume By Media (YTD) SAVILLS CBRE COLLIERS CUSHMAN & WAKEFIELD JONES LANG LASALLE Total Volume By Tier1 (YTD) Total Exclusive content volume on Tier 1 (June) 63% 26% 5% 5% Total: 489 articles53% 28% 9% 1% 9% Total: 3,741 articles 53% 27% 10% 1% 9% Total: 15,924 articles
• Real estate overview took the lead and accounted for 37% of the overall articles. Most of Savills and CBRE's articles in this segment wrapped by the real estate supply predicted to be rare in the second half of 2022, housing prices continue to rise unless demand improves, and ASIA - Pacific trade volume could increase by 5 - 10% in 2022. Savills outperformed with Su Ngoc Khuong’s statements about the change of ownership laws, Neil MacGregor’s participation in the VN Economic Forum, Trang Vo’s statements on real estate market H2 22, Korean FDI flow into Vietnam…
• Residential for sale gained a significant rise at 14% in comparison to last month, witnessed the outperformance of CBRE with nearly doubled of volumes than Savills. This segment featured CBRE as the key management and operation at Diamond Crown Hai Phong and Salto Residence, while Savills focused on analyzed difficulties of the real estate market and solutions in Vietnam. At present, Colliers also performed better in this business line, asserting that commercial shophouses were a sustainable product with approximately 12% profit, and the value increment might reach 15 30% each year.
83 7 46 0 1 16 0 1 9 0 7
Realoverviewestate Residential for sale Office Industrial Investment Hospitality Others Economic Retail Infrastructure apartmentsServiced Legal
• For the 1st time, Office reached the 3rd position, exclusively thanks to Savills and the press coverage following Techcombank Tower event.
• JLL surpassed Savills on the Industrial segment, including HCMC currently leading the country's industrial land rent with an average of $120 per square meter for the entire lease period, up priced 9% from the last period, relied on this brand's analysis reports. 170
Changes in the current top three positions where Savills and CBRE substituted for each other.
14 695 252 111 40 117 93 5 70 45 5 7 0 159 409 12 23 0 26 57 0 4 0 52 114 1 11 0 0 0 3 118 2 7 1 2 0
15 As usual, Savills' top spokespersons, who fairly represented all of the brand's categories, featured more frequently than others. While the number of spokespersons for the remaining players was down from the previous month. • The number of statements Savills’s top spokesperson and the total statements still prevailed over others. Su Ngoc Khuong and Neil MacGregor were the top spokespeople for Real estate overview and Residential for sale. • CBRE owned two excellent spokespersons: Vo Huynh Tuan Kiet and Duong Thuy Dung. Their assertions guided the content about Residential for sale and Real estate overview. • David Jackson was Colliers’s main spokesperson when he emerged in almost all segments. 97 3861 121010 0 50 100 150 Vo Huynh Tuan Kiet Duong Thuy Dung Nguyen Hoai An Pham Ngoc DangThanhThienPhuongHangHenryChinOthers 398 23263045505555657478117 0 200 400 600 Su Ngoc Khuong Neil MacGregor Vo Thi KhanhAndrewTrangLee Do Thi Thu Hang Nguyen Duc Them Hoang Nguyet Minh Matthew Powell Troy Griffiths Tu Thi Hong An GinnyGreggNguyenHealy 147 1 0 100 200 David Jackson Tammy Tang 11 7 3 11 0 5 10 15 Trang Bui Le Thi Huyen Trang Adam Challis KenRohanSakuramotoSharma 21 0 10 20 30 Trang Bui
This month, all of Savills's value indicators on Tier 1 were high, especially on Group A. The high-ranking group (5-10) contributed 20% of SOV. • Maintaining a stable volume on Tier 1 while all competitors have decreased their volume + increasing high scoring articles (+25% vs May) have resulted in an increase of Savills’ PR value in Tier 1. • Real estate overview, Residential for sale, and Hospitality continued to lead the top segments of Savills, contributing a total 76% brand volume in Tier 1, while the rest 24% was equally divided to each segment, except for "Others", "Infrastructure" and "Legal". 16 Value Group Jul Aug Sept Oct Nov Dec Jan Feb Mar Apr May June %(+/-) A 600 540 295 595 570 340 590 190 390 545 430 620 +44% B 1460 1024 800 1252 1108 840 1352 564 1232 960 1216 1360 +12% C 1065 915 732 522 522 546 699 597 828 588 783 696 -11% Total ValueMay June 2429 267610% Article Score Ranking By Volume This Month 35 18 11 11 38 34 27 23 12 44 49 13 17 5 117 101 51 51 18 0 20 40 60 80 100 120 140 160 0 1 2-4 5-7 8-10 A B C Total Volume By Media Class Group 76 134 129 59 159 117 A B C 16% 29% 10%
DIGITAL

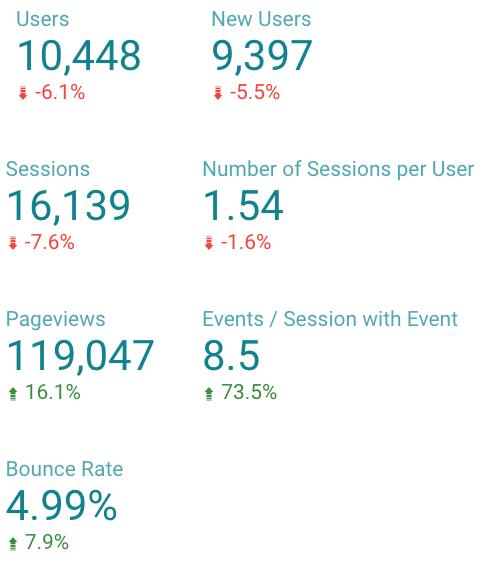
Savills English website
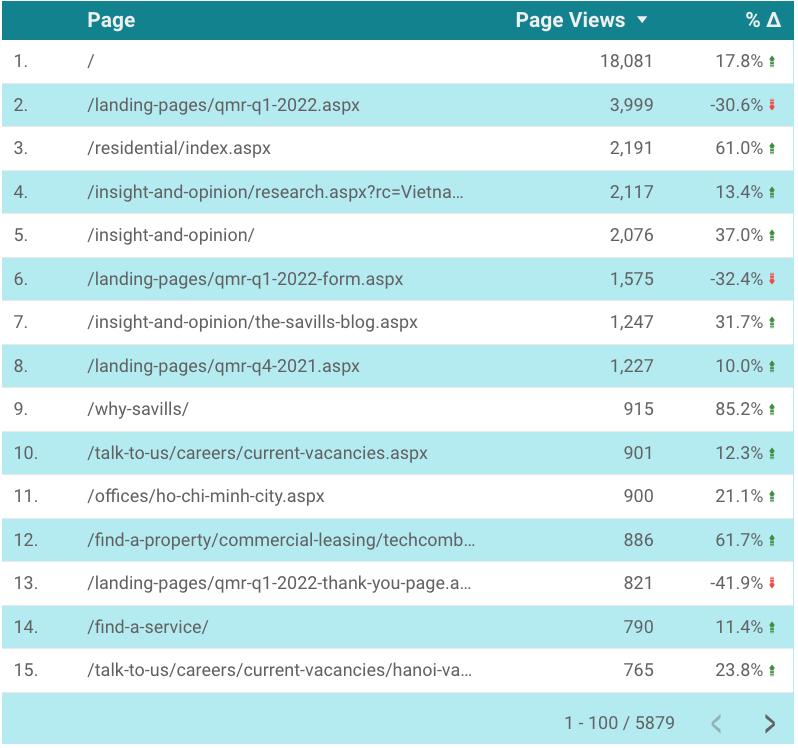
The efforts of marketing campaigns improved the traffic from EDM and social media. Some of highlight landing pages with high traffic this month are Techcombank Tower (886), Place (754), S22M (740), Lancaster Legacy (618), PM service (606), mostly resulted from targeted marketing campaigns.
Based on data from Google Analytics, despite the decreased pageviews for QMR vs May, thanks to 1st efforts on SEO, the pageviews for Research / Blogs increased vs May, which overall resulted in a stable traffic from organic search and increase in pageviews vs May.


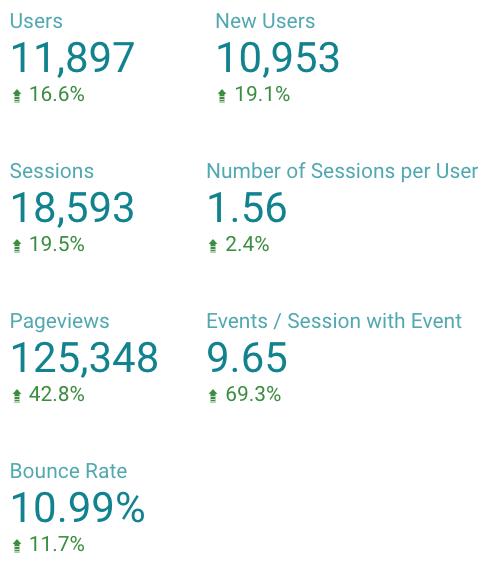
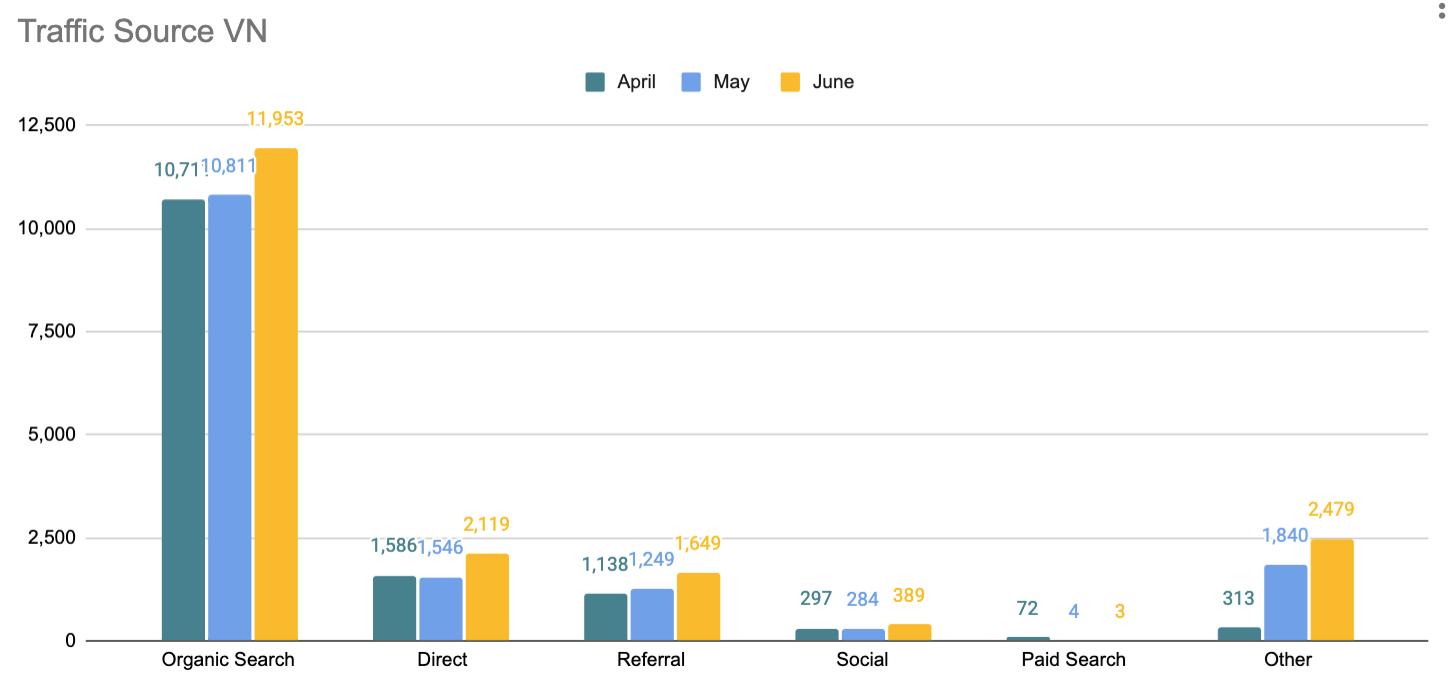
Based on data from Google Analytics, thanks to 1st efforts on SEO, traffic increased continuously from May and outperformed the Eng website for the 1st time!
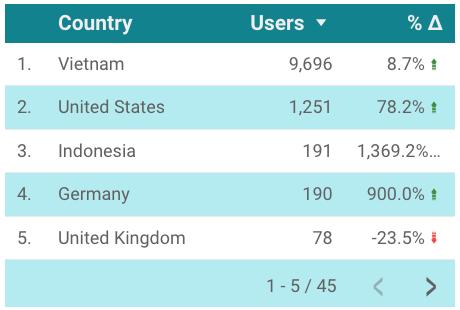
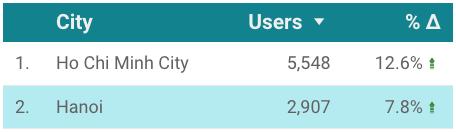
While QMR decreased pageviews on Eng website, it remained stable on VN website. Top traffic to website included Research & Blogs, QMR 2022Q1, Recruitment, Residential Website. The efforts of marketing campaigns improved the performance on direct channel, EDM and social media as well, some of highlight landing pages with high traffic this month as PM service (1348), Angsana Ho Tram (1143), Lancaster Legacy (862).
Savills VN website
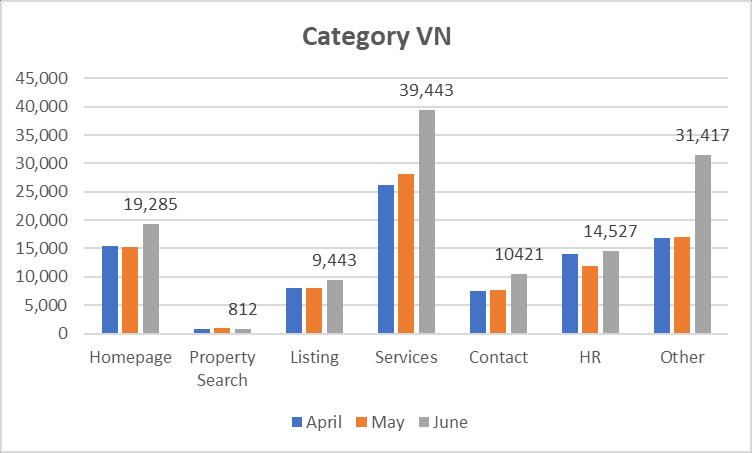
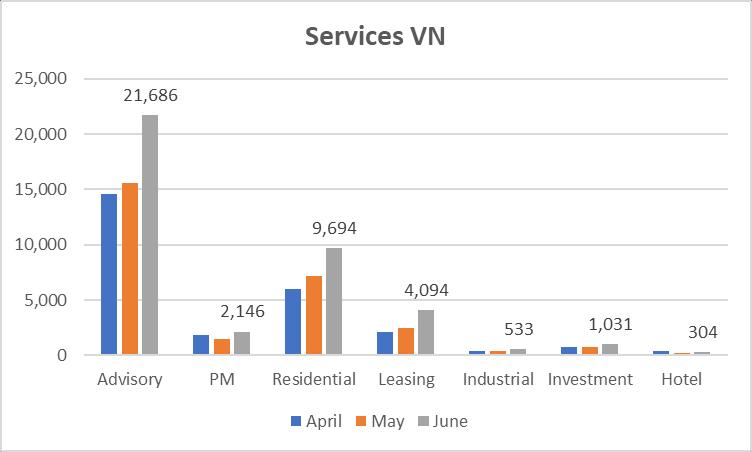
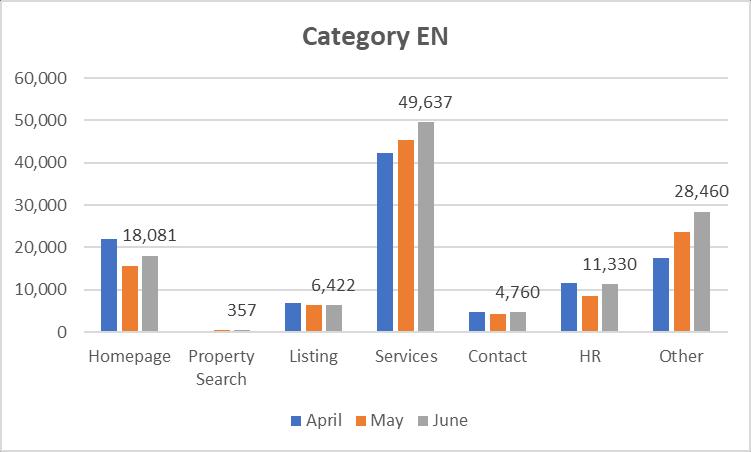
MONTHLY HIGHLIGHTS SAVILLS WEBSITE PAGEVIEWS BY DEPARTMENTS (01/06 – 30/06) June witnessed the creation of a user-friendlier homepage + optimized service pages, which seemed to bring good results as pageviews of Homepage + Services much higher than last months. SEO efforts also seemed to pay off as pageviews of all services, esp. Advisory, Resi, Leasing, increased on VN website (as still focused on VN keywords since ENGVNESEMay).


Industry Outlook.
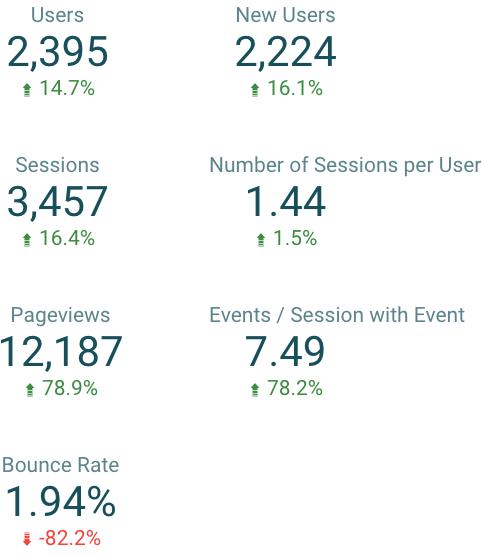
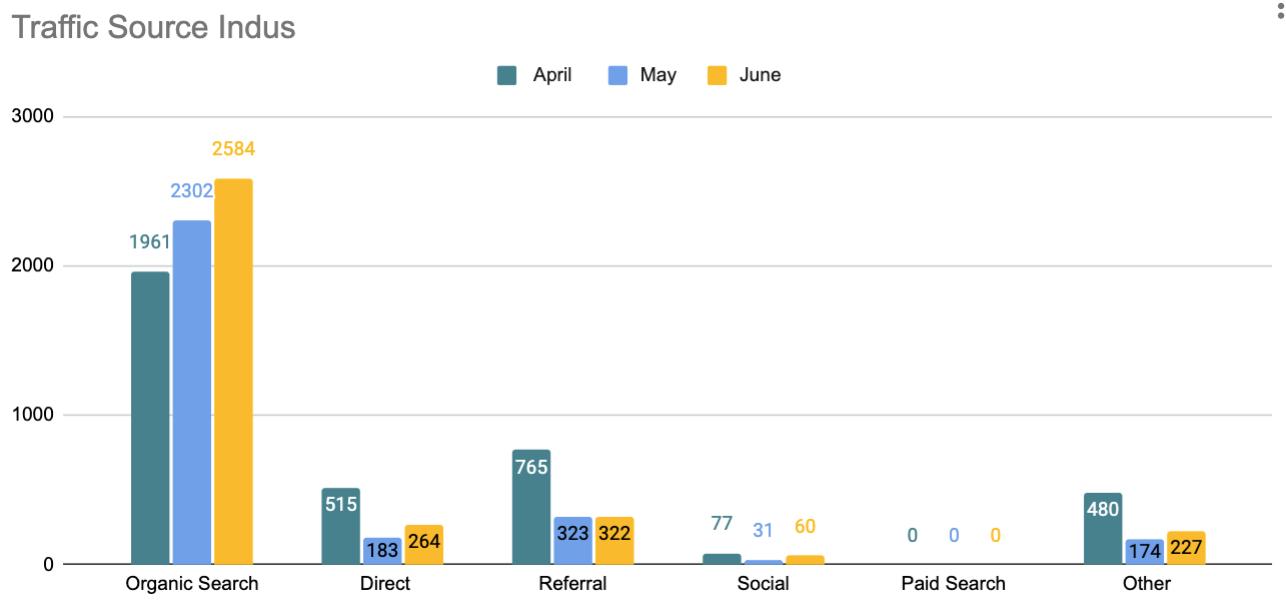
SEO efforts still very high as traffic from organic search continuously increased from April ~+15% each month and pageviews also highly increased (5/10 top pageviews are blogs). Indus website generated 5 leads on this month.
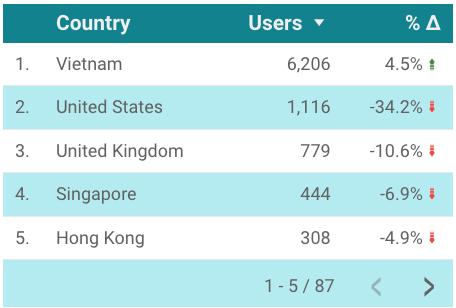
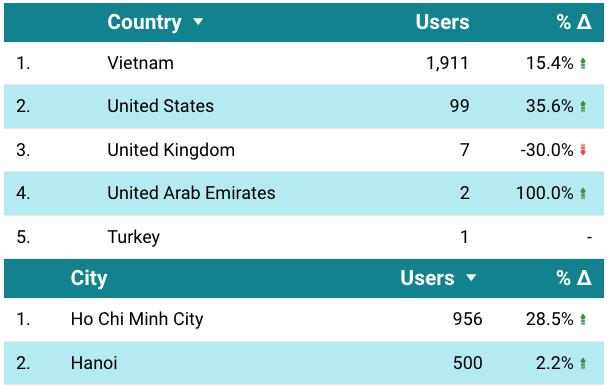
Traffic from Vietnam increased 15% and US 35%, HCMC increased 28%. The most traffic aim to discover blog’s topics about Logistics Role in Vietnam Economic, Industrial insider Q1 2022, e Commerce logistics, Vietnam leading industrial real estate, the guide to Vietnam Industrial Zone, Customs Vietnam Warehousing and Storage
Procedures , Properties Listing and
Savills Industrial website

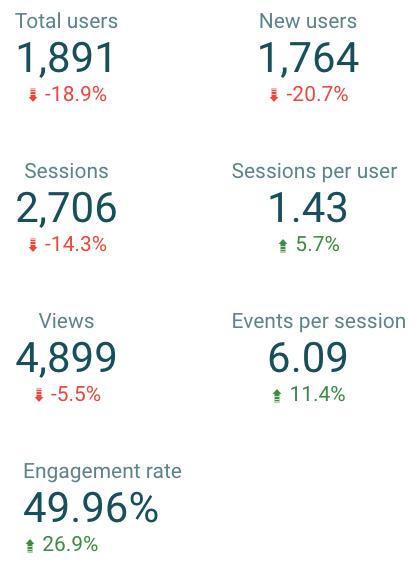
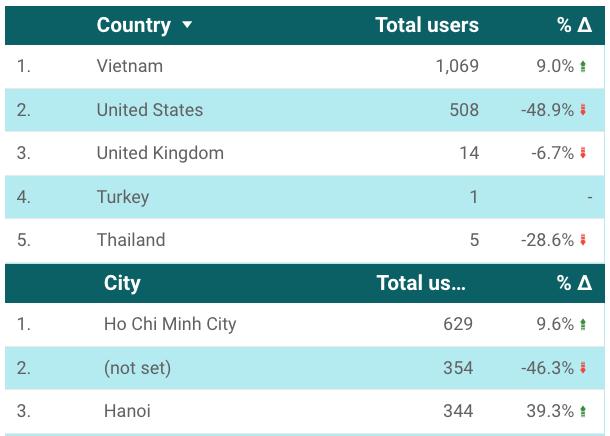
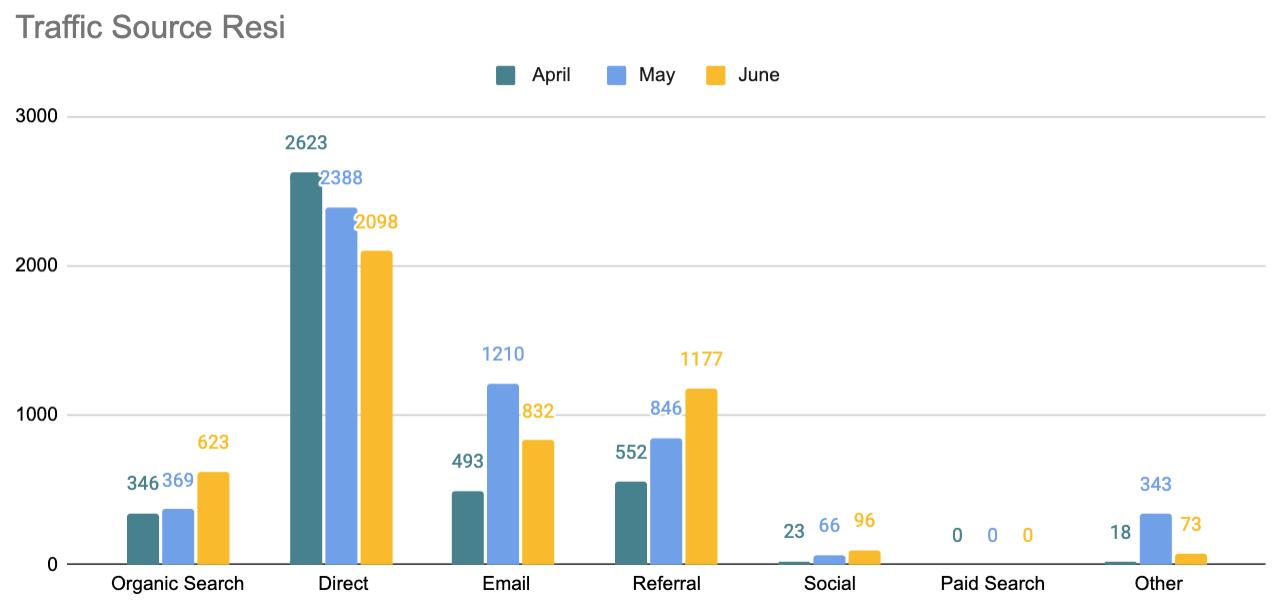
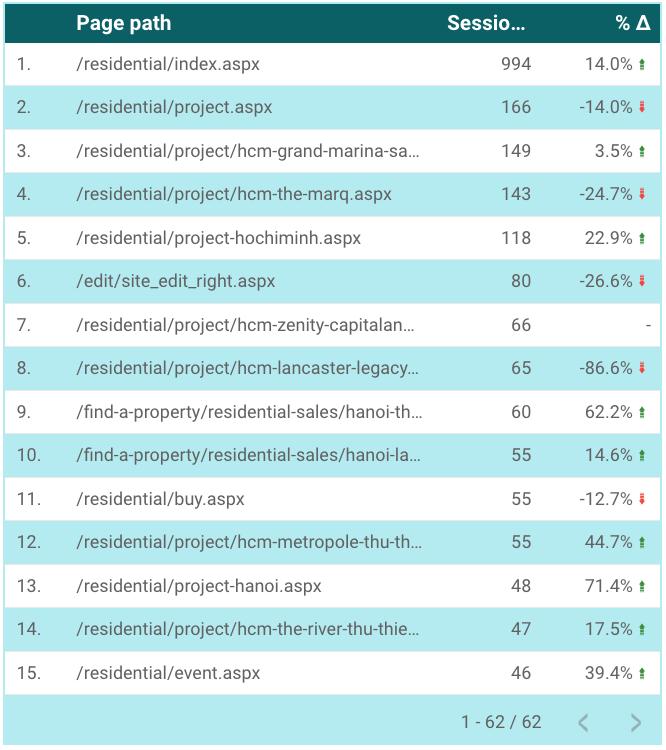
Savills Residential website
Compared to last month, traffic from organic search increased as direct result of SEO efforts. The decrease in direct traffic (mainly traffic from corp web) is largely compensated by the traffic to Resi Eportfolio (as promoted on the corp web’s homepage), see next slide. The traffic from Vietnam, both HCMC and HN increased while US decreased. Top of projects are Lancaster Legacy, Zenity Capitaland, Grand Marina Sai Gon and The Marq.
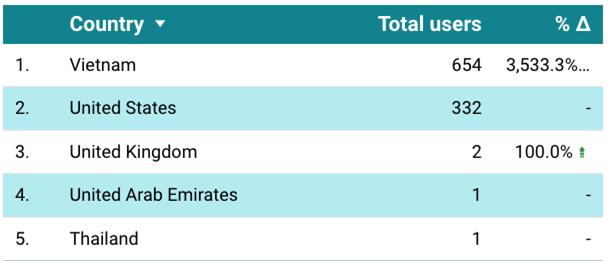
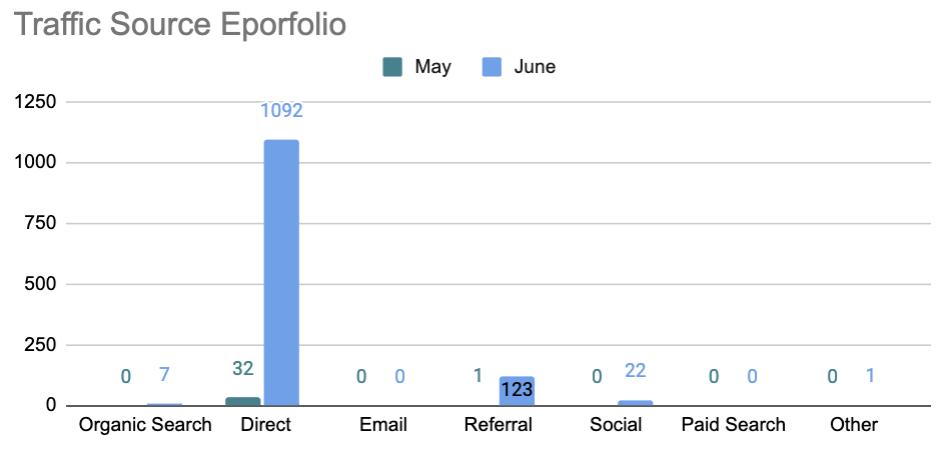
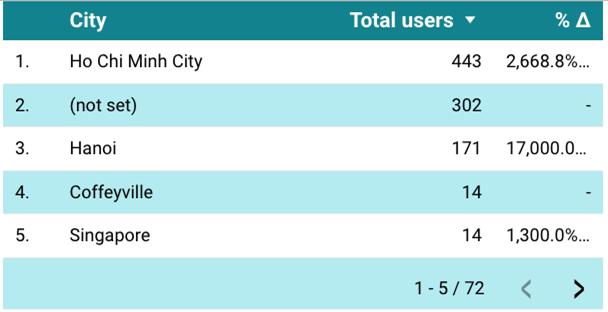
Residential ePortfolio launched beg. June recruited more than 1k new users (mostly from corp web as Portfolio promoted on the homepage + EDM). Hover banner on P3 recruited 94 clicks to ePortfolio. Most traffic are from Vietnam and US. Savills Residential ePortfolio


Savills S22M services
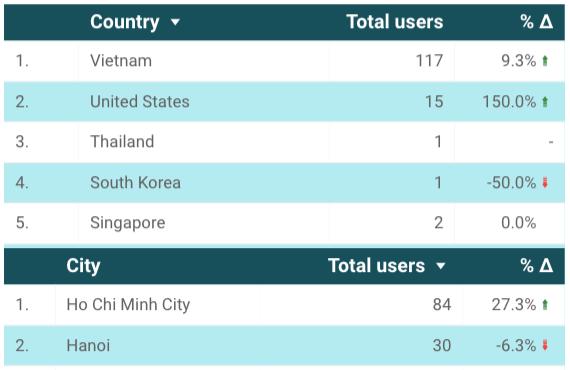
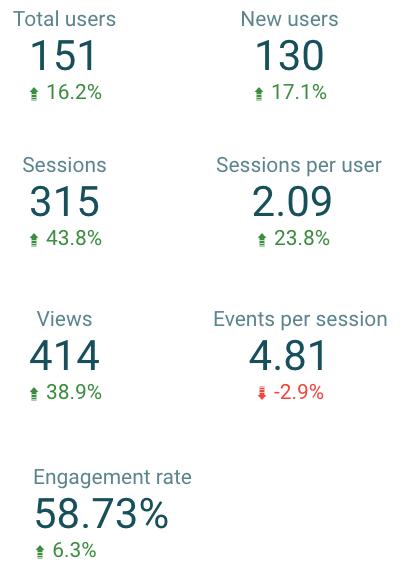
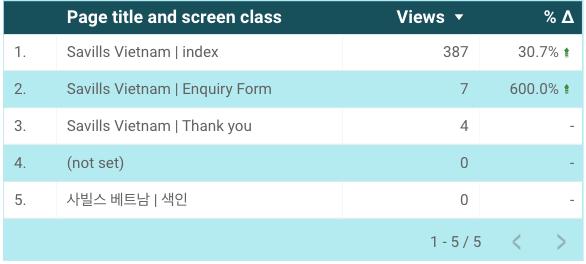
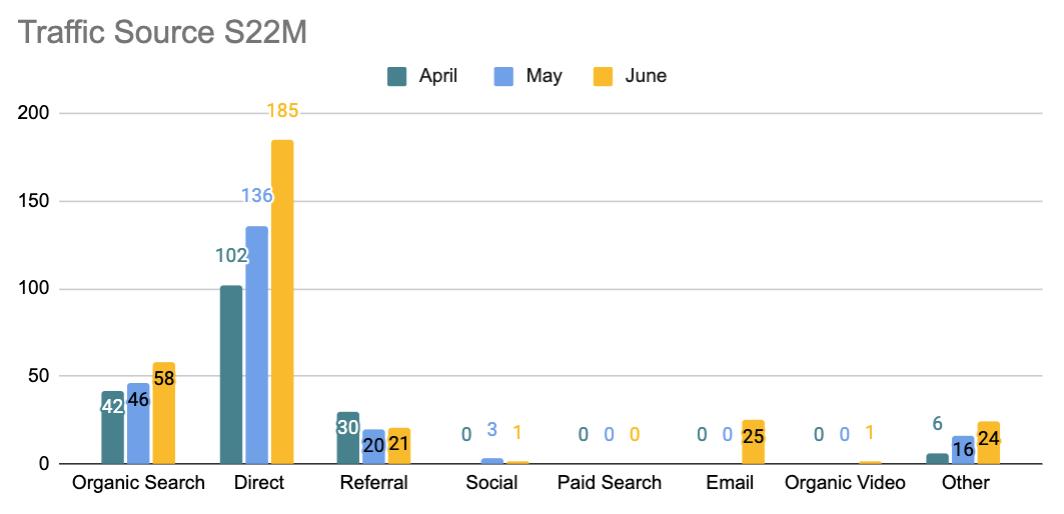
Compared to last month, the traffic to S22M increased in terms of users and sessions, pageviews, despite decrease of QMR. S22M launching campaign June-July should keep increasing traffic to S22M over the next weeks. Most of traffic source is direct (+ 40.4 %), organic search (+ 57.4 %). Most traffic are from Vietnam (+9.3%) and HCMC (+27%).
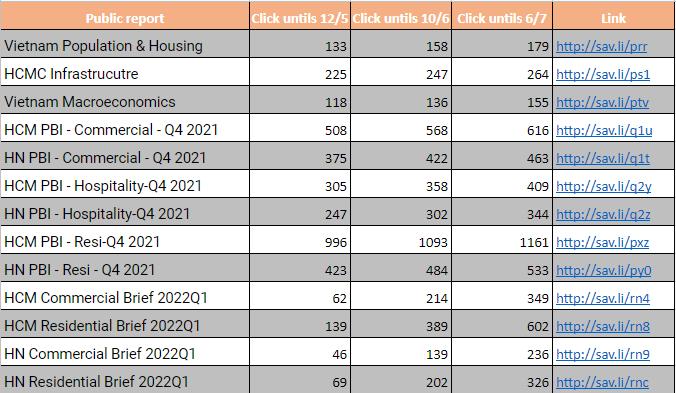
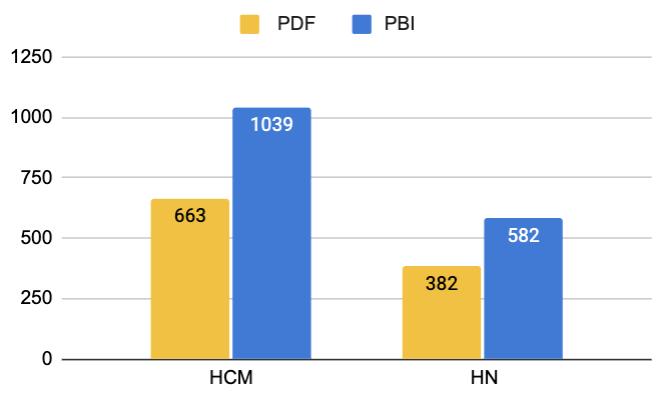
The latest PBI reports recruited traffic more strongly than the previous ones. Till now, the PBI report which has the most total clicks is HCM Residential Brief 2022Q4. However, HCM Residential Brief 2022Q1 grew quicker with 213 new clicks (+54.7%) compared to May. Sectors that seem to interest our audience are : Residential 1st, Commercial 2nd and Hospitality 3rd, HCM market more attractive than HN market. PBI reports clicks higher than QMR PDF downloads. *As we can not set time range to calculate traffic to PBIs so from next months, we will choose the first day of month to take the data. Q1 2022
QMR
Savills S22M services (cont.)

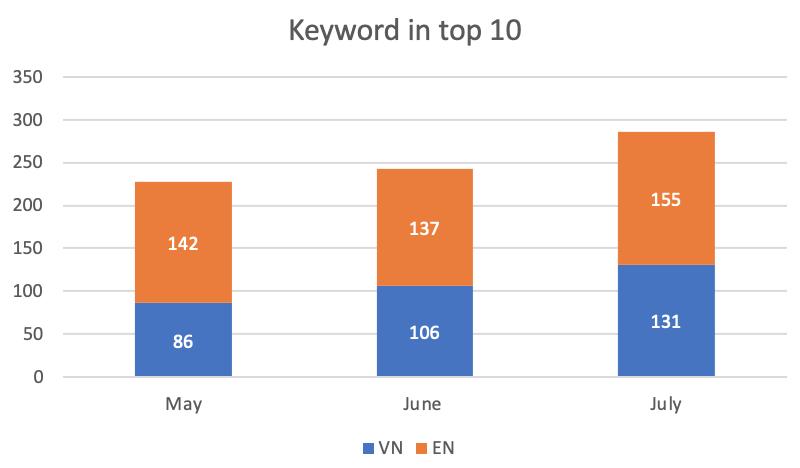
New initiative - SEO Savills Website Project What has been done in June : • Optimize content on old Residential pages + blogs : 15 Resi pages, 20 blogs • Optimize content on all new created blogs • Publish 5 landing pages for 5 priority services and highlight on homepage 2 months since deployment, what has been achieved : • Increase of Traffic from organic search, esp. VN web • Number of VN keywords in top 10 increased from 86 to 131, Eng kw from 142 to 155 • Out of the 135 main kw : ➢ Top 10 increased 17 kw from 14 to 31 kw


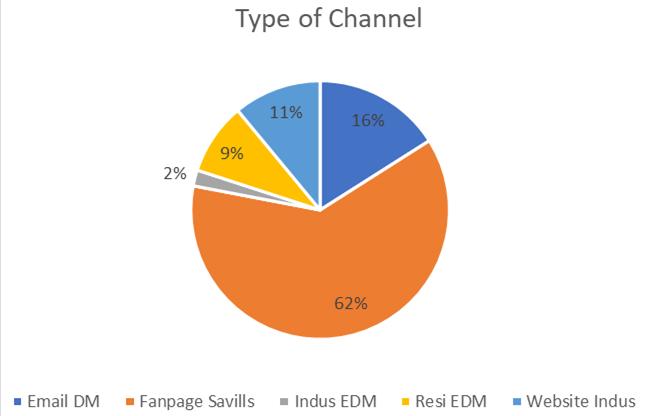
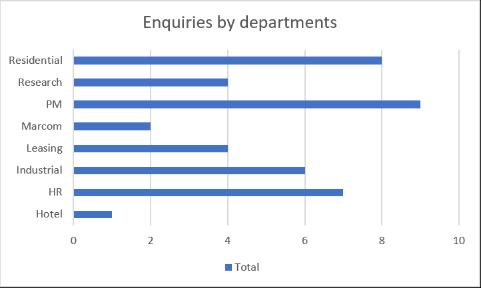
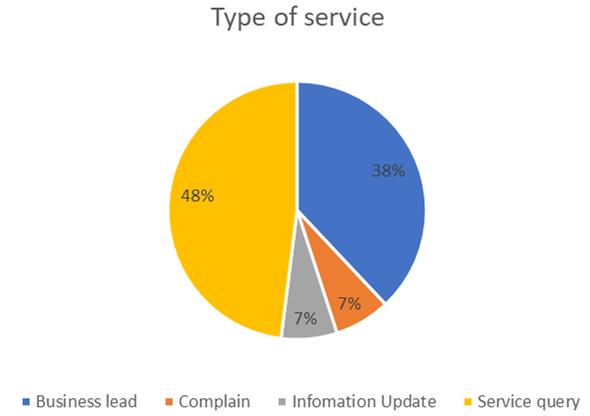
We are systemizing of collecting and tracking customer enquiries via our digital channels. In June, we served 44 inquiries as below: - Most of the inquiries come from Savills Fanpage (62%), eDM (16%). Fanpage received 24 new messengers, mostly related to PM and HR. Most of inquiries are request to know more or ask for general information (48%) We generated 17 leads (38%) for Residential sale (4), Industrial (6), Leasing (4) and Research (3) via all Channels. Number of complains decreased when compared to last month. Number of enquiries by departments Customer enquiries via digital channels
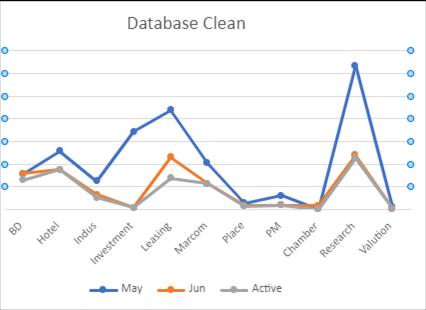
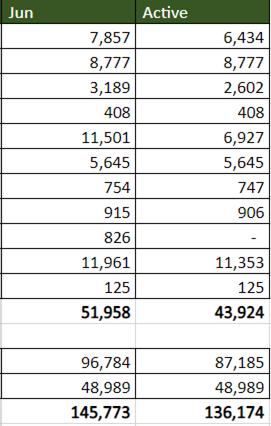
NEW : DATABASE CLEANING In June, we continue updating the New Masterfile with all active data, adding full information and segmenting the database for a few departments: ● Utilizing the database from masterfile to Salesforce, update monthly, building data Extension and Journey Builder that make our eDM campaigns become more effective ● Completed update and clean data information as much as possible (Full name, source of data, position level, duplicate email, phone number, ...), especially input Industry of companies to database BD and Industrial masterfile + Research and Leasing in process ● Added data status validated from EDM ( 180k active emails in total now) ● Added new data from departments ( Residential HCM 10k emails, Chambers 826 emails ) to Masterfile In July, we will update information for S22M masterfile, Industrial masterfile and create Template Journey for eDMs with full databases for each departments in Data extension.

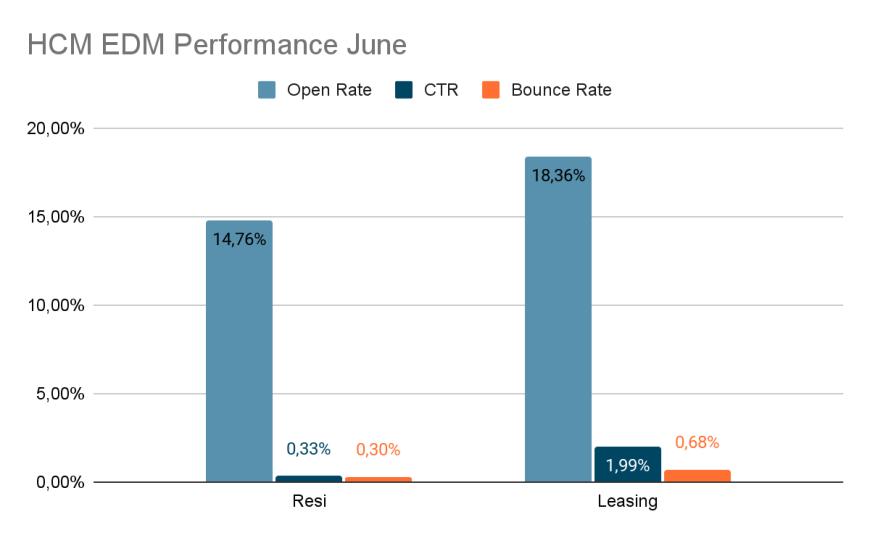
MONTHLY HIGHLIGHTS DASHBOARD Email Marketing Performance Total EDM sent out in June are 26 EDMs (-8 compared to May). Details as below: ● Although Residential eDMs overall decreased in Open Rate and Click rate, but thanks to the Retargeting Strategy, some retargeted EDM had the highest Open Rate of Residential ~80% with subject of events invitations and Price and Sale Policies updates. ● Leasing as normal performed stably, however the databases need to be updated regularly to increase the average performance and implement Retargeting Strategy content as well. ● BD came back with monthly eDM with stable performance (high open rate). ● Industrial shows lower Open rate but increase in Click Rate as Industrial data tends to prefer Multi Listing Properties eDMs rather than single listing property. Need to improve Subject of emails or implement Retargeting Strategy. (-X) : vs last month Leasing Residential Industrial BD Research No. EDM 5(+1) 18 (-2) 1 (-2) 1 (+1) 1 (-3) Total delivered 17,710 866,639 1,695 7,705 567 Open rates 18,7% (-0,8ppts) 13,49% (-9ppts) 19.7%(-9.7ppts) 21.7 29.5%(+20.8ppts) Click rates 2.3%(+0.4ppts) 0.4%(-0.4ppts) 5.4%(+2.2ppts) 3.5% 13.4%(11.5ppts)


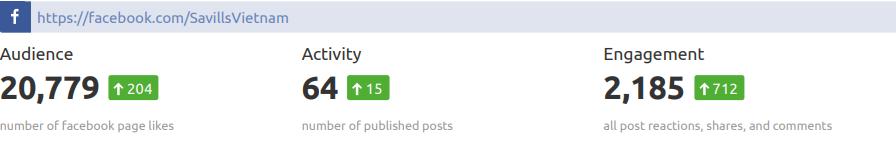
Overall performance on both FB and Linkedin is improving for all indicators : - Number of posts continuously increased on both FB and Linkedin Reach, Engagement and CTW are increasing month by month that means we are delivering the right content to audience - Savills is one of the few companies that maintain a well balanced content pillars on each channel (see next slides)
SOCIAL MEDIA OVERVIEW
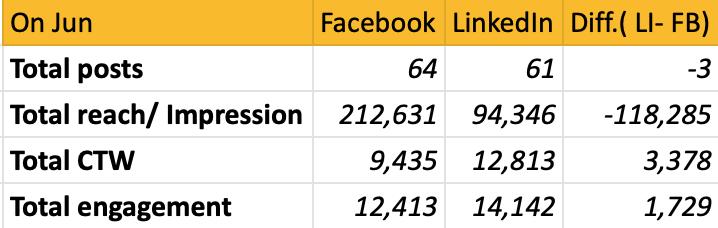
In June, Linkedin performed better than last month with posts about Leasing & Research, while FB reached more than Linkedin thanks to posts about recruitment and Leasing that spoke to a wider audience. However, engagement and clicks to web are higher on Linkedin, which means that Linkedin’s audience is a better fit for our business.


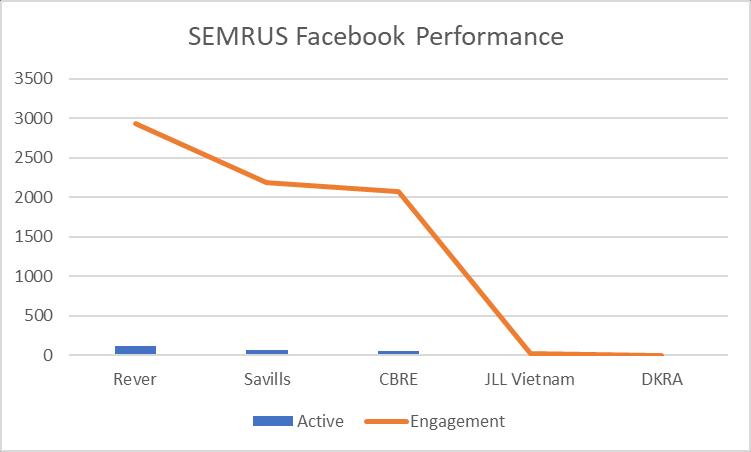
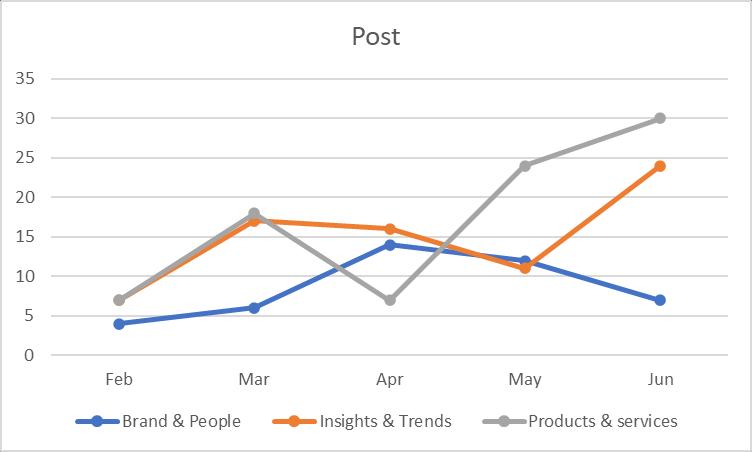
HIGHLIGHTSMONTHLY COMPETITORS’ SOCIAL MEDIA Facebook activities Content pillars CBRE Savills Colliers JLL DKRA Rever Propzy Cushman & Wakefield Brand and People 11 10 ( -1 ) 9 3 13 1 0 0 Insights & trends 16 25 ( +13 ) 32 4 9 1 0 3 Products & services 29 29 (+2) 2 0 1 119 68 0 Total posts 56 64 43 7 23 121 68 3 (01/06-30/06)) As usual, Rever is the most active on social media but they just focus on Primary Projects while Propzy promote their secondary market. Their content are focused on resi sales. CBRE and Savills offer a good balance of content between Branding, Market Insight & Trends and Projects Introduction. Colliers is focused especially on Insights & Trends. Different from other companies, DKRA is focused on Facebook with Brand and People to empower their sales force. JLL and Cushman & Wakefield still low performed and less active than others.
HIGHLIGHTSMONTHLY COMPETITORS’ SOCIAL MEDIA LinkedIn activities Content pillars CBRE Savills Colliers JLL DKRA Rever Propzy Cushman Wakefield& Brand and People 9 7 (- 5) 4 5 0 0 0 0 Insights & trends 8 24 (+13) 25 8 0 0 0 0 Products & services 23 30 (+6) 2 0 0 0 0 0 Total posts 40 61 29 13 0 0 0 0 (01/06-30/06)) As usual, Savills performed the best on LinkedIn with diversified content angles but focusing on promoting Insights & trends and Products & Services, the second was CBRE with focus on Project Discovery while Colliers and JLL are actively focusing on Insight & Trends. In June, Rever, DKRA, Propzy and Cushman & Wakefield not active on LinkedIn.
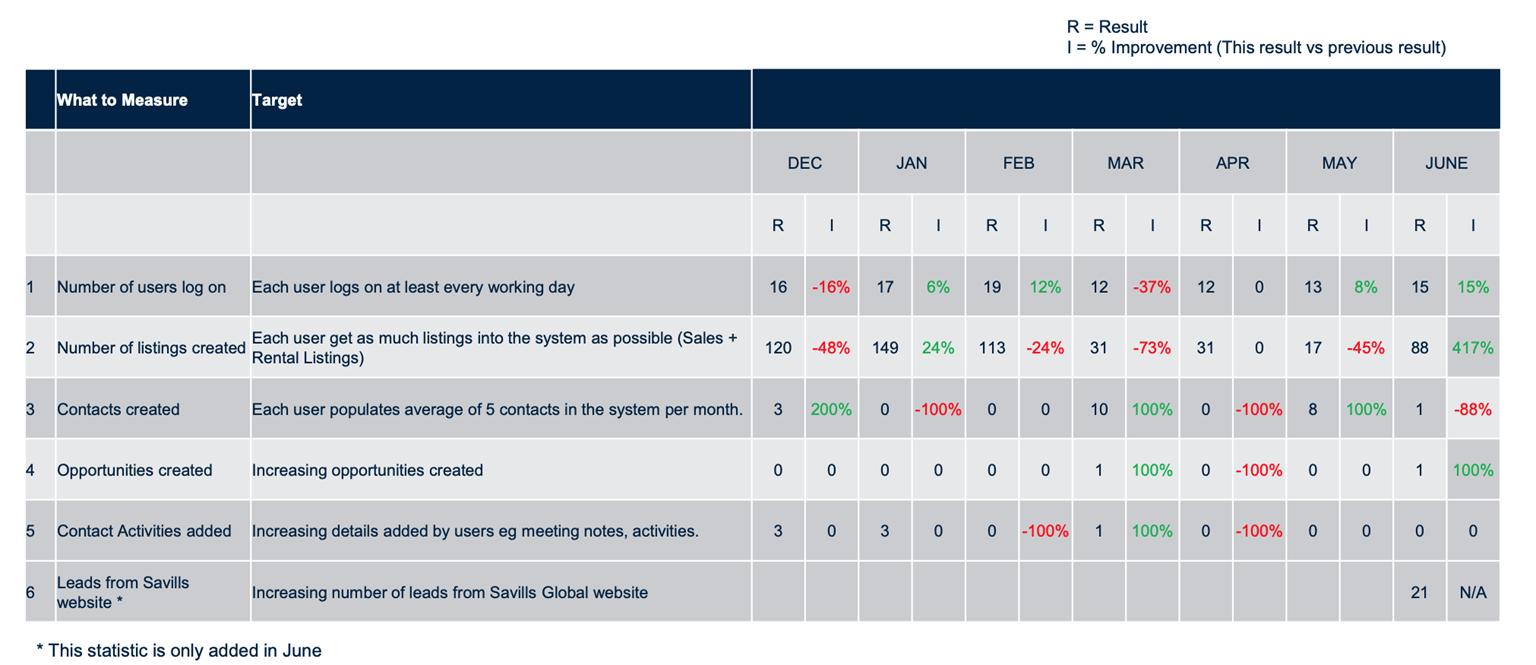
R3 monthly performance Vietnam - Residential Cube On Jun, based on R3 usage stat in Vietnam: - Average 15 agents active monthly on R3, mostly in HCMC - 15 active agents listed about 88 properties, about 6 listings/ agent These listings recruited about 490 pageviews on website Savills Search properties via 78 entrances, about 7 pageviews/ entrance. Generated 21 leads, about 1,5 leads/ agent, about 4 listings/ lead. Less contact created and no contact activities was tracked that sales are not willing to update contacts and their leads caring status. Suggestions: Increase number of active agent and listing / agent indicator *data from Regional R3 team *data from Google Analytic - Search Properties in Vietnam
APPENDIX

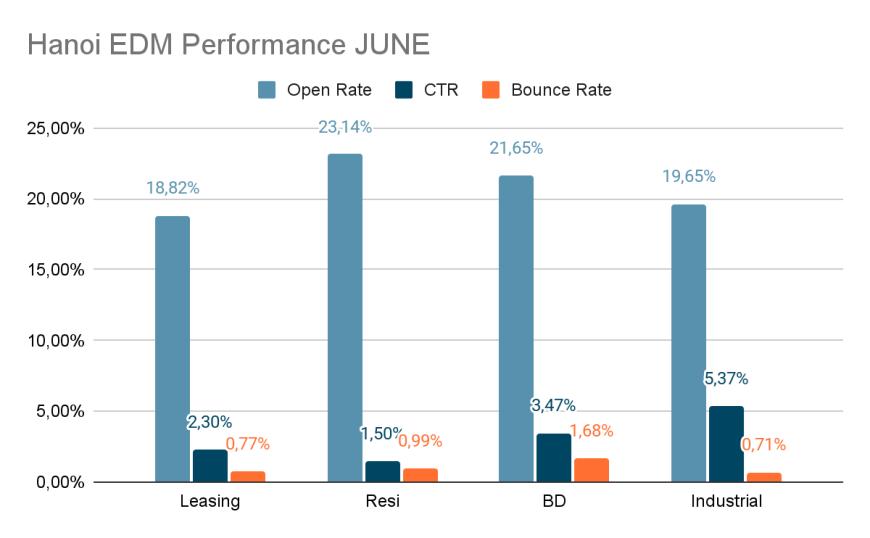
EDM HIGHLIGHTS (HANOI) Title Leasing Resi BD Industrial No. EDM 4(+3) 1(0) 1 1(-3) Total delivered 11,899 21,219 5,705 1,695 Openrates 18,82%(-0,7%) (+7,1%)23,14% 21,65% 19,65% (9,7%) Click rates 2,3% (-0,4ppts) (+0,12ppts)1,5% 3,47% (+2,1ppts)5,37% Bounces 0,77% 0,99% 1,68% 0,71% On this month we delivered 26 eDM in Total including Hanoi(7), HCM(15) & National (4). June eDMs continue doing Retargeting Strategy applied for Residential and Industrial. Residential slightly decrease in Open Rate and Click Rate mainly because of the mass data sending. Leasing Ha Noi comebacks with 1 eDMs/week and shows good performance with stable performance as the Leasing data is very good in quality but it needs to update regularly and should apply Retargeting Strategy. BD data is quite qualified as the Open Rate remains at highest among Departments’ benchmark. Research S22M email shows increasing in both Open and Click Rate but this is just the retarget with scale of only 562 users. EDM HIGHLIGHTS (HCMC) Title Resi Leasing No. EDM 14(-5) 1(-2) Total delivered 487,998 11,899 Open rates 14,76% 7,84ppts)(- (+4,63%)18,36% Click rates 0,33% (-0,3ppts) (+0,34ppts)1,99% Bounces 0,3% 0,68% EDM HIGHLIGHTS (National) Title Resi Research No. EDM 3 1(-2) Total delivered 357,422 562 Open rates 11,2% 29,45% (+10,95%) Click rates 0,63% (+10,88ppts)13,4% Bounce rates 0,36% 5,8%

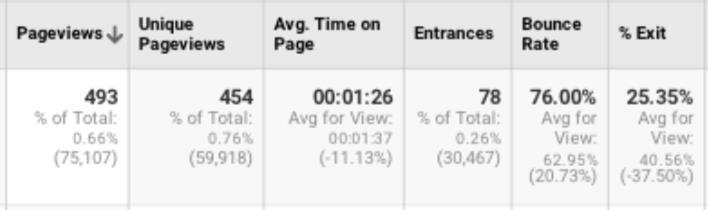
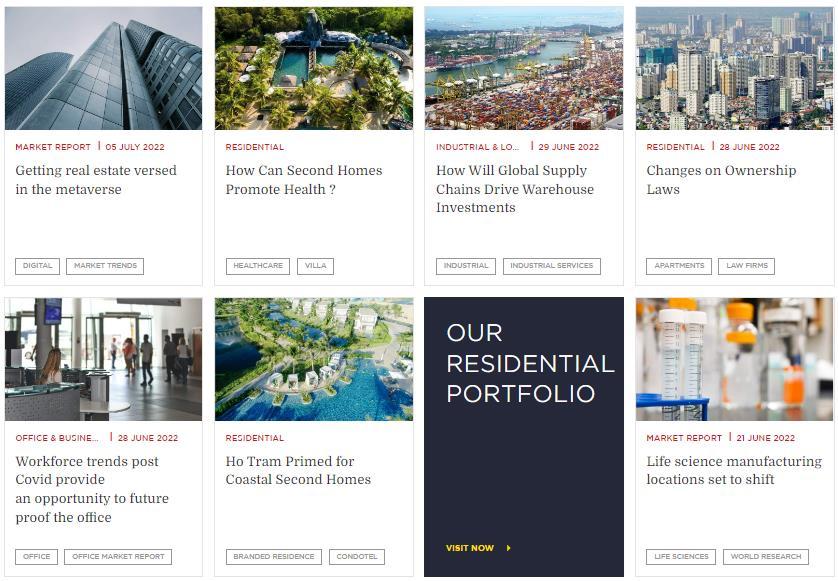
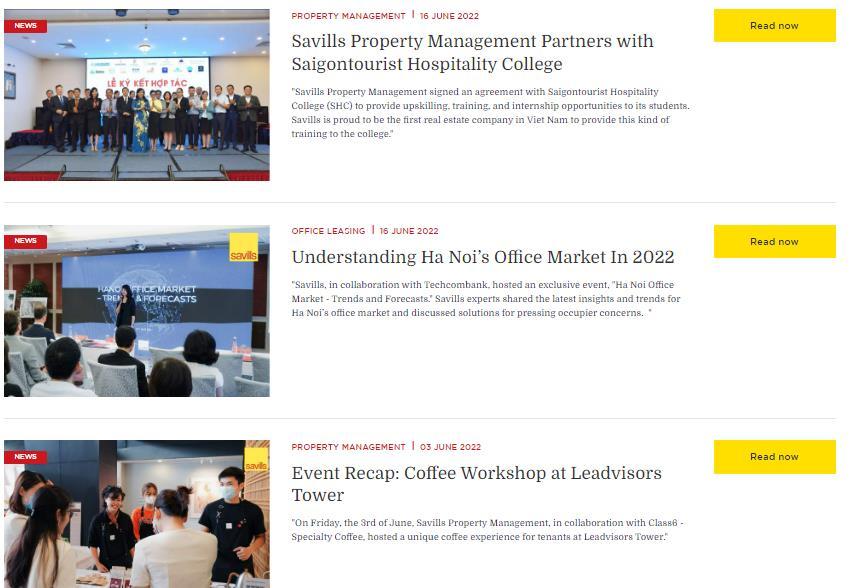
WEBSITE UPDATE (HANOI - HCMC) Pageviews Blogs News EN VN EN VN April 6,959 5,546 3,756 4,879 May 7,044 5,245 3,552 4,423 June 8,997 8,563 3,895 5,002 BLOG & NEWS PAGEVIEWS IN LAST THREE MONTHS BlogNews Pageviews of blogs and news on June is larger than last month on both website language version, thank to increase quantity of blogs and news, specially Vietnamese blogs. Blogs News EN VN EN VN National 8 14 4 3 TOTAL 22 7
TOP VIEW PAGES - EN (01/06 – 31/06) English website: The content of pages belonging to Research and Residential Departments are the most pageview on this month. WEBSITE UPDATE (HANOI - HCMC) No. Page Pageviews Avg. Time on Page Department 1 QMR Q1 3999 24 Research 2 Residential 2191 29 Residential 3 Research blog 2117 17 Research 4 Insight and Opinion 2076 14 Research 5 Form QMR Q1 1575 26 Research 6 Blogs 1247 23 Research 7 QMR Q4 1227 39 Research 8 Why Savills? 915 38 Marcom 9 Vacancy 901 3 HR 10 Ho Chi Minh Office 900 26 Marcom
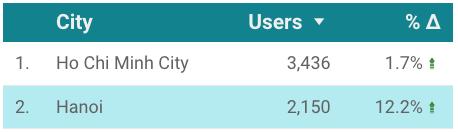
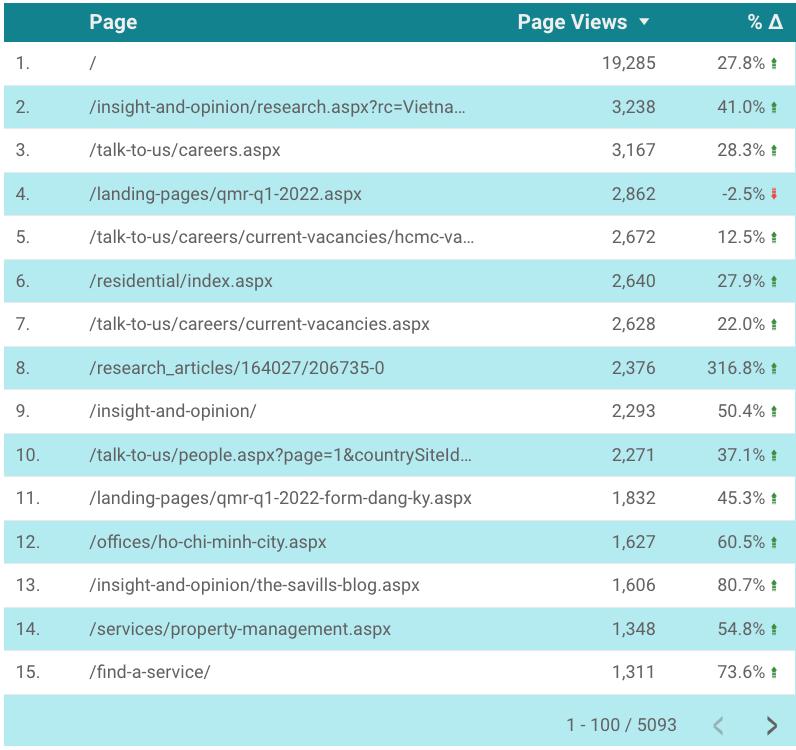
TOP VIEW PAGES - VI (01/06 – 31/06) Vietnamese website: The content of pages belonging to Research and HR Departments are the most pageview on this month. WEBSITE UPDATE (HANOI - HCMC) STT Trang Số lượt xem trang Thời gian trung bình Phòng ban 1 Research Blog 3238 24 Research 2 Career 3167 14 HR 3 QMR Q1 2862 42 Research 4 HCM Vacancy 2672 14 HR 5 Residential 2640 21 Residential 6 Vacancy 2628 6 HR 7 Ý kiến chuyên gia 2293 17 Marcom 8 Liên hệ 2271 23 Marcom 9 Form đăng ký QMR Q1 1832 34 Research 10 Ho Chi Minh Office 1627 34 Marcom
SOCIAL MEDIA CONTENT PILLARS OVERVIEW LinkedInFacebook


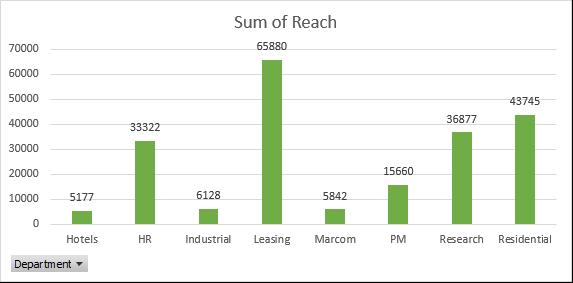
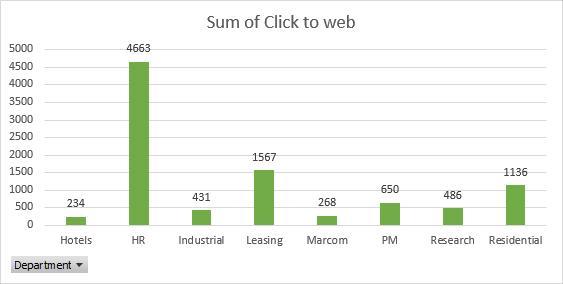
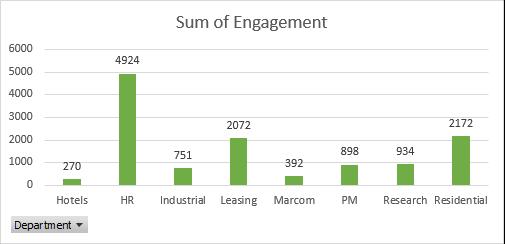
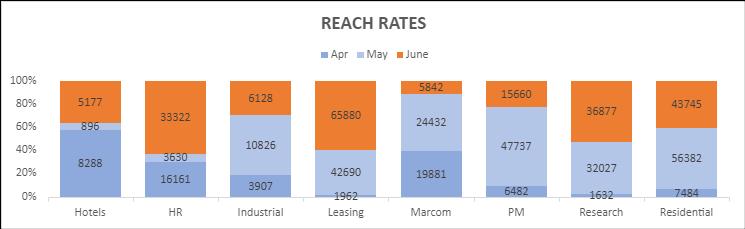
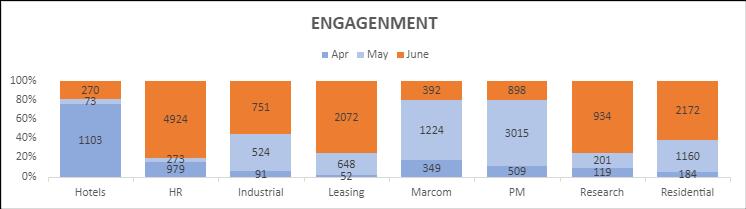
SOCIAL MEDIA – FACEBOOK As the number of total post is higher than last month and strongly increased CTW and Engagement compared to May (without Ads). In June, the total Reach on Facebook decreased significantly compared to last month because in May there was part of performance was get by spam tool from cheating agency. The Engagement is double than the previous months as the content and visual are really improved in June (timing also impacts). Click to web are also double than May. (01/06 - 30/06) Title Hotels HR Indus Leasing Marcom PM Research Resi TOTAL Total Post 1 2 4 14 3 5 23 12 64 Evol vs May 0 0 3 7 9 1 15 5 +14 Reach 5177 33322 6128 65880 5842 15660 36877 43745 212631 Evol vs May 4281 29692 4698 23190 18590 32077 4850 12637 -5989 Click to web 234 4663 431 1567 268 650 486 1136 9435 Evol vs May 185 4490 45 1163 610 1716 385 516 +4458 Engagement 270 4924 751 2072 392 898 934 2172 12413 Evol vs May 197 4651 227 1424 832 2117 733 1012 +5295
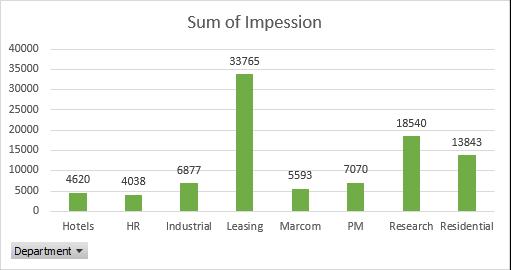
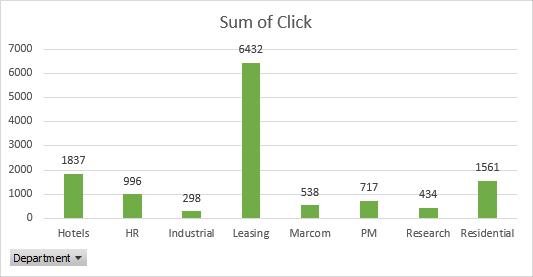
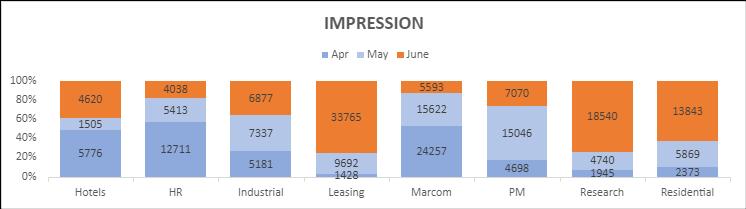
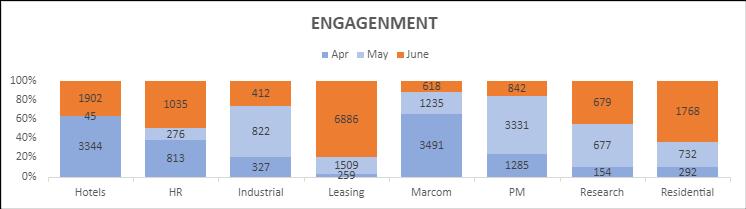
SOCIAL MEDIA – LINKEDIN (01/06 - 30/06) Title Hotels HR Indus Leasing Marcom PM Research Resi TOTAL Total Post 1 2 4 14 3 5 21 11 61 Evol vs May 0 -1 -2 7 -11 -1 16 6 +14 Impression 4620 4038 6877 33765 5593 7070 18540 13843 94346 Evol vs May 3115 -1375 -460 24073 -10029 -7976 13800 7974 +29122 Click to web 1837 996 298 6432 538 717 434 1561 12813 Evol vs May 1805 804 -386 5053 -460 -2394 -203 902 +5121 Engagement 1902 1035 412 6886 618 842 679 1768 14142 Evol vs May 1857 759 410 5377 617 2489 2 1036 +5515 As the number of total post is higher than last month and strongly increased Reach, CTW and Engagement compared to May. In June, the total Reach increased significantly compared to last month. The Engagement is double than the previous months as the content and visual are really improved in June (timing also impacts). Click to web are also double than May. Leasing rocketed in both impression, click and engagement versus last month due to the rise in number of posts (as ⅓ of the impression , ½ click, and more than ½ engagement come from Leasing posts).

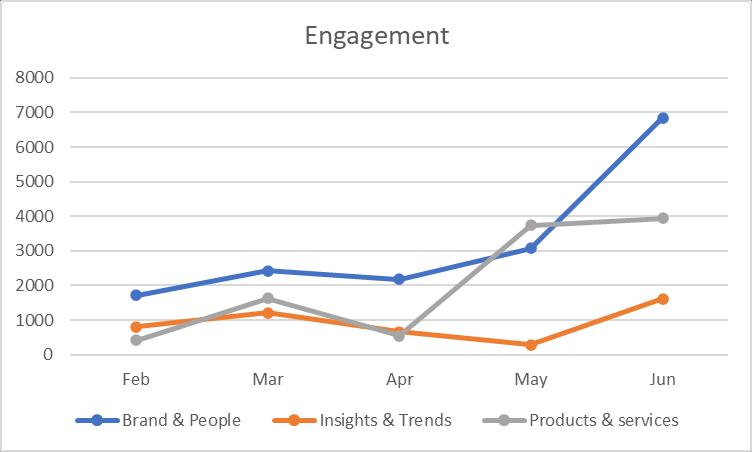
Research, Leasing, Residential, HR and Industrial better performed when considered to last months while Hotels, Marcom, PM lower performed.
SOCIAL MEDIA – FACEBOOK (Apr/May/June)
Detailed of our posts on fanpage SOCIAL MEDIA – FACEBOOK details
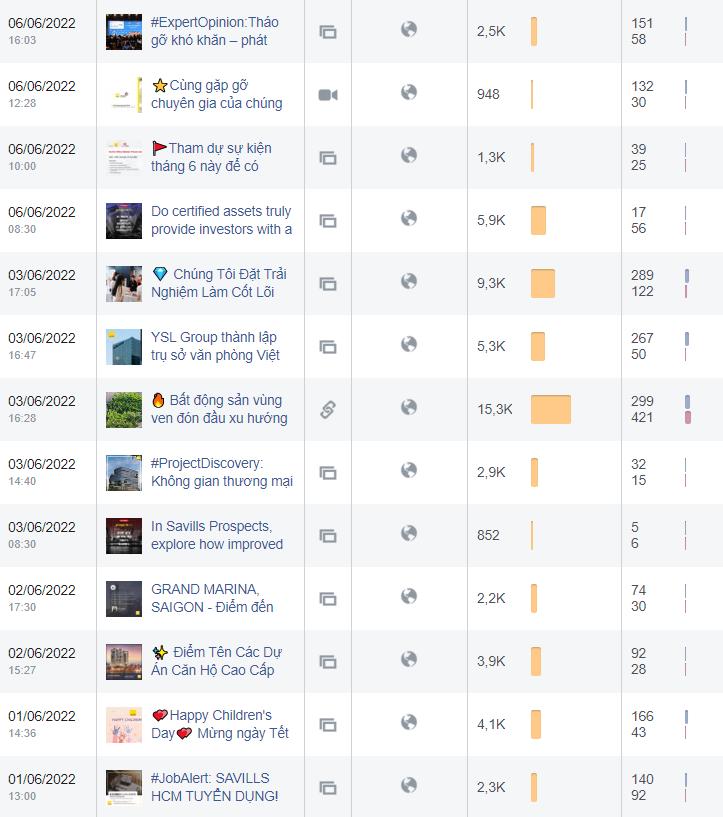
SOCIAL MEDIA – FACEBOOK details Detailed of our posts on fanpage


SOCIAL MEDIA – LINKEDIN (Apr/May/June)
Research, Hotels, Leasing, Residential and HR better performed when considered to last month while Marcom, Industrial, PM lower performed.
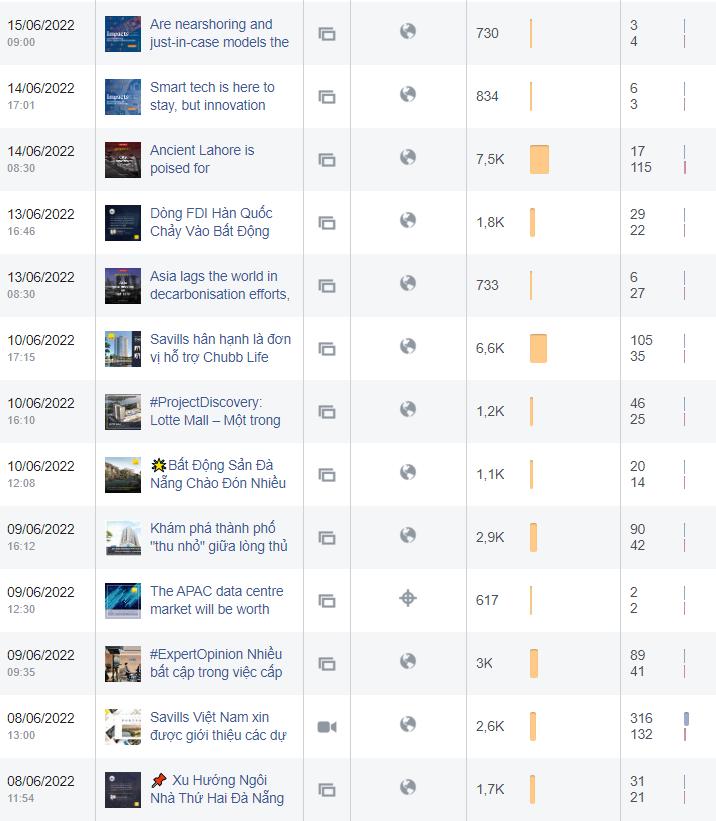
SOCIAL MEDIA - LINKEDIN details LinkedIn Followers Detailed of our posts on LinkedIn Page

THANK YOU!