

SPEAKERS


Dr. Gavin Mudd Associate Professor at RMIT University Duane Thompson Head of Water MINETEK Nick Deeks GHD | BE (Civil & Environmental) Technical Director Hydrology Lourenço Mendonça Technical Sales Water MINETEK, Brazil OUR

“THERE HAS BEEN A STAGGERING RISE IN THE NUMBER OF EXTREME WEATHER EVENTS OVER THE PAST 20 YEARS.” 3 YALE ENVIRONMENT 360, REPORTING ON A STUDY FROM THE UNITED NATIONS.
The information presented in the following graphs is from a publication called “The human cost of disasters: an overview of the last 20 years.” By the Centre for Research on the Epidemiology of Disasters, the United Nations Office for Disaster Risk Reduction (UNDRR.)
Major disasters: 4,212 compared to 7,348.
These are disasters which have killed ten or more people; affected 100 or more people; resulted in a declared state of emergency, or a call for international assistance.
Deaths per million: 1.19 million lives compared to 1.23 million lives People affected per billion: 3.25 billion compared to 4.2 billion people (many on more than one occasion.)
The global economic loss from disaster: Disaster has cost us US$1.19 trillion in economic losses compared to $2.97 trillion.
What can explain the sharp increase?
Much of the difference is explained by a rise in climate -related disasters including extreme weather events: from 3,656 climate -related events (1980-1999) to 6,681 climate -related disasters in the period (2000-2019).
The last twenty years have seen the number of major floods more than double, from 1,389 to 3,254, while the incidence of storms grew from 1,457 to 2,034.
Floods and storms were the most prevalent events.
THE HUMAN COST OF DISASTERS 5 4212 7348 0 1000 2000 3000 4000 5000 6000 7000 8000 MAJOR DISASTERS 1.19 1.23 1.17 1.18 1.19 1.2 1.21 1.22 1.23 1.24 DEATHS PER MILLION 3.25 4.2 0 0.5 1 1.5 2 2.5 3 3.5 4 4.5 AFFECTED PER BILLION 1.63 2.97 0 0.5 1 1.5 2 2.5 3 3.5 GLOBAL COST PER TRILLION 1980-99 2000 19
THE RISE IN EXTREME WEATHER EVENTS 6 3656 6681 0 1000 2000 3000 4000 5000 6000 7000 8000 CLIMATE & EXTREME WEATHER EVENTS 1389 3254 0 500 1000 1500 2000 2500 3000 3500 MAJOR FLOODS 1457 2034 0 500 1000 1500 2000 2500 STORMS 1980-99 2000 19
“FLOODS AND STORMS ARE THE MOST PREVALENT EVENTS.”
CENTRE FOR RESEARCH ON THE EPIDEMIOLOGY OF DISASTERS, UNITED NATIONS OFFICE FOR DISASTER RISK REDUCTION
While a rise in other areas including drought, wildfires, extreme temperatures and earthquakes has also been noted –Floods and storm events were the most prevalent.
This trend needs to be considered when approaching mine water management.
How do you plan for this increase, and how can we mitigate risk?
7
UNDERSTANDING TAILINGS DAM DISASTERS
 PRESENTED BY DR. GAVIN MUDD
MINING DISASTERS & THE IMPORTANCE OF WATER
Mining is both a large consumer of water as well as a large producer of water. Dr. Gavin Mudd has been working in the space of quantifying the footprint of mining for many years.
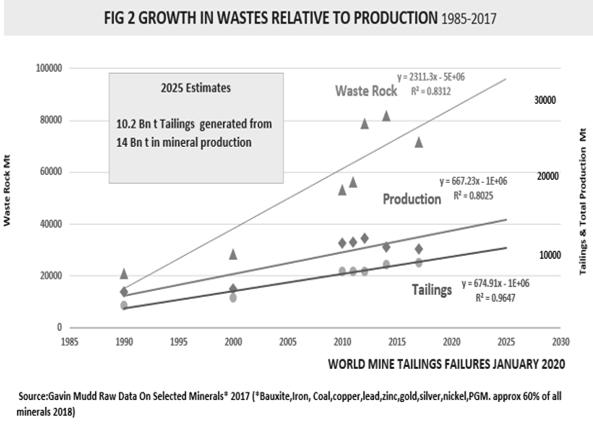
MINING NOW GENERATES
~9 BILLION TONNES OF TAILINGS ANNUALLY
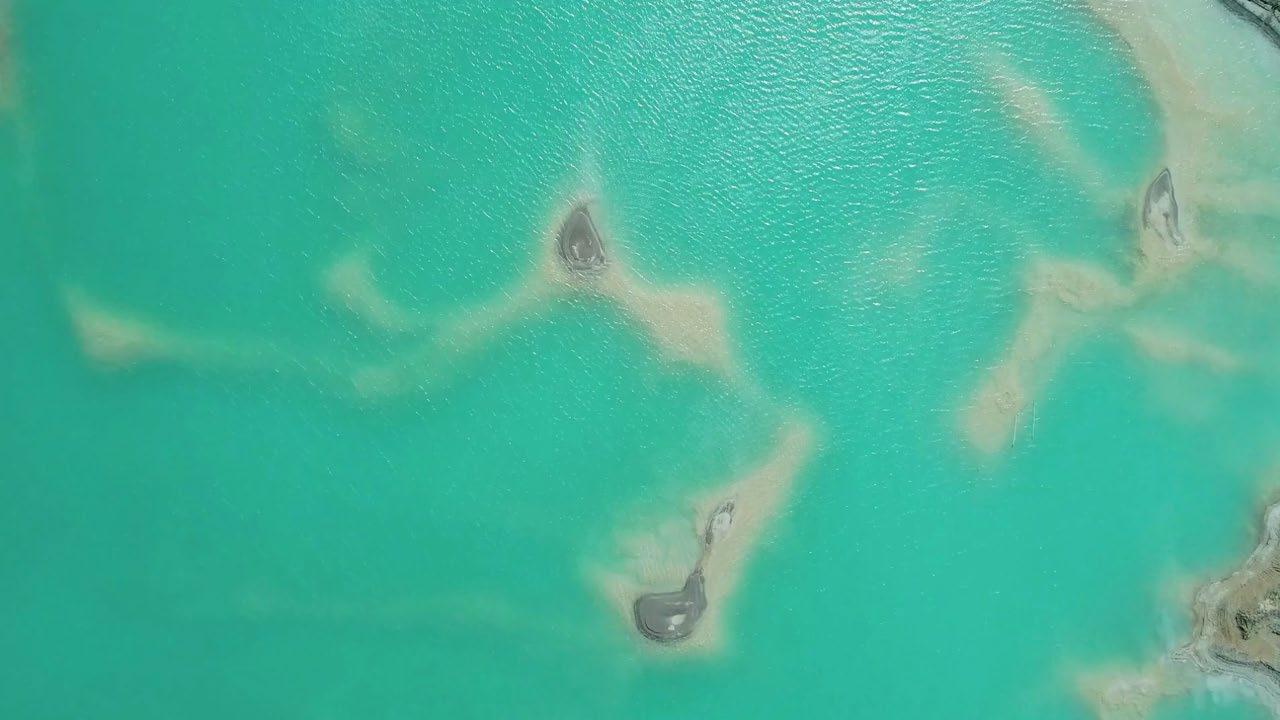
We need to consider both the quantity (ie. Hydrology - flood risks) and quality (the chemistry - pollution) of tailings dams when looking at mine water management. In Australia many mines have to deal with pollution risks or flood risks, and often both.
It’s important to not cause another problem by only considering one of these issues in mine water management strategies.
Recent major mining -related disasters around the world have turned attention to the links between mine water management and tailings dam safety and related issues.
EXAMPLES OF DISASTERS IN AUSTRALIA


In the last 10 years we have seen an increase in accidents in mining.
These articles are two examples from more than 5 years ago. Even before the major dam collapses most people know (in Brumadinho and Minas Gerais) we’ve had some big floods effecting many areas of mines in Australia.
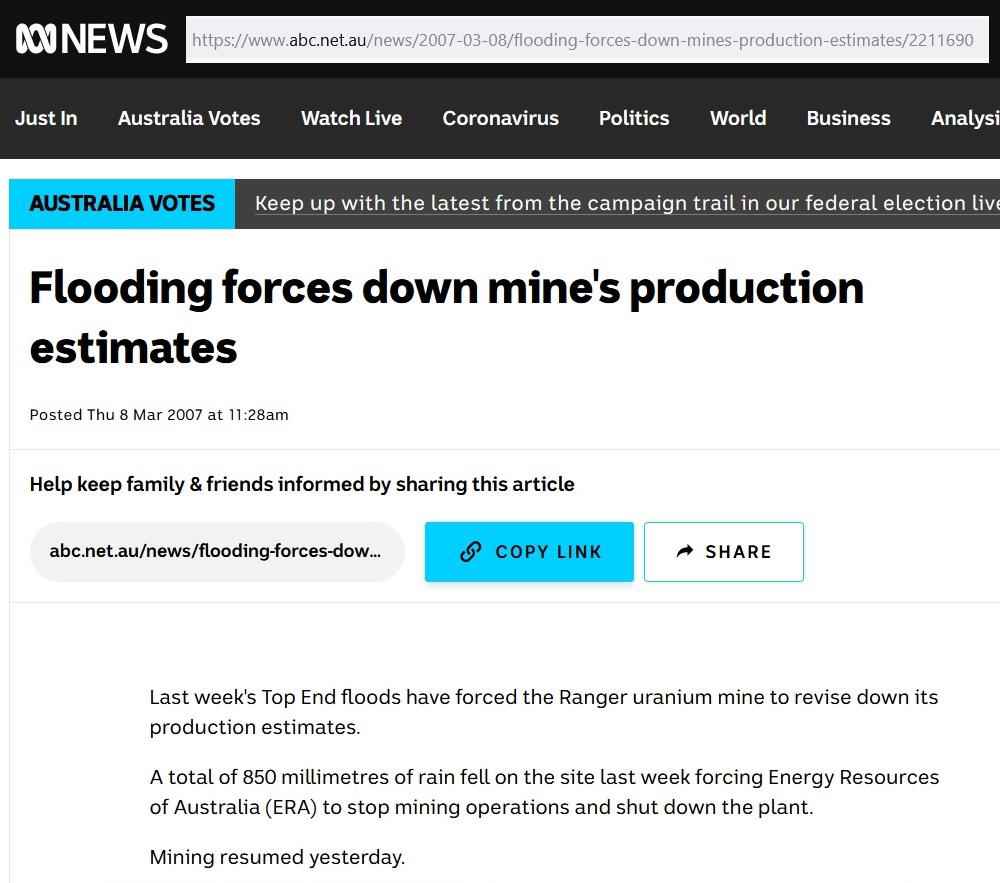
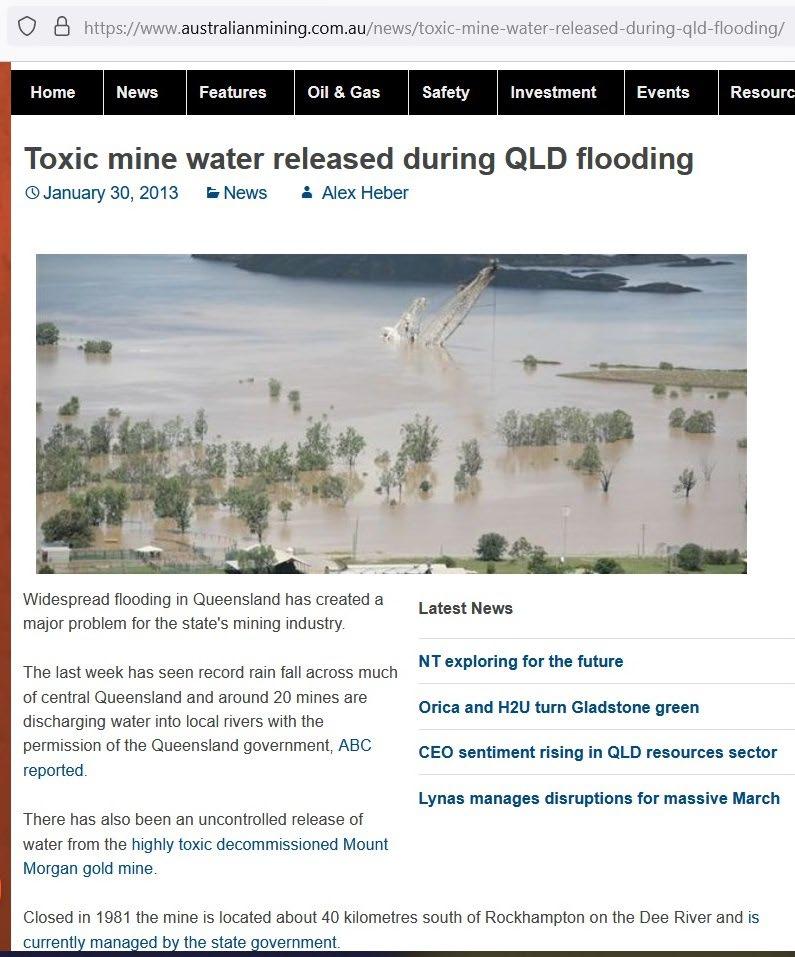
Hunter Valley, Bowen Basin, Mount Morgan Mine to name a few. Many flood risk mines are near national parks or places of cultural significance.
We need to consider a solution. These cases should make us stop and think about better solutions.
Engineering, monitoring hydrological estimates and maintenance and monitoring and especially the management systems we have in place.
10
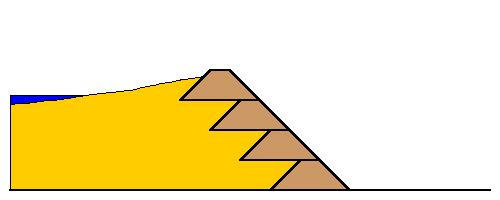
SOME TSF MODES: THE IMPORTANCE OF WATER
PIPINGOVERTOPPING
RAPID WATER RISEDYNAMIC LIQUEFACTION
These graphics of common tailings dam failure modes come from the WISE Uranium Project, which includes the only independent synthesis of information on tailings dam failures. The most common causes of tailings dam failures include over- topping, foundation failure, static or dynamic liquefaction, piping or wall failure.

11
THE MOST COMMON FAILURES OF TAILINGS DAMS COME BACK TO WATER. BUDGET, BALANCE AND WATER QUALITY.
13 COUNT BY SEVERITY CODE COUNT BY SEVERITY INDICATORS DECADE VERY SERIOUS FAILURES SERIOUS FAILURES MINOR FAILURES POTENTIAL FAILURE CONDITION ALL FAILURES POTENTIAL FAILURES CUMULTIVE RELEASE CUMULATIVE RUNOUT (KM) DEATHS 1 2 3 4 Count M Cub m Km Count 2010-2019 12 14 19 0 45 102.7 859.6 486 2000-2009 12 11 12 1 36 14.1 292.3 342 1990-1999 12 12 25 3 52 68.2 169.2 72 1980-1989 6 8 31 3 48 103.1 48.9 316 1970-1979 7 8 16 1 32 24.7 284 838 1960-1969 8 4 21 2 35 19.6 59 1050 1950-1959 8 2 3 0 13 19.3 51.1 303 Total/ Average 55 63 95 10 233 155 845 2004 DAM FAILURES BY DECADE (1915-2020) This information comes from “world mine tailings failtures.org,” which sources Dr. Gavin Mudd’s work, including a world waste survey for the joint study groups, UNEP’s 2019 and Geo6. This data shows that we haven’t improved in any aspects of dam failures. Based on available compilations an apparent 43-50% of all existing tailings are in “high hazard potential” TSFs and that percentage is not expected to change over the next 5 years with over 90% of all new depositions going to already existing standard above ground storage facilities.
THE TAILINGS DAM LANDSCAPE
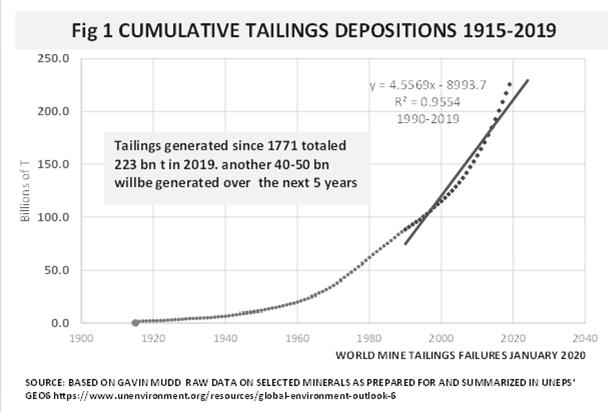
The world’s 29,000-35,000 {1} existing active, inactive and abandoned tailings storage facilities (TSF) contain approximately 223 billion tonnes (534 billion cubic meters.) The increasing volumes of total waste to product is directly attributable to the mining of ever lower grades across all minerals.
This does NOT mean we are “running out” it simply means geology, technology, economics coincide to keep mining (mostly) profitable. But there are more tailings per unit metal / mineral. - Quote & graphs from worldminetailingsfailures.org
14
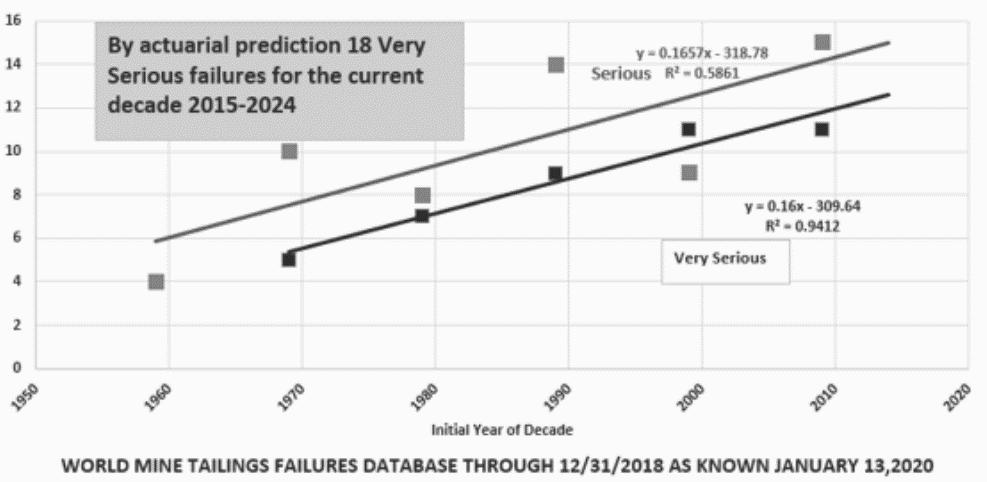
TREND OF INCREASING FREQUENCY AND SEVERITY OF FAILURES
15
“THIS IS THE CHALLENGE. THIS IS WHAT WE HAVE TO RESPOND TO.
NOT JUST THE NUMBER OF FAILURES, BUT ALSO THE CHARACTERISTICS, IN TERMS OF THE SEVERITY AS WELL.
HOW DO WE TALK ABOUT DERISKING OUR TAILINGS DAMS TO ACHIEVE OUR SAFETY GOALS? I THINK THAT’S A REALLY IMPORTANT POINT.”
- Dr. Gavin Mudd
“WHAT THIS SUGGESTS, IS THAT OUR EFFORTS IN MANAGING MINE WASTE ARE NOT KEEPING UP WITH THE SCALE OF MINE WATER.”
The previous data is some of the only work on gathering tailings dam failures, noting important factors that make up these disasters.
We need to understand the volume of waste, where it is, how it’s being managed and if there is a disaster.
Where are the tailings, and what are the risks.
We have not been asking these questions as rigorously as we should.
Looking at the data; the number of instances relative to the number of tailings, it shows is that there is an increasing trend.
The data collected shows an upwards trend in disasters.
What this suggests is that our efforts in managing mine waste are not keeping up with the scale of mine water.
We need to learn how to get better outcomes and mine water management plays a large role in this.
THE NUMBER OF TAILINGS DAM FAILURES HAS DOUBLED IN THE PAST 20 YEARS.
The most important question is “why?”
Once we know why things fail, we can come up with solutions.
To quote Albert Einstein, You can’t solve a problem with the same thinking that created it. Therefore, we need to make sure we understand our water, climate, and weather event risk.
If the airline industry had this same outcome with flying, no one would be flying at all. If we take that industry as an example, we have a lot more flights, a lot more people, however their safety record is going up. It’s a great example that says, Yes, we can achieve great goals in safety.
This safety thinking is not something that’s unusual in mining. From occupational health and safety in mining to process mining. Many departments already think strategically about safety outcomes.
WHY HAVE SO MANY TAILINGS DAMS FAILED IN RECENT YEARS? EMAP SCHOOL OF APPLIED MATHEMATICS, FUNDACAO GETULIO VARGAS, RIO DE JANEIRO, BRAZIL
We need to think about how we can apply this same kind of rigorous safety thinking to our tailings dams, so that in another 20 years time, instead of accidents doubling, we’ve reduced that number.
By 2050: Get our target down to zero.
Hopefully, that’s a target we can all get on board with.
THE RESULTS OF DAM COLLAPSE
WORST CASE SCENARIO
BRUMADINHO DAM COLLAPSE
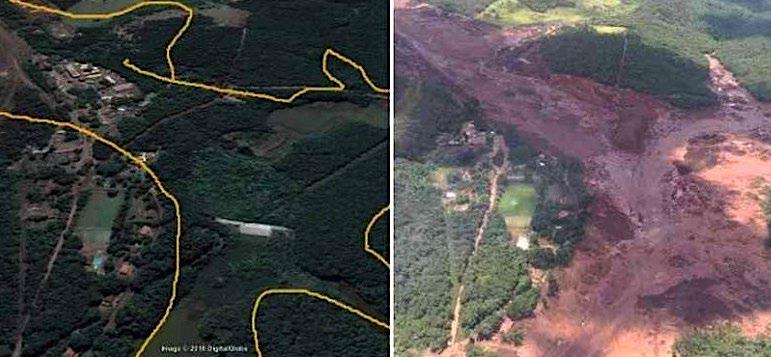
When things go wrong with a tailings dam, we aren’t looking at something small like a pause in operation.
When things go wrong, they can go horribly wrong.
We need to get better at thinking What will happen if things do go wrong? We need to fix these ‘what if’ things first, before going to market.
We know tailings dams can kill people, cause extreme environmental impacts and more. We need to make sure we are asking these questions.
There are also multi -million-dollar costs.
Regulation, and independent regulators are one of the key processes for success. We need to make sure we are having these independent checks.
At the site of the Brumadinho disaster, they were compliant with the legal obligations, but those criteria weren’t good enough.
We have to start asking these same questions across every tailings dam and water storage facility. Before we install a new tailings dam, we have to ask ourselves “What could go wrong.” “What can we do to mitigate these risks.”
We need to not only get the engineering right, but regulations right, and the funding right, which is something not often talked about in these conversations.
270 LIVES LOST $7 BILLION PAYOUT THE LARGEST SETTLEMENT IN BRAZILIAN LEGAL HISTORY. $3.7 BILLION ADDITIONAL EXPENSES IN VALE’S 2020 RESULTS. HOMICIDE CHARGES FILE FOR 16 PEOPLE INCLUDING THE FORMER CHIEF EXECUTIVE. BRUMADINHO DAM COLLAPSE
DROP IN SHARES IMMEDIATELY AFTER THE DISASTER. ONGOING FALLOUT WITH REGULATORS, COMMUNITY AND INVESTORS. ADDITIONAL LAWSUITS BETWEEN MINERS AND LOCALS. ASSESSMENT AND EVACUATION OF 3 OTHER SITES. PLANS TO IDENTIFY AND DISMANTLE 30 OTHER STRUCTURES BUILT THE SAME WAY AS BRUMADINHO. ONGOING ENVIRONMENTAL AND TOURISM DAMAGE. AND MORE… 21 BRUMADINHO DAM COLLAPSE
22 WHY HAVE SO MANY TAILINGS DAMS FAILED IN RECENT YEARS? EMAP SCHOOL OF APPLIED MATHEMATICS, FUNDACAO GETULIO VARGAS, RIO DE JANEIRO, BRAZIL INCREASES IN PRODUCTION PUTS PRESSURE ON TAILINGS FACILITIES. PRODUCTION INCREASED AT LOS FRAILES, MT POLLEY, SAMARCO AND BRUMADINHO BEFORE THE TAILINGS DAM FAILURES. COMPENSATION PACKAGES FOR MET OR EXCEEDED KPI’S OFTEN ENCOURAGE MANAGERS TO TAKE RISKS.
TO WATCH THE FULL WEBINAR ON DEMAND.


CLICK
1. The human cost of disasters: an overview of the last 20 years (2000-2019) | UNDRR 2. Extreme Weather Events Have Increased Significantly in the Last 20 Years - Yale E360 3. 3 - Changes in Climate Extremes and their Impacts on the Natural Physical Environment (ipcc.ch) 4. World Mine Tailings Failures —from 1915 – supporting global research in tailings failure root cause, loss prevention and trend analysis 5. Why have so many tailings dams failed in recent years? – ScienceDirect 6. Vale Agrees to $7 Billion Settlement for Brumadinho Dam Collapse – WSJ 7. Brazil court accepts homicide charges over dam disaster | News | DW | 15.02.2020 SOURCES
THANK

YOU