

Q2 2025 marked a notable shift in both market performance and overall sentiment following a lackluster Q1 that fell short of seller and broker expectations. Much of the second quarter was weighed down by global tariffs and the ongoing restructuring of international trade, contributing to widespread uncertainty across the financial markets during what is traditionally the most active time of the year in the local marketplace.
Total active listings in the 34236 zip code stood at $606.7 million across 297 condominiums, which was a decline of 9.1% of total dollar volume and 6% of listings. This represents 11.2 months of inventory, up moderately from 10.7 in the previous quarter, keeping the market balance firmly in buyers’ hands.
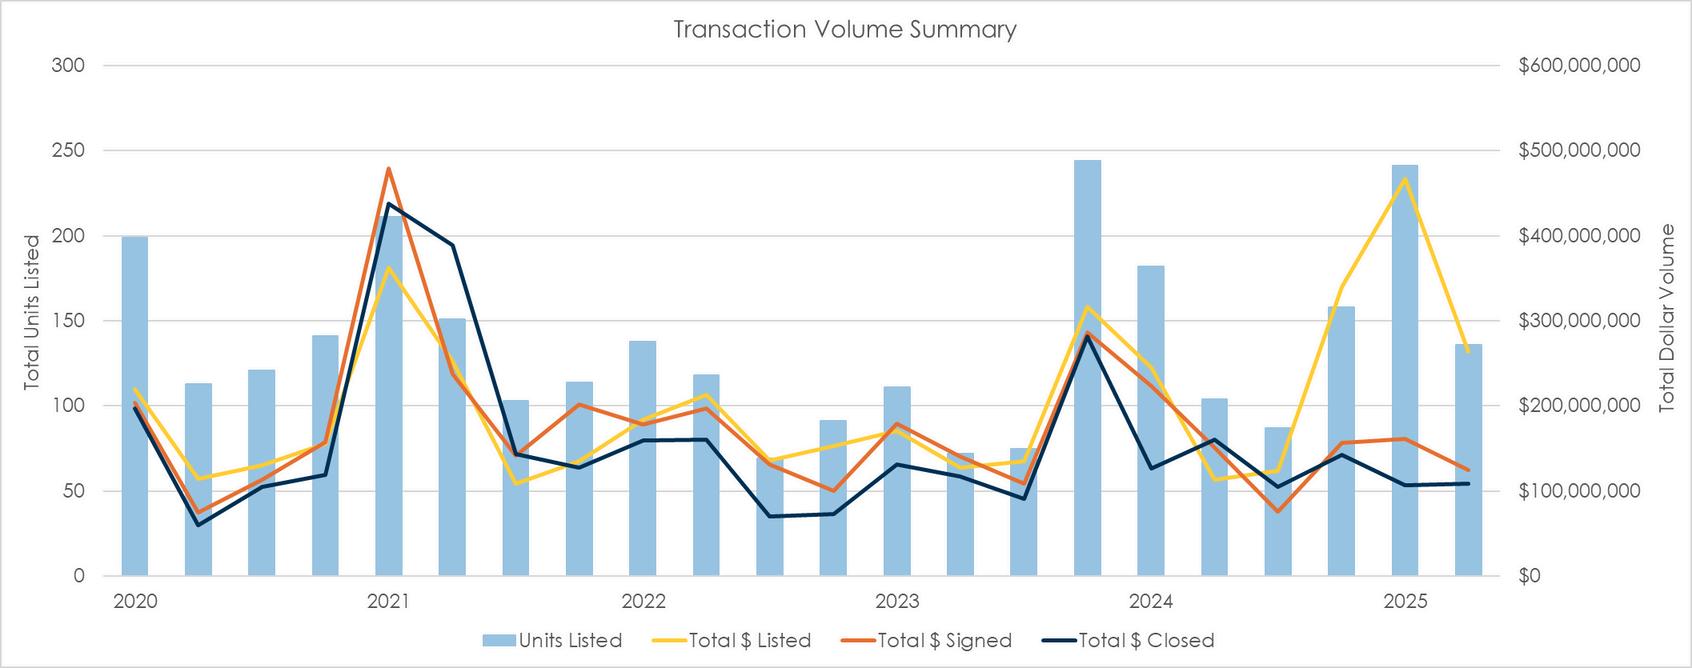
The average closed price in Q2 was $1.46 million, down 8.15% quarter-over-quarter (QoQ) and showing only a slight 0.9% year-over-year (YoY) increase. 74 transactions closed during the quarter, representing a 10.5% improvement over Q1, though down a staggering 32.7% compared to Q2 2024. Total dollar volume closed was $108.6 million, reflecting a modest gain over Q1, but a substantial $51.3 million (-32.1%) decline YoY. Meanwhile, signed contracts totaled $124.4 million, down 23% QoQ and 14.4% compared to the same period last year.
By Simon Bacon, Executive Director | Developer Services
Despite softer sales activity, new listings totaled $263.5 million in volume, bringing the year-to-date total to $730.1 million, up nearly 30% YoY, even as total closed value is down almost 25%. This divergence continues to emphasize the imbalance between supply and demand. Unsurprisingly, the number of new listings declined sharply from the record number seen in Q1. 136 new units came to market at an average list price of $1.94 million, reflecting a 30.7% contraction in listing volume but a 6.9% increase in listed price.
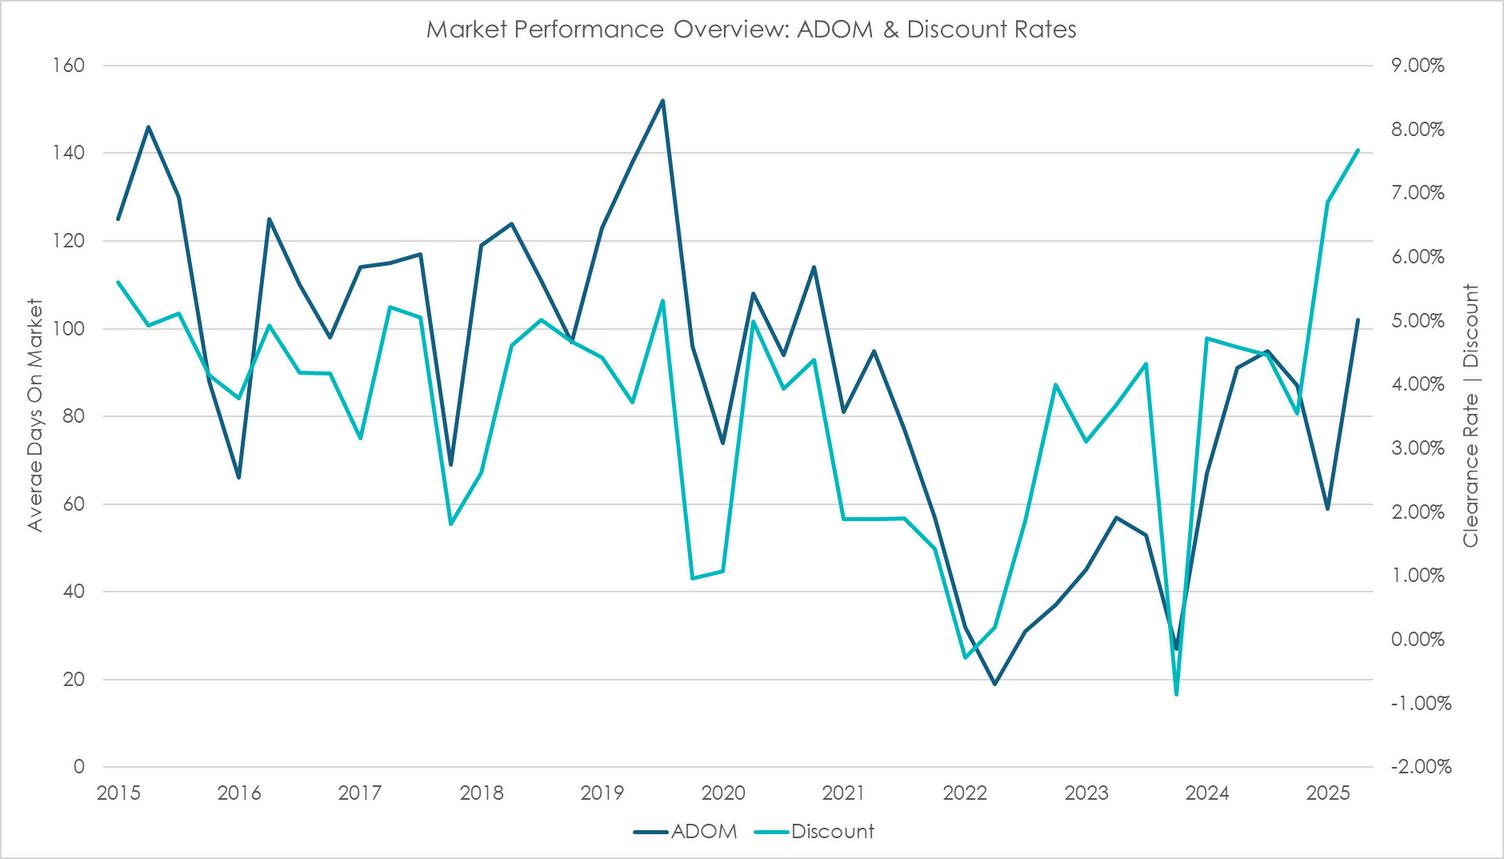
One of the more telling indicators of market recalibration came via average days on market (DOM), which surpassed 100 days (102) for the first time since Q4 2020. While still roughly 15% below 2017-2019 average, this milestone marks the first substantial signal that the market may be beginning to normalize.
The average listing discount, defined as the difference between final asking and closed price, rose to 7.7%, up 11.9% from Q1 and a dramatic 67% increase over Q2 2024. This metric is at its highest level in over 13 years, and indicates sellers’ expectations are being reset. Viewed alongside the uptick and normalization of DOM, these shifts indicate the market may be re-aligning, setting the stage for a return to more consistent and characteristic market behavior, which leaves us with the question, are we there yet…


Dollar Volume fell 32% to $108M, compared to $160M in Q2 ‘24
Closed Transactions QoQ up by 10%, with 74 closings last quarter
Discount has increased by 67% YoY from 4.59% to 7.67%


surpassing Q volume of $188M by


2015 - 2025
TEN-YEAR AVERAGE
TOTAL $ CLOSED AVERAGE FULL YEAR
$462,900,379
TOTAL $ CLOSED AVERAGE YEAR-TO-DATE
$276,907,083
TOTAL UNITS CLOSED AVERAGE FULL YEAR
440
TOTAL UNITS CLOSED AVERAGE YEAR-TO-DATE
234

The first two quarters of 2025 had $215.7M in closed deals, the weakest results since 2019.
141 units closed in the first two quarters, the lowest total since prior to 2010 and off almost 40% against the 10-year average.


TRANSACTIONVOLUMESUMMARY
2020 - 2025
FIVE-YEAR AVERAGE
UNITS LISTED
TOTAL VS. AVERAGE
2,979 | 135
AVERAGE $ LISTED
$202,976,037
AVERAGE $ SIGNED
$173,813,073
AVERAGE $ CLOSED
$155,161,131

In Q2 2025, total dollar volume closed was $108.6 million, reflecting a modest gain over Q1, but a substantial $51.3 million (-32.1%) decline YoY. Meanwhile, signed contracts totaled $124.4 million, down 23% QoQ and 14.4% compared to the same period last year.
The dollar volume listed over the past three quarters totaled $1.087B which has drastically shifted the dynamics in favor of buyers


Moving annual shows performance data for the past 12 months, updated each month to reflect the most recent quarter.
Closed Dollar Volume in Q2 ‘25 of $463M fell 10% from last quarter
Listing Discount has increased from last quarter by 16% from 4.86% to 5.63%

New Listing Dollar Volume is up 6% to $1.279B from Q1 ‘25


ROLLINGSALESSUMMARY
2019 - 2025
AVERAGE UNITS CLOSED
462
AVERAGE $ CLOSED
$1,220,643
MEDIAN $ CLOSED
$830,196
AVERAGE $ PENDING
$1,312,317
The average closed price in Q2 was $1.46 million, down 8.15% quarter-over-quarter (QoQ) and showing only a slight 0.9% year-over-year (YoY) increase. 74 transactions closed during the quarter, representing a 10.5% improvement over Q1, though down a staggering 32.7% compared to Q2 2024.


AVERAGE SALES PRICE
$1,071,160
AVERAGE DAYS ON MARKET

One of the more telling indicators of market recalibration came via average days on market (DOM), which surpassed 100 days (102) for the first time since Q4
2020. While still roughly 15% below 2017-2019 average, this milestone marks the first substantial signal that the market may be beginning to normalize.


Over the past three quarters, the average clearance rate has been 33%, representing a total closed dollar volume of $358.4M
From 2015-2020 the average annualized clearance rate for $ volume (closed vs listed), was 87%. From Q1 2020 through Q2 2025 that ratio declined to 78%. Since Q1 of 2010, there has only been 6 quarters where the clearance rate has been less than 50%. It has occurred 4 times in the past 6 quarters which illustrates a market that is grappling to find its balance and value.


Average New List Price increased by 20% from $4.74M last quarter to $5.67M in Q2 ‘25
Listing Discount increased by 11% from 8.23% in Q1 ‘25 to 9.13% in Q2 ‘25
Average Price Closed went up slightly 4% to $4.84M from $4.65M last quarter
QUARTER-OVER-QUARTER


2015 - 2025
TEN-YEAR AVERAGE
TOTAL UNITS CLOSED FULL YEAR VS. YTD
280 | 204
AVERAGE $ CLOSED FULL YEAR
$119,720,625
AVERAGE $ CLOSED YTD $83,561,392


THE LUXURY SEGMENT | The $3M+ segment of the market continues to exacerbate the themes that are felt in the rest of the market. More supply than demand. 26 new listings came to market, 23 less than the record of 49 established in Q1. The $5.67MM average price was a 19.6% increase over QI. Days on market had a steep increase for condominiums priced over $3MM, to 121 from 74, but declined by 11.6% over Q2 of 2024. Aligned with a 9.1% listing discount, up by 10.8%, is a clear indication that pricing and seller expectations in this market segment still has a way to go.


While this report accounts for publicly listed new development data, there is in excess of 600 additional residences of shadow inventory in developments that are signing binding contracts, and close to 60% of that inventory is currently under contract. With several large-scale developments launching in the next 6-12 months, there will be a significant increase in shadow inventory which will affect the overall market dynamics.


