
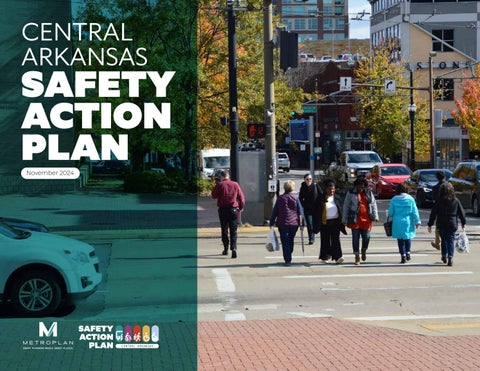
November 2024


ARDOT
City of Alexander
City of Austin
City of Bauxite
City of Benton
City of Bryant
City of Cabot
City of Cammack Village
City of Conway
City of England
City of Greenbrier
City of Guy
City of Haskell
City of Jacksonville
City of Keo
City of Little Rock
City of Lonoke
City of Maumelle
City of Mayflower
City of Mount Vernon
City of North Little Rock
City of Shannon Hills
City of Sheridan
City of Sherwood
City of Taskwood
City of Vilonia
City of Ward
City of Wooster
City of Wrightsville
Clinton National Airport
Faulkner County
Grant County
Hot Springs Village
Little Rock Port Authority
Lonoke County
Pulaski County
Rock Region METRO
Saline County
The information provided in this document is intended to be used for informational purposes only. No expressed or implied warranties are made by Metroplan, Kimley-Horn, Traffic Engineering Consultants, Crafton Tull,and Laneshift concerning the accuracy, completeness, reliability, and usability of this information. Further investigation such as field verification, site condition assessments, engineering analysis, and design are necessary prior to implementing any of the guidance contained herein.
This report was funded in part through grant(s) from the Federal Highway Administration and Federal Transit Administration, U.S. Department of Transportation. The views and opinions of the authors expressed herein do not necessarily state or reflect those of the U.S. Department of Transportation.
Notice of Nondiscrimination Metroplan complies with all civil rights provisions of the federal statutes and related authorities that prohibit discrimination in programs and activities receiving federal financial assistance. Therefore, Metroplan does not discriminate on the basis of race, sex, color, age, national origin, religion, disability, or income status, in admission or access to and treatment in Metroplan’s programs and activities, as well as Metroplan’s hiring or employment practices. Complaints of alleged discrimination and inquiries regarding Metroplan’s nondiscrimination policies may be addressed to Sydney Dozier, Title VI/ADA/504 Coordinator, 501 West Markham Street, Suite B, Little Rock, AR 72201, (501) 372-3300, or the following e-mail address: sdozier@metroplan.org
(Hearing and speech impaired may dial 711.)
This notice is available upon request from the Title VI/ADA/504 Coordinator in large print, audiotape or braille.
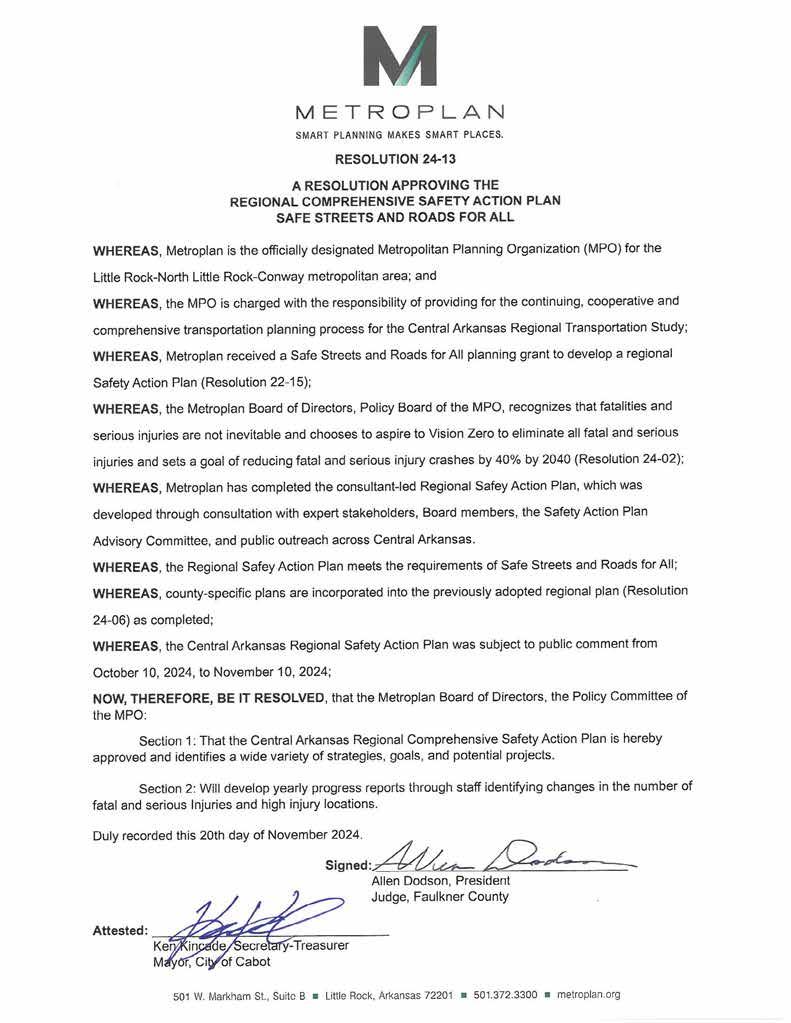
Adopted by the Metroplan Board of Directors
Date: November 20, 2024
Resolution: 24-13
America Walks
Nicole Chandler
America Walks
Rachel Cotner
ARDOT
Brad McCaleb
ARDOT
Katherine Rasmussen
ARDOT
Kim Sanders
SAFETY ACTION PLAN ADVISORY COMMITTEE
Arkansas Highway Safety Office Bridgette White
Arkansas Highway Safety Office
Debra Hollis
City of Benton
John Parton
City of Bryant
Truett Smith
City of Cabot
Travis Young
City of Conway
Kurt Jones
City of Little Rock
Grant Cox
City of Little Rock
Maneesh Krishnan
Metropolitan EMS
Kelly Lyon
Port of Little Rock
Marsha Guffey
Rock Region METRO
Becca Green Rock Region METRO
Stephen Smith
Local Safety Expert Walt Catlett

ACAT Arkansas Crash Analysis Tool
ADA Americans with Disabilities Act
AR Arkansas
ARDOT Arkansas Department of Transportation
ETC Equitable Transportation Communities
FHWA Federal Highway Administration
HIN High Injury Network
GIS Geographic Information System
KABCO Injury Severity Scale
K – Fatal Injury
A – Suspected Serious Injury
B – Suspected Minor Injury
C – Possible Injury
O – No Apparent Injury
KSI Killed or Serious Injury
LPI Leading Pedestrian Interval
MUTCD Manual on Uniform Traffic Control Devices
MVM Million Vehicle Miles
NCHRP National Cooperative Highway Research Project
NHTSA National Highway Traffic Safety Administration
NWARPC Northwest Arkansas Regional Planning Commission
PHB Pedestrian Hybrid Beacon
RRFB Rectangular Rapid Flashing Beacon
RSA Road Safety Audit
SAPAC Safety Action Plan Advisory Committee
SHSP Strategic Highway Safety Plan
SS4A Safe Streets and Roads for All
TWLT Two Way Left Turn
UALR University of Arkansas at Little Rock
USDOT US Department of Transportation
VMT Vehicle Miles Traveled
VRU Vulnerable Road User
VSL Variable Speed Limit
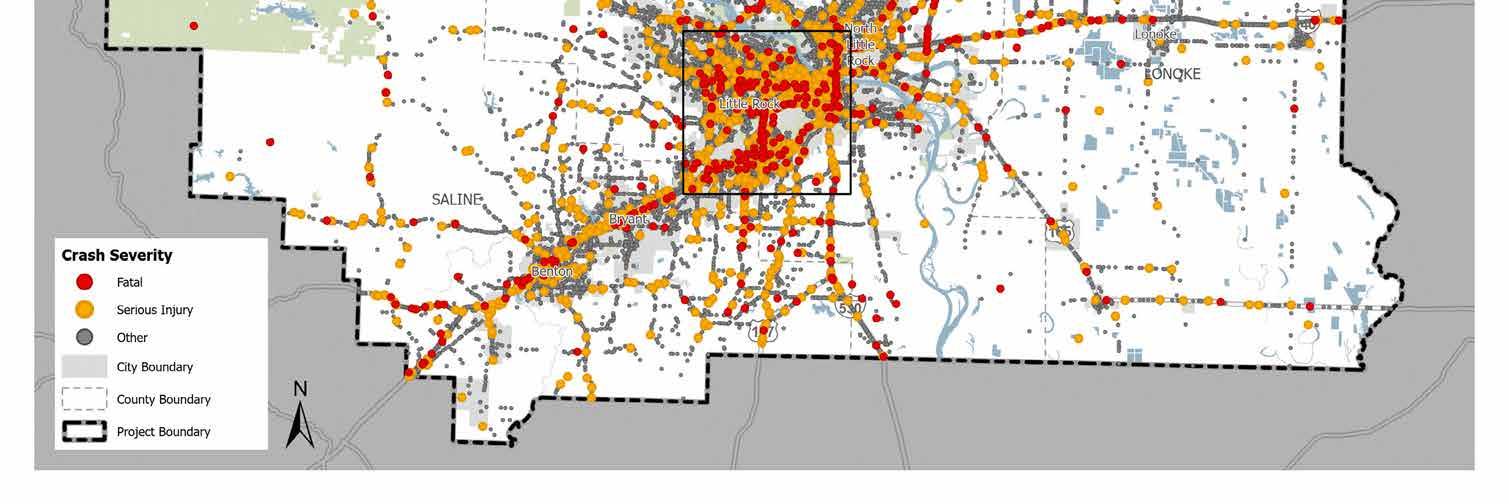
In the past five years, 553 fatal motor vehicle crashes have taken the lives of Central Arkansans, with an additional 2,210 serious injury crashes impacting more lives. Included in this total are 118 fatal pedestrian and bicycle crashes. These deaths and injuries affect family, friends, businesses, and communities. We can do better.
I was inspired by the Metroplan Board’s enthusiasm to participate in the federal Safe Streets and Roads for All program - an initiative that stands at the forefront of our commitment to community safety.
Metroplan has always prioritized the well-being of our community members, and it is with this spirit that we embrace the Central Arkansas Safety Action Plan’s vision of a 40% reduction of fatal and serious injury collisions by 2040, with the eventual goal of zero. With the support of the U.S. Department of Transportation and our partners, we are embarking on a journey to transform our streets into safer spaces for everyone.
The Central Arkansas Safety Action Plan is a comprehensive strategy that addresses the most significant roadway safety concerns within the region. It is a blueprint for implementing projects and strategies aimed at preventing roadway deaths and serious injuries. This plan is not just a document; it is a testament to our resolve to achieve zero roadway deaths using a Safe System Approach.
The development of this action plan has been a collaborative effort, reflecting the insights and expertise of various stakeholders. As we move forward, your role in this initiative will be pivotal. Your support and guidance will be invaluable as we work together to create a legacy of safety that will benefit generations to come.
I invite you to review the enclosed Central Arkansas Safety Action Plan and join us in this vital mission. Together, we can build a safer, more resilient community.
Casey Covington Metroplan Executive Director
The Central Arkansas Safety Action Plan is the Region’s road map to provide safe streets and roads for all people. The purpose of this plan is to establish and implement steps that can help Central Arkansas reach zero fatal and serious injuries on the Region’s roadways. To achieve this, Central Arkansas leaders from the Metroplan Board of Directors have committed to a goal of reaching zero fatal and serious injuries in Central Arkansas. The leaders set a key milestone goal of achieving a 40 percent reduction in fatal and serious injuries by the year 2040, with several interim goals starting with a baseline to be established in 2025 and incremental steps through the year 2050 to get to an 80% reduction.
y 2025 – Baseline
y 2030 – 10% Reduction
y 2035 – 25% Reduction
y 2040 – 40% Reduction
y 2045 – 60% Reduction
y 2050 – 80% Reduction
The Safety Action Plan includes regional safety analysis results, public engagement to identify safety issues, equity analysis, project and policy recommendations, and an implementation plan that prioritizes locations for deployment of safety countermeasures. This plan was developed by Metroplan and funded through a grant from the United States Department of Transportation (USDOT) Safe Streets and Roads for All (SS4A) Program.
The Central Arkansas Safety Action Plan focuses on safety and regional priorities within the four county Metroplan Region that includes Faulkner, Lonoke, Pulaski, and Saline Counties. Upon completion of the Safety Action Plan, supplemental plans that focused on the unique safety needs of each county were developed and are included at the end of this report.

The purpose of this plan is to establish and implement steps that can help Central Arkansas reach zero fatal and serious injuries on the Region’s roadways.


Our Goal: 40% reduction in fatal and serious injury crashes by 2040 40 by 40

The SS4A program supports regional, local, and tribal initiatives to prevent roadway deaths and serious injuries.
The Bipartisan Infrastructure Law established the new Safe Streets and Roads for All (SS4A) discretionary program that will provide five billion dollars in grants from 2022 through 2026. The SS4A Program supports regional, local, and tribal initiatives to prevent roadway deaths and serious injuries. Both transportation safety planning and project implementation efforts are eligible for SS4A grant funding.
SS4A prioritizes safety for all users of the transportation network, including people walking and biking, as well as places priority on disadvantaged communities whose transportation needs and infrastructure have historically been overlooked. It emphasizes eliminating fatal and serious injury crashes on all roads and streets and provides
opportunities for local governments to pursue additional funding to reach that goal.
In 2023, Metroplan was awarded $700,000 to develop the Central Arkansas Safety Action Plan to develop a comprehensive and well defined strategy to prevent roadway deaths and serious injuries. The Safety Action Plan includes the following components required by the United States Department of Transportation (USDOT):
y Leadership Commitment and Goal Setting
y Planning Structure
y Safety Analysis
y Engagement and collaboration
y Equity
y Policy and Process Changes
y Strategy and Project Selections
y Progress and Transparency Methods
The Central Arkansas Safety Action Plan identifies safety needs and recommendations within the Central Arkansas Region, which consists of Faulkner County, Lonoke County, Pulaski County, and Saline County. In total, the Region encompasses approximately 750,000 people. The Central Arkansas Safety Action Plan was developed in partnership with Central Arkansas cities, counties, Rock Region Metro, Metroplan, and ARDOT.
When it comes to fatal and serious injury crashes, unfortunately Central Arkansas is similar to much of the urbanized United States. Fatal and serious injuries in the Region have not declined despite significant efforts by local, regional, and
state authorities. In fact, the number of fatal crashes in Central Arkansas has increased almost every year since 2018.
Central Arkansas Region By Year
People that live in underserved areas face additional challenges of needing to get around without access to a vehicle, but often people in these areas have challenges walking, biking, using wheelchairs, or accessing transit due to poor infrastructure. Lack of sidewalks, poorly maintained pavement markings, wide roads that encourage high speeds, and lack of lighting are just some of the common examples of challenges in make walking, biking, or using a wheelchair more dangerous in Central Arkansas’ underserved areas. The transportation system is often designed with just the automobile driver in mind, but residents that rely on walking, biking, or using a wheelchair as their primary means to get to school, work, or access transit must 553
often navigate infrastructure that puts them at much greater risk of being killed or seriously injured.
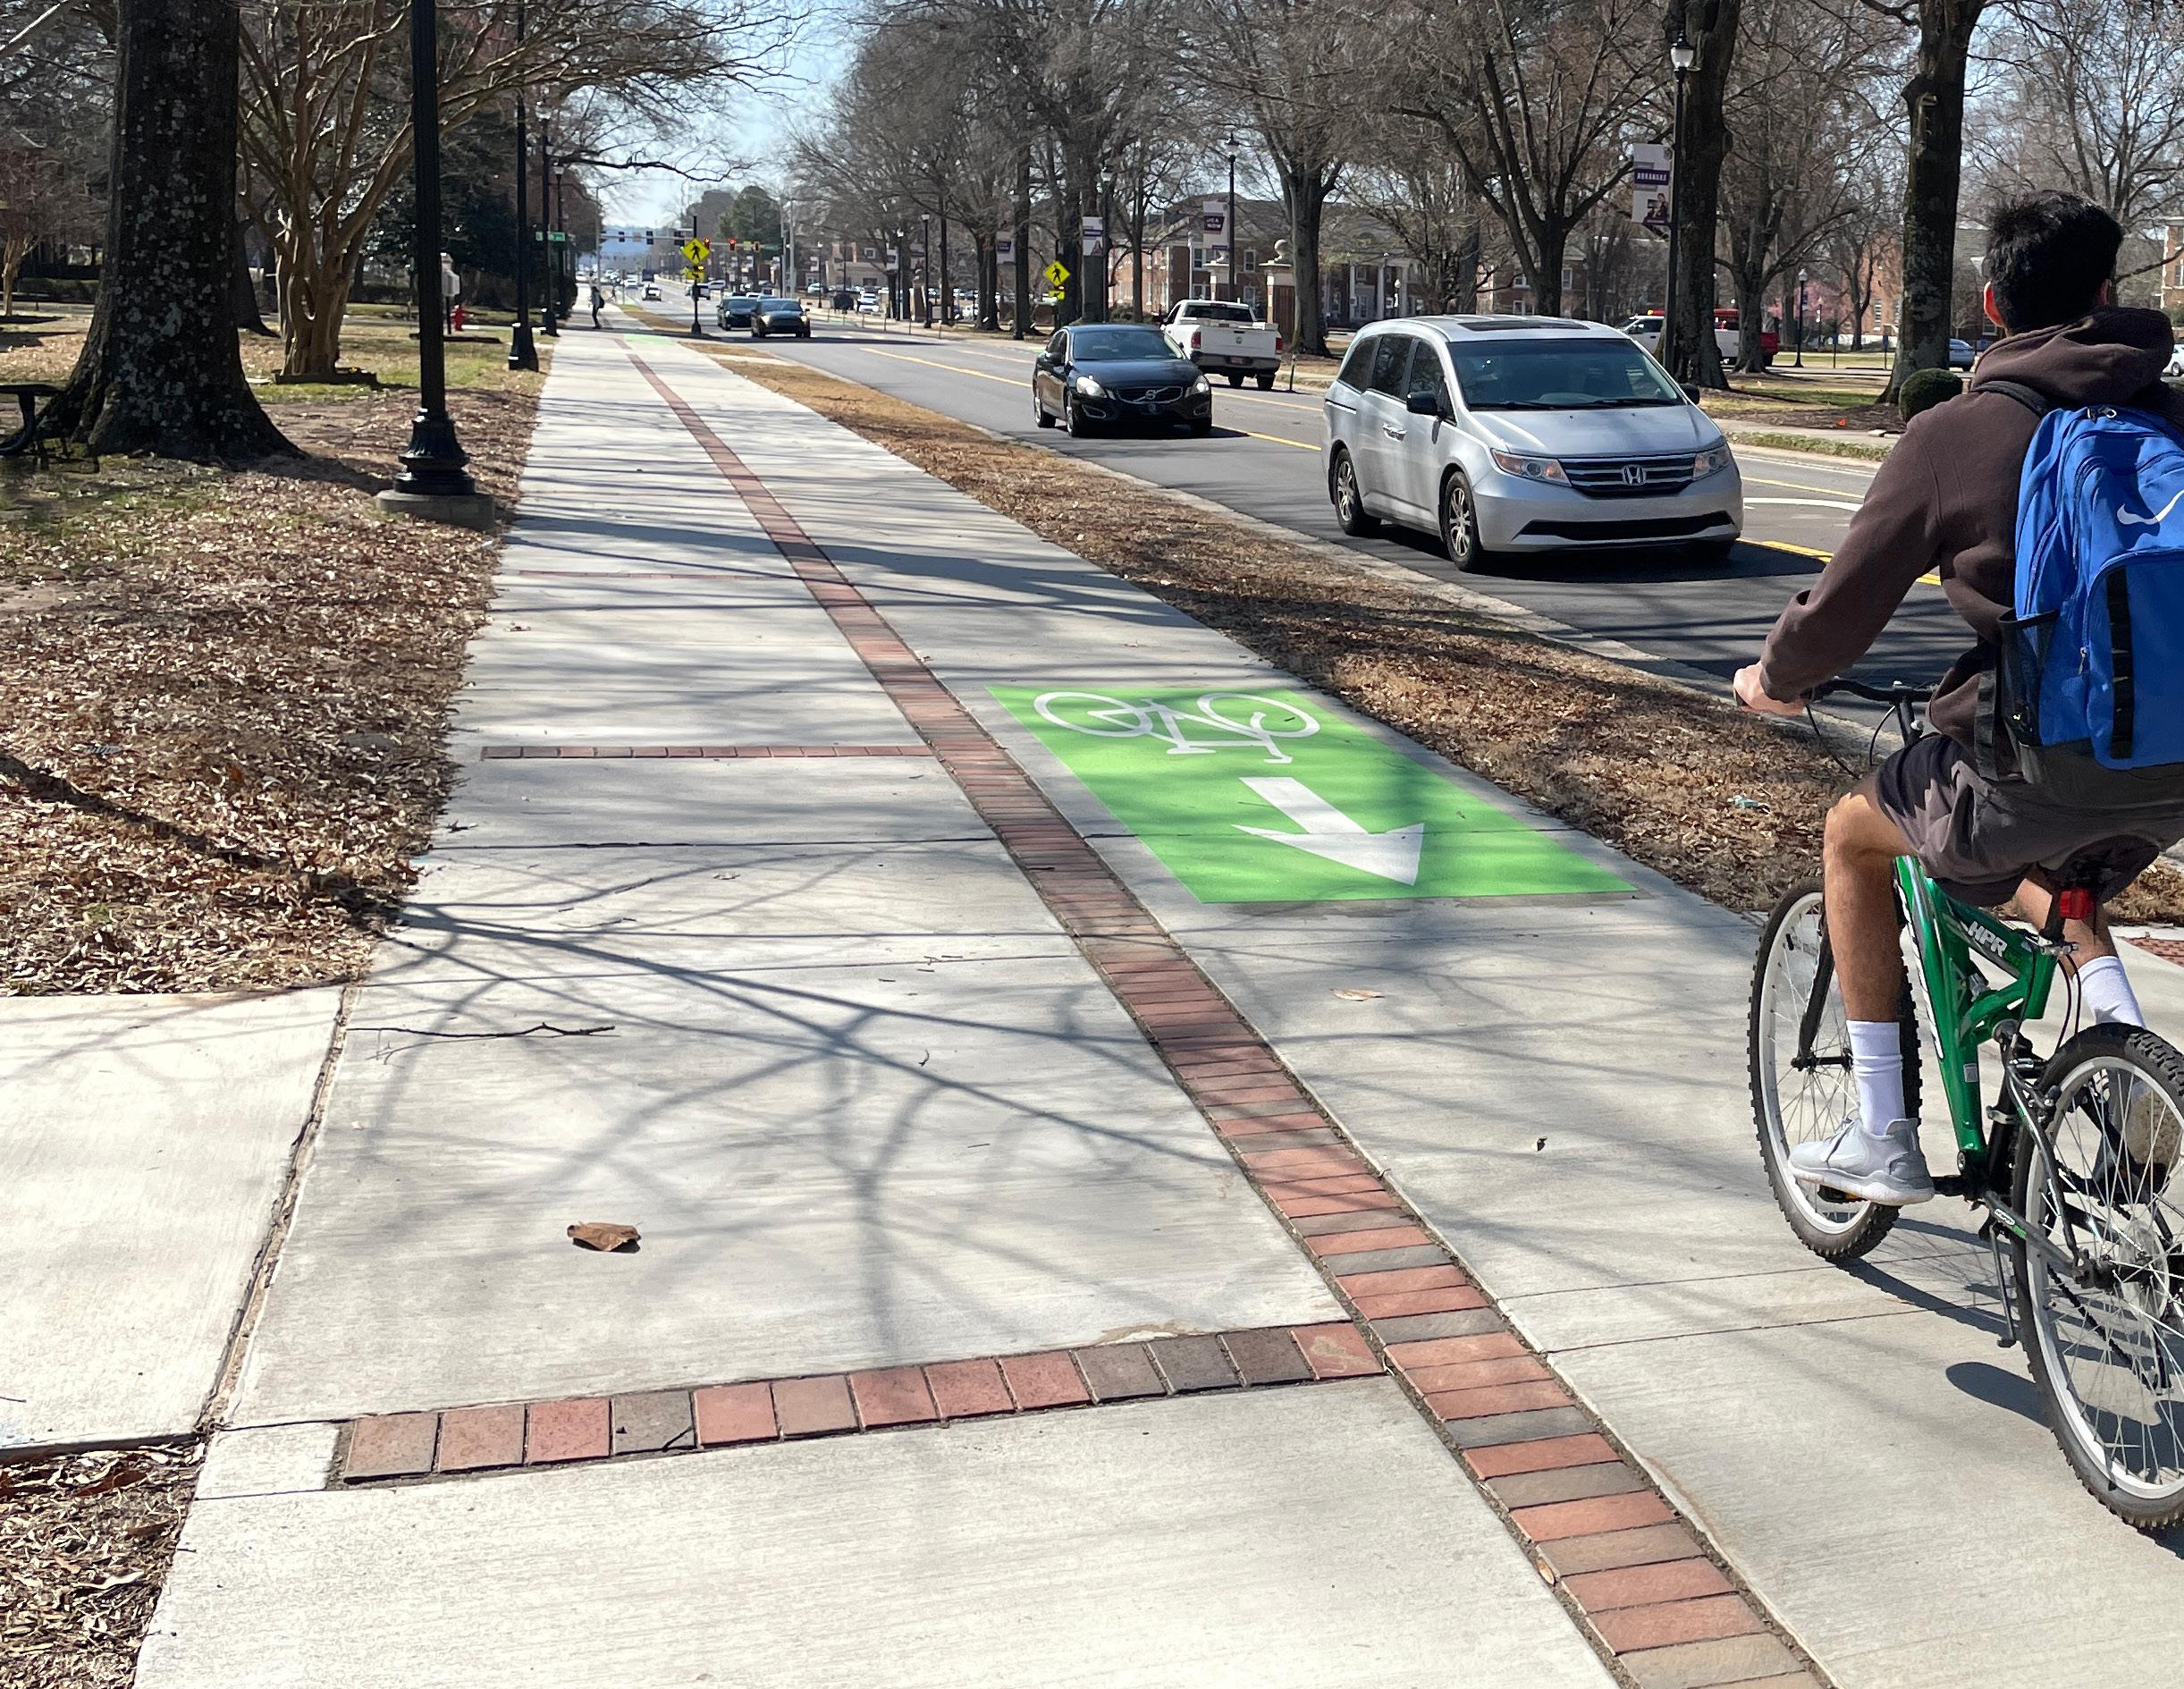
Central Arkansas’ Safety Action Plan recognizes that people walking or biking on our streets and roads are more vulnerable than those in automobiles. While the plan is focused on eliminating all fatal and serious injury crashes, priority is given to supporting safety for our most vulnerable road users that we know face a much higher fatal and serious injury rate when involved in a crash.


The Safe System Approach is the foundation that will support the Region in achieving its goal of reaching zero fatal and serious injury crashes on Central Arkansas streets and roads. As part of its National Roadway Safety Strategy released in January 2022, USDOT adopted the Safe System Approach as its guiding paradigm to address roadway safety challenges nationwide. This approach acknowledges both human mistakes and human vulnerability and is designed to protect all roadway users.
The Safe System Approach is built around the following six principles.
y Death and Serious Injuries are Unacceptable. The Safe System Approach prioritizes the elimination of crashes that result in death and serious injuries on roadways.
y Humans Make Mistakes. People will inevitably make mistakes and decisions that can lead or contribute to crashes, but the transportation system can be designed and operated to accommodate certain types and levels of human mistakes, and avoid death and serious injuries when a crash occurs.
y Humans are Vulnerable. People have physical limits for tolerating crash forces before death or serious injury occurs; therefore, it is critical to design and operate a transportation system that is human-centric and accommodates physical human vulnerabilities.
y Responsibility is Shared. All stakeholders – including government at all levels, industry, nonprofit/advocacy, researchers, and the public – are vital to preventing
fatalities and serious injuries on our roadways.
y Safety is Proactive. Proactive tools should be used to identify and address safety issues in the transportation system, rather than waiting for crashes to occur and reacting afterwards.
y Redundancy is Crucial. Reducing risks requires that all parts of the transportation system be strengthened, so that if one part fails, the other parts still protect people.
There are five objectives of a Safe System Approach: safer road users, safer vehicles, safer roads, safer speeds, and post-crash care. To achieve zero fatal and serious injury crashes, all five of these objectives must be strengthened. Strengthening all objectives allows for redundant layers of protection against fatal and serious injuries on the roadway. The Central Arkansas Safety Action Plan was developed to strengthen the five Safe System objectives defined below by the National Roadway Strategy.
y Safer People. Encourage safe, responsible behavior by people who use our roads and create conditions that prioritize their ability to reach their destination unharmed.
y Safer Roads. Design roadway environments to mitigate human mistakes and account for injury tolerances, to encourage safer behaviors, and to facilitate safe travel by the most vulnerable users.
y Safer Vehicles. Expand the availability of
vehicle systems and features that help to prevent crashes and minimize the impact of crashes on both occupants and nonoccupants.
y Safer Speeds. Promote safer speeds in all roadway environments through a combination of thoughtful, contextappropriate roadway design, targeted education and outreach campaigns, and enforcement.
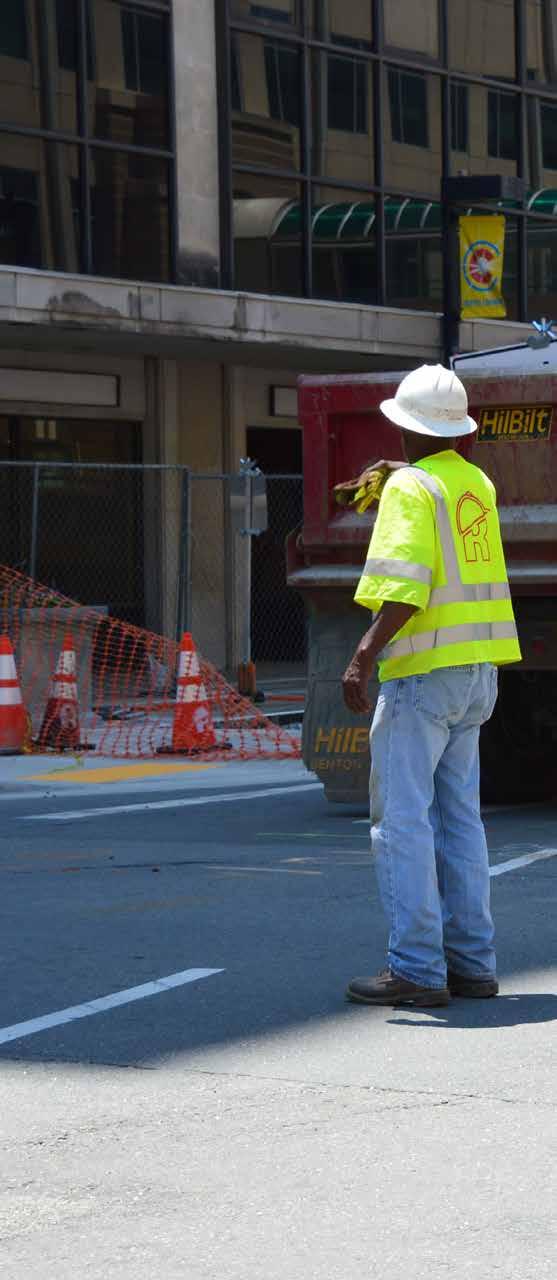
y Post-Crash Care. Enhance the survivability of crashes through expedient access to emergency medical care, while creating a safe working environment for vital first responders and preventing secondary crashes through robust traffic incident management practices.
The Central Arkansas Safety Action Plan was developed to give the Region a holistic and well-defined strategy to achieve the goal of zero fatal and serious injury crashes. The plan was driven by data and closely analyzed crash data from 2018 through 2022. Through analysis, guided by the USDOT’s National Roadway Safety Strategy, a high injury network was established for the Region. The high injury network identifies intersections and one-mile segments within the Region’s roadway network that have the highest number of fatal and serious injury crashes. Establishing a high injury network focuses safety improvement efforts onto road segments and intersections that are historically causing the most harm to roadway users, thereby guiding future project implementation and safety efforts. Extensive public engagement was performed with the goal of identifying areas of roadway safety concern within the community that could also be incorporated into the plan’s priorities. As part of this effort, underserved communities were identified and prioritized. This safety analysis, public input, and equity assessment process helped establish and prioritize locations where the use of safety countermeasures can be most effectively implemented to reduce fatal and serious injury crashes. System improvements, which are improvements that can be widely implemented based on high-risk feature that are correlated with particular types of crashes, were also identified for the Region. To encourage continued investment in safety improvements, safe design, and safe operation of the system, the Safety Action Plan also recommends polices that can be implemented to influence safer streets and roads.
The Safety Action Plan was adopted by the Metroplan Board of Directors on November 20, 2024. Metroplan’s Board of Directors were updated monthly throughout the development of Safety Action Plan and provided input to the team through both the Board of Director’s meetings as well as through two workshops with the Board to seek additional input Agencies represented on Metroplan’s Board of Directors are identified in the beginning of this Safety Action Plan.
The Safety Action Plan Advisory Committee (SAPAC) was established and tasked with guiding the development of the Central Arkansas Safety Action Plan. The SAPAC represents a variety of voices from within the Central Arkansas Region that collaborated to form the Safety Action Plan. In addition to member agencies from Metroplan, the SAPAC included representatives from America Walks, Metropolitan Emergency Medical Services, and the Arkansas Highway Safety Office. The full list of representatives and agencies that participated on the SAPAC is included at the beginning of this Safety Action Plan. SAPAC members met monthly through both in-person and virtual meetings and provided continual advice, guidance, and support for the development of Central Arkansas Safety Action Plan.

The Safety Action Plan Advisory Committee (SAPAC) was established and tasked with the guiding the development of the Central Arkansas Safety Action Plan.
The Central Arkansas Safety Action Plan uses a data driven approach to identify roadway safety problem areas within the four-county Central Arkansas Region. The most recent five years of crash data, 2018 through 2022, available during the plan development was analyzed. The results of the safety analysis were used to support public engagement efforts and serve as a basis for the project recommendations, policy, and process improvement recommendations that are identified in this Safety Action Plan.
A regional systemic safety analysis was performed by analyzing focus areas identified in the Strategic Highway Safety Plan. Focus areas were prioritized within the Region as a whole and within each county in the Region: Faulkner County, Lonoke County, Pulaski County, and Saline County. The analysis also included a comparison of Central Arkansas’ urban areas and rural areas using crash rates to better understand the unique challenges faced by different parts of the Region.
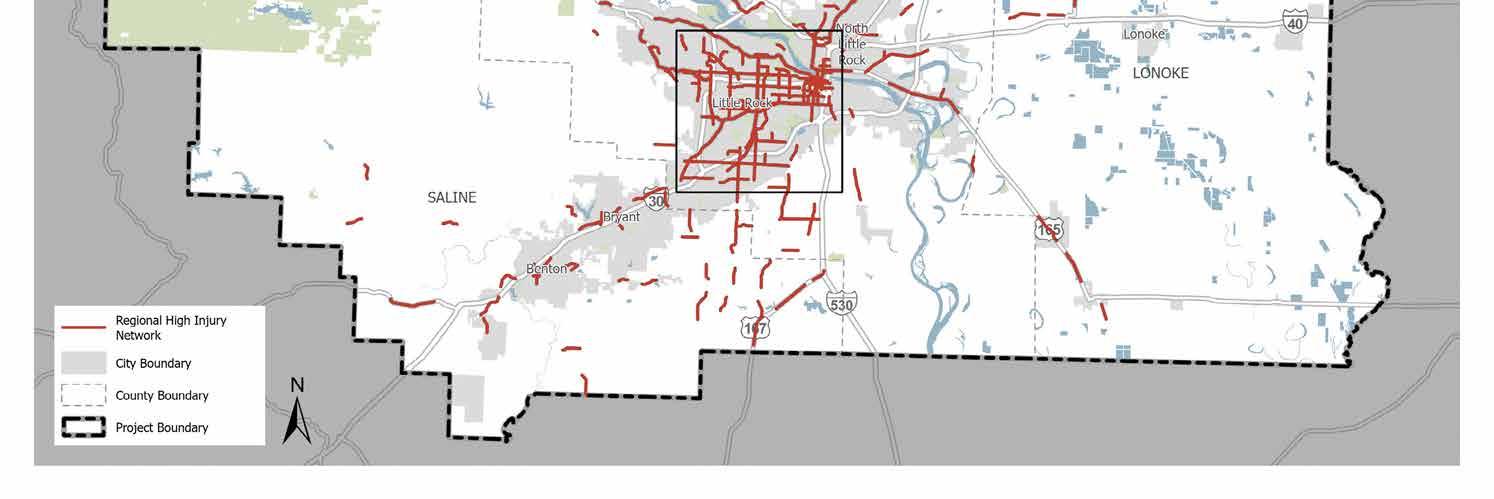
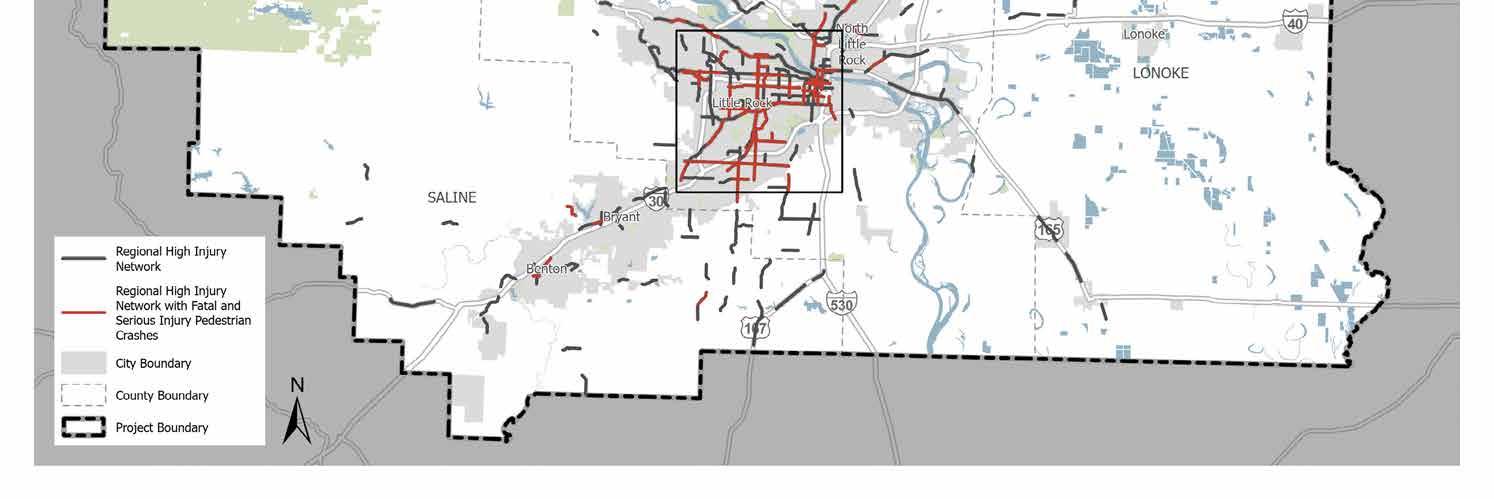
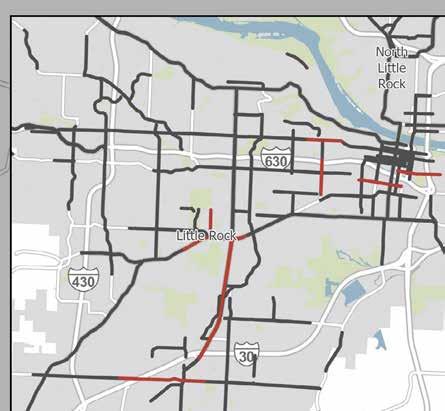
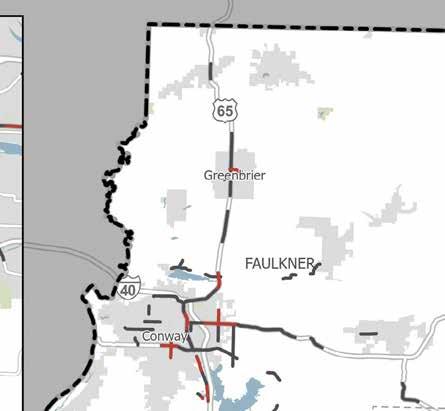
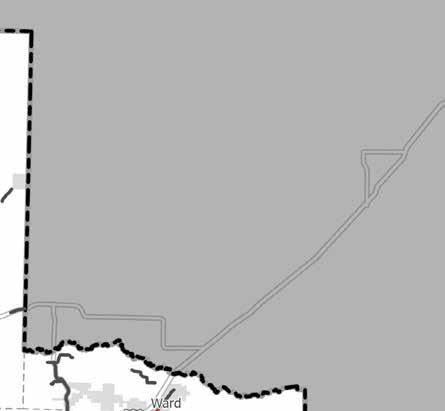
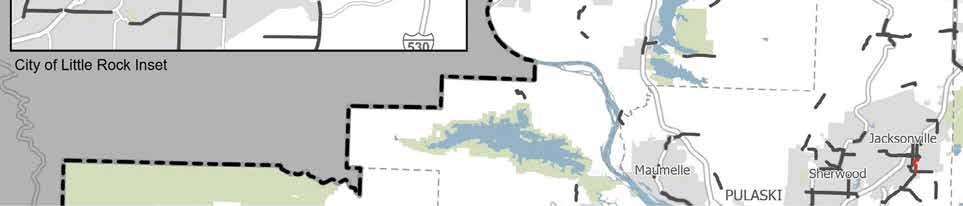
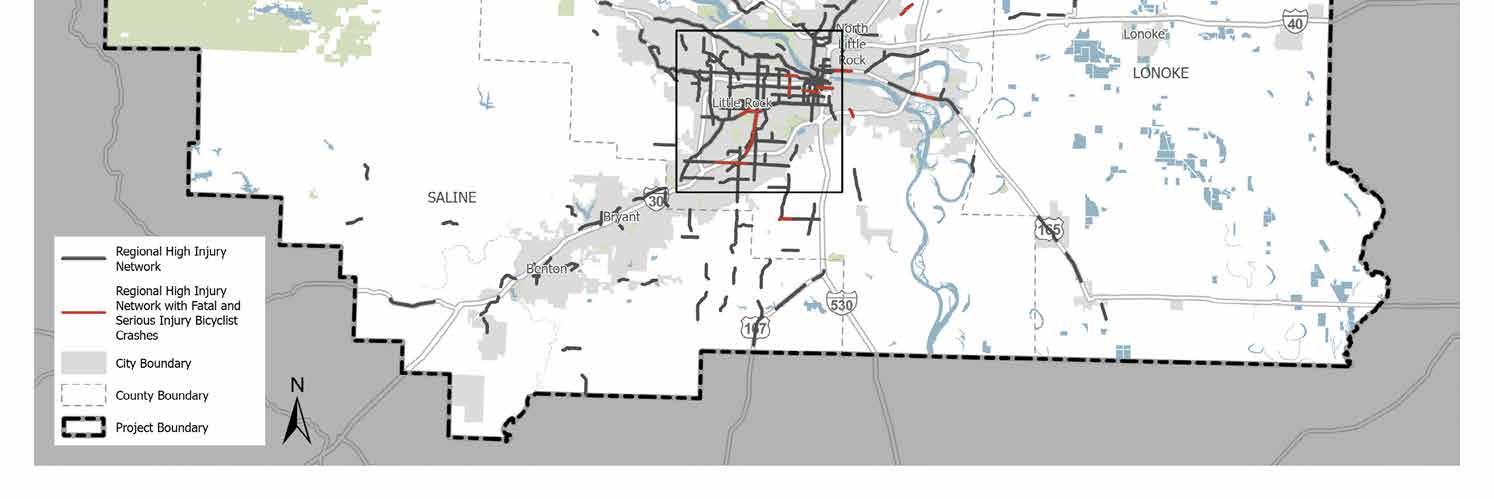
In addition to identifying crash trends within the Region, it is also important to know where fatal and serious injury crashes are happening. With crash data from 2018 through 2022, a Regional High Injury Network (HIN) was established. The HIN identifies road segments and intersections on which the most fatal and serious injury crashes have occurred over the last five years. The HIN represents a small percentage of the roadway network but encompasses a large number of fatal and serious injury crashes. Pedestrian and bicycle historic crash data and USDOT national equity data was overlayed on the HIN to further analyze characteristics of the road segments that make up the HIN.
Safety is not new to Central Arkansas. Over the past decades, Metroplan and its member agencies have spent time and resources studying and investing in safety improvements. But more is still needed to make significant progress towards achieving zero fatal and serious injury crashes. A summary of some of the existing plans and policies that have been developed in the region are included below. Recommendations for additional plans and policies are included in the Recommendations Section.
Within Central Arkansas many of the agencies have focused planning efforts on improving safety. These include targeted studies and plans in high crash hot spot areas as well as regional and statewide plans that look how to improve safety throughout the network. Some of the key plans whose contents informed the development of the Central Arkansas Roadway Safety Action Plan are listed below.
y Central Arkansas Transforming Mobility, 2024
y Central Arkansas Regional Greenways Plan, 2023
y Central Arkansas Multimodal Infrastructure Guidelines, 2022
y ARDOT Strategic Highway Safety Plan, 2022
y Arkansas Bicycle and Pedestrian Plan, 2017
is an initiative to provide streets that are safe and feel safe for all road users.
Within the Central Arkansas Region, distracted driving is the second leading cause of fatal and serious injury crashes based on crash data from 2018 to 2022. Texting while driving was first banned in 2009 when the State of Arkansas passed a law to prohibit this. Since then, the State has strengthened this law to prohibit all road users from holding a cellular device while driving, except in a case of emergency.
Move Over Laws require motor vehicle operators to, when possible, move into the furthest lane from emergency response vehicles or law enforcement vehicles that are parked or stopped at the scene of an emergency. Within Arkansas, it is the law to move over to the farthest possible lane away from emergency response vehicles and if it is not possible to move over safely, drivers should slow down.
The National Highway Traffic Safety Administration (NHTSA) states that a motorcyclist that is not wearing a helmet is 40 percent more likely to suffer a fatal head injury than a helmeted motorcyclist. Arkansas law states that everyone on a motorcycle under the age of 21 must wear a helmet. However, there is currently no law within the State that requires motorcycle helmets for drivers over the age of 21. A law requiring helmet use for all riders could reduce fatal and serious injury motorcycle crashes in Central Arkansas.
In Arkansas, all drivers and passengers located in the front seat of a motor vehicle are required to wear a seat belt at all times. This applies to both adults and children. Additionally, all children under the age of 15 must wear a seat belt regardless of their location in the motor vehicle. However, Arkansas law does not currently require adults to wear seat belts when located in the back seat of a motor vehicle. A majority of states now require all passengers to wear a seatbelt which can reduce fatal and serious injuries.
Complete Streets is an initiative to provide streets that are safe and feel safe for all road users. Streets are designed and operated to enable safe use and support mobility for all users. That include people of all ages and abilities, regardless of mode of travel, such as vehicle, pedestrian, bicyclists, or public transit. Metroplan has developed the Multimodal Infrastructure Guidelines that address components of complete streets and the City of Conway, City of Little Rock, and City of North Little Rock each have plans
or policy related to complete streets in their cities.
Complete Communities is an urban and rural planning concept that aims to meet the basic needs of all residents within a community. In 2012, the City of North Little Rock formed a Complete Communities Committee to assess walkability and move North Little Rock towards better connected, walk-friendly neighborhoods. North Little Rock prioritizes the walkability within the City by maintaining sidewalks, increasing the ability to walk to schools, and implementing pedestrian friendly signal timing.
The League of American Bicyclists developed the Bike Friendly Community program to evaluate how communities, businesses, and universities accommodate bicyclists. The evaluation process considers equity and accessibility, engineering of safe and convenient bike facilities, education on how to ride safely, encouragement to develop a strong bike culture, and evaluation and planning for future bikeways. The cities of Little Rock and North Little Rock have received Bronze status for being bicycle friendly. The University of Central Arkansas and Hendrix College have both received Bronze status, while the City of Conway, where both universities are located, has received Silver status.
A comprehensive crash analysis was conducted to identify factors contributing to fatal and serious injury crashes within the Central Arkansas Region. This analysis
allowed the team to identify patterns and trends in crash data, such as focus areas or specific types of crashes that occur frequently. Factors such as speeding, distracted driving, impaired driving, and intersection related crashes were analyzed to understand their impact on the Region.
Additionally, the crash analysis viewed crash trends in urban versus rural areas within the Central Arkansas Region to identify any variations in crash rates and contributing
factors. A region-to-region comparison was also performed to assess crash trends in Central Arkansas with Northwest Arkansas.
By understanding these crash trends, contributing factors were identified and targeted with safety countermeasures to reduce fatal and serious injury crashes.
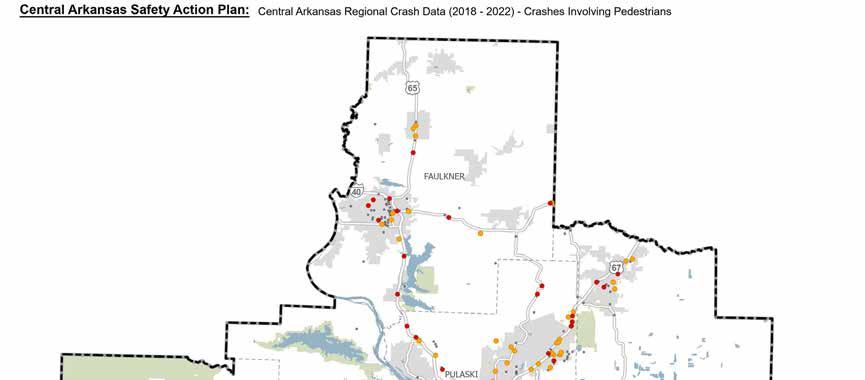
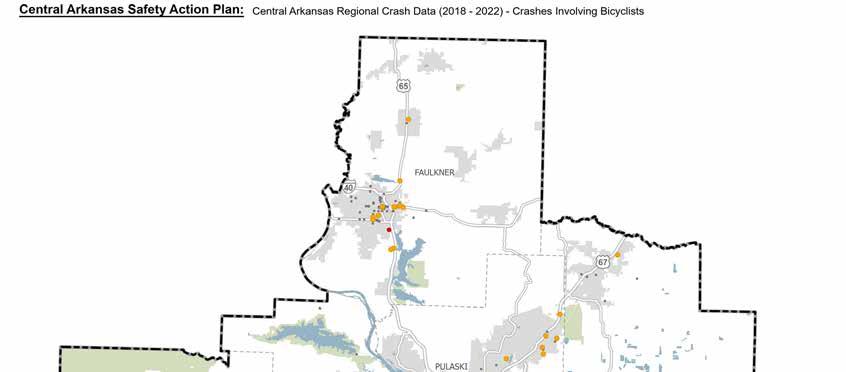
Pedestrian crash data includes crashes that involved any persons traveling on their feet or on a human-powered, nonmotorized device not propelled by pedaling, such as a wheelchair, skateboard, and roller skates. Arkansas crash reports use the term ‘pedalcycle’ to identify crashes that involved persons riding non-motorized devices that are propelled by pedaling, such as bicycles, tricycles, and unicycles. For simplicity, this Plan will refer to pedalcycle crashes as bicycle crashes.
The Arkansas Strategic Highway Safety Plan (SHSP) identifies focus areas of safety for the State. The focus areas identified by the SHSP are crash types and factors that are prominent within the State and often lead to fatal and serious injury crashes. The following nine focus areas identified by the Arkansas SHSP were analyzed in the Central Arkansas Safety Action Plan:
y Impaired Driving – This focus area addresses crashes involving drivers under the influence of alcohol, drugs, or medication.
y Distracted Driving – This focus area addresses crashes related to drivers operating a motor vehicle while taking their eyes off the road, hands off the wheel, or mind off of driving.
y Non-motorist – This focus area includes crashes involving pedestrians, bicyclists, or other vulnerable road users that are not in a motor vehicle.
y Commercial Motor Vehicles (CMV) – This
focus area addresses crashes that involve motor vehicles with a gross combination weight of 26,001 pounds or more.
y Motorcycles – This focus area addresses crashes that involve two or three wheeled vehicles with a seat for the rider.
y RoadwayDepartures – This focus area addresses crashes that occur when a vehicle crosses an edge line or a center line, leaving their travel lane.
y Intersections – This focus area involves crashes that occur at an intersection where two roads cross each other.
y AggressiveDriving – This focus area addresses crashes that involve racing, exceeding the speed limit, and driving too fast for roadway conditions.
y SecondaryCrashes – This focus area identifies crashes that occurred within the impact area of the preceding crash and may contribute to increased congestion.
Crash data from 2018 through 2022 was filtered to analyze crashes related to the SHSP focus areas. A summary of the crash
data over the last five years for fatal and serious injury crashes within the Central Arkansas Region for each of the SHSP focus areas is provided in Table 1.
Fatal and Serious Injury Crashes by Arkansas SHSP Focus Area
ImpairedDrivingDistractedDrivingNon-Motorist
The SHSP focus areas with the highest number of fatal and serious injury crashes were more closely reviewed. Intersections and distracted driving were the top two focus areas in the Region based on fatal and serious injury crashes and both have seen a sharp increase over the past five years. The other three areas, while higher in 2022 than in 2018, have generally leveled off the past three years. However, the five-year trend for each is concerning when considering the Region’s goal to reduce fatal and serious injury crashes 40% by 2040 and eventually get to zero. The Region needs to continue to make safety a priority and invest in both targeted and systemic countermeasures that can address these areas and begin a trend downward.
To investigate crash types that are more common in urban or rural portions of Central Arkansas, crash rates, in crashes per 100 million vehicle miles traveled (VMT), were calculated. VMT measures the amount of travel for all vehicles in a geographic region over one year. Crash rates were calculated for each SHSP focus area in both urban and rural areas. Intersections and distracted driving crashes were the top two focus areas for both urban and rural areas. Non-motorist crashes were the third highest in urban areas while roadway departures were the third highest in rural areas.
Based on the crash rate analysis that compared the Central Arkansas Region and the Northwest Arkansas Region, two focus areas were higher within the Central Arkansas Region, intersection related and non-motorist crashes. Intersection-related crashes refer to accidents that occur at intersections, such as collisions between vehicles entering or crossing the intersection, failure to yield right of way, or running red lights or stop signs. These types of crashes can be influenced by factors such as traffic congestion, inadequate intersection design, or driver behavior. Non-motorist crashes, on the other hand, involve pedestrians, bicyclists, or other individuals who are not in motor vehicles. These types of crashes can occur due to a variety of reasons, including lack of pedestrian infrastructure, driver negligence, or failure to yield to non-motorists.
The higher crash rates in these two focus areas in the Central Arkansas Region suggest that there may be specific challenges or issues related to intersection safety and the protection of non-motorists in that Region. It
is important for transportation planners and authorities to analyze the underlying causes of these crashes and implement appropriate measures to improve safety for both motorists and non-motorists in the Central Arkansas Region.
Three Highest Arkansas SHSP Focus Area Crash Rates in Rural Areas
Non-Motorist Crash Rates in Central Arkansas and Northwest Arkansas
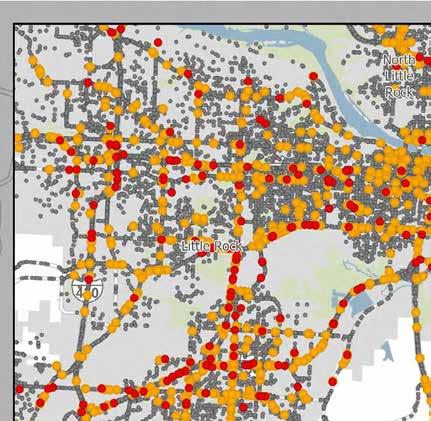
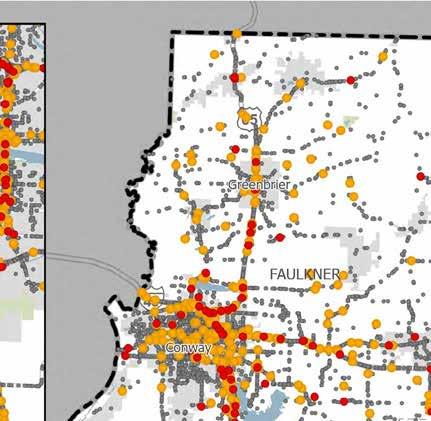
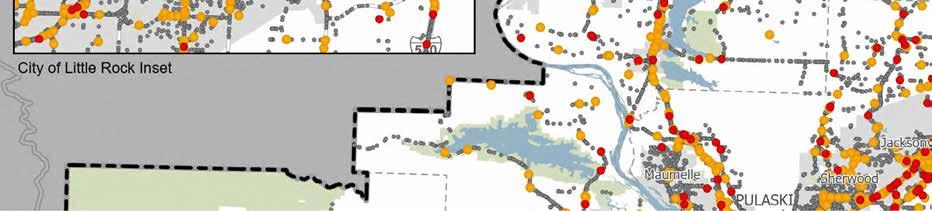
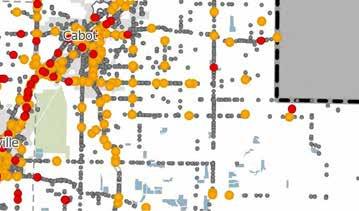
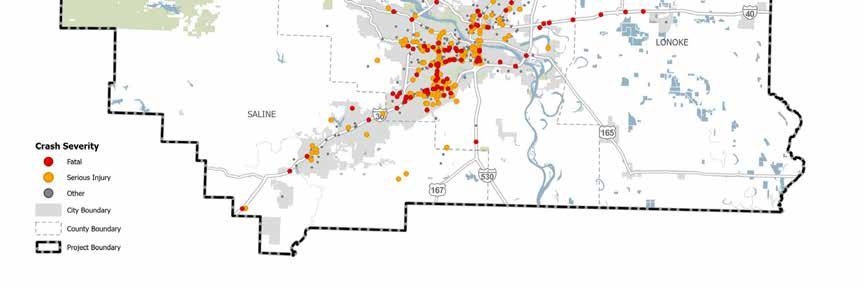
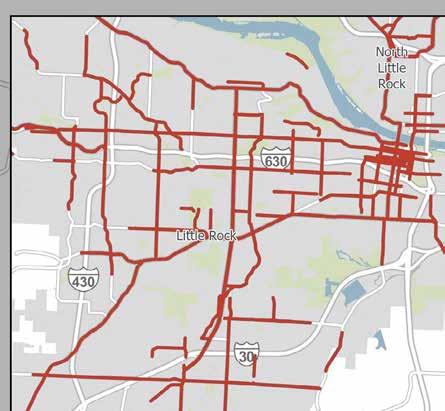
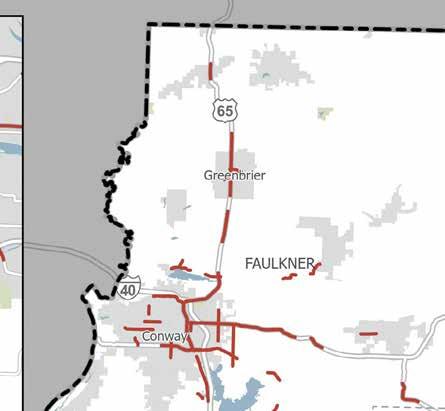
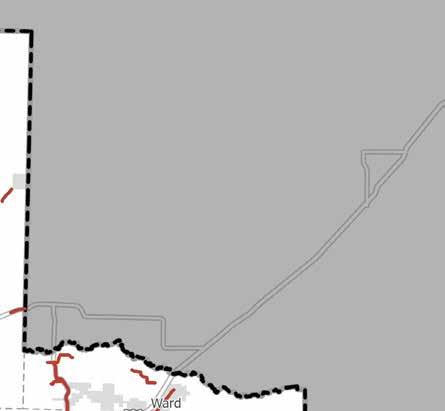
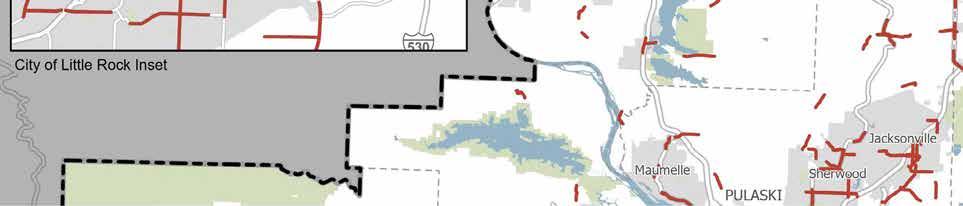
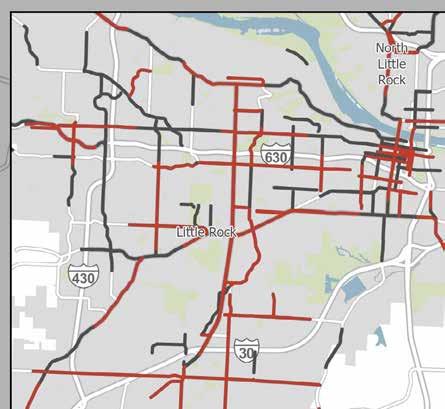
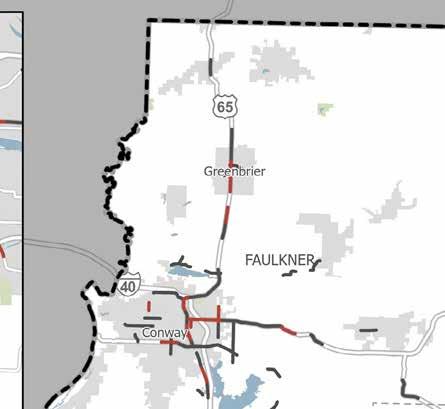
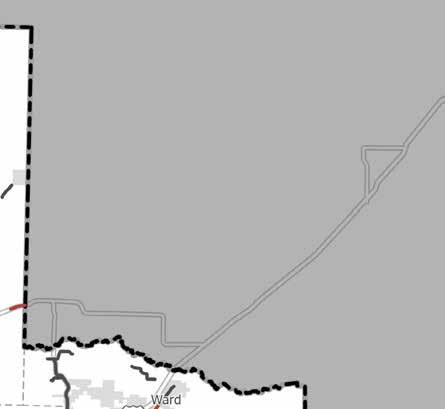
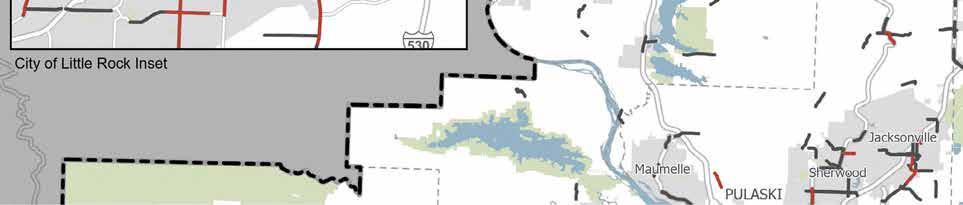
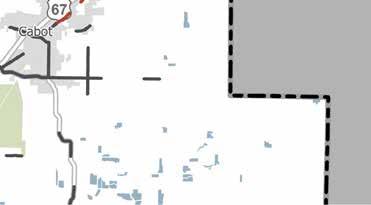
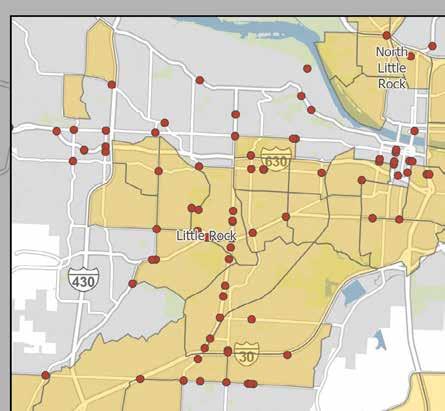
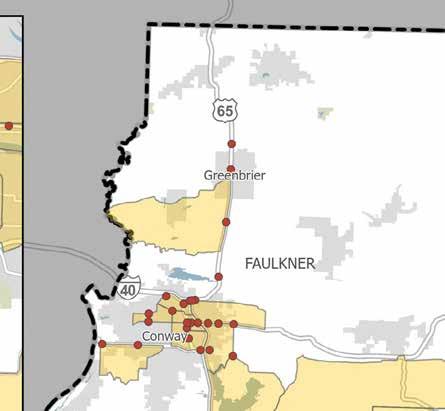
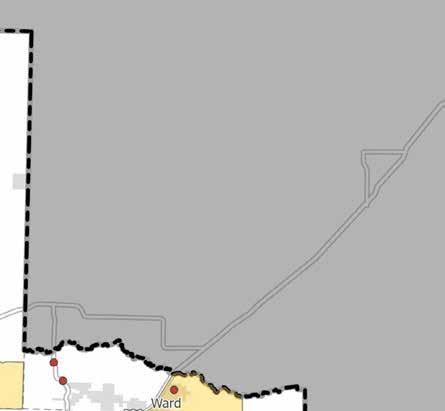
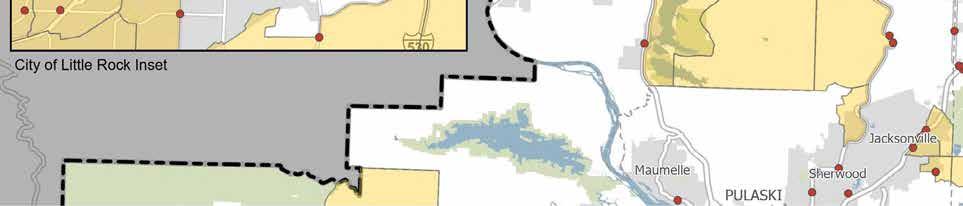
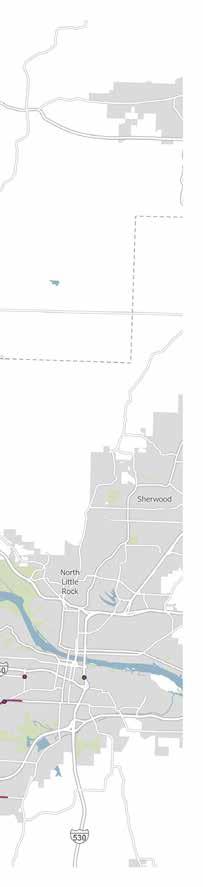
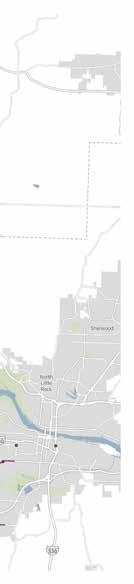
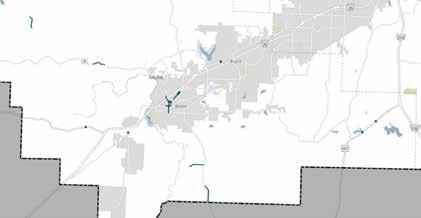
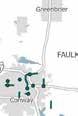
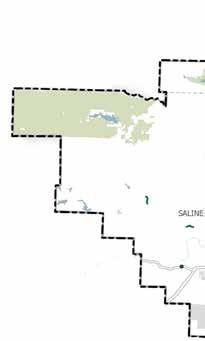
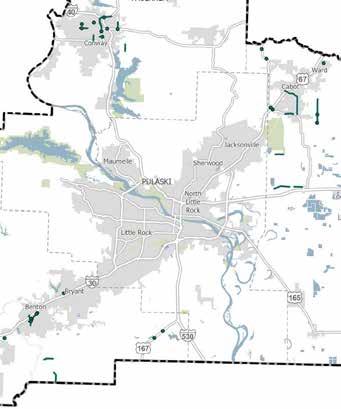
A key component of the Central Arkansas Safety Action Plan is identifying a Regional High Injury Network (HIN). The HIN shown in Figure 4 is made up of one-mile segments with a high frequency of fatal and serious injury crashes. Segments on the HIN are the most common focus for targeted safety countermeasures, projects, and strategies to achieve the goal of 40 percent reduction in fatal and serious injury crashes. The Central Arkansas HIN consists of about 19 percent of the functionally classed roadway miles within the Central Arkansas Region that are not interstates, freeways, or expressways. These roadways account for approximately 77 percent of fatal and serious injury crashes that did not occur on interstates, freeways, or expressways from 2018 through 2022.
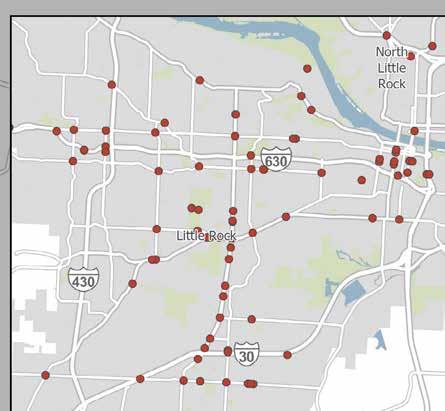
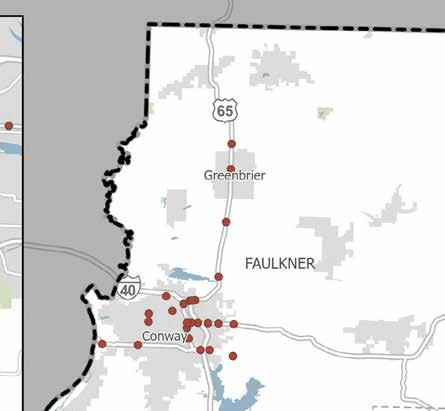
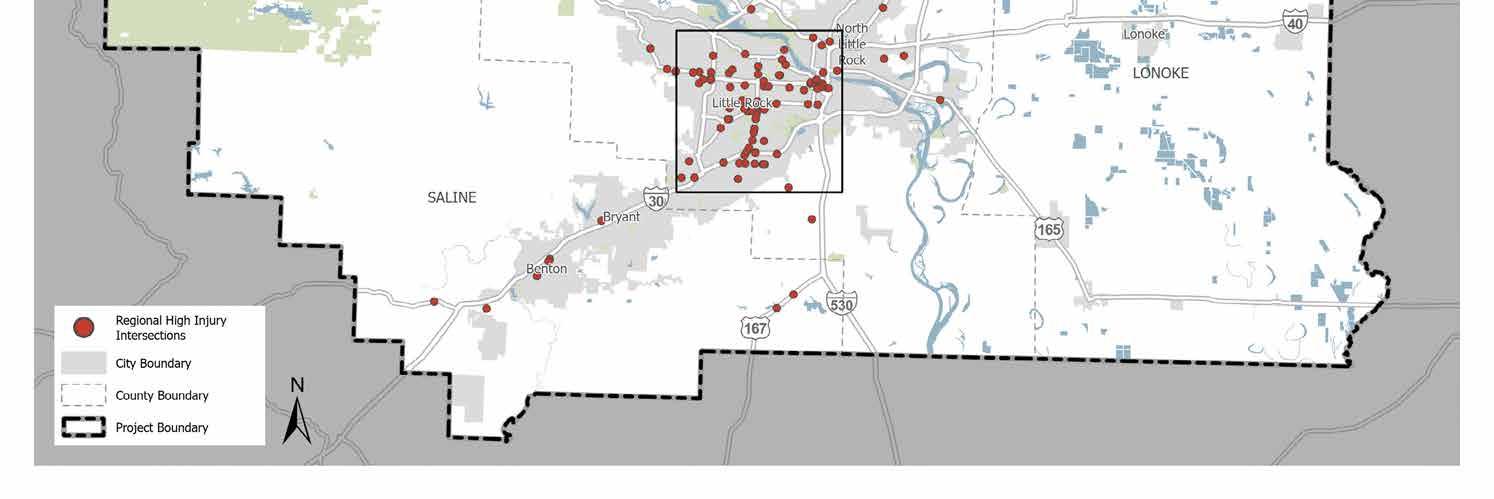
A Regional High Injury Intersection set was also established as part of the Central Arkansas Safety Action Plan, shown in Figure 5. This set is made up of intersections that had at least two fatal and serious injury crashes that occurred within 250 feet of the intersection from 2018 through 2022. The set of High Injury Intersections consists of about seven percent of intersections within Central Arkansas that are not at intersections with interstates, freeways, or expressways. These intersections account for approximately 58 percent of fatal and serious injury crashes that occurred within 250 feet of an intersection from 2018 through 2022.
by 40
Our Goal: 40% reduction in fatal and serious injury crashes by 2040


The Regional High Injury Network contains about 55 percent of all reported fatal and serious injury crashes involving pedestrians that occurred within the Central Arkansas Region from 2018 through 2022.
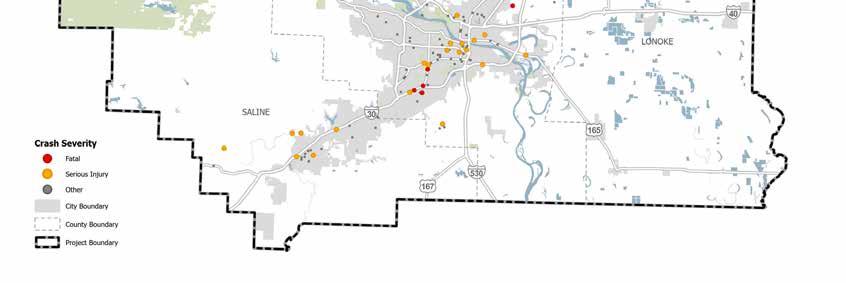
The Safe System Approach is focused on the safety of all road users. To account for crashes involving non-motorized modes of transportation, fatal and serious injury crashes that involved a pedestrian or a bicycle from 2018 through 2022 were overlayed onto the Regional HIN and Regional High Injury Intersection data sets, shown in Figure 6 and Figure 7.


The Regional HIN contains about 55 percent of all reported fatal and serious injury crashes involving pedestrians that occurred within the Central Arkansas Region from 2018 through 2022. Forty percent of the HIN contains one or more fatal and serious injury crashes involving a pedestrian. The Regional HIN contains about 65 percent of all reported fatal and serious injury crashes involving bicycles within the Central Arkansas Region from 2018 through 2022. Sixteen percent of Regional HIN contains one or more fatal and serious injury crashes involving bicycles. The Regional High Injury Intersections contains about 19 percent of all reported fatal and serious injury crashes involving a pedestrian within 250 feet of an intersection in the Central Arkansas Region from 2018 through 2022. Twenty nine percent of the Regional High Injury Intersections contains one or more fatal and serious injury crashes involving a pedestrian. The Regional High Injury Intersections contains about 17 percent of all reported fatal and serious injury crashes involving bicycles within 250 feet of an intersection in the Central Arkansas Region from 2018 through 2022. Eight Regional High Injury Intersections contain one or more fatal and serious injury crashes involving bicycles.


The USDOT Equitable Transportation Communities (ETC) national census tract data helps identify historical underinvestment in disadvantaged communities. This information is crucial for understanding the cumulative burden that these communities experience in various areas. The ETC Explorer, maintained by USDOT, is an interactive web application that
allows users to explore disadvantaged census tracts on a national and state level.
The ETC Explorer uses 2020 Census Tracts and data to analyze five components, each of which have numerous factors that make up their score: Transportation Insecurity, Climate and Disaster Risk Burden, Environmental Burden, Health Vulnerability, and Social Vulnerability. By examining these components, the ETC Explorer aims
to shed light on the challenges faced by disadvantaged communities and inform policies and initiatives to address them.
The ETC Explorer is a valuable tool for policymakers, researchers, and community members to gain insights into the specific needs and burdens of different communities. It helps identify areas that require targeted investment and support to promote equity and improve transportation.
The ETC Explorer uses 2020 Census Tracts and data to analyze five components, each of which have numerous factors that make up their score: Transportation Insecurity, Climate and Disaster Risk Burden, Environmental Burden, Health Vulnerability, and Social Vulnerability.

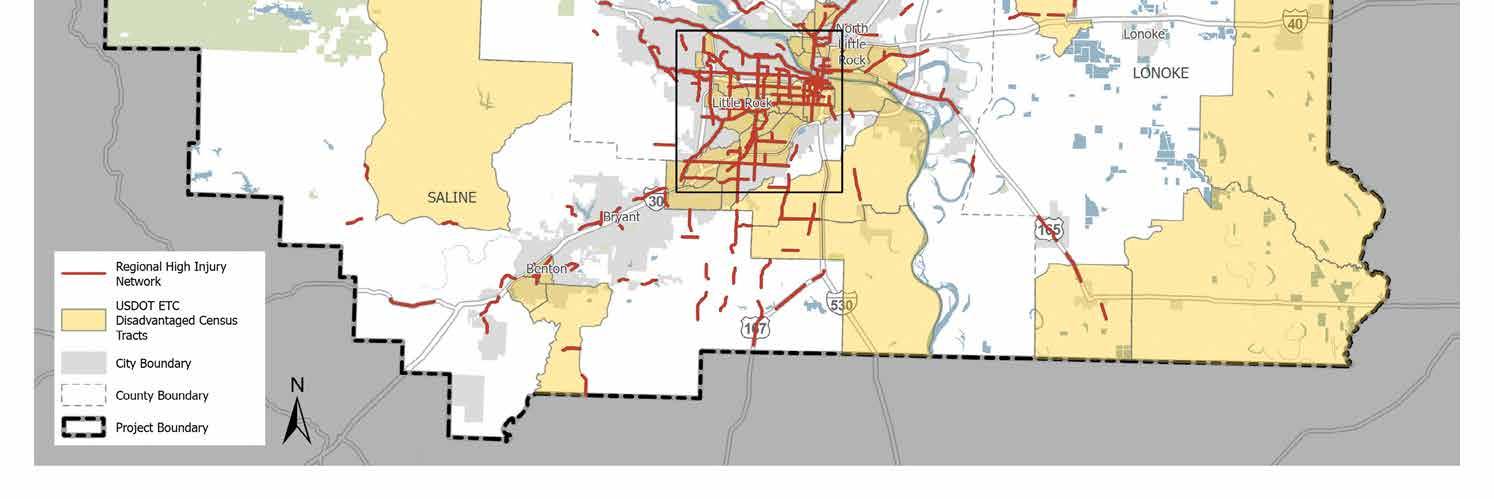
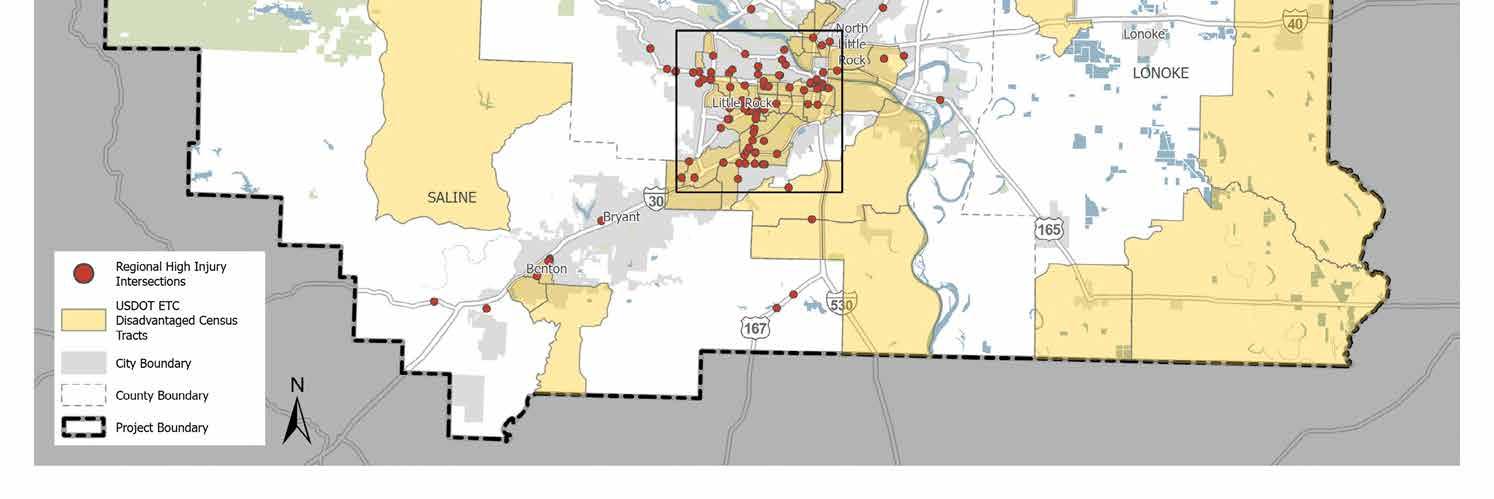
The overlay of disadvantaged census tracts onto the Central Arkansas HIN revealed that 30 percent of the Regional HIN fell within, partially within, or along a disadvantaged census tract, as shown in Figure 8. This information is important as it highlights the connection of transportation safety concerns and communities experiencing historical underinvestment.
Additionally, the disadvantaged census tracts
were used as a factor in scoring segments of the HIN and High Injury Intersections to identify priority locations with the greatest need for safety improvements. This scoring process took into account whether a segment or intersection fell within a disadvantaged census tract and weighed those locations accordingly. By incorporating the disadvantaged census tracts into the scoring process, allows for prioritization in areas that not only have high injury rates

but also align with communities that have historically faced underinvestment. This approach helps ensure that resources are directed towards addressing safety concerns in a manner that promotes equity and supports the needs of disadvantaged communities.


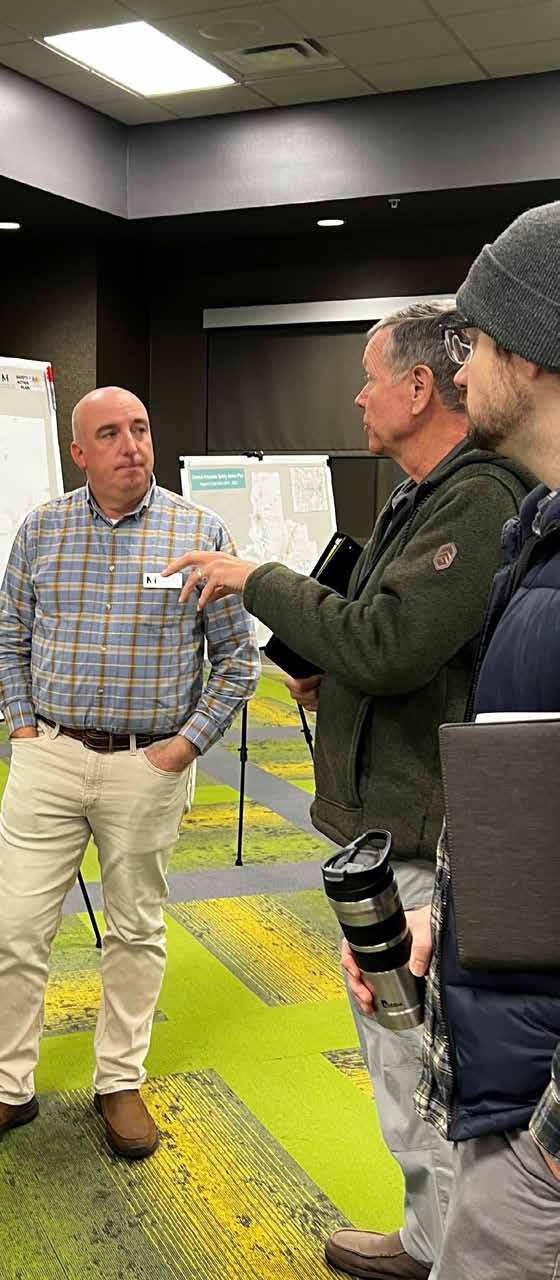
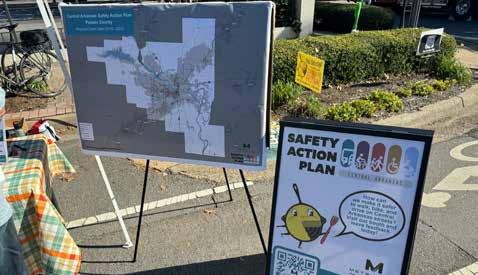
A robust community engagement process is a key component of a Safety Action Plan. In Central Arkansas, a multi-faceted engagement program was implemented, and the results of this engagement process were incorporated into each of the recommended projects. Several engagement methods were used, including both online and in-person public engagement, which consisted of an online survey and an interactive mapping activity, open houses, and booths at community events. The project team also conducted stakeholder engagement, which included workshops with the Metroplan Board, meetings with the SAPAC, and stakeholder walk audits. The following subsections highlight key takeaways and themes heard throughout the engagement process.
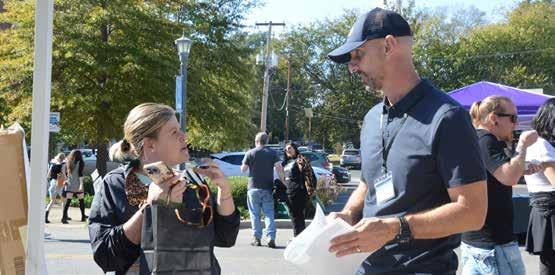
In order to reach as many people as possible in the planning process, several engagement events were held and a variety of platforms were used to gather public feedback and input on the Central Arkansas Safety Action Plan. The project team hosted seven standalone in-person open houses to promote project transparency and discussion and to provide a different way for the public to provide input. The project team also took
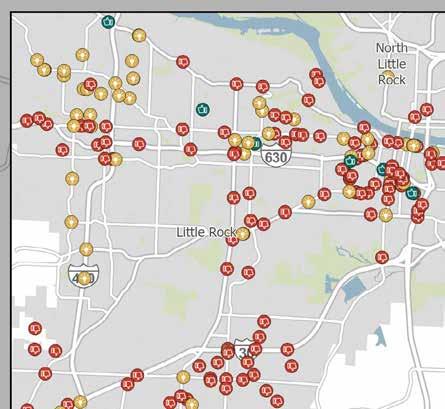
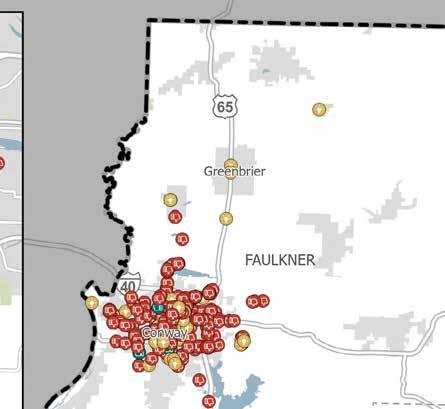
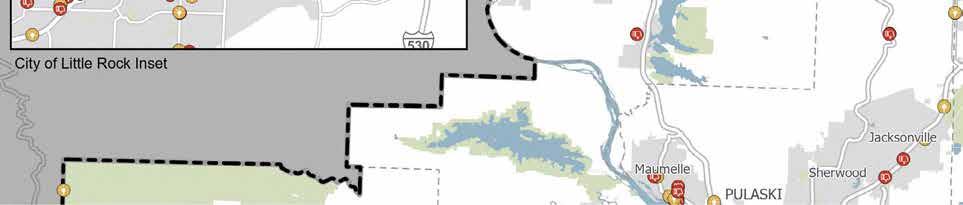
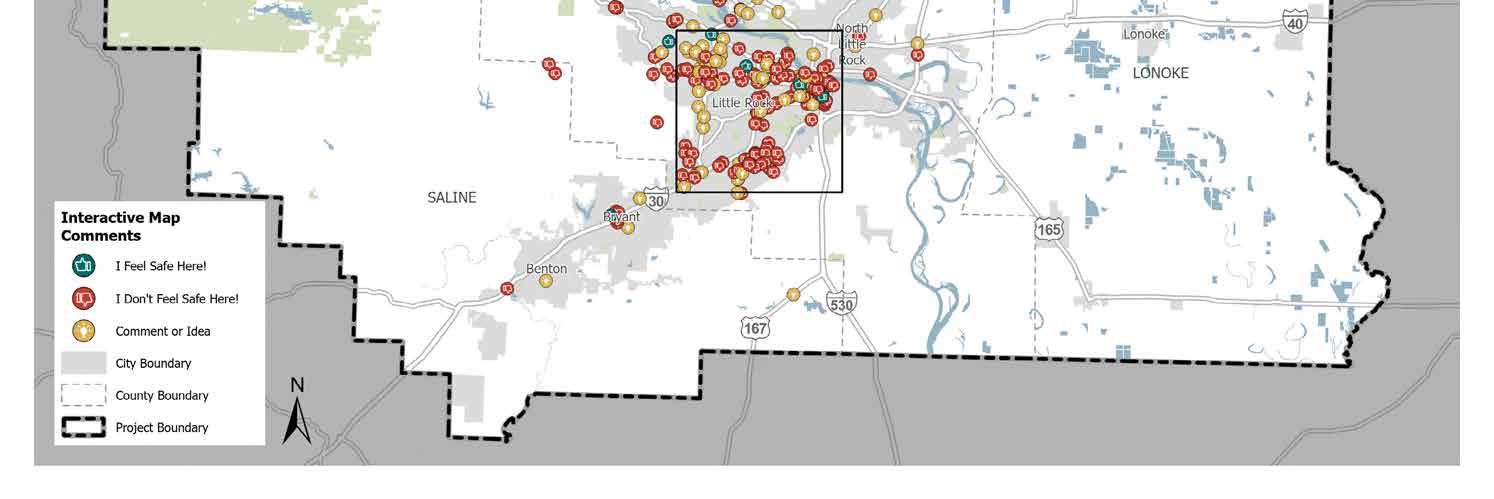
advantage of existing community events and set up a booth at five events, including the North Pulaski Annual Community Fest, Cabotfest, and Benton Jeepers Halloween Treat Fest, to continue to spread awareness of the Central Arkansas Safety Action Plan and collect input from the public. The project team created and maintained a project website with project information and online engagement opportunities consisting of an online survey and an interactive mapping activity. The online mapping activity allowed the public to drop a pin and comment at a particular location, identifying it as a place they feel safe, unsafe, or have an idea. The project team leveraged the media to further spread awareness of the Plan by conducting two radio interviews and publishing multiple press releases and a newspaper article about the efforts and advertising the project website for more information.
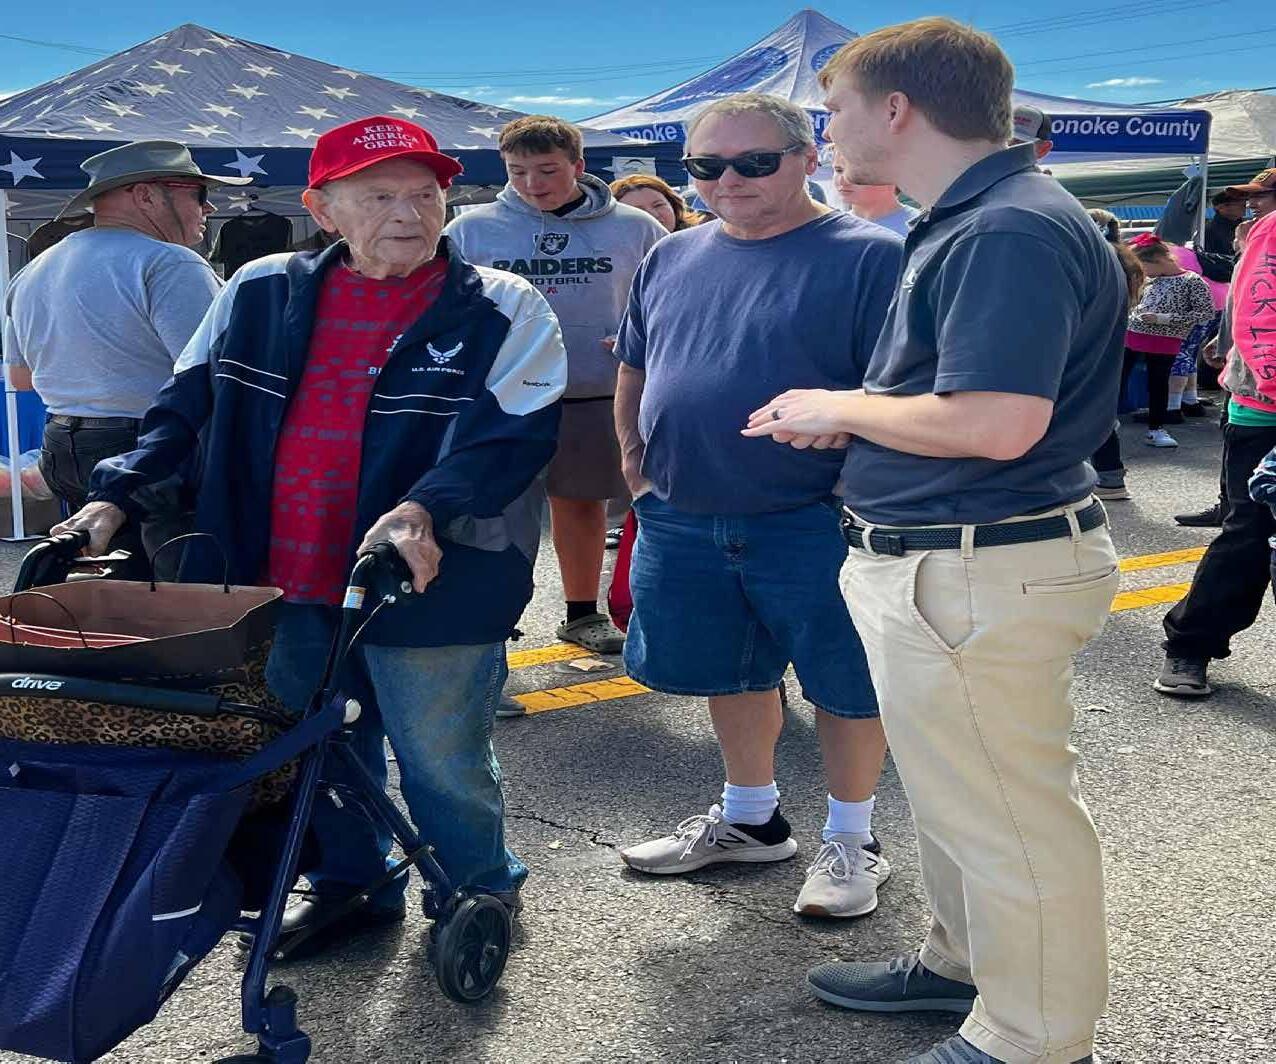
To incorporate and engage Central Arkansas stakeholders in the development of the Safety Action Plan, 12 stakeholder engagements were held to encourage participation in the plan and actively seek ideas and discussion. Engagement events included pop-up events at community festivals, open houses held in conjunction with local city and county meetings, and walk-audits held with community and local government representatives. A workshop was also conducted with driver operators at Rock Region Metro to seek their input on safety for transit users when accessing transit stops.
In total, over 400 members of the public were engaged in-person through the
The Safety Action Plan team assemble all comments collected into a GIS database that is available to public agencies in Central Arkansas. These comments can be used by local governments to inform decisions on safety and maintenance investments.
public engagement process and more than 1,200 comments were received through the website survey, interactive map, and in-person comments received at public engagement events.
Engagement Events
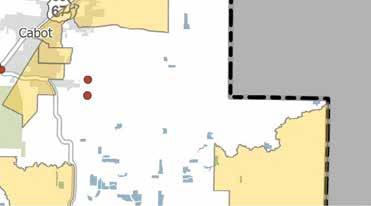
Benton Walk Audit
Cabot Walk Audit
Greenbrier Walk Audit
North Pulaski Annual Community Fest
Cabotfest
Radio ads were run to advertise the public engagement events as well as encourage the public to provide input on the plan. Two radio interviews were conducted and several local media stations ran stories on the SS4A Safety Action Plan.
September 9, 2023
September 20, 2023
October 5, 2023
October 7, 2023
380 survey responses
746 comments on interactive map
60 comments at outreach events
Walk Audit Benton / Saline County
Walk Audit Cabot / Lonoke County
Walk Audit
Community Event
Greenbrier / Faulkner County
Jacksonville / Pulaski County
October 14-15, 2023Community Event Cabot / Lonoke County
Benton Jeepers Halloween Treat FestOctober 21, 2023
Southwest Little Rock Walk AuditNovember 2, 2023
Arkansas Cornbread Festival
Pulaski County Open House
Faulkner County Open House
Pulaski County Open House
Pecan Festival
Saline County Open House
Lonoke County Open House
Pulaski County Open House
Pulaski County Open House
November 4, 2023
November 14, 2023
November 21, 2023
November 28, 2023
December 2, 2023
December 5, 2023
December 12, 2023
January 9, 2024
January 11, 2024
Downtown Little Rock Walk AuditJanuary 18, 2024
Rock Region Metro Operators WorkshopMarch 17, 2024
Wrightsville Walk Audit
North Little Rock Walk Audit
Maumelle Food Truck Festival
August 22, 2024
October 10, 2024
November 2, 2024
Community Event
Walk Audit
Community Event
Open House
Open House
Open House
Benton / Saline County
Little Rock / Pulaski County
Little Rock / Pulaski County
Wrightsville / Pulaski County
Conway / Faulkner
Little Rock / Pulaski County
Community Event Keo / Lonoke County
Open House
Open House
Open House
Open House
Walk Audit
Workshop
Walk Audit
Walk Audit
Community Event
Bryant / Saline County
Cabot / Lonoke County
Sherwood / Pulaski County
Little Rock / Pulaski County
Little Rock / Pulaski County
Little Rock / Pulaski County
Wrightsville / Pulaski
North Little Rock / Pulaski
Maumelle / Pulaski

Engagement events included pop-up events at community festivals, open houses held in conjunction with local city and county meetings, and walkaudits held with community and local government representatives.


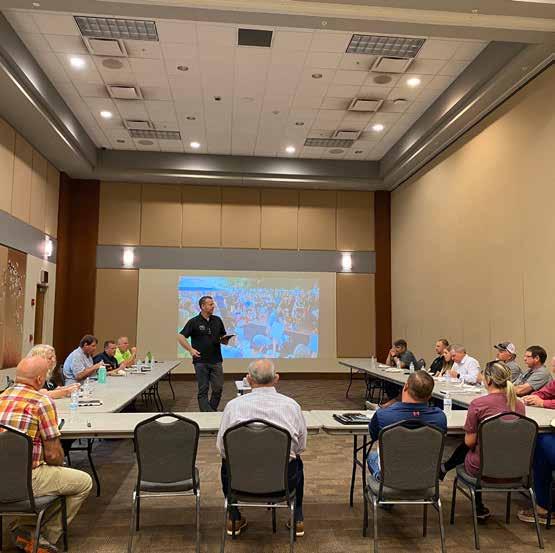
Walk audits were held within Central Arkansas at five locations that had been identified as lacking pedestrian infrastructure or accessibility. A walk audit allows stakeholder agencies and local community residents the opportunity to identify and assess issues that obstruct safe environments for pedestrians, bicyclists, and people in wheelchairs. Each walk audit consisted of a workshop portion that was focused on education regarding safe and accessible pedestrian and bike facilities, discussion about issues in the local community, and discussion about specific issues on the planned walk audit route. The participants then spent several hours walking through the route to identify safety issues and potential countermeasures. Walk audits were held in the City of Benton, the City of Cabot, the City of Greenbrier, and two in the City of Little Rock.
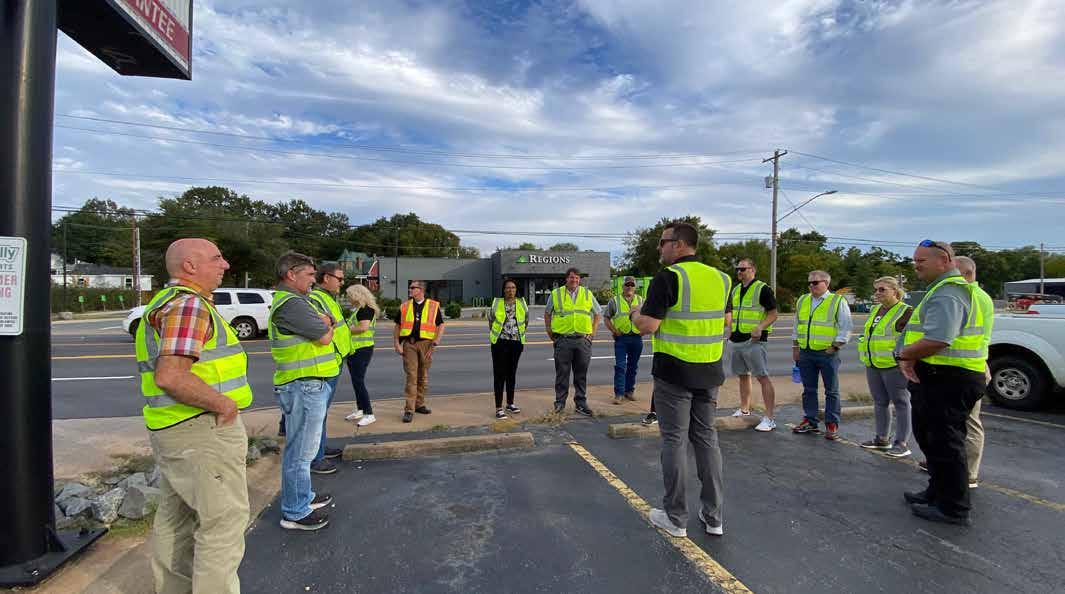
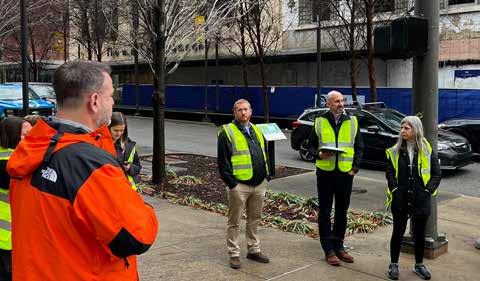
In Southwest Little Rock, the Safety Action Plan team and representatives from Metroplan, City of Little Rock, Rock Region Metro, and local community groups gathered to talk about how to improve safety for vulnerable road users. The group spent the approximately two-hours in a workshop setting before heading out for a two-hour walk together to identify potential safety issues and solutions. The walk audit participants spoke with local residents while walking and identified a number of issues, some which the City of Little Rock was able to address immediately after the walk. The walk audit was primarily conducted along Baseline Road and Geyer Springs Road, two segments of the region’s High Injury Network that also fall within the USDOT definition of an underserved area. Recommendations from the walk audit were incorporated into specific recommendations for safety improvements that appear later in this Safety Action Plan.
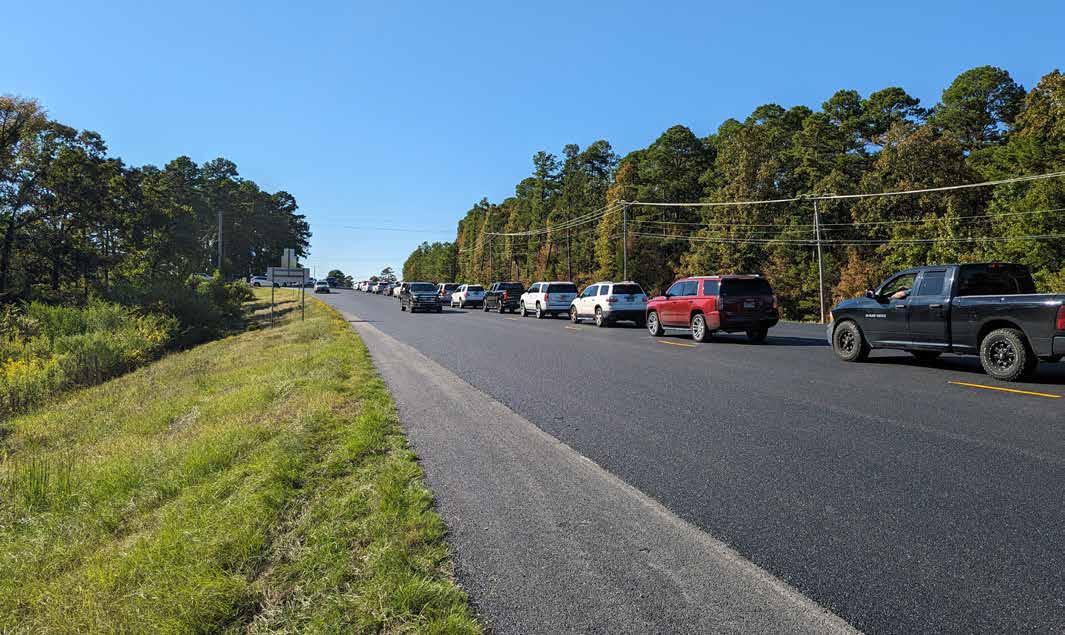
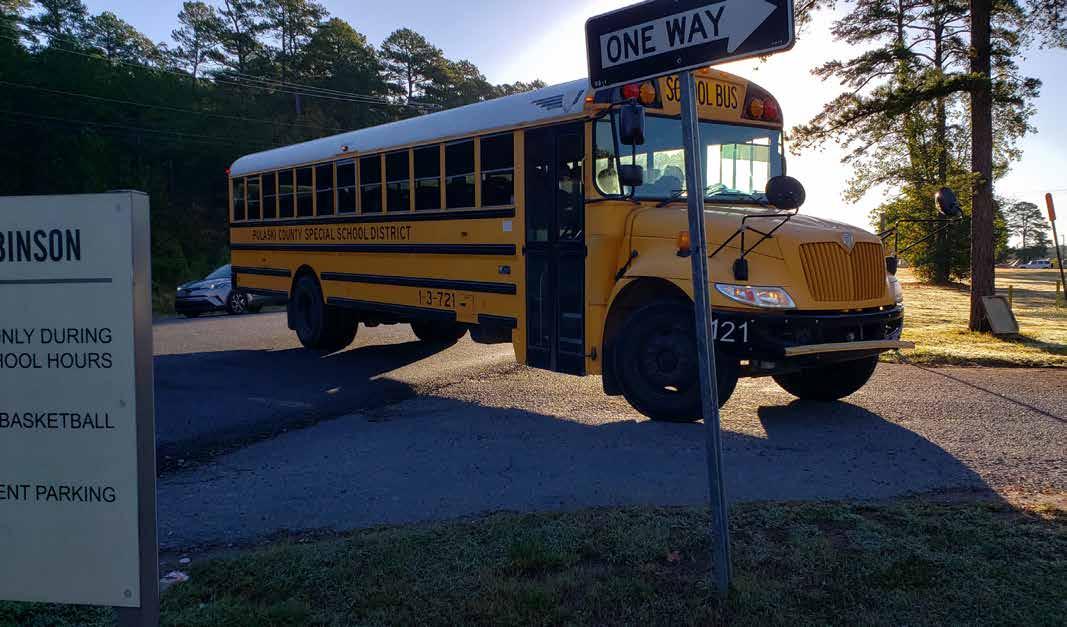
Tragically, during the first day of school as the Safety Action Plan was being developed, a Joe T. Robinson Elementary School employee was struck and killed while directing traffic at the Joe T. Robinson Elementary School in Pulaski County. The school is located on a high-speed state route with the Joe T. Robinson Middle and High Schools located across the street. The Central Arkansas Safety Action Plan team conducted a safety review of the operations at the three school campuses. The review included a field visit to observe campus and traffic operations as well as a series of meetings with ARDOT, Pulaski County Sheriff, and Pulaski County Special School District Officials, and representatives from the Parent Teacher Organization. The team developed a series of observations and recommendations to improve traffic operations and safety on the campus and reviewed them with ARDOT as well as school administrators and parents. Schools located on high-speed state routes are common throughout the Central Arkansas Region and the detailed study allowed the Safey Action Plan the opportunity to explore potential safety countermeasures closely that can be applied throughout the Region.
Throughout the entire engagement process, several themes rose to the top as consistent safety concerns from the public and stakeholders via the online survey and interactive map activity, as well as feedback from in-person events and workshops. The most common recurring themes were traffic calming, pedestrian and bicyclist facilities, lighting, dangerous intersections, and maintenance of roadways and infrastructure. These themes often overlap and are intertwined in certain locations, highlighting the complexity and urgency of addressing these issues.
This theme highlights the need for traffic calming infrastructure within the Central Arkansas Region. Through the online interactive map, 16 percent of comments left on the map were about speeding or the need to lower the speed limit in an area. Comments included the suggestion of implementing roundabouts to slow drivers in residential areas with frequent speeding. Pedestrians near the University of Central Arkansas noted that drivers frequently speed up to avoid getting stopped by the pedestrian signal. A little over 25 percent of surveyors stated that speeding is a major concern while driving within the Region. Public comments highlighted the need for implementation of traffic calming strategies to lower vehicle speeds and enhance pedestrian safety, such as road diets and other strategies to create a safer environment for non-motorized road users.
Intersection related concerns were a
common theme throughout the public engagement process. Respondents focused their attention on intersections that are dangerous, both for vehicles and vulnerable road users. Many comments called out specific intersections that experience safety concerns, as well as operation issues, whether it be unsafe interactions between vehicles and pedestrians or bicyclists, frequent speeding, or limited sight distance. Intersection improvements to accommodate for more pedestrian and bicycle activity were desired in areas that experience high levels of multimodal travel, such as near downtown Little Rock, schools within the Region, and community centers. Large intersection crossings within the Region were highlighted as dangerous for pedestrians to cross. Signal timing adjustments were suggested particularly for left turn movements. Participants had mixed feelings on roundabouts within the Region, some stated that they are great while other did not support the designs.
Participants expressed a strong desire for the development and enhancement of infrastructure dedicated to pedestrians and bicyclists, particularly near the University of Arkansas at Little Rock and the University of Central Arkansas. This includes the rehabilitation and installation of sidewalks, shared use paths, protected bicycle lanes, and trails to ensure safe travel routes for nonmotorized roadway users. Existing sidewalks were often noted as uneven, overgrown, and narrow. Pedestrian and bicycle infrastructure is not consistent, participants noted that sidewalks and bicycle lanes will end abruptly and sometimes without warning.
Survey comments and the public map comments highlighted the need for better and more consistent lighting within the Central Arkansas Region. Through the online survey, 15 percent of participants stated that lighting within the Region is a major safety concern for drivers and 20 percent of participants stated that lighting is a major safety concern for vulnerable road users. This includes lighting on streets, intersections, blind curves or hills, crosswalks, sidewalks, greenways, or bike lanes. Stakeholders also noted that many streetlights are out of commission and do not get fixed regularly. Dark local streets and the need for more street lighting both for automobiles and vulnerable roadway users, including activity areas specifically adjacent to the University of Central Arkansas in Conway, near schools and parks across the Region, and within residential neighborhoods.
This theme highlights the critical need for regular maintenance of roadways and infrastructure for vehicles, pedestrians, and bicyclists. Public comments identified locations with potholes, missing signage, faded pavement markings for vehicle and bike lanes, deteriorating curb and sidewalk, and pedestrian push buttons and signals that no longer function properly, and dim or burnt-out streetlights. Bumpy, poorly lit, and unclearly marked roads and paths create unsafe conditions for all road users, as they make it difficult for each type of road user to navigate their dedicated path for travel without crossing paths with one another and to anticipate each traveler’s movements.
To determine a segment or intersection’s safety needs score, the needs assessment scores each corridor segment and intersection based on the category or range the segment falls within for various criteria. The maximum score a location can receive is 100 points. The criteria and scoring were developed based on the Region’s priorities and feedback from the SAPAC and include the corridor’s crash data, equity data, location characteristics, and stakeholder and public input.
Scoring Criteria
# Fatal and Serious Injury Crashes #
Segments in the Regional HIN and the Regional High Injury Intersections were each scored and prioritized to identify the locations in Central Arkansas that have the greatest need for safety countermeasures. The 20 highest scoring HIN segments and 20 highest scoring High Injury Intersections in the Region were selected for projects according to the scoring criteria described in this section. The scoring criteria met key objectives of the SS4A Program by prioritizing locations with the highest number of fatal and serious injury crashes, locations that were in underserved areas, and locations were vulnerable road users such a pedestrians and people on bikes are more likely to travel.
The crash data is split into three components, each based on the characteristics of crashes that occurred along the segment or within 250 feet of the intersection from 2018 through 2022. This criteria carries the most weight because addressing issues in areas with documented safety concerns is the Region’s priority and focus of this Plan.
Fatal and Serious Injury Crashes (25 Points)
The count of all fatal and serious injury crashes is worth the most points within the crash data criteria because the overall goal for the Region is to target a reduction in crashes that result in fatalities or serious injuries.
Fatal and Serious Injury Pedestrian and Bicycle Crashes (15 Points)
The count of all fatal and serious injury crashes that involved a pedestrian or bicycle is a separate component of the safety data because the safe system approach emphasizes the need to make roads safer for all road users, and pedestrians and bicyclists are typically the most vulnerable road users.
Total Number of Crashes (15 Points)
The count of all crashes is important to consider because a fatal or serious injury may not have occurred within the last five years, but a high crash density can indicate a major safety issue at that location.
The equity component of the score is based on the USDOT Equitable Transportation Community (ETC) Explorer data. This data identifies census tracts as disadvantaged using various factors including but not limited to transportation access, environmental burden, unemployment, weather risk, and health vulnerability.
Disadvantaged Census Tract (25 Points)
Scoring a location based on whether or not the segment or intersection is in a disadvantaged census tract prioritizes locations where funding safety improvement projects is likely a challenge.
Segments and intersections receive points if they are within a mile of a school, receiving the full amount of points if they are less than a quarter mile away. This criteria prioritizes improving safety in the areas around schools, where students are often walking or rolling as their primary means of transportation.
Similar to schools, segments and intersections receive points if they are within a mile of a park, receiving more points as they get closer. This helps target locations that may improve connectivity to recreation areas that the public walks or rolls to, as well as to existing and planned greenway trails and multi-use paths.
Stakeholder and Public Input (Total of 5 Points)
Number of Comments (5 Points)
A key purpose of the Central Arkansas Safety Action Plan is to make roads and streets safer for all road users. Significant effort was put into stakeholder and public outreach to gather input from those that use the streets and road in Central Arkansas on a regular basis. Therefore, the selection score considers where the stakeholders and public have identified issues and expressed concern at each potential project location.
The 20 highest scoring Regional HIN segments and 20 highest scoring Regional High Injury Intersections in Central Arkansas were selected for further evaluation and project development. A full list of the selected segments and intersections, with each location’s data and score broken out by criteria, is included in Appendix B. The selected locations consist of HIN segments with a score of 63 points or more and High Injury Intersections with a score of 59 points or more. The prioritized Regional HIN segments and Regional High Injury Intersections are presented in Table 3 and Table 4 respectively.
All but two of the selected HIN segments are located within the City of Little Rock. The remaining two are adjacent segments of E Oak St in the City of Conway. Similarly, the only two selected High Injury Intersections that are not within the City of Little Rock are located along the selected segments of E Oak St, at the intersections with Harkrider St and Elsinger Blvd.
Of the 20 selected Regional HIN segments and the 20 selected Regional High Injury Intersections, no location received the maximum number of 100 points. The segment of Geyer Springs Rd from Forbing Rd to Baseline Rd scored highest among the HIN segments, with 96.5 points. The Geyer Springs Rd and Baseline Rd intersection, which is at the end of the highest scoring HIN segment, scored highest among the High Injury Intersections, with 88.5 points.
The HIN considers divided roads as two separate corridors, as crashes may be denser or have similar characteristics and causes specific to one side of the divided road. This resulted in overlapping northbound and
southbound segments of S University Ave scoring in the top 20 HIN segments. Seven northbound and southbound segments along S University Ave scored among the top 20 HIN segments, five of which were in the southbound direction. This southbound 3.9 mile stretch of S University Ave was the second longest continuous section selected for project development and contained six of the top 20 intersections.
The longest continuous distance of segments selected for project development is 4.0 miles of Baseline Rd, made up of four separate HIN segments and three top 20 intersections. Similarly, four separate segments and four intersections selected along Colonel Glenn Rd/Asher Ave/W Roosevelt Rd create a continuous 3.2 mile section, making it the third longest continuous section selected for project development.
The intersection of E 9th St and the southbound I-30W frontage road received a score of 60.5 points. However, this analysis captured crashes along the Interstate’s mainlines and is already undergoing reconstruction. Therefore, this intersection was removed from consideration for future project development. With the removal of this intersection, 20 intersections still remain in the priority list for consideration of future projects because two intersections tied for 20th with 59 points.
FIGURE 11: SELECTED 20 HIGH INJURY NETWORK SEGMENTS AND 20 HIGH INJURY INTERSECTIONS
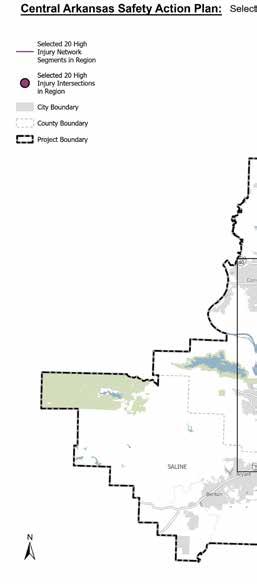
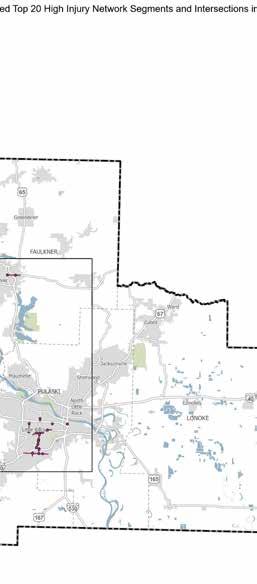
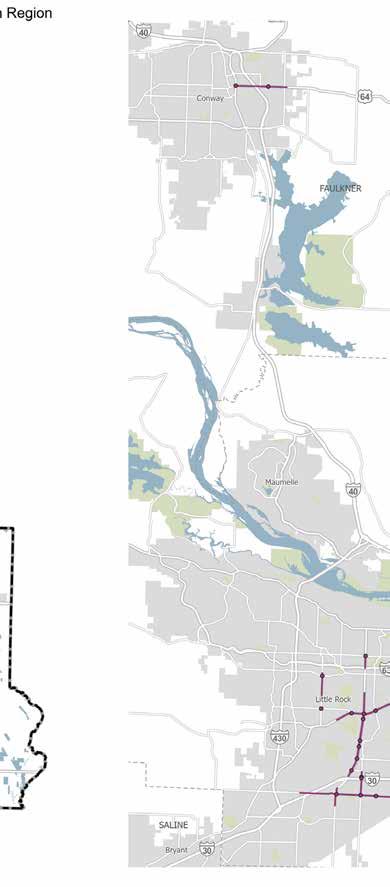


*The intersection of E 9th St and the southbound I-30W frontage road received a score of 60.5 points. However, this analysis captured crashes along the Interstate’s mainlines and is already undergoing reconstruction. Therefore, this intersection was removed from consideration for future project development.
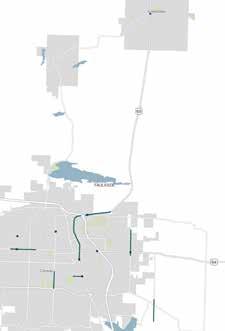
In addition to the top 20 regionwide segments and intersections, the ten highest scoring Regional HIN segments and ten highest scoring Regional High Injury Intersections in each of the Central Arkansas Region’s four counties were prioritized for further evaluation and project development. A full list of the selected segments and intersections for each county, with each location’s data and score broken out by criteria, is included in Appendix B. Summary of the selected top ten HIN segments and top ten High Injury Intersections are included in Table 5 and Table 6 respectively.
SS4A Implementation Grants cannot be awarded to state agencies, meaning ARDOT is not able to receive funding from the USDOT through the SS4A Program. Although local agencies can receive funding to conduct projects on roadways owned by ARDOT, this would require additional coordination between the local agency and ARDOT. Therefore, in order to provide each county with projects that would not require additional coordination with ARDOT, the high scoring locations were split between state routes and local roads as equally as possible in each county. The five highest scoring state route HIN segments and the five highest scoring local roads in each county were prioritized for project development and comprise the top ten for
each county. Similarly, the five highest scoring intersections of two state routes or a state route and local road, as well as the five highest scoring intersections of two local roads were selected for project development, where applicable. All counties except for Pulaski County did not have five intersections of two local roads identified within the set of High Injury Intersections, so the next highest scoring intersections were selected until ten were selected for each county. Lonoke County only had eight regional High Injury Intersections, resulting in all eight being prioritized for project development.


The Safety Countermeasure Toolbox section describes countermeasures that have been historically proven to increase safety on roadways. These countermeasures have a positive impact on reducing the number and severity of crashes. Identifying countermeasures that address roadway safety gives the Central Arkansas Region a toolbox for identified problem areas. Safety countermeasures include changes in roadway geometry, operations, signage, pavement markings, or access management. The safety countermeasure toolbox may also be used on roadways with safety concerns that are not identified in this plan. The countermeasures defined in this section have been recommended from sources including the FHWA, NHTSA, and ARDOT. In some instances, such as the use of speed safety cameras which are limited to highway work zones, school zones, and at railroad crossings with an officer present, state law may need to be reviewed and updated in order to implement the countermeasure on a widescale basis.
FHWA’s Proven Safety Countermeasure are strategies and improvements effective in reducing deaths and serious injuries caused by crashes on all roadways. FHWA recommends the implementation of Proven Safety Countermeasures by transportation agencies nationwide to better accelerate the achievement of safety goals and move towards zero fatal and serious injury crashes. Proven Safety Countermeasures address the following safety focus areas: Speed Management, Pedestrian and Bicyclist, Roadway Departure, and Intersections. Crosscutting Strategies are also identified as part of the Proven Safety Countermeasures. These strategies address multiple safety focus areas.
In early 2000, the Conway City Council, Metroplan Board of Directors, and Arkansas State Highway Commission (acting through the Arkansas State Highway and Transportation Department), adopted the Access Management Plan for State Highway 60/Dave Ward Dr.
A specific access management plan was developed for the first of two segments, identifying each median break and curb cut, establishing standards for driveways, and setting property interconnect agreements and requirements for new developments. A general access management plan for the second segment specifies requirements for the roadway cross-section and right-of-way, and standards for median breaks and driveways.
A safety study conducted on the corridor analyzed the three-year crash data before the Access Management Plan was implemented (1998 – 2000) and the three-year crash data after (2005 – 2007).
With the potential for fatal injuries increasing as the speed of a crash increases, it is important to realize the need for proper speed management. The following countermeasures are proven to combat the potentially fatal effects of high-speed crashes before they even happen.

A driver traveling at 35 mph has a 45 percent chance of either killing or seriously injuring a pedestrian if hit, while that percentage drops to 5 percent if the speed is just 15 mph less, at 20 mph. This fact highlights the impact speed limits have on all road users and not just those in the vehicles.

An effective and reliable technology that can aid the current methods in practice, speed safety cameras use speed measuring devices to detect a speeding vehicle and catalog the evidence for later penalization. These devices not only provide an alternative to current policing measures, but also offer an unbiased enforcement of speeding independent of driver age, race, gender, or socio-economic status. Arkansas state law currently limits use of speed safety cameras for enforcement to highway work zones, school zones, and at railroad crossings with an officer precent.

When ideal conditions of a roadway are not met and the posted speed limit is predetermined for ideal conditions, there is a greater chance that a driver error could result in a crash. VSLs can adapt to changing circumstances to reduce the risks of nonideal driving conditions. This countermeasure is particularly effective for urban and rural freeways with posted speed limits greater than 40 mph.

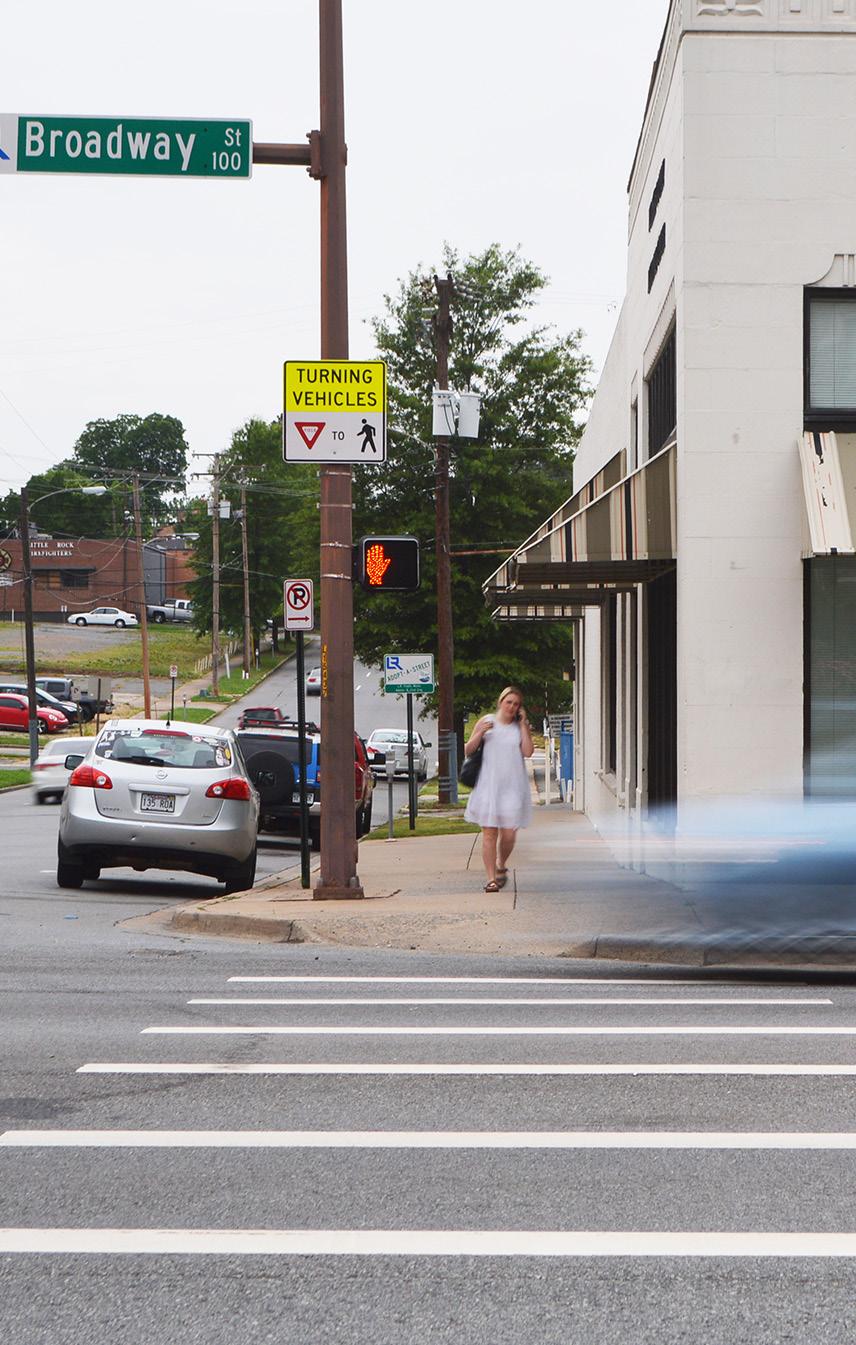
Often the most vulnerable users of the roadway, pedestrians and bicyclists require that transportation planners and engineers go beyond traditional design that focuses primarily on moving automobiles. The proven safety countermeasures for these road users generally include improving the visibility of pedestrian and bicycle facilities and alerting drivers to be aware of potential pedestrian or bicycle encounters. These strategies are particularly useful near schools, transit stops, and other areas with a large amount of pedestrian or bicyclist activity.

By creating a dedicated lane for bicyclists the number of crashes between vehicles and bicycles can be reduced while also encouraging and facilitating bicycles as a mode of transportation.
FHWA’s Bikeway Selection Guide and Incorporating On-Road Bicycle Networks into Resurfacing Projects can be used to assist agencies in determining which facilities provide the most benefit in various contexts, as bicycle lanes are not limited to additional pavement markings adjacent to vehicular lanes.

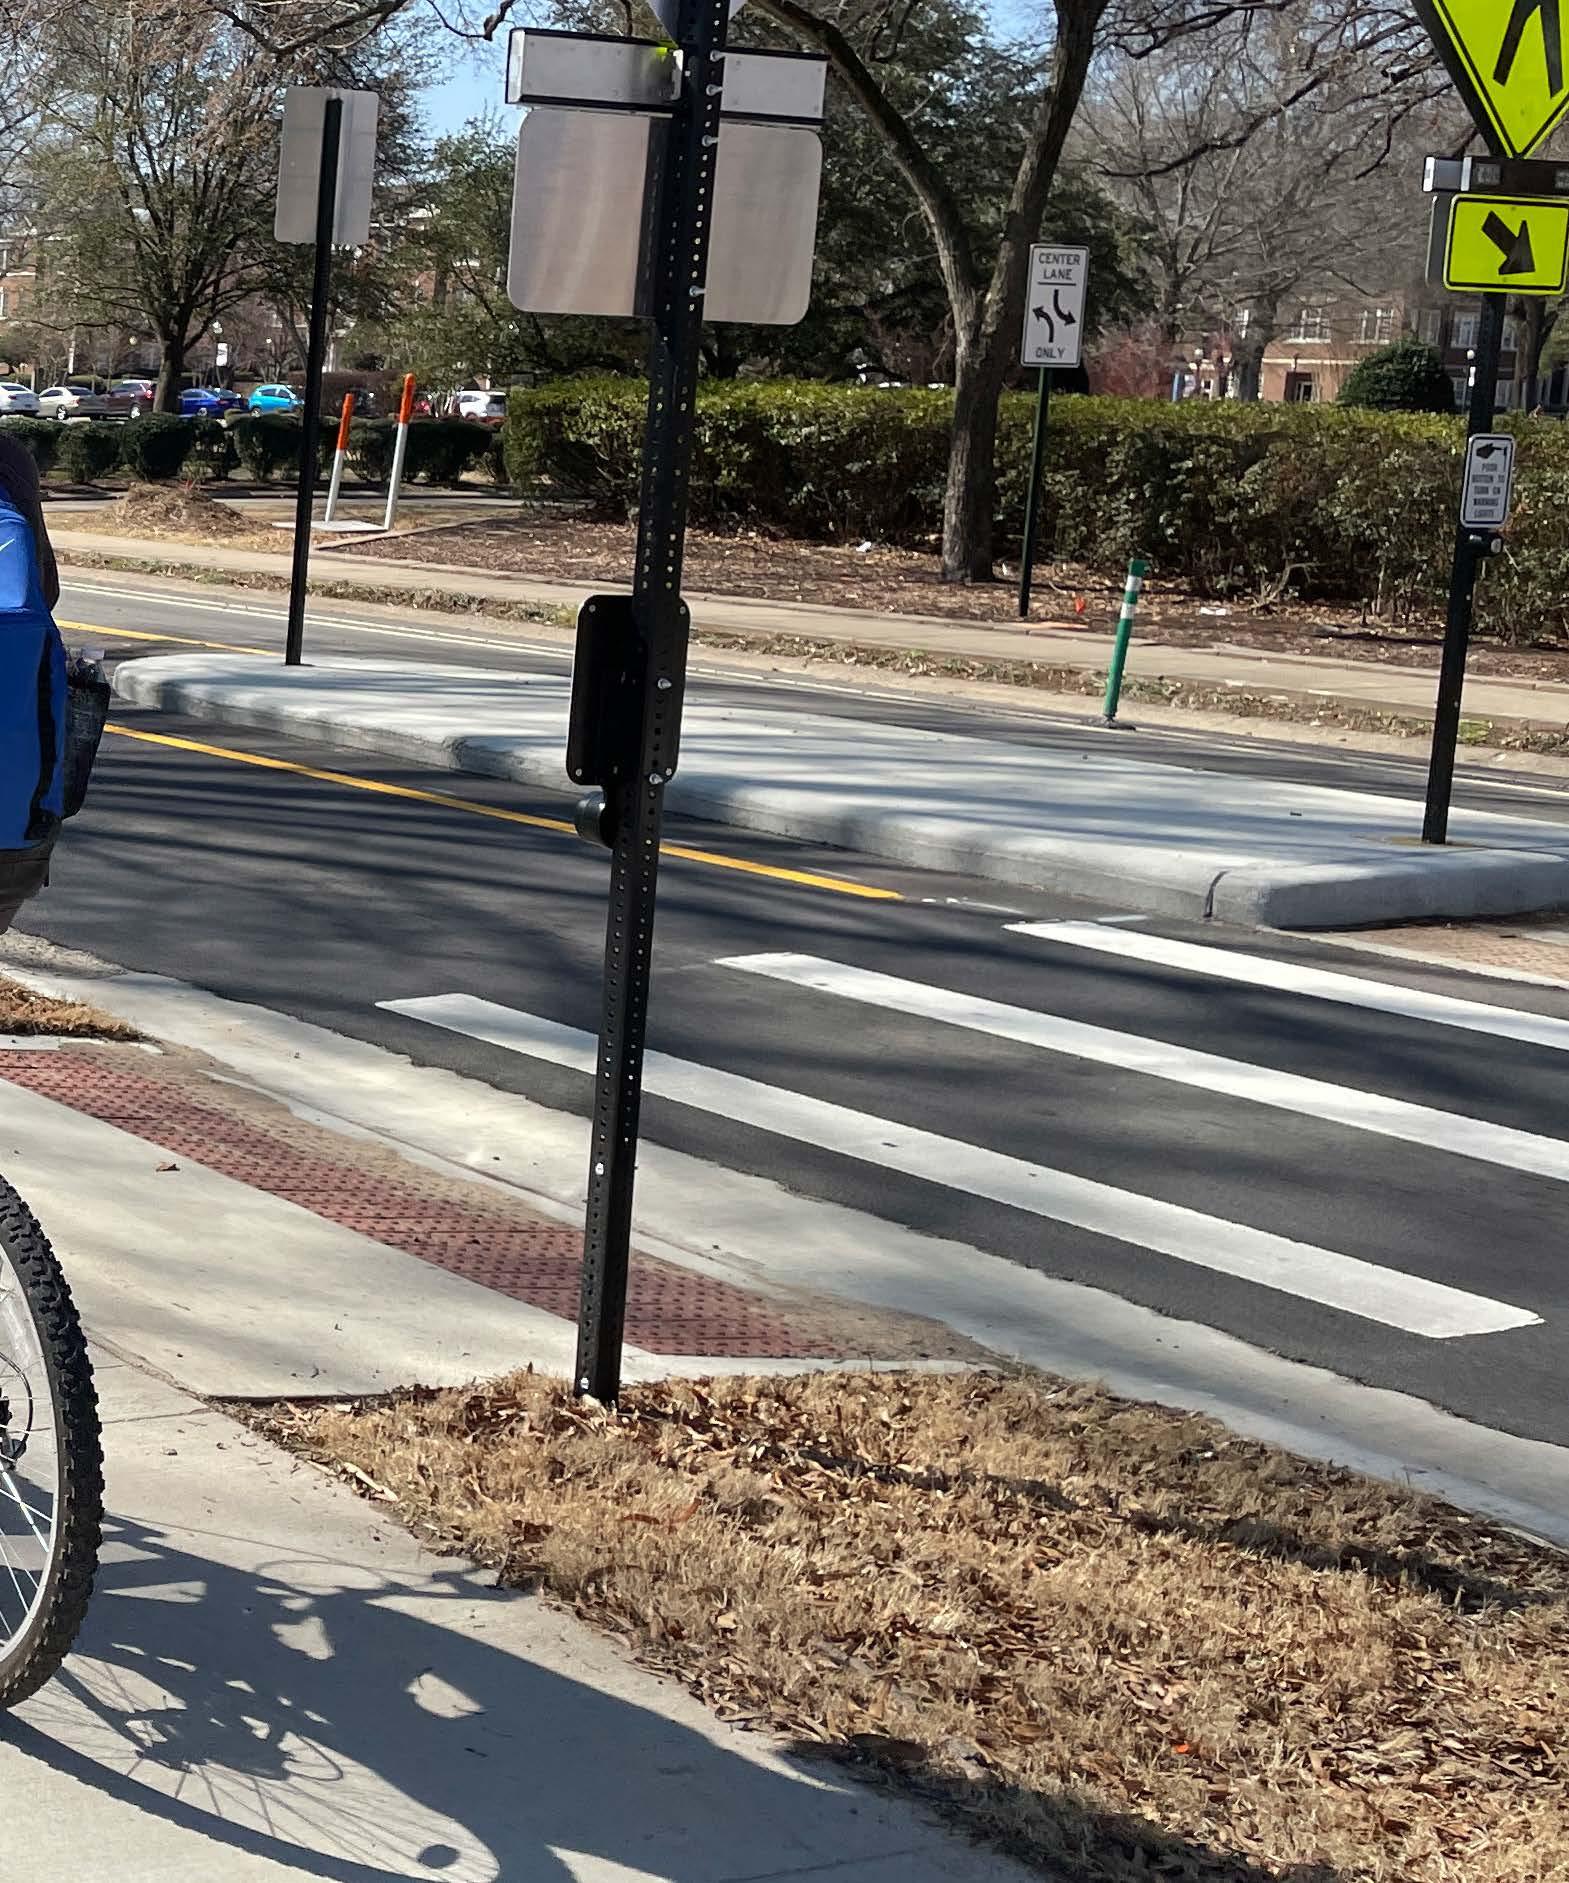
The three main enhancements for crosswalk visibility are high-visibility crosswalks, improved lighting, and enhanced signing and pavement markings. These countermeasures do not just provide an increased potential for drivers to identify potential points of conflict, but they also assist in the decisionmaking of users trying to cross the road.

Leading pedestrian intervals allow for pedestrians to enter the intersection a few seconds before conflicting turning movements, like right or left turning vehicles, are given a green light. Pedestrians can establish their presence with the help of these intervals and reduce their risk of going unnoticed.

Medians and Pedestrian Refuge Islands in Urban and Suburban Areas: Medians and pedestrian refuge islands can be installed to reduce the high number of pedestrian fatalities that occur at midblock locations in urban and suburban areas. These countermeasures protect pedestrians and bicyclists as they cross one direction of multi-lane traffic at a time.

Pedestrian Hybrid Beacons (PHB):
As stated in the previous countermeasure, many pedestrian fatalities occur at nonintersection locations, with one notable factor being the speed of vehicles in the area. PHBs are red-yellow signalizations that can be activated by a pedestrian to prompt approaching vehicles to stop and give the pedestrian the right-of-way for safe crossing.

Rectangular Rapid Flashing Beacons (RRFBs):
Usually accompanied by a pedestrian warning sign, RRFBs flash with an alternating highfrequency and can increase the visibility of pedestrians when trying to use a crosswalk.

The common use of road diets involves converting an existing four-lane undivided roadway into a threelane roadway with one through lane in each direction, access management medians and turn lanes, and potentially the installation of bike lanes. Road diets calm traffic which not only provides safer roads for pedestrians and non-motorized road users but also benefits motorized vehicles with regards to safer left-turns and consistent speeds.

Any space that is well-defined and intended for the use of a person traveling by foot or using a wheelchair may be considered a walkway, including sidewalks, multi-use paths, and roadway shoulders. Roadway shoulders are some of the least safe walkways, while elevated sidewalks provide significantly more protection for pedestrians.
Often the most vulnerable users of the roadway, pedestrians and bicyclists require that transportation planners and engineers go beyond traditional design that focuses primarily on moving automobiles.
Roadway departures are one of the most types of crashes that are seen in rural areas of Central Arkansas. The following countermeasures aim to reduce the number of departure related fatalities.

Enhanced Delineation for Horizontal Curves:
Enhanced delineation for horizontal curves includes additional delineation along the approach to a curve and/or within the curve. A few countermeasures are the installation of chevron signs, delineators, or enhanced conspicuity such as larger, fluorescent, and/or retroreflective signs.

Rumble strips are a series of grooves in the pavement or raised elements along the travel lane edges intended to alert drivers through vibration or sound that their vehicle has left the travel lane. White edge line or yellow center line stripes may be painted over rumble strips to increase lane visibility during nonideal conditions. These countermeasures can be used to alert drifting drivers and reduce many headon and roadway departure fatal and serious injury crashes.

Longitudinal barriers that separate opposing traffic on a divided highway are used to redirect vehicles that have left the travel lane and are heading towards opposing traffic. Hotspots of head-on crashes can give a good idea of where median barriers may be of the most use. Median barriers installed on rural four-lane freeways have resulted in a 97 percent reduction in cross-median crashes.

Improvements at Curves:
These countermeasures include treatments for the high-risk roadside environment along the outside of horizontal curves that reduce roadway departure fatalities and serious injuries. They may aim to give vehicles a chance to recover safely from roadway departures, such as removing obstructions along the roadside and implementing clear zones, flattening steep side slopes, and adding or widening shoulders. Cable barriers, metal-beam guardrails, and concrete barriers may reduce the severity of a crash in the instance a safe recovery is not possible.

SafetyEdgeSM is a low-cost and effective pavement edge technology that eliminates the potential for vertical drop-offs by shaping the edge at approximately 30 degrees from the pavement cross slope. This shallow slope allows for a controlled return to the travel lane for drivers who have left the roadway and combats edge raveling of asphalt.

Without identifiable travel lanes and upstream road alignment, the risk of roadway departure is heightened. By increasing the width of edge lines from the minimum of four inches to the maximum of six inches, associated crashes can be reduced by 37 percent. Wider edge lines are relatively low cost with a benefitcost ratio of 25:1.
Responsible for a large portion of fatal and serious injury crashes, intersections are a major focal point for safety analyses. The following countermeasures will highlight the multitude of ways to reduce intersection related crashes.

Backplates with Retroreflective Borders:
With one inch to three inch wide yellow retroreflective borders, these types of backplates improve the visibility of a traffic signal. This treatment to traffic signals accounts for older and color vision deficient road users, not to mention its usefulness during blackouts in providing a visible cue for drivers to stop at the intersection ahead of them.

Corridor Access Management:
Access management strategies can be used individually or in combination to enhance safety for all modes of transportation, encourage and facilitate walking and biking, and reduce trip delay and congestion. Some strategies include tandem roundabouts that reduce leftturn conflicts, turn lanes, and reduction in density through driveway closure, consolidation, or relocation.

Dedicated Left- and Right-Turn Lanes at Intersections:
Left- and Right-turn only lanes can provide physical separation for turning traffic and thus reduce the potential for crash types like rear-end collisions or left-turns across opposing traffic.

Yellow Change Intervals:
With practices in place that regularly review and update traffic signal timing policies relating to yellow change intervals, the length of yellow signal indication, crashes associated with redlight running can be reduced.

Reduced LeftTurn Conflict Intersections:
In the same realm as the previous countermeasure, these intersections are geometrically designed to alter how left-turn movements occur. Simplifying decision-making for drivers, the most effective of these designs rely on U-turns and can greatly reduce the potential for higher severity crash types, including head-on and angle crashes.

Roundabouts:
Roundabouts are intersections that move traffic through channelized approaches along a circular configuration. They allow for safe and efficient routes by eliminating leftturn conflicts and keeping the traffic along roadways moving, thus minimizing delays and queueing.

Systemic Application of Multiple Low-Cost Countermeasures at Stop-Controlled Intersections:
As the name suggests, this treatment involves a series of low-cost countermeasures for stop-controlled intersections through better signage and pavement markings. Some methods for stop controlled and through approaches include posting signs on both sides of the road, oversized advance intersection warning signs, and retroreflective signage.
While the countermeasures listed up until now have each addressed their corresponding crash types (speed, departures, intersections, and pedestrians/bicycles), crosscutting is an area of focus that involves the reduction of multiple crash types with the application of a single countermeasure. Discussed below are those countermeasures and the crash types they address.

While the number of fatal crashes occurring during the day and during the night are comparable, the nighttime fatality rate is higher due to less vehicles miles traveled at night. Therefore, improved lighting in area associated with turns, stoppage, or pedestrian crossings present ample safety benefits. All of the previously mentioned crash types can benefit from lighting in one form or another.

Local road safety plans provide framework for roadway safety improvements on local roads by identifying a list of prioritized action items that can be implemented at a low-cost and timely process. All crash types can be addressed as these plans use localized crash data that can determine the hotspot locations for each crash type.

With an emphasis on areas where vehicles make frequent turns, stops, and decelerations, the implementation of proper maintenance and treatment of pavement friction can prevent roadway departure, intersection, and pedestrian-related crashes.

An audit or assessment that is performed to analyze the existing safety conditions of a road and identify potential improvements with consideration for all road users, factors, and capabilities. RSAs can reduce crashes anywhere in the range of 10 to 60 percent and may affect one, some, or all crash types.
NHTSA developed the Countermeasures That Work reference guide. This guide consists of effective and science-based traffic safety countermeasures that address highway safety problem areas. While FHWA Proven Safety Countermeasures tend to focus more on engineering solutions, NHTSA Countermeasures that Work focus primarily on changing human behavior through education and enforcement.
Safe Routes to School
Safe Routes to School is a program that aims to make it safer for students to walk and bike to school and encourages more walking and biking where safety is not a barrier. The Safe Routes to School Program includes engineering and enforcement activities to improve traffic safety. Safe routes to school is a federal transportation funding program administered by FHWA.
Children from a young age should be taught knowledge and best practices to enable them to walk safely in environments with traffic and other safety hazards. Classes should be worked into the school’s existing curriculum and should be led by trained instructors. Child pedestrian training should be provided for five-to-seven year olds to give children a foundation in roadway safety.
Bicyclists within the State of Arkansas are not required to wear a helmet while riding a bicycle. Requiring the use of helmets for all
bicyclists reduces the number of fatal and serious head injuries resulting from a bicycle crash. Studies by FHWA have found that 70 to 80 percent of all fatal bicycle crashes involve head injuries.
Bicycle safety education for children teaches children basic bicycle skills, traffic signs and signals, how to ride on streets with vehicles present, proper helmet use, and bicycle safety and maintenance. Young children have little to no knowledge of traffic operations and providing a basis in traffic laws and safe bicycle behaviors can change the way they operate a bicycle.
Motorcycle helmet use laws require all motorcycle riders and passengers to wear a helmet. In Arkansas, only riders under the age of 21 are required to wear helmets. Use of helmets by all motorcycle riders could reduce the rate of fatal and serious injury crashes involving motorcycles in the state.
Requiring pre-licensing programs helps prepare motorcyclists to recognize potentially hazardous riding situations and encourage riders to ride within their own abilities.
Dynamic speed display/feedback signs show drivers their speed and may encourage drivers to slow down. When drivers are speeding, the dynamic speed display/ feedback sign will light up to notify the driver
that they are speeding. The automated speed display monitors also provide a method to collect location-specific travel speed data.
ARDOT’s traffic safety division publishes effective countermeasures and safety campaigns that improve roadway safety throughout the state. ARDOT has developed safety campaigns to raise awareness about different topics including safe driving, sharing the road with non-motorists, and work zones.
A raised pavement marking is a small reflective device attached to the road that is used as a lane guide to drivers. Lighting conditions or rainfall can reduce a driver’s ability to view the roadway, and raised pavement markings provide enhanced retro reflectivity which helps provide better roadway guidance. Due to wear and tear, raised pavement markings are expected to last less than two years after installation.
In February 2022, Arkansas State Police and Arkansas Highway Police started a zero-tolerance campaign to stop distracted driving, reckless driving, and speeding within work zones. Patrols are stationed in work zones to deter speeding and distracted driving. If an officer observes a driver speeding or using their phone, the driver will be pulled over and cited.
ARDOT implemented a Share the Road initiative which is a campaign that provides travelers with information on laws, policies,
maps, and resources to commute safely on Arkansas’ roadways, whether by walking, driving, or biking. The campaign offers information on how different modes of travel can safely share the roadway.
Several additional safety countermeasures were identified by the SAPAC and through public engagement efforts in Central Arkansas. These countermeasures are not explicitly identified in the countermeasures previously discussed, but were considered and recommended in some cases for projects and systemic improvements recommended in Central Arkansas.
Pedestrian Signal at Intersection
Installing pedestrian signals with count down timers at signalized intersections assign right of way to the pedestrian during certain parts of the traffic signal cycle and convey accurate information about the time available to cross. SAPAC members noted that some pedestrians are confused when they see a flashing hand symbol and believe that even if they are already in the intersection they must go back to where they started. Count down timers can reduce this confusion.
Buffer Between Vehicle Lane and Sidewalk/Bikeway
A buffer zone between vehicles and pedestrian/bicycle infrastructure of four to six feet provides a safer environment for pedestrians by moving them further away from travel lanes. This buffer can look different according to street type. The buffer helps promote safety by increasing the distance between the vehicles and pedestrians/bicycles. In the event of a car
crash, having pedestrians and bicycles located four feet or more off of the roadway can prevent further injuries.
Bus stop bulb outs allow buses to stop in lane and provide additional space at bus stops for pedestrians. Allowing buses to stop in lane reduces the amount of conflict because drivers do not have to reenter the traffic lane.
Bulb out stops also increase bus reliability since the driver does not have to wait for a clearing in traffic to reenter the traffic lane.
Curb extensions visually and physically narrow the roadway, which creates shorter and safer crosswalks for pedestrians. Curb extensions also increase the visibility of pedestrians by emphasizing where the crosswalk is located by reducing the roadway width there. Curb extensions can be implemented on downtown, neighborhood, and residential streets.
The use of a flashing yellow arrow to indicate a permissive left-turn phase instead of a green ball indication has been found to reduce the number of left-turn related crashes. Drivers turning left frequently mistake the green ball indication as implying that the left turn has the right-of-way over opposing traffic.
Designing wider shoulders for new roads, or shoulders on existing roads, can provide drivers with extra buffer should they drift out of travel lanes or need to make an emergency maneuver to avoid crashes. An emergency shoulder also provides space for drivers to safely move out of travel lanes if a vehicle becomes inoperable.
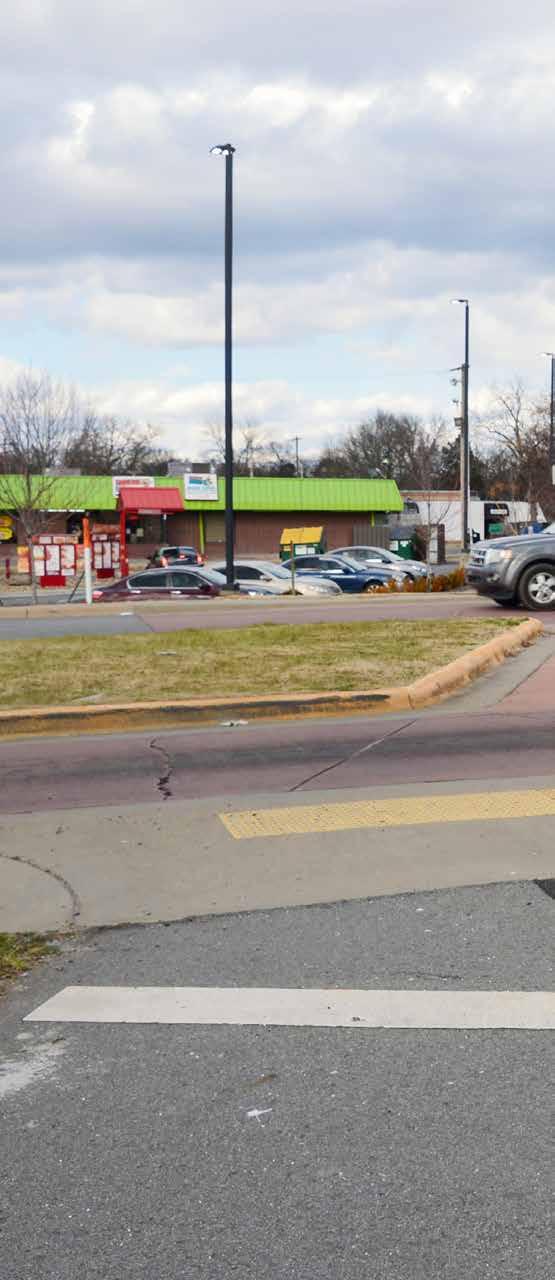
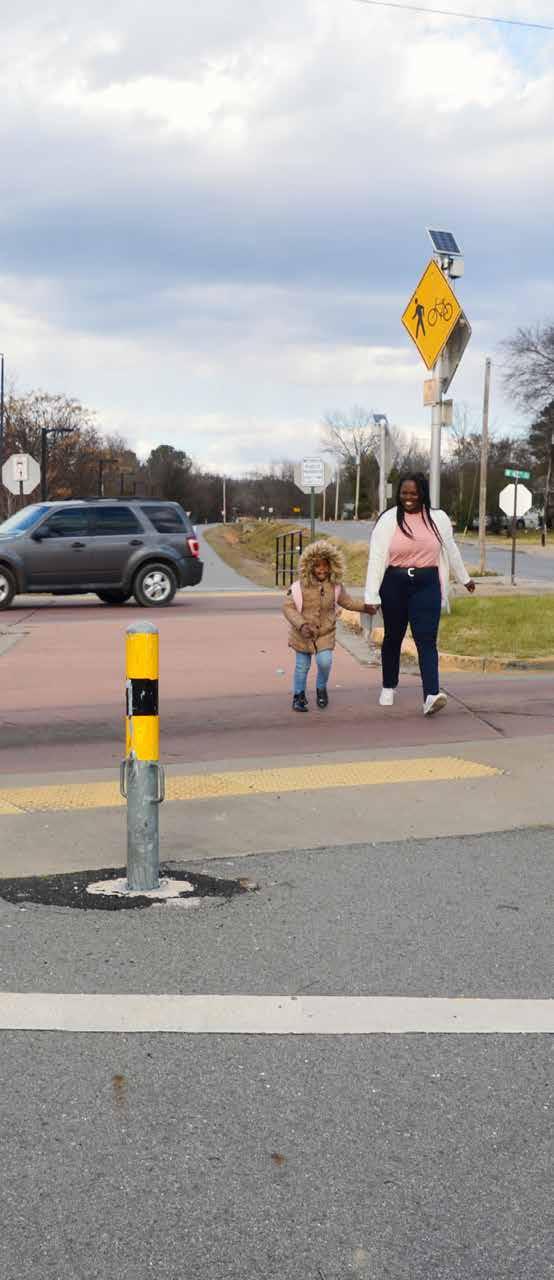
This section provides recommendations for location-specific projects developed for the Regional HIN segment and Regional High Injury Intersections identified and prioritized in Section 4 – Needs Assessment. This section also identifies systemic countermeasures for deployment throughout the transportation network, policy changes and proposed new policies to create a safer future transportation network, and demonstration projects that could be used to determine the benefits of emerging technologies and strategies in the Central Arkansas Region.
The 20 Regional HIN segments and 20 Regional High Injury Intersections that scored highest for having the greatest need for safety improvements in the Central Arkansas Region were selected for projects. After further review of the crash data, roadway geometry and general characteristics, and public comments, overlapping or adjacent segments and intersections were consolidated into ten regional projects that incorporate the 20 HIN segments and High Injury Intersections.
A summary of the recommendations is provided in Table 7. A complete description of each project, including crash maps and specific recommendations, is provided in Appendix B. It should be noted that University Ave was split into three projects based on the roadway geometry, surrounding area, and historic crash patterns. The northern section, between Markham St
and US 630, has the Park Avenue shopping center along the west side, War Memorial Park along the east side, and medical facilities on both sides. The central section, between Berkshire Dr and Colonel Glenn Rd/Asher Ave, separates the University of Arkansas in Little Rock (UALR) from retail and restaurants. The southern section, between Colonel Glenn Rd/Asher Ave and Forbing Rd, is divided with a grass or concrete median and passes through a wider variety of land uses.
All but one of the regional projects are in Pulaski County, with the remaining project being Oak St, a state route in Faulkner County. None of the top 20 Regional HIN segments or top 20 High Injury Intersections are in Lonoke County or Saline County, and the only segment selected for a regional project in Faulkner County is on a state route.
To support safety throughout the Central Arkansas Safety Action Plan, additional projects were identified for the highest scoring state route and highest scoring local road in Faulkner, Lonoke, and Saline Counties. These project locations are shown in Figure 13 and listed Table 8, with more detailed information for each available in Appendix B.
To support developing cost estimates for the project recommendations, unit costs in 2024 dollars are provided in Appendix C. Unit costs are provided for infrastructure related to countermeasures aimed at safety improvements for vulnerable road use infrastructure, vehicular infrastructure, and transit infrastructure.
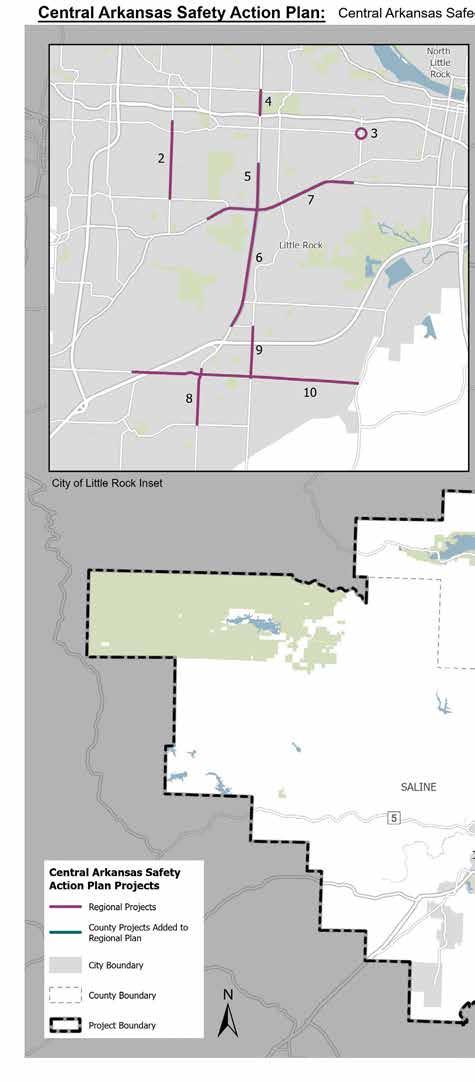
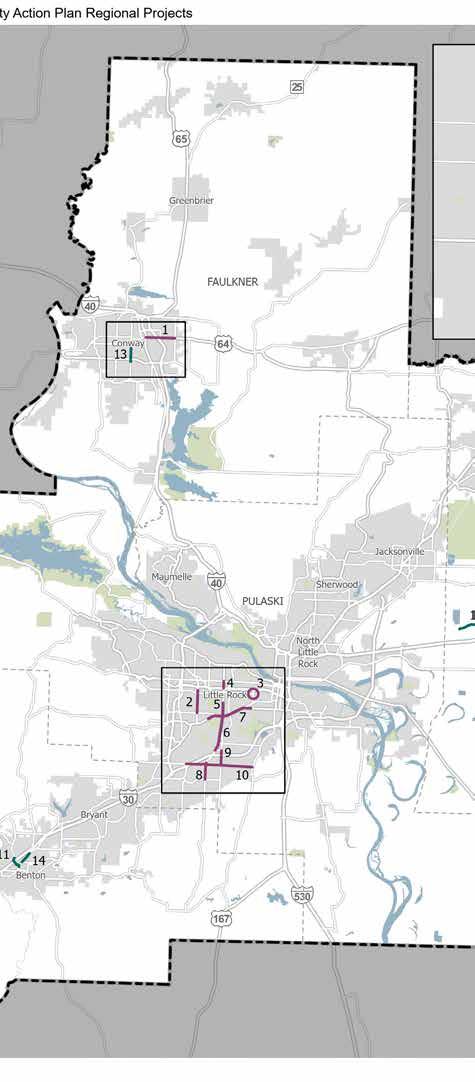
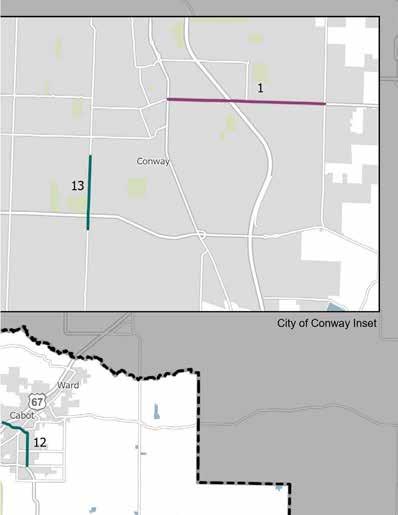
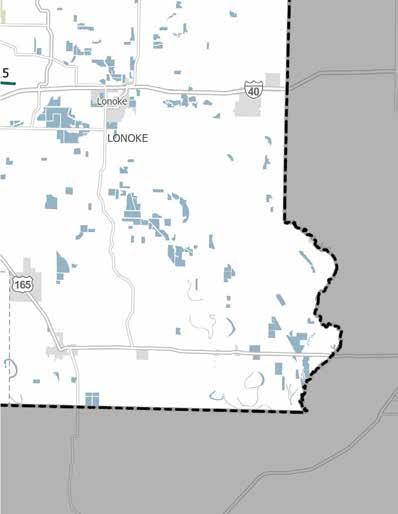
Note: The number next to each project location is simply to label the projects on the map and link them to the information provided in Table 7 and Table 8. These numbers do not represent any prioritization for the projects.

describe improvements that are widely implemented based on high-risk roadway features that are correlated with a particular crash types.
Systemic safety improvements describe improvements that are widely implemented based on high-risk roadway features that are correlated with a particular crash types. For example, segments on the HIN often had intersections with faded or missing pavement markings, often had limited lighting, and many had little or no access management in place. Safety countermeasures to address these types of roadway features should be applied to as many roadways as possible with similar features regardless of crash history. These type of system wide improvements can make a region safer by addresses roadway features that lead to common crash types before the crashes occur in some instances.
Recommended systemic improvements are provided in Table 9 through Table 13. While these safety countermeasures were identified through a reactive approach based on historic crash trends at particular locations, they can be applied across the transportation network with the goal of proactively addressing the same risks present elsewhere. The list of systemic improvements are accompanied by an anticipated timeframe for when the improvement could begin to be implemented. These timeframes include:
Immediate: < 1 year
Short: 1-2 years
Medium: 2-5 years
Long: 5+ years
Table 9 through Table 13 also identify proposed policies to support the recommended systemic improvements. These types of policies will allow the Region to proactively address safety issues on future projects by establishing policies that guide planning and design of transportation facilities with greater emphasis on safety for all road users.
Of the systemic improvements identified, some of the recommendations that came up most often during the engagement efforts as well during field reviews when examining the corridors with HIN segments are included below.
y Pavement Marking Improvements to address faded, worn, or non-existent cross walks and other markings at many intersections.
y Sidewalk Improvements to complete missing gaps, replace uneven and broken sidewalks, and widen sidewalks to meet ADA requirements.
y Lighting Improvements for Streets and Sidewalks to provide safer streets and roads for drivers, pedestrians, and bicyclists at night.
y Access Management to consolidate access pointes and reduce the number of turning movements on corridors and increase safety for pedestrians, bicyclists, and people in wheelchairs that travel along those streets.
Counter Measure and Timeframe
High Visibility
Crosswalk
Pavement Markings
Immediate
Leading Pedestrian Interval (LPI)
Immediate
Install high visibility crosswalk pavement markings (bar pairs, continental, or ladder pattern) using inlay or thermoplastic material across all paved approaches where there is sidewalk, including all roads and major commercial driveways.
Review signal timings at intersections with high pedestrian volumes, high turning vehicle volumes, or with a history of crashes involving a pedestrian. Adjust signal timings to reduce the time overlap between the pedestrian walk phase and the left-turn permissive phase and consider implementing an LPI.
Establish a requirement that all pedestrian crossings across roads and major commercial driveways must be identified with high visibility crosswalk markings that use inlay or thermoplastic material instead of paint.
Establish criteria for reducing the conflict between the pedestrian walk phase and left-turn phase and for when to implement an LPI.
FHWA recommends crosswalk patterns (bar pairs, continental, and ladder) that are more visible to drivers and pedestrians than the traditional transverse line crosswalks. Inlay or thermoplastic tape should be used instead of paint to make the markings highly reflective.
FHWA recommends implementing an LPI of three to seven seconds to allow pedestrians to begin crossing before vehicles enter the intersection, particularly at intersections with high turning vehicle volumes.
Sufficient
Pedestrian Crossing Time
Immediate
Accessible Pedestrian Signals (APS)
Short-Term
Review the pedestrian signal timings where pedestrians frequently cross or a crash involving a pedestrian has occurred and adjust the timings as necessary to ensure sufficient crossing time. Consider using a seven second minimum walk interval and a walking speed of less than 3.5 feet per second in determining the pedestrian clearance time.
Install APS at signalized pedestrian crossings.
Conduct a walking speed study to determine what the average walking speed is throughout the Region or around different land uses. Use this value to establish criteria for when to use a walking speed of less than 3.5 feet per second in determining the pedestrian clearance time.
The MUTCD recommends using a walking speed of less than 3.5 feet per second where pedestrians who routinely use the crosswalk walk slower or use wheelchairs.
Establish a requirement for APS at all signalized intersections with pedestrian crossings in future construction or as part of signal upgrades. Incorporate the addition of APS at signalized intersections into ADA transition plans.
MUTCD identifies factors relevant in determining whether a signalized intersection presents difficulties for pedestrians with vision disabilities and therefore may benefit from APS.7 The ADA requires effective communication and information access. FHWA identifies APS as a means to communicate information.
Counter Measure and Timeframe
Countdown
Pedestrian Signals
Short-Term
Install a countdown pedestrian signal at all signalized intersections where pedestrians are frequently present or a crash involving a pedestrian has occurred. Retrofit all existing basic pedestrian signals with a countdown pedestrian signal head.
Establish a requirement for countdown pedestrian signals at all signalized intersections with pedestrian crossings in future construction or as part of signal upgrades.
Medium-Term
Directional Ramps
Medium-Term
Install bikeways such as bike lanes and side paths along corridors where bicyclists are frequently present, crashes involving bicycles occur at a higher rate than normal, biking is the primary mode of transportation for many residents in the area, or there is a gap in the existing bike lane network.
Replace diagonal sidewalk access ramps with directional access ramps that align with the crosswalk.
Establish design guidelines and implementation criteria for various types of bikeway and buffers to separate vehicle travel lanes and bike lanes.
The MUTCD states that crosswalks with a pedestrian change interval of more than seven seconds shall include a countdown display in order to inform pedestrians of the remaining safe crossing time.
Pedestrian Lighting
Medium-Term
Add or improve lighting along sidewalks and walkways for pedestrians.
Establish a requirement that all future access ramps be directional and align with the crosswalk.
FHWA’s Bikeway Selection Guide recommends different types of bikeway designs for various applications and provides factors to consider when selecting what type of bikeway to construct. The Central Arkansas Regional Greenways Plan identifies proposed locations for pedestrians, bicyclists, and other nonmotorized vehicles.
The USDOT and US DOJ prefer the use of perpendicular curb ramps over diagonal curb ramps. Diagonal curb ramps may make it difficult to locate the clear space at the bottom of diagonal curb ramps that is outside active traffic lanes and the orientation can mislead people with vision impairments.
Develop a process for tracking and maintaining lighting assets along sidewalks and walkways for pedestrians. Establish a way for the public to report issues with pedestrian lights.
FHWA has developed recommended roadway luminance criteria based on a variety of factors to consider when assessing pedestrian lighting needs, including nearby land uses, roadway classification, crashes that occurred at night and crashes that involved pedestrians, and pedestrian and bicyclist volumes during hours of darkness.
Counter Measure and Timeframe
Sidewalks
Medium-Term
Sidewalk Buffers
Long-Term
Install sidewalks in areas where pedestrians are frequently present, crashes involving pedestrians occur at a higher rate than normal, walking is the primary mode of transportation for many residents in the area, or there is a gap in the existing sidewalk networks.
Where right-of-way or pavement is available, add a buffer zone of four to six feet between the road and sidewalk should be constructed to separate pedestrians from the street. The buffer zone may be created using bicycle lanes, street parking, a grass strip, or street furniture.
Establish a policy that requires sidewalks on future construction to be at least five feet wide if set back from the curb or six feet if at the curb face.
FHWA recommends a minimum width of five feet for sidewalks set back from the curb and six feet for sidewalks at the curb face. Five feet is the bare minimum width for two people to walk next to each other or for two people to pass each other.
Establish a requirement for future sidewalk construction that a buffer zone of four to six feet be used to separate pedestrians from the street where sidewalk is present and right-of-way is available.
FHWA recommends a buffer zone of four to six feet. The buffer zone width and material varies depending on the street type. In downtown or commercial areas a buffer zone created with street furniture is usually appropriate. Parked cars and bicycle lanes can provide an additional buffer zone. In more suburban or rural areas, a grass strip, with or without trees, is generally most suitable.
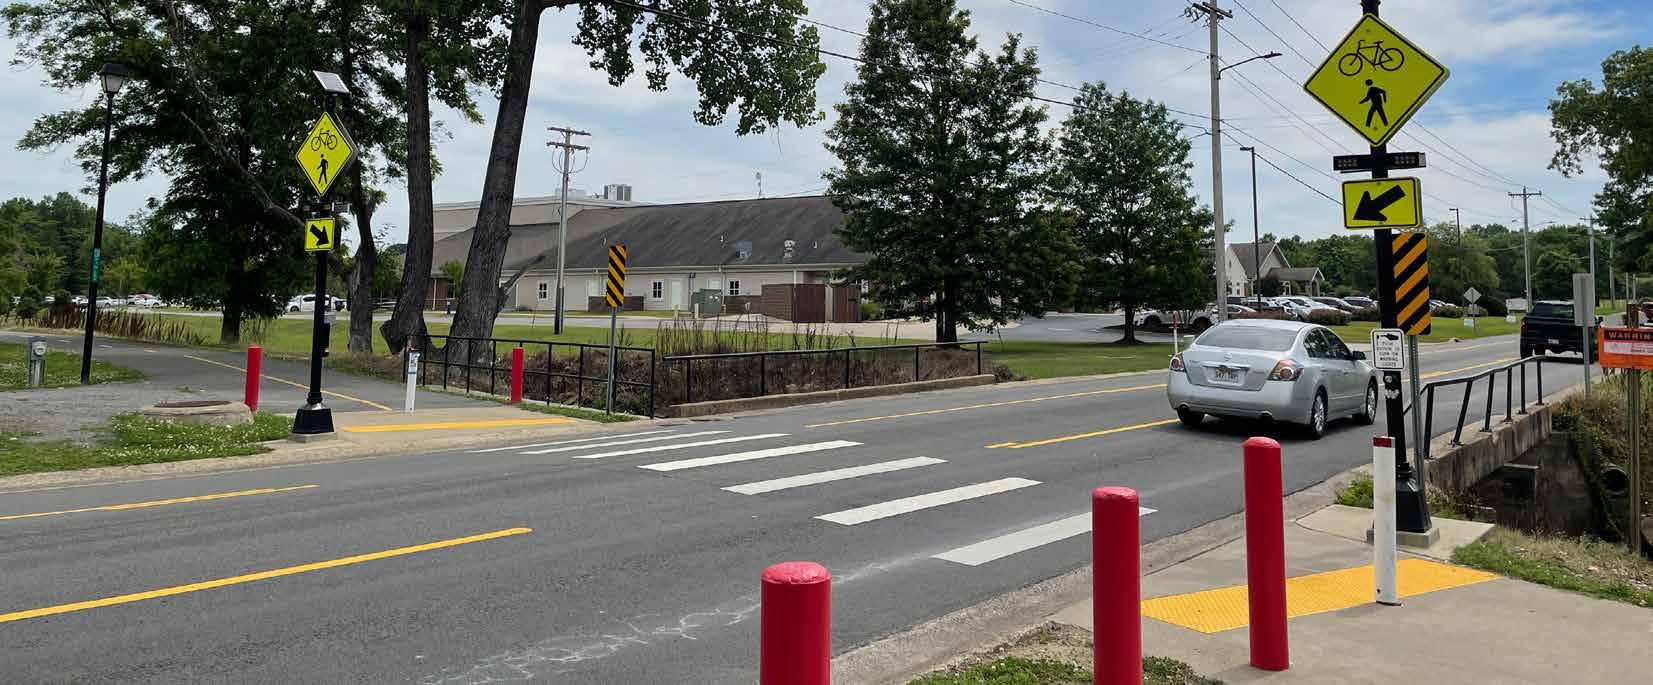
Table 10: Recommended Systemic Improvements and Proposed Supporting Policies to Support Vehicular Travel Safety
Counter Measure and Timeframe Systemic Improvement
General Pavement Markings
Immediate
Restripe pavement markings that are faded, worn away, or do not meet the minimum retroreflectivity specified in the MUTCD.
Develop a process for maintaining and tracking the conditions of pavement markings.
The MUTCD requires a minimum retroreflectivity of longitudinal pavement markings on roadways with a posted speed limit of 35 mph or greater. FHWA has identified methods for assessing pavement marking retroreflectivity when considering restriping pavement markings during the maintenance process.
Retroreflective Backplates
Immediate
Stop Bar Pavement Markings
Short-Term
Intersection and Corridor Lighting
Short-Medium
Add backplates with retroreflective borders to all traffic signal heads.
Add stop bar pavement markings at all controlled approaches to traffic signals and stop signs, as well as in advance of signalized midblock pedestrian crossings, to indicate where vehicles must stop when the stop condition is present.
Replace existing streetlights that are out. Install LED streetlights at intersections and along corridors where the frequency of nighttime crashes is higher than normal, there are high pedestrian and bicyclist volumes.
Establish the requirement that all traffic signal heads must have retroreflective backplates.
Establish the requirement that all approaches to traffic signals and stop signs, as well as in advance of midblock pedestrian crossings, must have a stop bar pavement marking to indicate where vehicles must stop.
Develop lighting design standards to ensure adequate lighting coverage in future construction. Develop a process for maintaining streetlights and tracking lighting assets at intersections and along corridors. Establish a way for the public to report issues with streetlights.
FHWA recommends a yellow retroreflective border with a width of one to three inches.
The MUTCD recommends that stop lines should be placed a minimum of four feet in advance of the nearest crosswalk line at controlled intersections. Stop lines at midblock signalized locations are recommended to be placed at least 40 feet in advance of the nearest signal indication.
The 2023 FHWA Lighting Handbook provides roadway lighting design and application recommendations. This includes factors to consider from the AASHTO Roadway Lighting Design Guide Warranting System such as traffic volume and night-to-day crash ratio, as well as geometric and operational factors such as number of lanes, lane widths, turn lanes, and speed.
Counter Measure and Timeframe
Consistent Left-Turn Signal Indication
Medium-Term
Update left turn signal indications to be consistent throughout the Region. Consider using all arrow indications for left-turn lane signals consisting of a steady red arrow, steady yellow arrow, flashing yellow arrow (only for protected/permissive left-turn conditions) supplemented with a “left turn yield on flashing yellow arrow” sign, and steady green arrow.
Establish a standard left-turn signal indication and develop design guidelines and criteria for left-turn signal treatments.
FHWA has found that converting the green ball indication for left-turns during the permissive phase to a flashing yellow arrow reduces the number of left-turn related crashes. Drivers turning left frequently mistake the green ball indication as implying that the left turn has the right-of-way over opposing traffic. The 11th Edition of the MUTCD includes design guidelines for the implementation of flashing yellow arrow signal indications.
Medium-Term
Long-Term
When addressing access management, where TWLTLs exist and head-on and sideswipe crashes occur at a higher than normal rate consider converting TWLTLs to dedicated left-turn lanes or installing raised medians to restrict left-turns into and out of commercial driveways.
Consolidate access points to remove commercial driveways within an intersection and to reduce the density of access points along a corridor. If a driveway at the corner of an intersection is the only access point for a business, the driveway should be relocated to the intersection approach corner rather than a receiving corner, if possible. Consider constructing raised medians to restrict driveways to right-in right-out if the driveway location cannot be improved.
Develop criteria for when to implement TWLTLs vs dedicated left-turn lanes.
Develop access management guidelines by establishing a minimum spacing requirement between driveways and establishing a minimum spacing requirement between driveways and intersections.
TWLTLs are most effective where traffic volumes are low and there are few access points in a concentrated area, such as signalized intersections and unsignalized approaches. Raised medians are accepted as a safer treatment under almost all other conditions. NCHRP has developed procedures for evaluating and selecting median treatments.
AASHTO states that driveways should not be situated within the functional boundary of at-grade intersections. Therefore, NCHRP developed criteria for access separation distances based on posted speed limits and spill back rates.
Table 11: Recommended Systemic Improvements and Proposed Supporting Policies to Support Transit
Counter Measure and Timeframe
Bus Stop Study
Short-Term
Conduct a bus stop study to determine the optimal bus routes and locations for bus stops. Consider consolidation and relocation of bus stops to be near existing crosswalks or install high visibility crosswalks near the bus stops.
Establish bus stop design guidelines that include recommendations and criteria for bus stop spacing, distance from intersections, and distance from a signalized crossing.
The Metroplan Multimodal Infrastructure Guidelines provide guidance on bus stop design including floating bus stops, bus bulbs, pull-out stops, and bus shelters.
Table 12: Recommended Systemic Improvements and Proposed Supporting Policies to Support Emergency Services
Move Over Law
Immediate
Deploy Move Over signage along corridors with higher than normal severe crash rates, as severe crashes require more responders for a longer duration, such as roads on the Regional HIN.
Prepare and distribute educational materials instructing drivers on how to obey the Move Over law and issue warnings or citations to offenders.
FHWA identified an enforcement strategy for Move Over laws used in multiple states that involves deploying law enforcement personnel in pairs as part of targeted operations so that one officer can monitor vehicle speeds while another responds to a minor crash or stranded motorist.
Crash Review
Short-Term Not Applicable
Establish a multi-disciplinary crash review task force to review all fatal and serious injury crashes immediately following the incident, and based on these reviews recommend changes to existing infrastructure and policy that could reduce the likelihood of future crashes.
For example, the Washington, DC task force has met monthly since 2017 to review all fatal crashes that the DC police responded to. The task force conducts both data analysis and individual crash report reviews to prepare an annual summary of recommendations for the mayor, and city and county staff.
Counter Measure and Timeframe
Digital Alert System
Short-Term
Emergency Preemption
Medium-Term
Install alert systems in all first responder vehicles that can send real-time alerts digitally to approaching drivers. These systems may also communicate between responding vehicles to reduce the risk of collision between responder vehicles.
Deploy emergency vehicle preemption technology along major arterial corridors that provide access to and from emergency medical service facilities, and police and fire stations.
Establish requirement for use of alert systems for all emergency vehicles in Central Arkansas.
Develop agency policies that describe the appropriate use of emergency vehicle preemption systems.
Use of these systems may also improve compliance with Arkansas’ Move Over Law by providing more advanced notice of stopped first responder vehicles.
Emergency Response Vehicle Driving Simulator
Medium-Term
Create an emergency response vehicle driving simulator to provide first responders with additional training.
Establish requirement for minimum training hours for all emergency vehicle drivers in Central Arkansas.
Incident responders surveyed in seven of nine cities with emergency preemption deployments rated the benefits of the technology between “moderate” and “very high” in improving emergency response times and incident access. The MUTCD contains standards for implementing timing for preemption and priority control of traffic signals.
Emergency response agencies should begin identifying potential space and opportunities for sharing simulator for multiple first responders in Central Arkansas to minimize cost.
Table 13: Recommended Systemic Improvements and Proposed Supporting Policies to Support Driver Behavior Safety Improvements
Counter Measure and Timeframe
Speed Feedback Signs
Short-Term
Deploy dynamic speed feedback signs along corridors where speeding or speed related crashes frequently occur.
Enhance speed enforcement capabilities by reviewing enforcement measures. Consider increased penalties for repeat speeding offenders. Promote the Speeding Slows You Down campaign.
In January 2023, FHWA published the Speed Safety Camera Program Planning and Operations Guide to help jurisdictions plan, deploy, and operate speed safety camera programs. In July 2023, Arkansas legalized the use of speed safety cameras that can capture images of speeding vehicles in interstate work zones and transmit information to an officer downstream who can issue a citation. NHTSA has developed material for the high-visibility enforcement mobilization campaign, Speeding Slows You Down.
Share the Road
Short-Term
Yielding to Pedestrians
Short-Term
Deploy additional bicyclesupportive signage and pavement markings along corridors where bicyclists are frequently present, crashes involving bicycles occur at a higher rate than normal, biking is the primary mode of transportation for many residents in the area, or there is a gap in the existing bike lane network.
Develop design guidelines for signage and pavement markings that mark where bicyclists share the lanes with vehicles. Develop a campaign to urge motorists, as well as vulnerable road users, to be always aware of all types of road users around them.
Establish a way for the public to report near-miss crashes involving pedestrians and bicyclists.
NHTSA has developed tips for drivers, motorcyclists, bicyclists, and pedestrians on how to safely share the road.
Bicycle and Motorcycle Helmets
Implement in-street yield signage in the median at midblock and unsignalized intersection crosswalk locations and implement similar roadside signage at channelized right turn lane locations.
Medium-Term Not Applicable
Distribute educational material and conduct high visibility enforcement to reinforce yield to pedestrian laws at crosswalk locations with high pedestrian use and at newly implemented crosswalks.
Enact universal coverage policies that require bicycle and motorcycle helmet use for all ages. Support adoption of these behaviors with concurrent education campaigns.
The MUTCD Figure 2B-2 identifies recommended signage for unsignalized pedestrian crosswalks.
NHTSA recommends various safety practices for all motorcycle riders and bicyclists, including always wear a helmet. NHTSA has found that states with universal motorcycle helmet coverage laws had 53% higher rates of helmet use and 29% fewer motorcycle fatalities.
Serious commitment from all leaders in the Central Arkansas towards the 40 by 40 goal could mean a dramatic decrease in fatal and serious injury crashes in the Region in the coming years. And by proving a 40 percent reduction is possible, the goal of zero fatal and serious injury crashes will seem more achievable than ever.
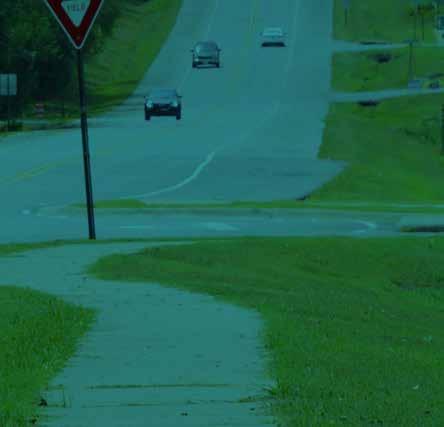


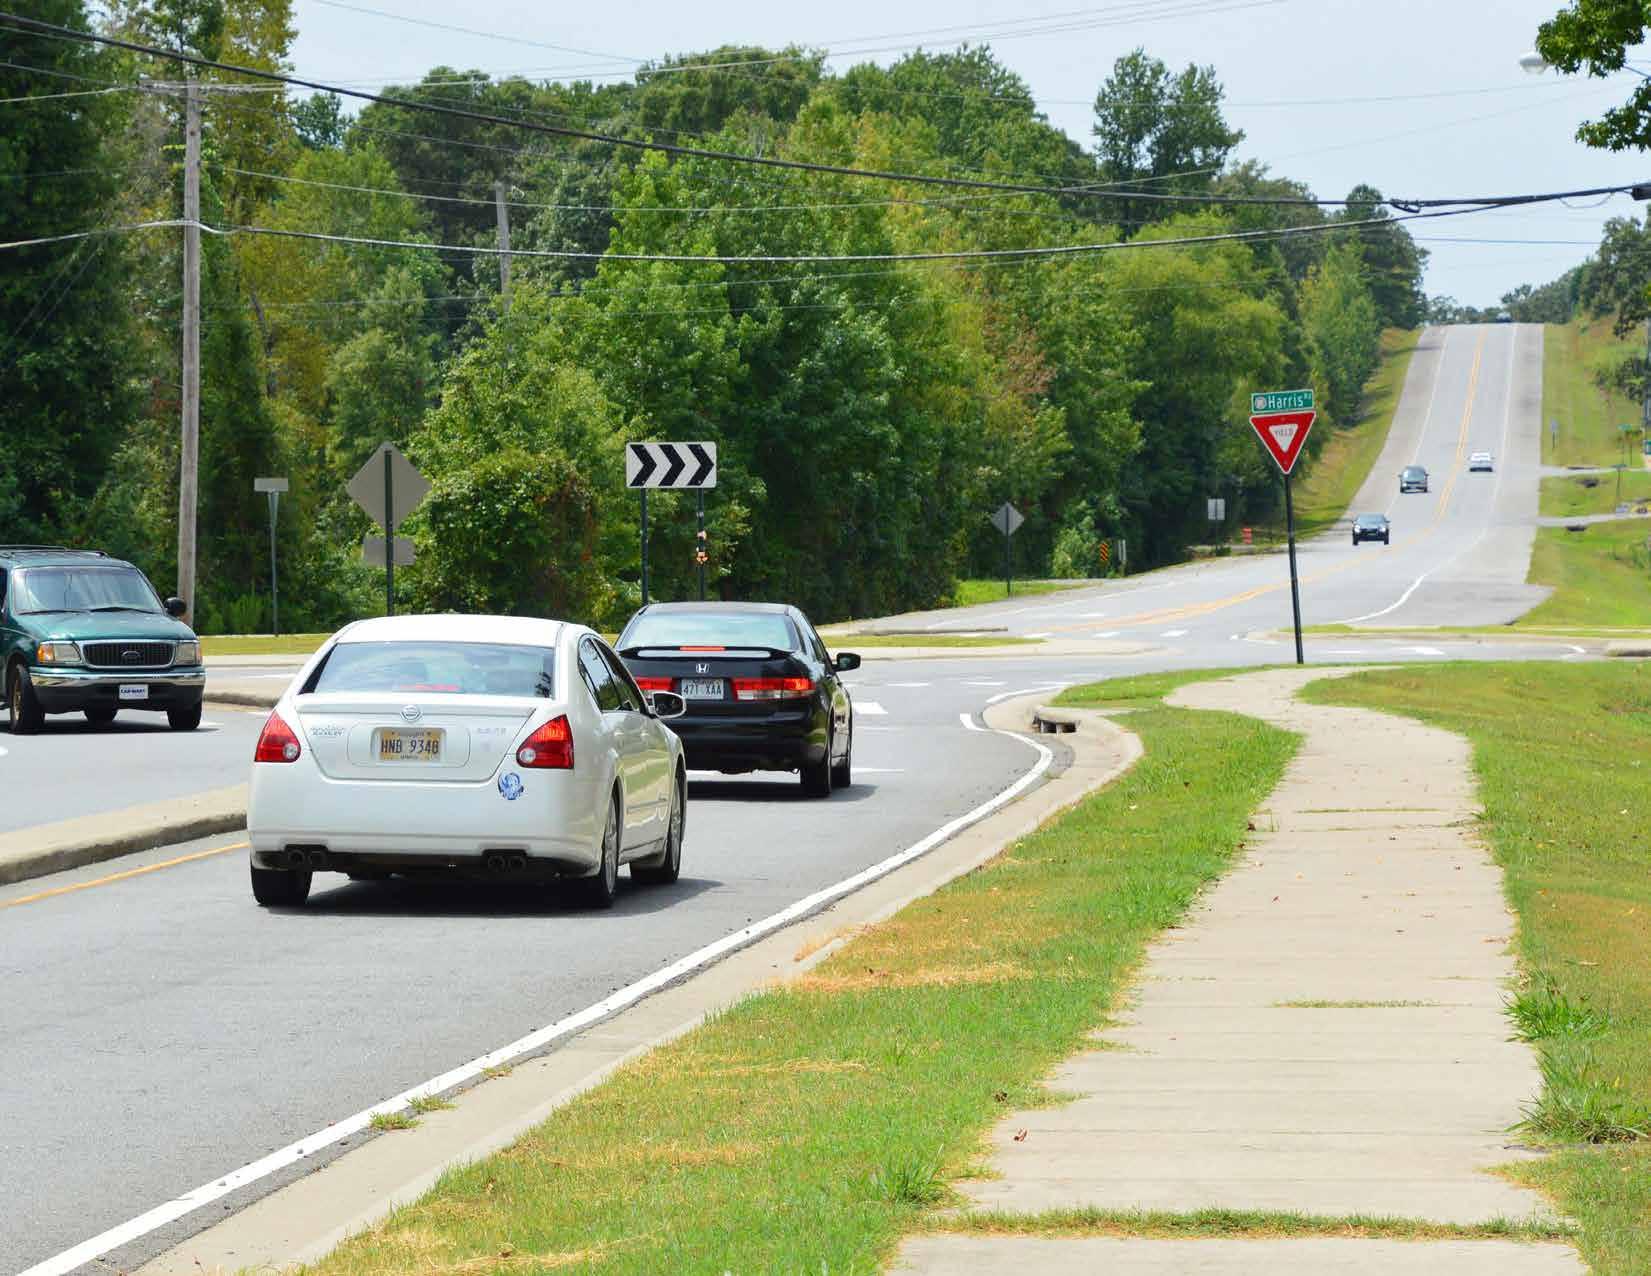
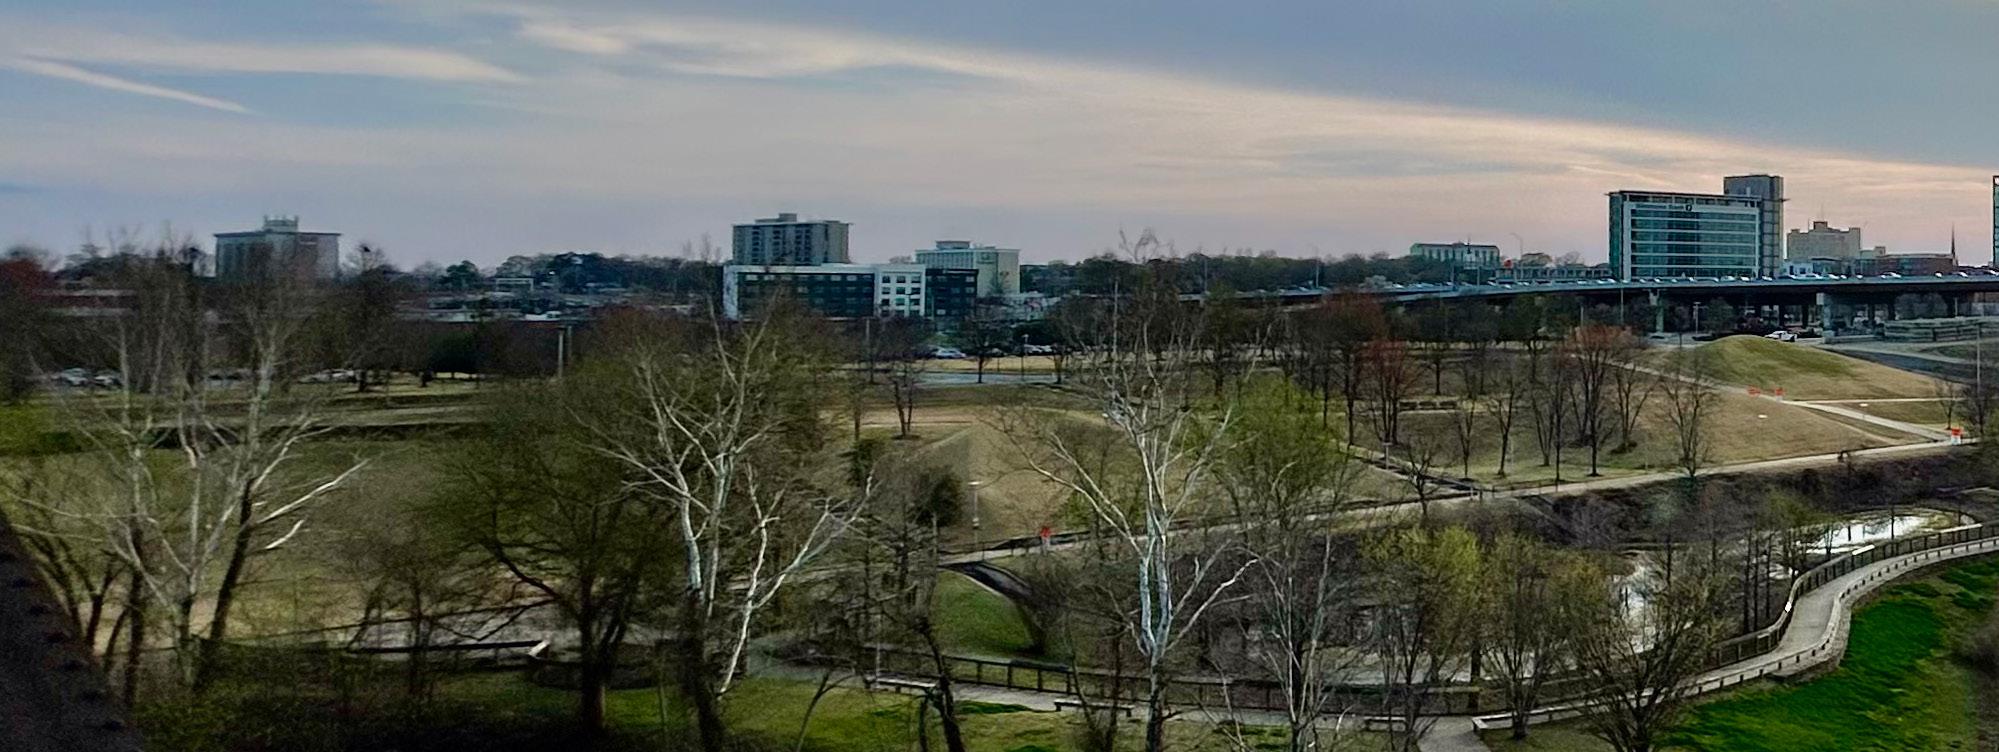
Implementation is the real key to any planning effort. The Safety Action Plan was developed with input from hundreds of people across Central Arkansas and the commitment of the Metroplan Board to achieving its goals. But ultimately, success of the plans lies in the ability to implement its recommendations. Metroplan and its member agencies have committed to the 40 by 40 goal for reducing fatal and serious injuries in Central Arkansas, have committed to reporting and transparency of progress, and have committed to taking action.
Completion of the Safety Action Plan allows
the Region to pursue additional funding for implementation through the USDOT’s SS4A Program. This funding is very important toward achieving the 40 by 40 goal, but it alone will not get the Region far enough. Central Arkansas needs to prioritize safety when selecting projects at the local, regional, and state level. Policies that can create a greater focus on safety, both in the current operations of the transportation system and in future maintenance and construction activities, need to be established. And safety needs to remain at the forefront of conversations anytime transportation is discussed in the Central Arkansas.
Serious commitment from all leaders in the Central Arkansas towards the 40 by 40 goal could mean a dramatic decrease in fatal and
serious injury crashes in the Region in the coming years. And by proving a 40 percent reduction is possible, the goal of zero fatal and serious injury crashes will seem more achievable than ever.
Regular reporting and communication of progress towards the 40 by 40 goal is necessary as the Region strives to ultimately reach zero fatal and serious injury crashes. With milestone set every five years to reach the 40 percent reduction by 2040, close tracking of the Region’s accomplishments (and setbacks) will be important to document every year.
As part of the Central Arkansas Safety Action

The Safety Action Plan was developed with input from hundreds of people across Central Arkansas and the commitment of the Metroplan Board to achieving its goals. But ultimately, success of the plans lies in the ability to implement its recommendations.

Plan, a dashboard was created to track implementation of the Plan and report on progress towards the 40 percent reduction. The dashboard provides fatal and serious injury statistics and keeps a focus on the Regional HIN and prioritized locations for projects. Additionally, the dashboard displays the past trends of fatal and serious injury statistics, allowing for year-to-year comparisons to track progress.
By providing this information through a user-friendly dashboard, the public can stay informed about the efforts being made to improve road safety in Central Arkansas. This promotes transparency in achieving the goal of reducing fatal and serious injury crashes, and transparency leads to results.
In addition to the dashboard reporting, fatal
and serious injury crashes in the central Arkansas region will be tracked annually by Metroplan and reported as part on the performance measure requirements. The HIN will also be analyzed with each update of the Safety Action Plan to ensure safety priorities are aligned with the most current crash data. Vulnerable road users have been a safety priority for Metroplan and will continue to be a focus of safety measures based on crash data. Metroplan will also continue to collaborate with ARDOT and the State Highway Safety Office on analyzing and reporting progress and safety metrics.
Developing the Safety Action Plan is an important step towards achieving zero
fatal and serious injuries, but the real work begins with implementation of the Plan. Implementation will require a continued focus and commitment towards safety every single day. The Metroplan Board, Metroplan member agencies, SAPAC members, and the public that were engaged in the process have all agreed that deaths and serious injuries on streets and roads in Central Arkansas are not acceptable. The Metroplan Board has committed to the 40 by 40 goal knowing it is ambitions, but achievable. The challenge is now to remain focused on that goal and move Central Arkansas towards a place where no person is ever killed or seriously injured as they travel about the Region.
Pulaski County
Pulaski County Continued
Pulaski County Continued
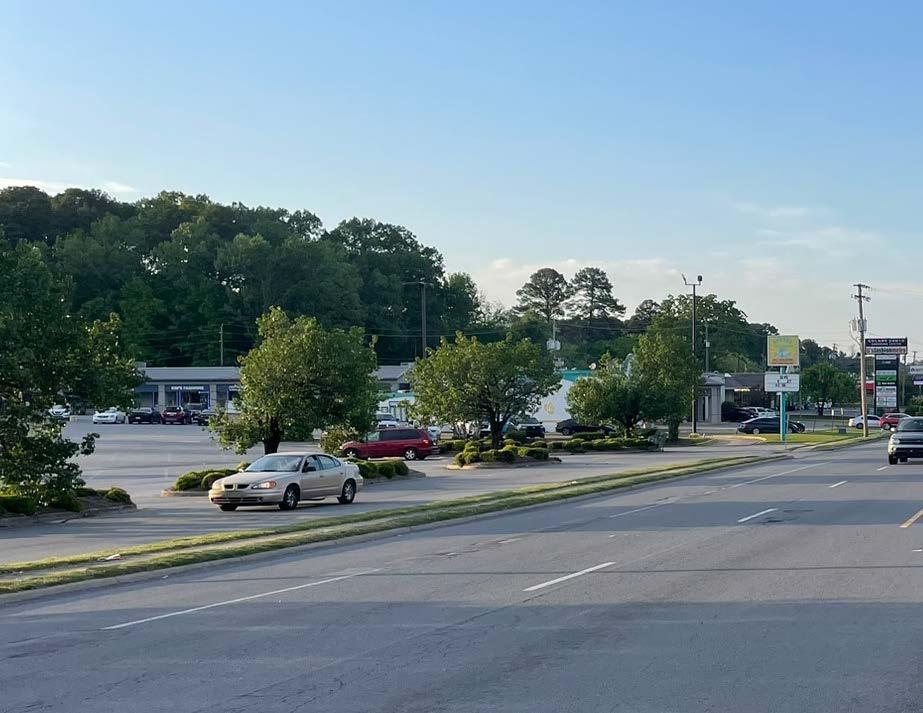
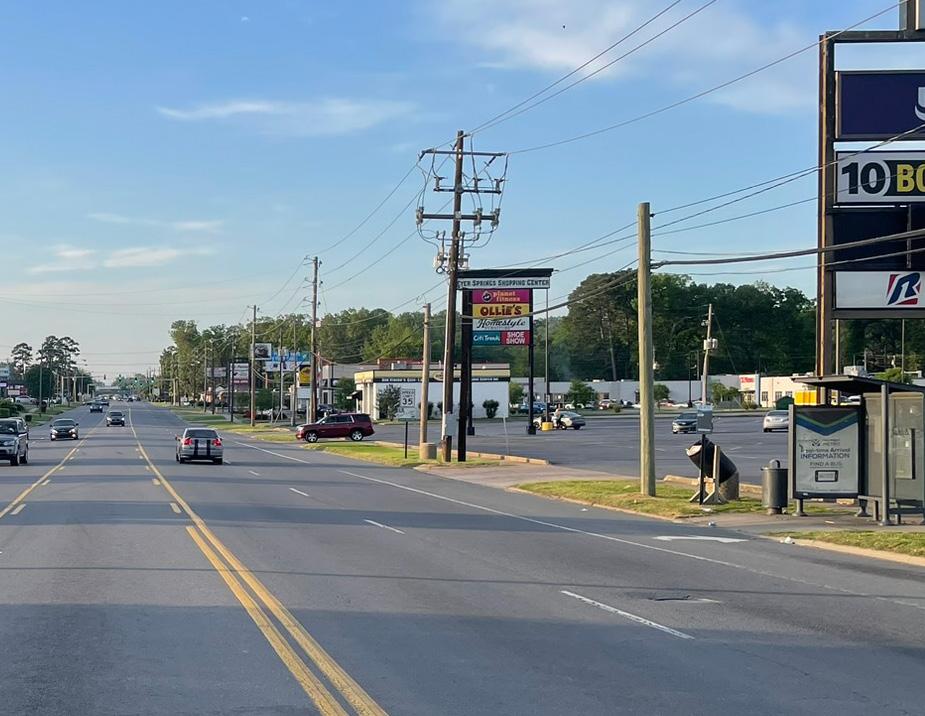
Segment: From Harkrider St to German Ln • Jurisdiction: City of Conway
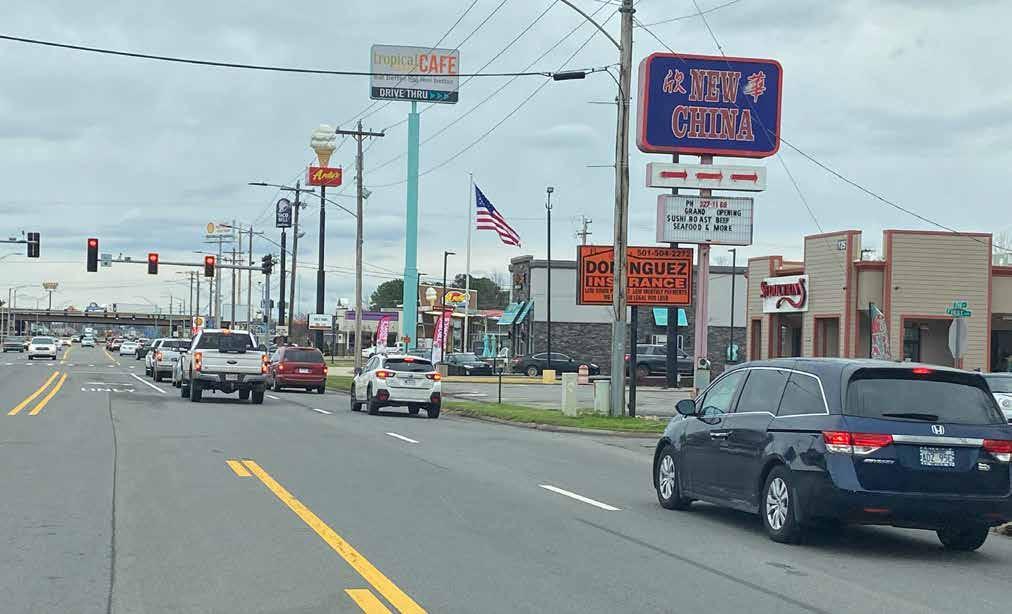
This two mile section of Oak St consists of two HIN segments and two High Injury Intersections, at Harkrider St and Elsinger Blvd, that scored in the top 20 segments and top 20 intersections for safety improvement needs in the Region. This section of Oak St has numerous access points to businesses and at intersecting minor streets. Most of the public comments along this section of Oak St were about congestion and difficulties with turning left onto and off of Oak St. Drivers find it hard to turn left at signalized
intersections and business driveways. Over 40 percent of the fatal and serious injury crashes along this section of Oak St were angle crashes and over 60 percent of all crashes were at intersections, both likely due to the high concentration of access points.
One of the two fatal crashes at this project location involved a pedestrian and of the 20 serious injury crashes, five involved a pedestrian or bicyclist, likely due to gaps in sidewalk at driveways and the lack of protected crossings and bike facilities. Nearly a quarter of all crashes involving a pedestrian
or bicyclist were reported between dusk and dawn. Field observations and public comments lead to the identification of insufficient lighting along this section of Oak St. The crash data for all crash types supported this, with over 40 percent of the fatal and serious injury crashes occurred between dusk and dawn.
All of the countermeasures identified for the Oak St project are recommended to address crashes that occur in the dark or at intersections and commercial driveways, crashes involving pedestrians and bicyclists, and left-turn operations. Due to the high number of public comments, serious injury crashes, crashes involving vulnerable road users, and overall high total number of crashes between the intersections of Oak St at Amity Rd and Elsinger Blvd, a more detailed road safety audit (RSA) is recommended for these intersections to look more closely at the existing conditions to identify site specific countermeasures that may have a greater impact on improving safety and operations.
Oak Street Ahead! is the City of Conway’s plan for improvements along Oak St, developed by studying the transportation, land use, and urban design conditions. This plan was adopted on March 28, 2023 and includes many of the countermeasures recommended along this corridor in this Central Arkansas Safety Action Plan, such as consolidating access points. Most of the businesses along Oak St between Harkrider St and Gum St can be accessed via Merriman St or Polk St.
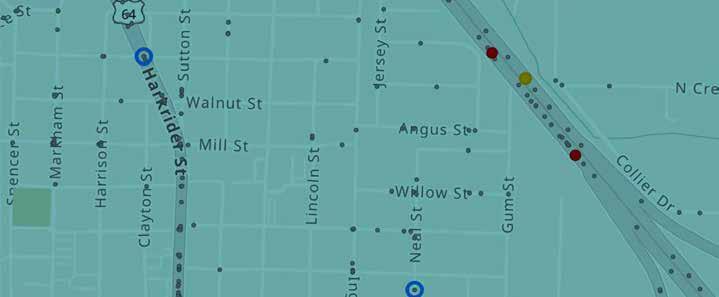
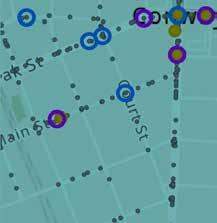
The Central Arkansas Regional Greenway Plan proposes a greenway trail along Little Creek that could provide connectivity to the bike lanes and improved sidewalk recommended in this Oak St project. A planned grade separated crossing at this greenway connection has been funded and will allow pedestrians and bicyclists to safety cross Oak St where there is limited existing infrastructure for vulnerable road users. This may also help alleviate the heavy vehicle congestion near the intersections at Amity Rd and Elsinger Blvd by removing the need for a protected crossing phase for pedestrians.
Upcoming construction along German Ln will include the addition of sidewalk along both sides of German Ln between Oak St and Mockingbird Ln. To the north of Oak St, E. German Ln only has sidewalk along the east side, however a higher density of homes and apartments, and Simon Middle School exist on the west side with no way to safely cross to the sidewalk between the signals at
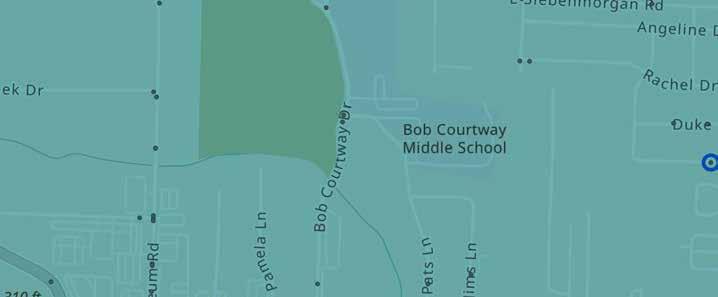
Fatal Serious Injury Minor Injury
Crash Severity Count Within Project Area 2 20 91 1,464 Total for All Crash Severities
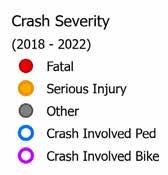
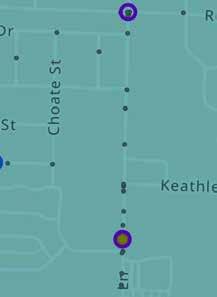
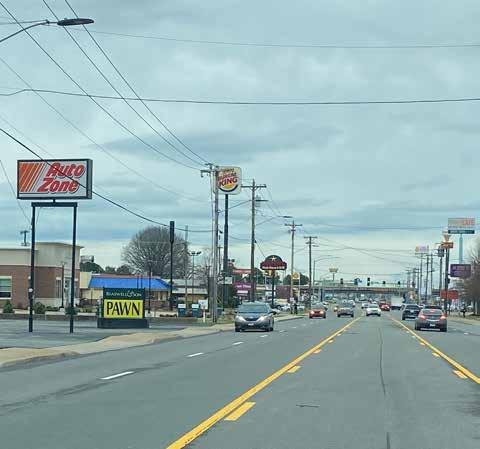
Oak St and Siebenmorgen Rd/Rumker Rd. Therefore, it is recommended that sidewalk be installed along the west side of E. German Ln north of Oak St to support pedestrian access to neighborhoods and Simon Middle School.
Bikeway (Separated from Vehicular Traffic) Entire Section
High Visibility Crosswalk Pavement Markings 9 Signalized Intersections
Add/Improve Sidewalk German Ln
Sidewalk Buffer Entire Section
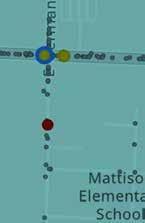
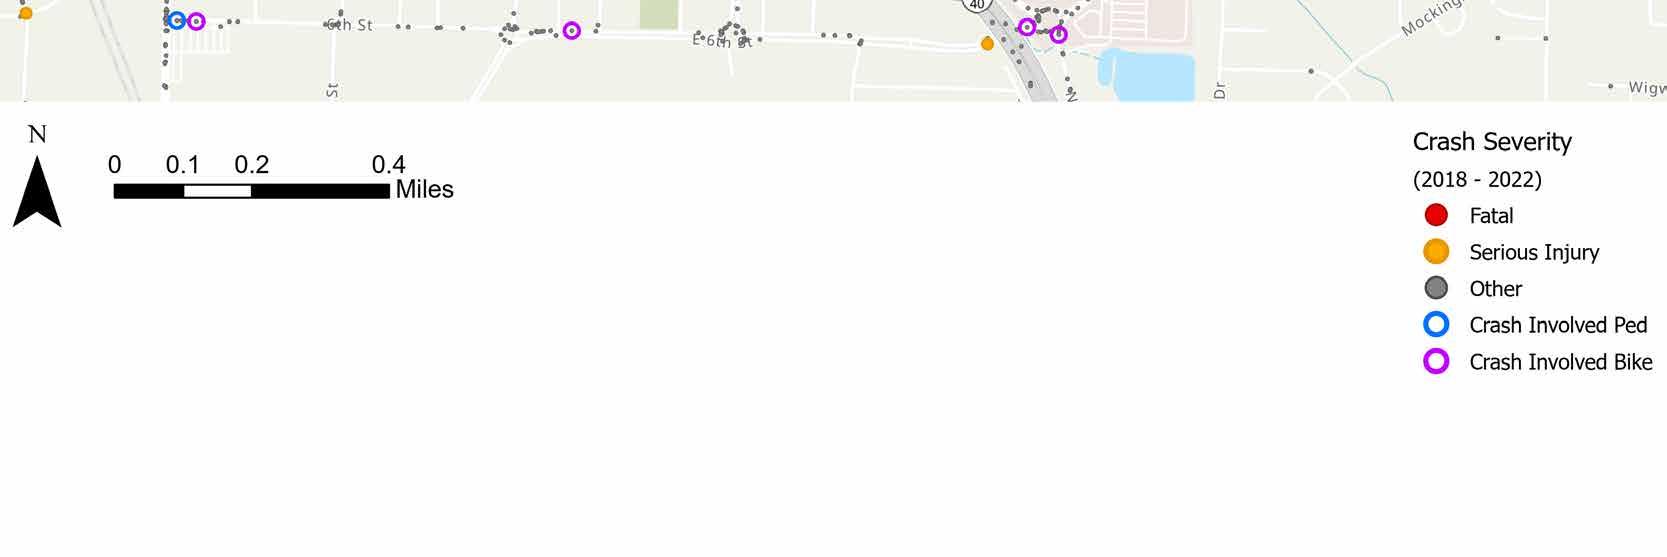
Install Pedestrian Signal at Signalized Intersection Central Landing Blvd
Grade Separated Crossing (Currently Planned and Funded) Little Creek Vehicular Countermeasures
Retroreflective Backplates 4 Signalized Intersections
Access Management Entire Section
Safety Lighting Entire Section
Add/Improve Pavement Markings (Add stop bar and crosswalk pavement markings across all minor street approaches to Oak St where there is a stop condition and sidewalk) Entire Section
Traffic Signal
Intersection Geometry Adjustments Central Landing Blvd Northbound Approach
Other Countermeasures
Further Study Needed (RSA) Intersections at Amity Rd and Elsinger Blvd
From Carti Way to 36th St • Jurisdiction: City of Little Rock

This 1.5 mile section of John Barrow Rd consists of one HIN segment that scored in the top 20 HIN segments with safety improvement needs and connects two of the top 20 High Injury Intersections with safety improvement needs in the Region, at Kanis Rd and at 36th St.
Most of the public comments along this section of John Barrow Rd were about the lack of designated crossing locations near Rock Region Metro bus stops and for students walking to and from nearby schools. There are no signalized crossings within the 0.55 mile gap between the traffic signals Kanis Rd and Flanigan Ln or within
the 0.8 mile gap between the traffic signals at Flanigan Ln and 36th St. Rock Region Metro has at total of 26 bus stops along both sides of John Barrow Rd between Kanis Rd and 36th St that serve multiple schools and neighborhoods.
Although the access points are less dense along this section of John Barrow Rd than most of the other project locations, there are multiple driveways within the vicinity of the intersection at Kanis Rd and 36th St. This is likely a key contributor to the 60 percent of all crashes within this project’s extents having occurred at an intersection, including two fatal and nine serious injury crashes. Over 38 percent were rear-end crashes and
almost 31 percent were angle crashes. Drivers may be speeding or following too close and are not prepared for a vehicle to pull into the intersection approach from a driveway or do not slow down in time when the vehicle in front of them unexpectedly turns into a driveway instead of continues to the intersection.
All of the countermeasures identified for the John Barrow Rd project are recommended to address crashes that occur at intersections and along the bus route, crashes involving pedestrians and bicyclists, and crashes that occur at night.
Drivers may be speeding or following too close and are not prepared for a vehicle to pull into the intersection approach from a driveway.
Bikeway (Separated from Vehicular Traffic) Entire Section
High Visibility Crosswalk Pavement Markings 2 Signalized Intersections
Rectangular Rapid Flashing Beacon (RRFB) with Pedestrian Refuge Medians/Islands 2 Midblock Crossings
Sidewalk Buffer Where Possible
Convert Diagonal Ramps to Directional Ramps Entire Section
Retroreflective Backplates 3 Signalized Intersections
Access Management 2 Intersections
Safety Lighting Entire Section
Adjust Signal Timings (Add Leading Pedestrian Interval (LPI) 36th St
Bus Stop Bulb-Outs Entire Section
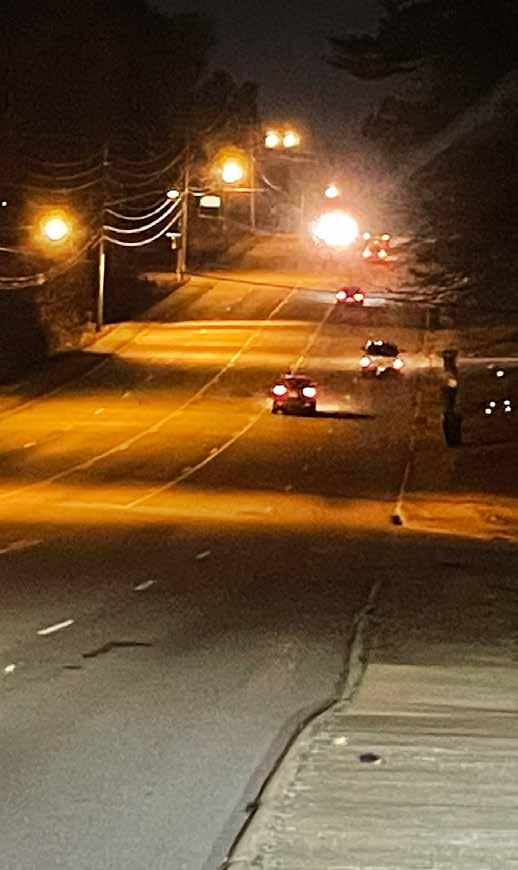
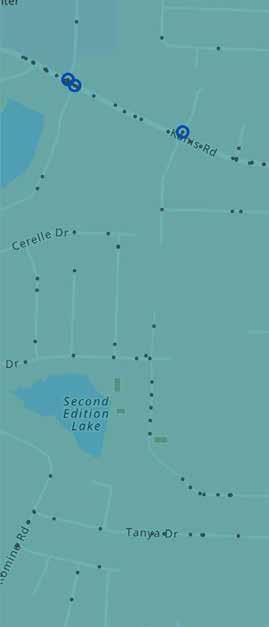


Intersection: Woodrow St and 12th • Jurisdiction: City of Little Rock
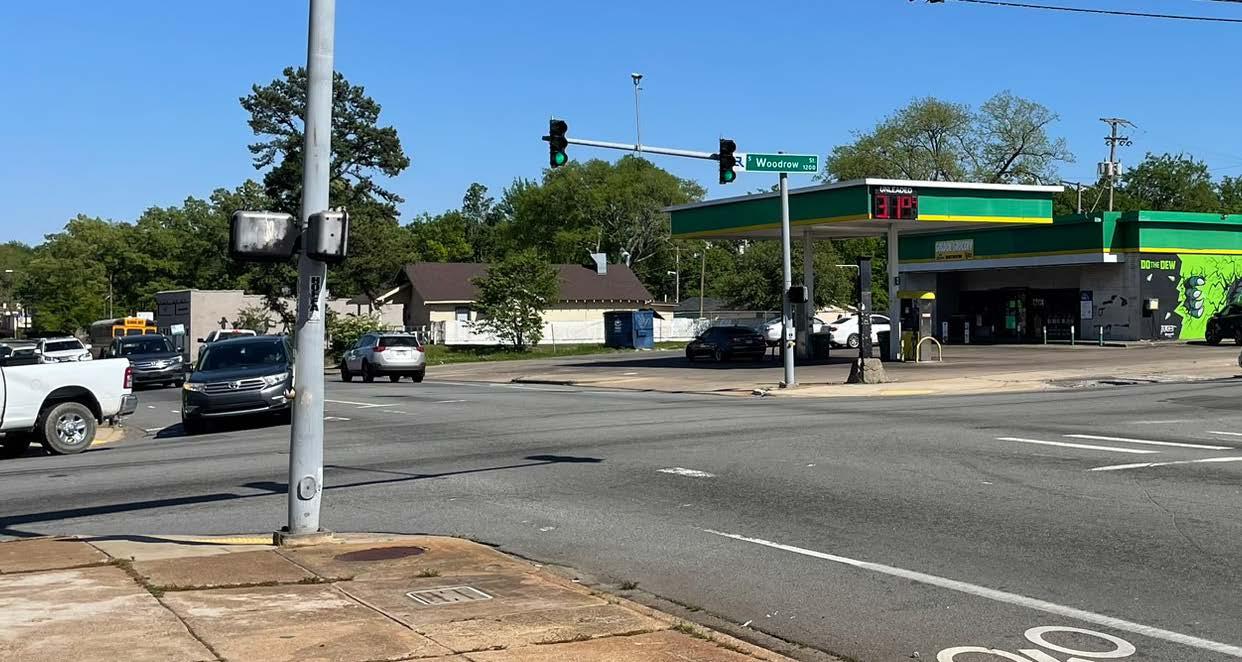
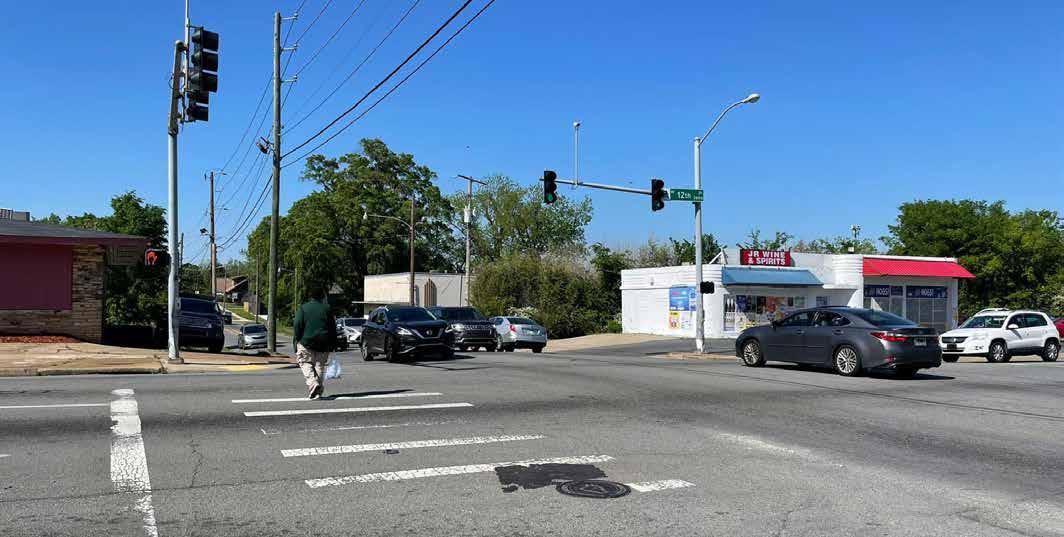
This intersection of Woodrow St and 12th St is the only High Injury Intersection that scored on the top 20 intersections in the Region for safety improvement needs that was not located along one of the HIN segments that scored in the top 20. This intersection provides access to local businesses and neighborhoods, contains bus stops for Rock Region Metro Route 3, and is near Little Rock Central High School.
Four of the five fatal and serious injury crashes at this intersection involved a pedestrian, likely due to inadequate pedestrian infrastructure at the intersection including worn crosswalk pavement markings and narrow, deteriorating sidewalks with many breaks for driveways. About 70 percent of all crashes at this intersection were reported between dusk and dawn including four of the five pedestrian crashes. Based on field review the intersection has insufficient lighting, which is likely a key cause of the high frequency of nighttime crashes.
All of the countermeasures identified for this stand-alone intersection project are recommended to improve safety for vulnerable road users that pass through the intersection of Woodrow St and 12th St.
The Central Arkansas Regional Greenway Plan proposes the existing bike lanes along 12th St become part of the greenway and connect to future trails along the Union Pacific Railroad and Johnson St that are also proposed in the Greenway Plan.
About 70 percent of all crashes at this intersection were reported between dusk and dawn including four of the five pedestrian crashes.
Bike Lanes Along Woodrow St
High Visibility Crosswalk Pavement Markings Entire Intersection
Add/Improve Sidewalk Along Woodrow St and 12th St
Sidewalk Buffer Where Possible
Convert Diagonal Ramps to Directional Ramps Entire Intersection Vehicular Countermeasures
Retroreflective Backplates Entire Intersection
Access Management Relocate Driveways Away from Intersection
Safety Lighting Entire Intersection
Add Advance Warning Signage In Advance of Crossings and Bus Stop


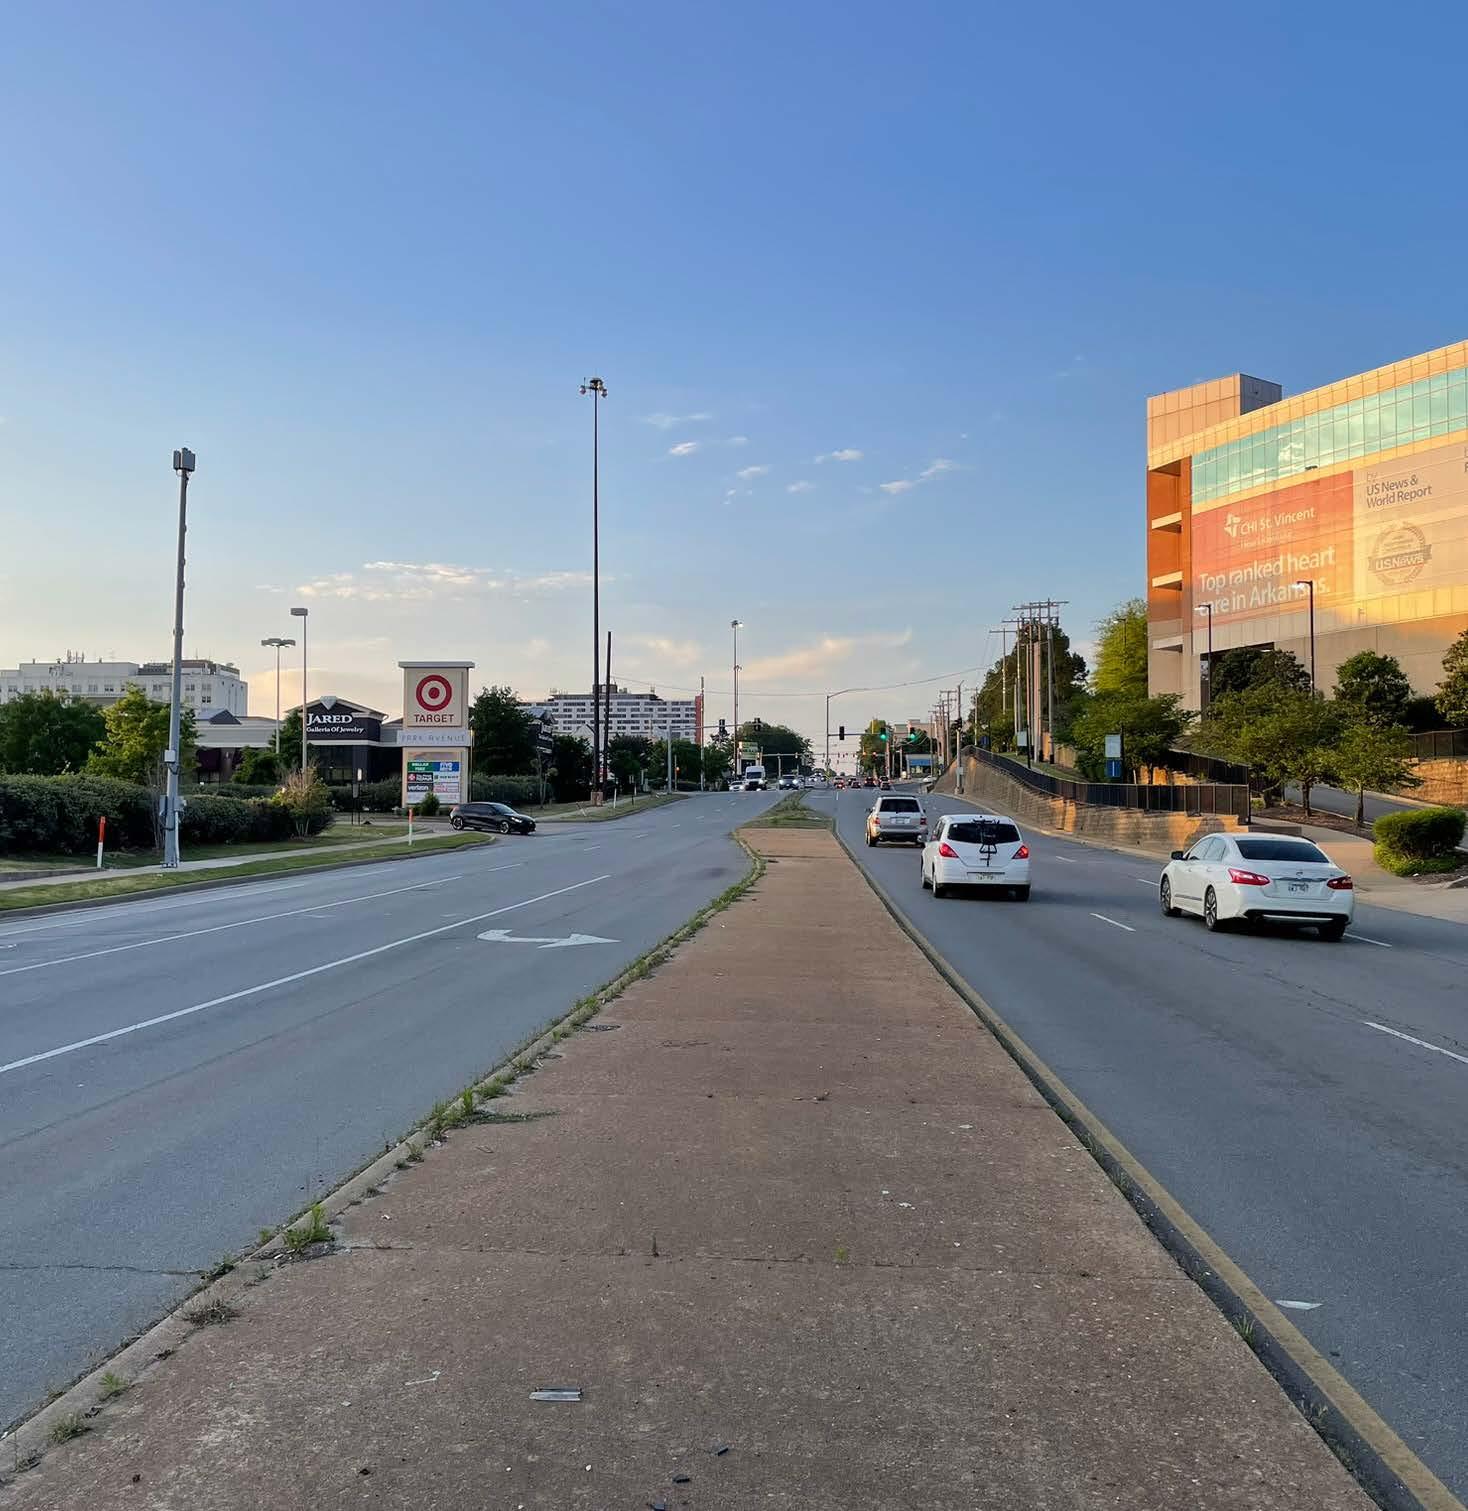
This half a mile section of University Ave is located north of US 630 and consists of one HIN segments that scored in the top 20 HIN segments and one of the top 20 high injury intersections with safety improvement needs in the Region, located at Markham St. The section has the Park Avenue shopping center along the west side, War Memorial Park along the east side, and medical facilities on both sides.
All four fatal and serious injury crashes that occurred within this project’s extents involved a pedestrian, two of which occurred at night. Public comments along this segment noted that it lacks pedestrian infrastructure despite many people walking from the residential areas to the north of Markham St to get to the shops, restaurants, and a park along University Ave. The public also noted that patients, visitors, and doctors from the hospital on the east side tend to cross University Ave directly from the hospital entrance instead of going to either of the signals at Markham St or Midtown Ave.
The most common manner of collision along this section of University Ave was rear-ends, which made up over 44 percent of the crashes. Many of these may be linked to drivers suddenly braking for unexpected pedestrians crossing the roadway outside of a marked crossing. Drivers may also be suddenly braking for a vehicle unexpectedly turning into or out of one of the many shopping center driveways.
All of the countermeasures identified for the project along this section of University Ave are recommended to address pedestrian infrastructure safety concerns as well as the high density of access points.
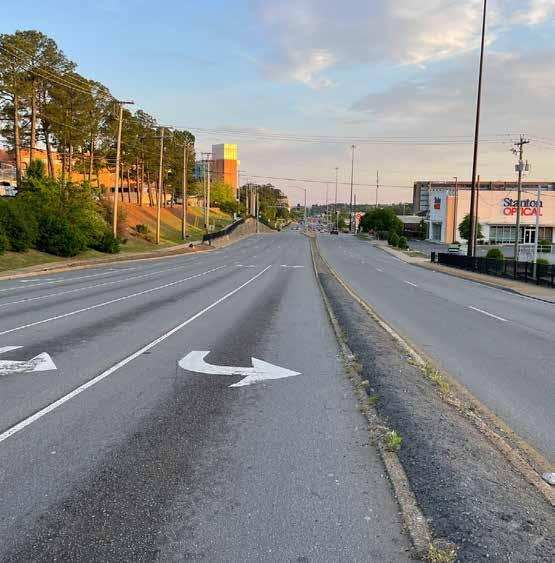
Crash Severity
Count Within Project Area
Fatal Serious Injury Minor Injury
Countermeasure Location(s)
Vulnerable Road User Countermeasures
High Visibility Crosswalk Pavement Markings 2 Signalized Intersections
Vehicular Countermeasures
Retroreflective Backplates2 Signalized Intersections
Access Management Entire Section, Particularly Around Markham St Intersection
Safety Lighting Entire Section
Total for All Crash Severities
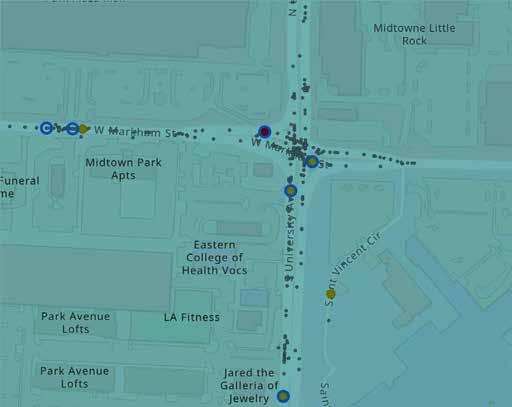
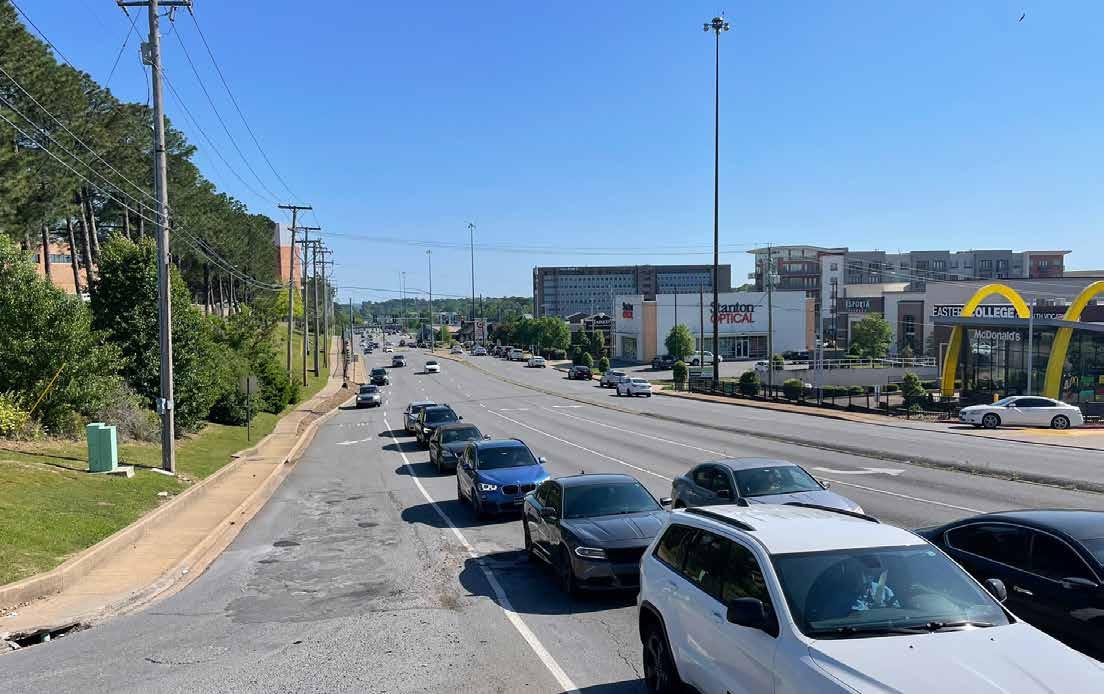
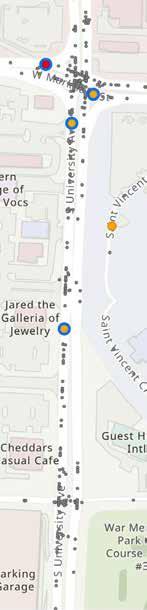
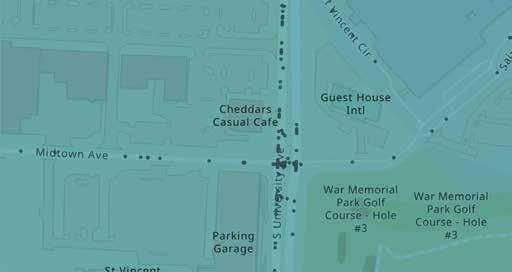
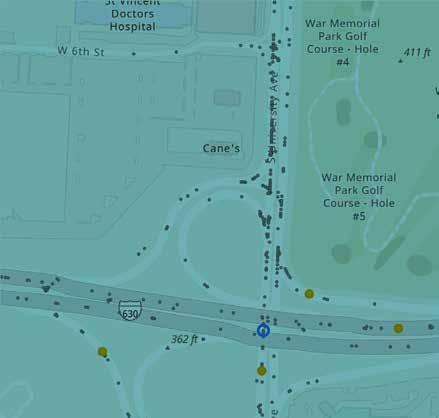


From Berkshire Dr to Colonel Glenn Rd/Asher Ave • Jurisdiction: City of Little Rock
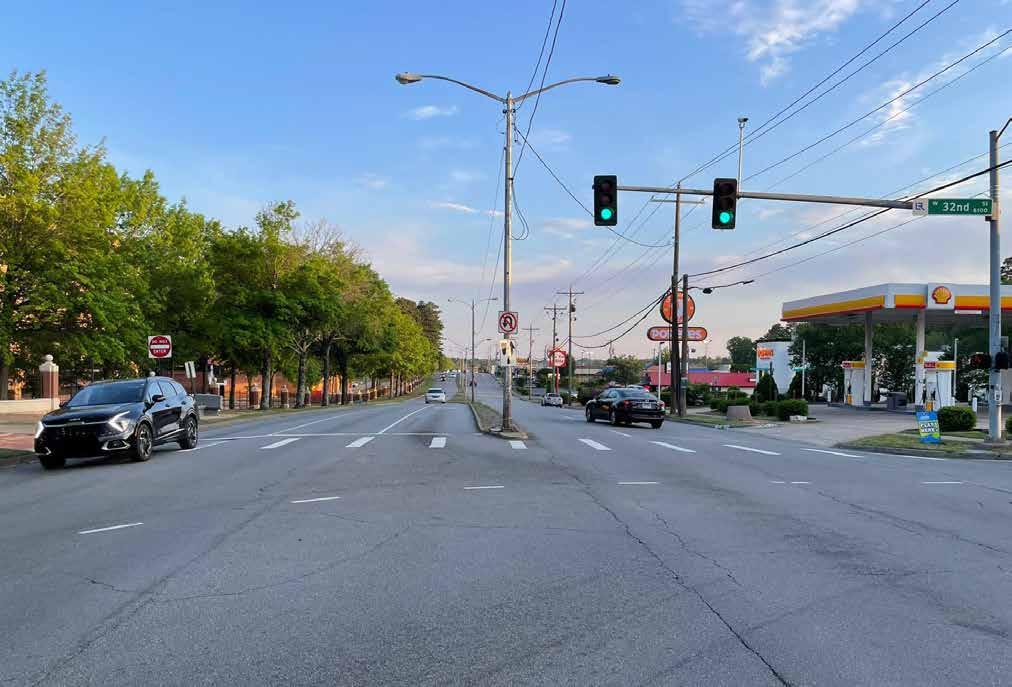
This one mile section of University Ave consists of one the top 20 HIN segments and the second highest scoring High Injury Intersection with safety improvement needs in the Region, which is located at the intersection with Colonel Glenn Rd/Asher Ave. The University of Arkansas at Little Rock (UALR) is located along the east side of this segment, therefore students constribute to a higher volume of pedestrian and bicycle
traffic in the area. Students must cross University Ave and Colonel Glenn Rd/Asher Ave to get to the shops, restaraunts, and student housing that border the southwest corner of campus.
Half of all crashes and more than half of all the pedestrian crashes that occurred along this section of Univeristy Ave occurred within the intersection of University Ave and Colonel Glenn Rd/Asher Ave. This intersection is large and does not have pedestrian
infrastructure to allow for the safe crossing of vulnerable road users. Public comments stated that pedesrians or bicyclists often cut through parking lots to cross Colonel Glenn Rd and avoid the intersection, which can be seen by the high density of crashes involving pedestrians at the east leg of the intersection.
The nature of the large intersection and the unusual geometry of the eastbound and westbound approaches, as well as the northbound right-turn lane, may be difficult for drivers navigating through the area and be a factor in the many head-on and angle collisions that have occurred at the intersection. The westbound through lane aligns with the eastbound left-turn lane which could cause confusion, especially at night. Field observations found that the entire intersection is lit up with a single highmast light that is no longer functioning. Almost 80 percent of the fatal and serious injury crashes along this project area occurred between dusk and dawn, many of which were at the intersection of University Ave and Colonel Glenn Rd/Asher Ave.
All of the countermeasures identified in the project along this section of University Ave are recommended to address crashes that occur at intersections, crashes involving pedestrians and bicyclists, and crashes that occur at night.
Multiple transportation operations and safety studies have been conducted along University Ave. Many of these studies have focused just on the intersection of University Ave and Colonel Glenn Rd/Asher Ave due
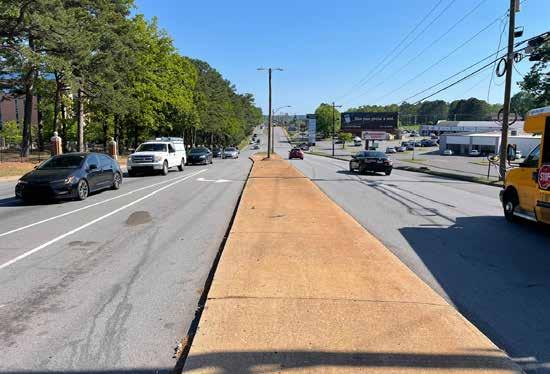
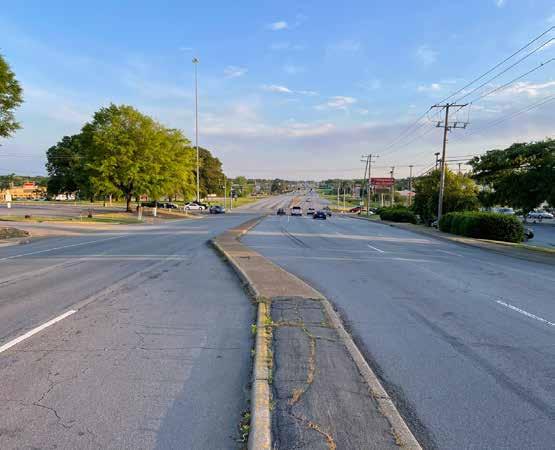
to the intersection being one of the busiest intersections in Arkansas, if not the busiest, and the high frequency of crashes. At the time the Central Arkansas Safety Action Plan was developed, ARDOT anticipated the let date for a pedestrian improvement project at this intersection to be June 2024. This project includes the construction of crosswalk and pedestrian refuge islands across the southbound and eastbound approaches to University Ave and Colonel Glenn Rd/Asher Ave.
Crash Severity
Count Within Project Area
Bikeway (Separated from Vehicular Traffic)
High Visibility Crosswalk Pavement Markings
Pedestrian Refuge Median/Island
Parallel to University Ave Along Campus Dr/Coleman Creek
4 Signalized Intersections
Colonel Glenn Rd/ Asher Ave
Add/Improve Sidewalk Entire Section
Sidewalk Buffer Where Possible
Convert Existing Pedestrian Signal to Accessible Pedestrian Signal (APS)
Install Pedestrian Signal at Signalized Intersection (With APS)
3 Signalized Intersections
Colonel Glenn Rd/ Asher Ave
Convert Diagonal Ramps to Directional Ramps Entire Section
Vehicular Countermeasures
Retroreflective Backplates 4 Signalized Intersections
Access Management Entire Section
Safety Lighting Entire Section
Add Advance Warning SignageEntire Section
Add/Improve Pavement Markings (Add stop bar and crosswalk pavement markings across all minor street approaches to University Ave where there is a stop condition and sidewalk) Entire Section
Intersection Reconfiguration Asher Ave


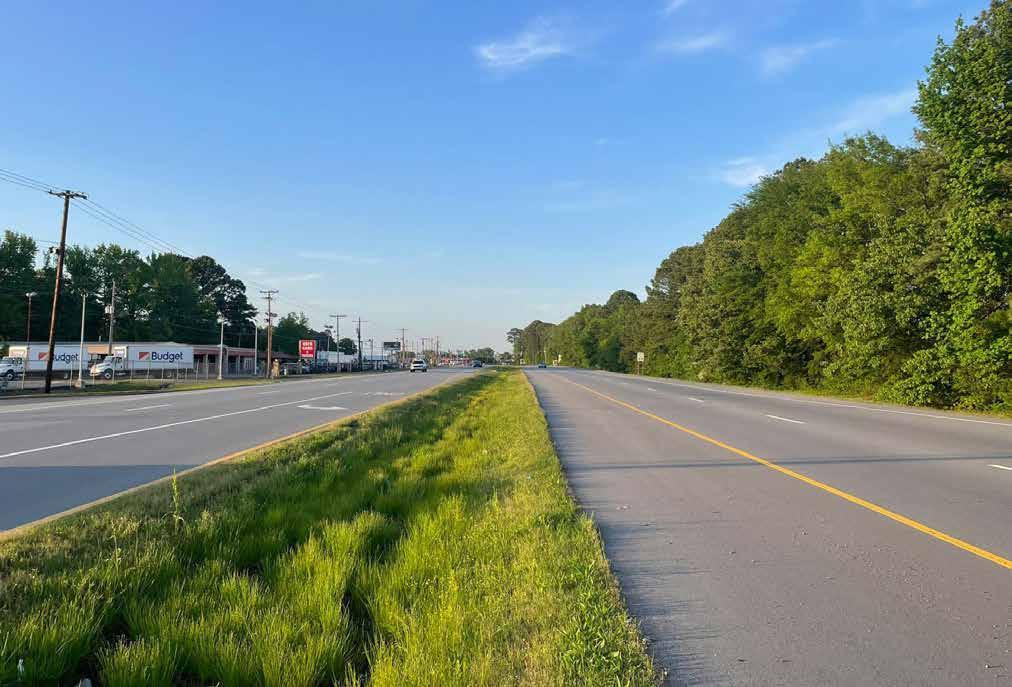
This 2.7 mile section of University Ave consists of five HIN segments that scored in the top 20 HIN segments and six of the top 20 High Injury Intersections with safety improvement needs, including the second highest scoring intersection, located at University Ave and Colonel Glenn Rd/Asher Ave. Note that the discussion for the intersection at University Ave and Colonel Glenn Rd/Asher Ave is included in the project for University Ave
(UALR) and will not be repeated here. The University of Arkansas at Little Rock (UALR) is located to the north of this segment, therefore students constribute to a higher volume of pedestrian and bicycle traffic in the area. This section of University Ave is primarily lined with businesses, surrounded by residential area.
The presence of pedestrian and bicycle facilities along this section of University Ave is inconcsistent and lacking. Pedestrians and
bicyclists are frequently observed utilizing the shoulders due to the lack of sidewalk and bike lanes, which has resulted in over a quarter of the fatal and serious injury crashes along this project area involving a pedestrian. More than 80 percent of the crashes involving pedestrians occurred at night, including all of the fatal and serious injury crashes. Six crashes involving pedestrians, four of which were fatal or serious injury crashes, occurred at the intersection of University Ave and W 53rd St. This unsignalized intersection, as well as the signalized intersections at Mabelvale Pike, 65th St, and Forbing Rd provide no infrastructure to support safe travel for vulnerable road users.
These four intersections have complex geometries with angled approaches, multiple channelization islands and medians with breaks for driveways, inconsistent pavement markings, and minimal lighting that may cause to driver confusion. The intersection at Mabelvale Pike experienced one fatal and six serious injury crashes, most of which occurred in daylight. These may have been a result of the unmarked right-turn only lanes and small islands for the signal poles that are within the intersection. Similar conditions exist at all of these intersections.
All of the countermeasures identified in the project along this section of University Ave are recommended to address crashes that occur at intersections and commercial driveways, crashes involving pedestrians and bicyclists, and crashes that occur at night. Multiple transportation operations and
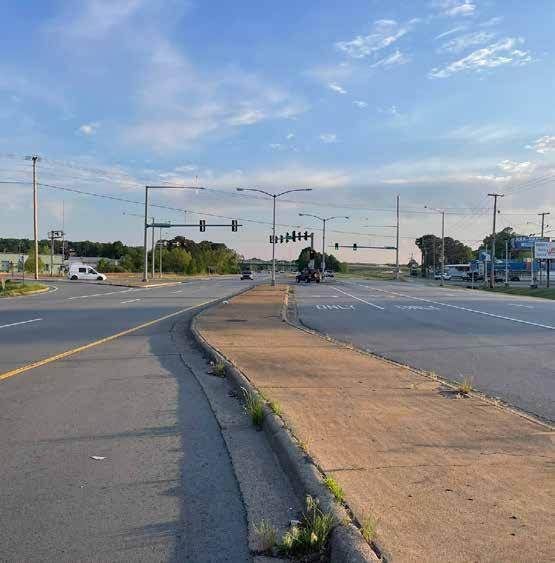
safety studies have been conducted along University Ave. Many of these studies have focused just on the intersection of University Ave and Colonel Glenn Rd/Asher Ave due to the intersection being one of the busiest intersections in Arkansas, if not the busiest, and the high frequency of crashes. At the time the Central Arkansas Safety Action Plan was developed, ARDOT anticipated the let date for a pedestrian improvement project at this intersection to be June 2024. This project includes the construction of crosswalk and pedestrian refuge islands across the southbound and eastbound approaches to University Ave and Colonel Glenn Rd/Asher Ave.
The Central Arkansas Regional Greenway Plan proposes a trail along Coleman Creek on the south side of Asher Ave to connect to the existing Fourche Trail along Mabelvale Pike, which could improve pedestrian and bicycle access to student housing and a sports and recreation complex.
Crash Severity
Count Within Project Area
Bikeway (Separated from Vehicular Traffic)
High Visibility Crosswalk Pavement Markings
Pedestrian Refuge Medians/Islands
Parallel to University Ave Along Mabelvale Pike
6 Signalized Intersections
6 Signalized Intersections
Add/Improve Sidewalk Entire Section
Sidewalk Buffer
Install Pedestrian Signal at Signalized Intersection (With APS)
Retroreflective Backplates
Where Possible, Particularly Along Fourche Creek Bridge
6 Signalized Intersections
Vehicular Countermeasures
7 Signalized Intersections
Access Management Entire Section
Safety Lighting Entire Section
Add Advance Warning Signage Mabelvale Pike Intersection
Add/Improve Pavement Markings
(Add stop bar and crosswalk pavement markings across all minor street approaches to University Ave where there is a stop condition and sidewalk)
Traffic Signal
Intersection Reconfiguration
Colonel Glenn Rd/ Asher Ave Fatal Serious Injury Minor Injury
Entire Section and for Lanes at Mabelvale Pike Intersection Approaches
St
for All Crash Severities
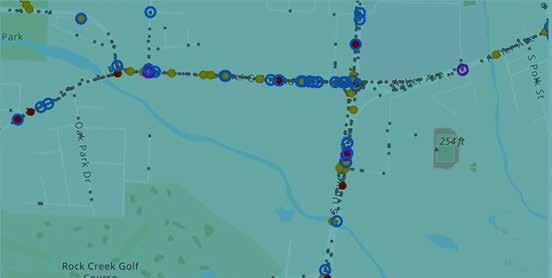
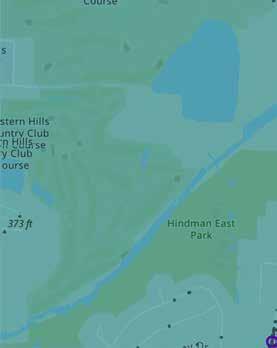
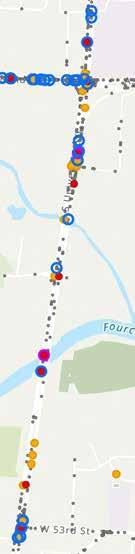


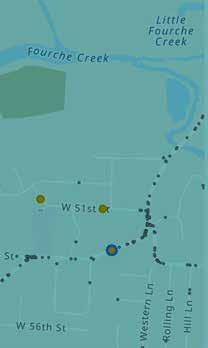
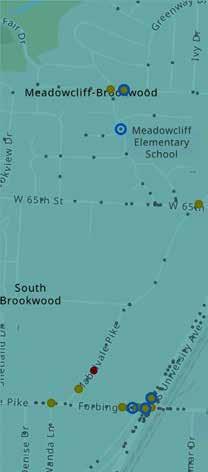
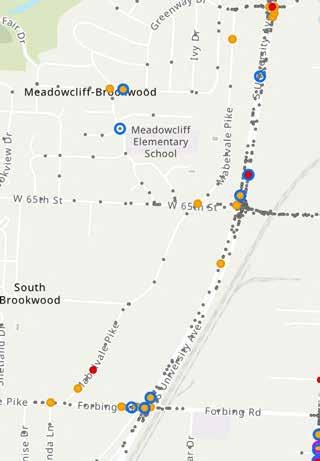
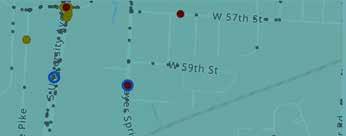
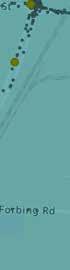
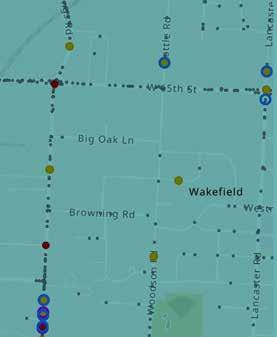
From Stannus St to Johnson St • Jurisdiction: City of Little Rock
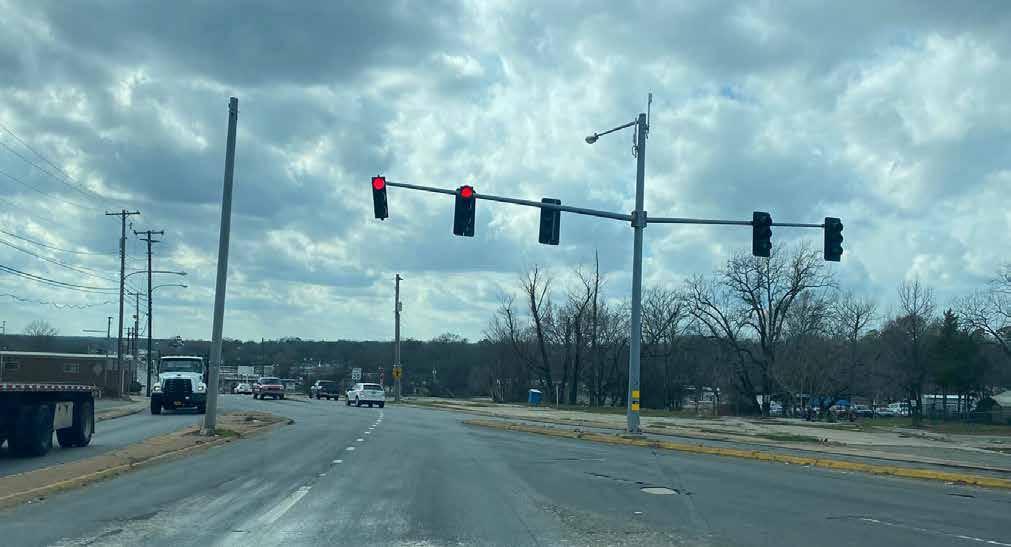
This 3.1 mile section of Colonel Glenn Rd/ Asher Ave/Roosevelt Rd (referred to as “Asher Ave” in this project discussion) is made up of four HIN segments and four High Injury Intersections that scored in the top 20 segments and top 20 intersections in the Region with a need for safety improvements, including the second highest scoring intersection, located at University Ave and Colonel Glenn Rd/Asher Ave. Note that the discussion for the intersection at University Ave and Colonel Glenn Rd/Asher Ave is included in the project for University Ave (UALR) and will not be repeated in detail here.
Asher Ave provides connectivity to these businesses, University of Arkansas Little Rock (UALR) and other schools of varying levels, residential neighborhoods, and recreation centers and parks. This section of Asher Ave is lined with businesses on both sides, except for between University Ave and Fair Park Blvd/Mabelvale Pike where it passes between the UALR on the north side and student housing to the south, which constributes to a higher volume of pedestrian and bicycle traffic in the area. Rock Region Metro Route 14 has many stops along this project location, which also contributes to the high volume of pedestrians and bicycles.
Along this section of Asher Ave, there are
no existing bike lanes and the sidewalks are inadequate, as they are very narrow, over grown, suddenly end, and have numerous breaks at commercial driveways and intersections. The public has expressed concerns regarding the lack of safe crossings for vulnerable road users along this section of Asher Ave, as there are large gaps between signalized intersections with crosswalks. A 0.6 mile gap between crossings extents on either side of the intersection at University Ave, and no crossings exist within the 1.5 mile span between the signal at Fair Park Blvd/Malbelvale Pike and the east end of the project boundary. Public comments stated that pedesrians or bicyclists often cut through parking lots to cross Colonel Glenn Rd and avoid the University Ave intersection, which has no pedestrian infrastructure. This behavior can be seen in the crash data by the high density of crashes involving pedestrians at the east leg of the intersection. These are just a few of the many factors identified in public comments, by field observations, and through crash data analysis that likely resulted in seven of the 12 fatal crashes on this section involving pedestrians.
Over half of all crashes along this section of Asher Ave occurred at intersections. About 37 percent of the fatal and serious injury crashes along this section of Asher Ave occurred at intersections between dusk and dawn, likely caused by the high density of access points, intersection geometries, and lack of lighting. Drivers may be speeding around the curve at the eastbound approach to Bryant St and are not prepared to stop at the traffic signals or for pedestrians in the road due to limited sight distance and poor lighting.
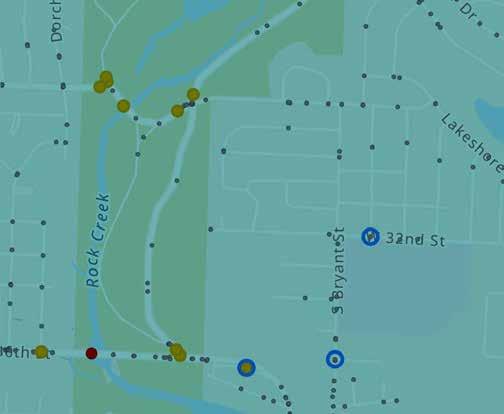
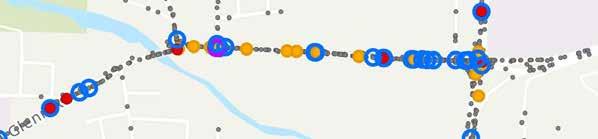
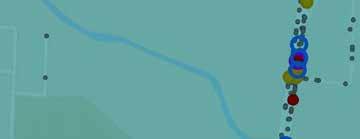
Public comments and field observations identified the intersection where Asher Ave and Roosevelt Rd meet as a challenging intersection for all road users to navigate due to minimal signage, lack of pedestrian and bicycle infrastructure, and abundance of access points and angled intersections.
All of the countermeasures identified for the Colonel Glenn Rd/Asher Ave/Roosevelt Rd project are recommended to address crashes that occur in the dark or at intersections and commercial driveways, crashes involving pedestrians and bicyclists, and speeding. Multiple transportation operations and safety studies have been conducted along University Ave. Many of these studies have focused just on the intersection of University Ave and Colonel Glenn Rd/Asher Ave due
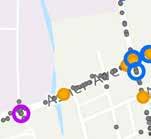
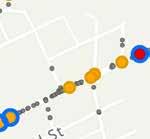
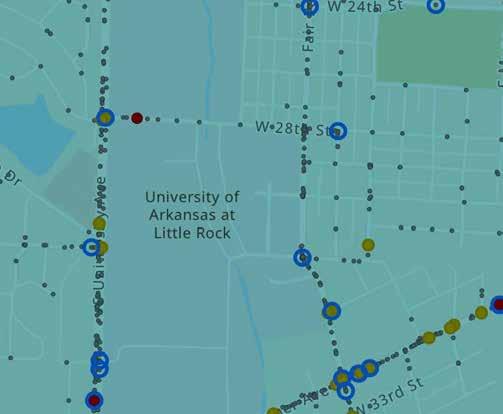

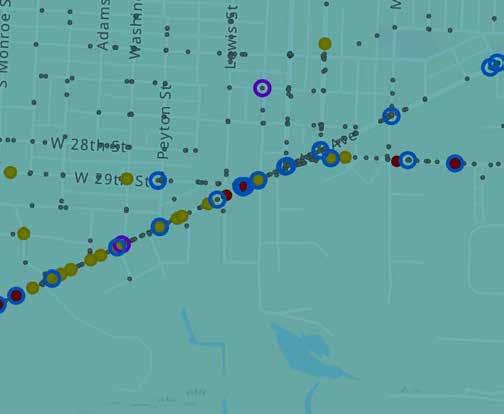
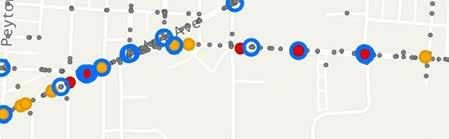
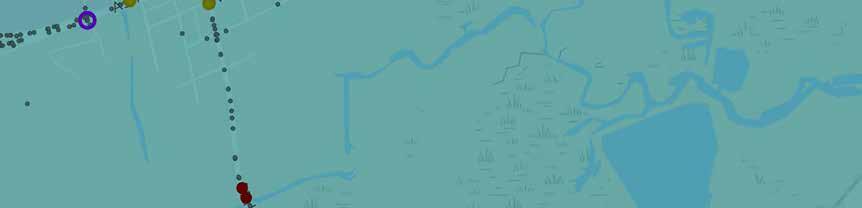
to the intersection being one of the busiest intersections in Arkansas, if not the busiest, and the high frequency of crashes. At the time the Central Arkansas Safety Action Plan was developed, ARDOT anticipated the let date for a pedestrian improvement project at this intersection to be June 2024. This project includes the construction of crosswalk and pedestrian refuge islands across the southbound and eastbound approaches to University Ave and Colonel Glenn Rd/Asher Ave.
The Central Arkansas Regional Greenway Plan proposes a trail along Coleman Creek on the south side of Asher Ave to connect to the existing Fourche Trail along Mabelvale Pike, which could improve pedestrian and bicycle access to student housing and a sports and recreation complex.
Pedestrian Hybrid Beacon (PHB)3 Midblock Crossings
Add/Improve Sidewalk Entire Section
Sidewalk Buffer Where Possible
Install Pedestrian Signal at Signalized Intersection 3 Signalized Intersections
Convert Diagonal Ramps to Directional Ramps Entire Section
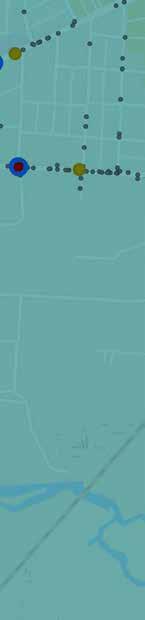
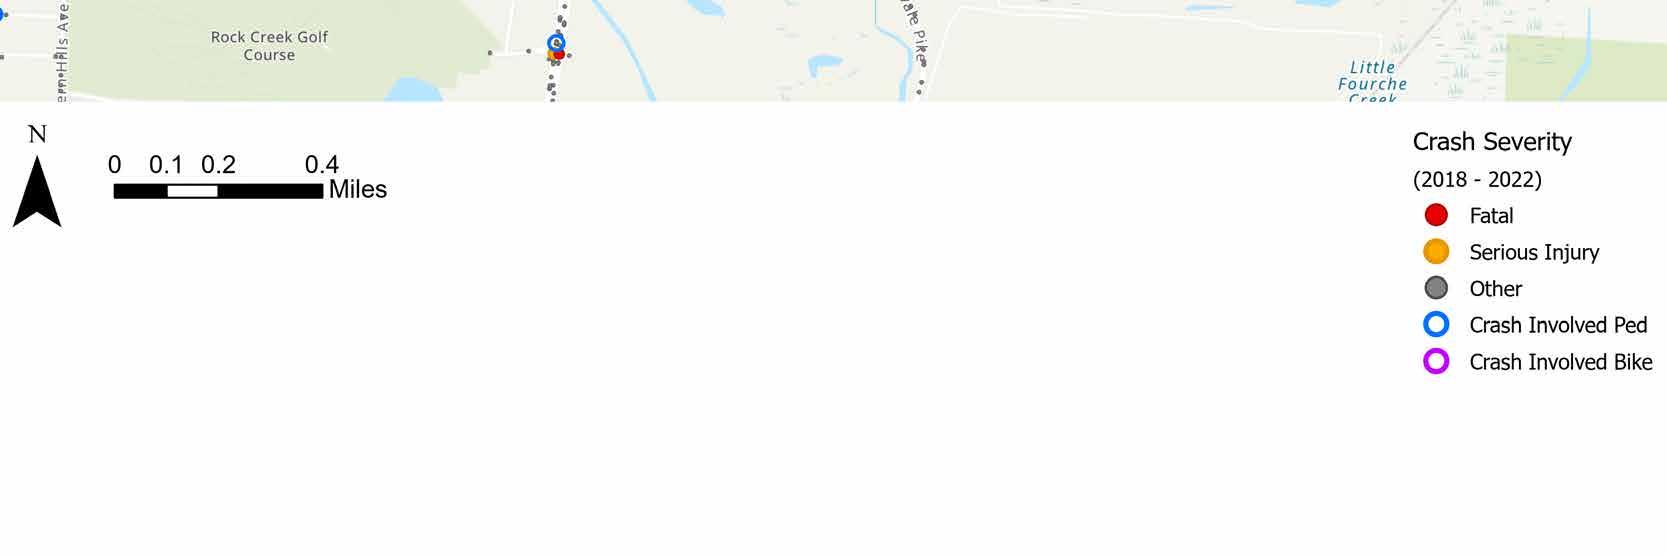
Grade Separated Crossing Campus Dr/Coleman Creek
Dynamic Speed Display/Feedback Signs and Other Enforcement Entire Section
Retroreflective Backplates
Access Management Entire Section
Safety Lighting Entire Section
Add Advance Warning Signage36th St
Add/Improve Pavement Markings
(Add stop bar and crosswalk pavement markings across all minor street approaches to Colonel Glenn Rd/Asher Ave/Roosevelt Rd where there is a stop condition and sidewalk)
Intersection Reconfiguration
Rd Split
Segment: From Azalea Dr - Mabelvale Cut Off Rd • Jurisdiction: City of Little Rock
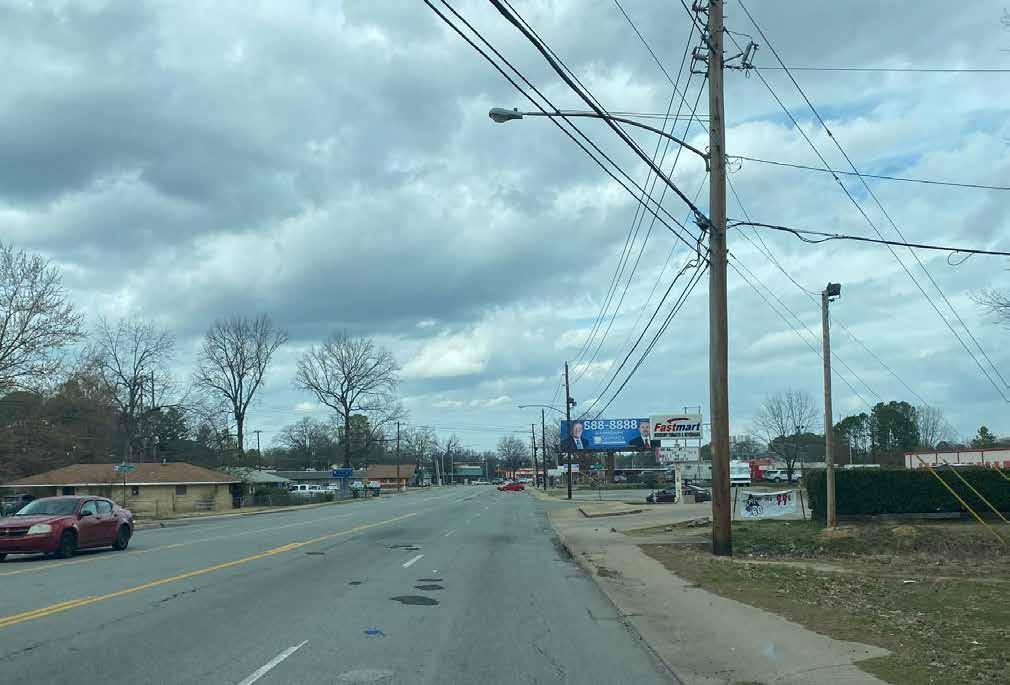
This section of Chicot Rd quickly shifts from commercial to residential as it gets further south of Baseline Rd. There is a high density of commercial driveway access points surrounding the intersection at Baseline. Although south of Fairfield Dr the access points along Chicot Rd are mostly local road intersections, most of these intersections
are offset, creating back to back 3-leg intersections that may lead to conflicting turning movements.
From 2018 through 2022, three fatal crashes and 14 serious injury crashes occurred along this section of Chicot Rd that is just over one mile long. Over 82 percent of these fatal and serious injury crashes occurred between dusk and dawn. Five of the serious injury
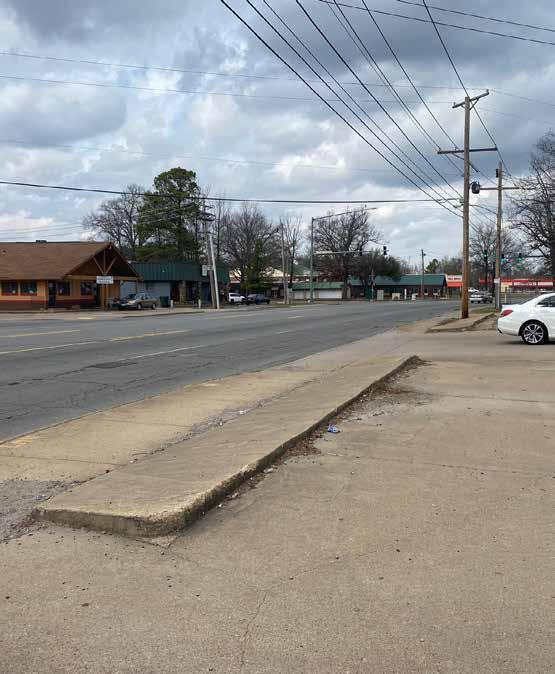
crashes occured at the intersection of Chicot Rd and Baseline Rd, all of which occurred between dusk and dawn. Many of the crashes occurred when the pavement was wet, suggesting there may be some issues with drainage. Visual inspection revealed minimal curb inlet openings and many road grates. It is possible that these may become cloffed with debris and create drainage issues. Based on public comments, speeding
From 2018 through 2022, three fatal crashes and 14 serious injury crashes occurred along this section of Chicot Rd that is just over one mile long.
is also an issue at this intersection. Public comments noted the need for improved pedestrian infrastructure along this section of Chicot Rd as there is inconsistent sidewalk which is in poor condition and no protected crossings in the one-mile gap between the signalized intersections at Mann Rd and Mabelvale Cut Off Rd. Rock Region Metro Route 22 has Countermeasure
Vulnerable Road User Countermeasures
High Visibility Crosswalk Pavement Markings
2 Signalized Intersections
Pedestrian Hybrid Beacon (PHB)2 Midblock Crossings
Improve Sidewalk and Curb Entire Section
Sidewalk Buffer Where Possible
Convert Diagonal Ramps to Directional Ramps Entire Section
Vehicular Countermeasures
Speed Enforcement Entire Section
Retroreflective Backplates
Access Management
2 Signalized Intersections
Entire Section, Particularly Near Baseline Rd Intersection
Safety Lighting Entire Section
Add/Improve Pavement Markings
(Add stop bar and crosswalk pavement markings across all minor street approaches to Chicot Rd where there is a stop condition and sidewalk)
Entire Section
Drainage Improvements Entire Section
multiple stops in this area to provide access to the neighborhoods, schools, parks, and businesses and requires riders to cross Chicot Rd within the gap between signals.
Most of the countermeasures identified for this section of Chicot Rd are recommended to address crashes that occur at night and crashes involving pedestrians.


Segment: From Forbing Rd to Baseline Rd • Jurisdiction: City of Little Rock
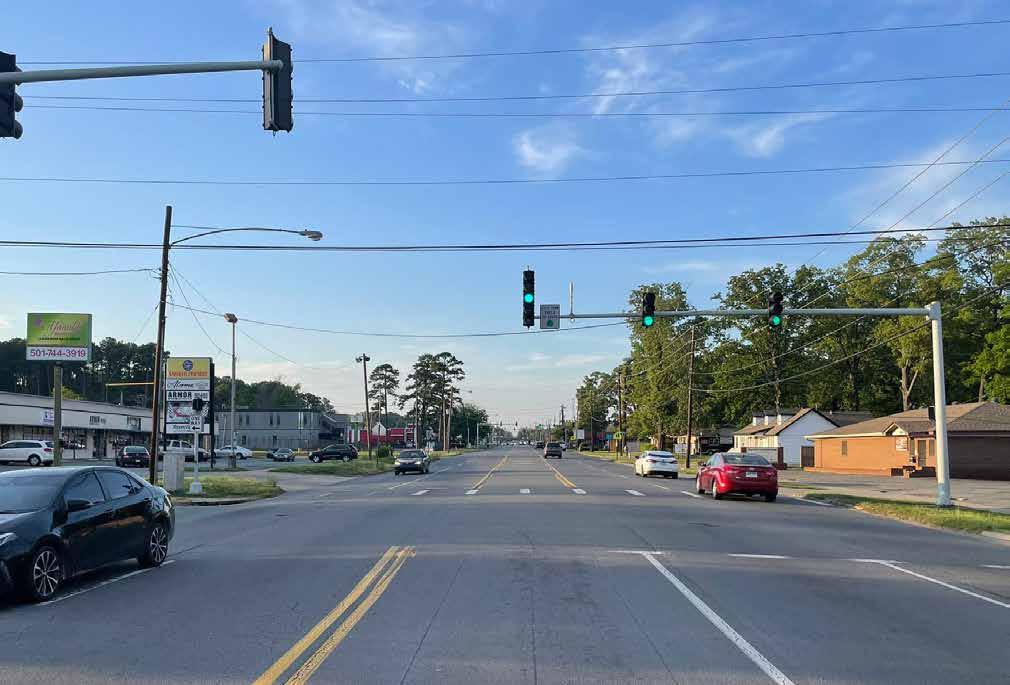
This one mile section of Geyer Springs Road consists of one of the top 20 HIN segments with safety improvement needs in the Region and three of the top 20 High Injury Intersections, including the highest scoring intersection in the Region, the interseciton of Geyer Springs Rd and Baseline Rd.
This section of Geyer Springs Rd provides
connectivity to a wide range of businesses, residential areas, and a few schools to the north and south of I-30. Both sides of Geyer Springs Rd have a very high density of intersecting neighborhood roads and commercial driveways. Many of the businesses, shops, restaraunts, and grocery stores have multiple access points and wider than normal driveways, making it difficult for drivers on Geyer Springs Rd to predict where
vehicles will be pulling into or out of parking lots. About 56 percent of all crashes and over 60 percent of the fatal and serious injury crashes within this project area occurred at intersections and commercial driveways. The high density of access points and a continuous two-way left-turn lane creates the risk for head-on, sideswipe in the opposite direction, and angle type crashes along the entire section.
Based on public comments, field observations, and crash data analysis, the existing pedestrian infrastructure is inadequate to safely support the high volume of pedestrians that walk along Geyer Springs Rd from nearby neighborhoods, between businesses, from schools, and from Rock Region Metro Route 22 bus stops along the corridor. Many sections of the sidewalk are narrow and deteriorating, and the abundance of commercial driveways and intersections results in an abundance of gaps in the sidewalk. Twelve crashes involving pedestrians and bicyclists occurred between Forbing Rd and Nova Ln/Dreher Ln where there are no crosswalks for pedestrians to safely cross Geyer Springs Rd or the side streets, including the intersections at the I-30 frontage roads.
Over 60 percent of the fatal and serious injury crashes occurred at night, 50 percent of which involved pedestrians. Drivers find it difficult to anticipate which driveways and intersections vehicles ahead are turning in or out of during the day and find it nearly impossible to do so in poorly lit nighttime conditions. Pedestrians are also much harder to see at night if there is insufficient lighting
or if they cross outside of the street light’s range. Rock Region bus drivers noted that it is often difficult to see riders waiting at stops at night.
All of the countermeasures identified for the project on this section of Geyer Springs Rd are general countermeasures recommended to address crashes that occur at intersections, at commercial driveways, and along the bus route, crashes involving pedestrians and bicyclists, and crashes that occur at night. Aside from the recommendation for improved access management, most of the recommendations are low-cost, low-effort countermeasures that are not anticipated to significantly reduce the fatal and serious injury crashes and overall total number of crashes along Geyer Springs Rd. Therefore, a more detailed road safety audit (RSA) is recommended for this corridor to look more closely at the existing conditions to identify site specific countermeasures that may have a higher impact on reducing crashes.
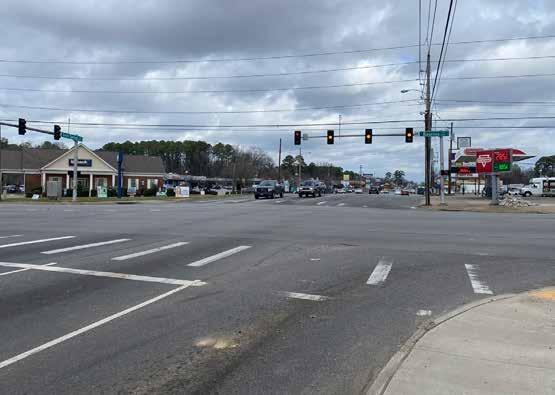
Within Project Area
Visibility Crosswalk Pavement Markings
Pedestrian Refuge Median/IslandBaseline Rd
Improve Sidewalk
Sidewalk Buffer Where Possible
Install Pedestrian Signal at Signalized Intersection
Signalized Intersections
Convert Diagonal Ramps to Directional Ramps Entire Section
Vehicular Countermeasures
Retroreflective Backplates
Access Management (Accompanied by removal of or conversion of TWLTL to dedicated left-turn lane)
Signalized Intersections
Safety Lighting Entire
Add Advance Warning Signage
Add/Improve Pavement Markings
(Add stop bar and crosswalk pavement markings across all minor street approaches to Geyer Springs Rd where there is a stop condition and sidewalk)
Adjust Signal Timings (Add Leading Pedestrian Interval (LPI))
Along Entire Section
Transit Countermeasures
Rd
Add Bus Stop Bulb-Out Entire Section Other Countermeasures
Further Study Needed (RSA) Entire Section
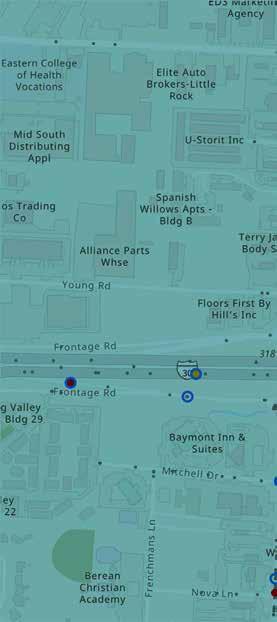

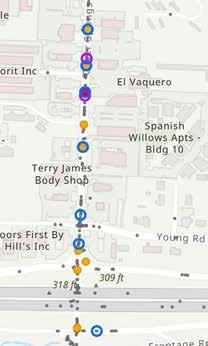
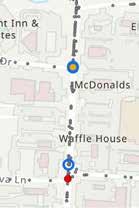
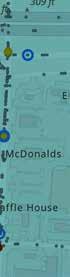
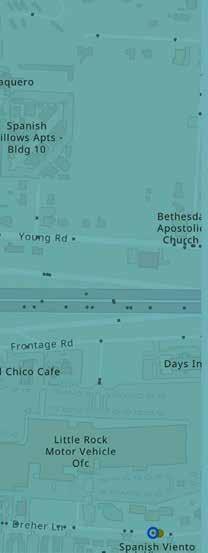
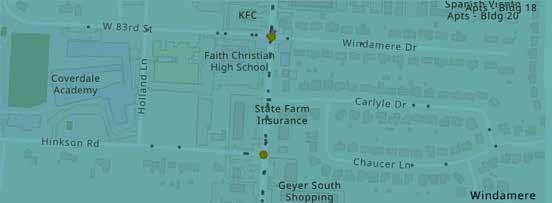

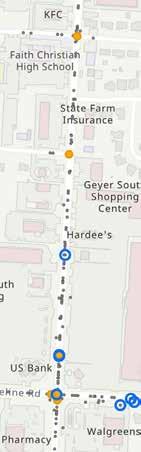

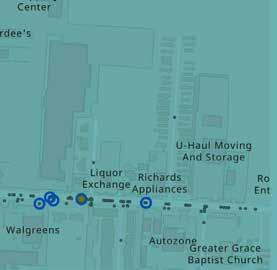
Segment: From Winston Dr to Abandoned Railroad • Jurisdiction: City of Little Rock
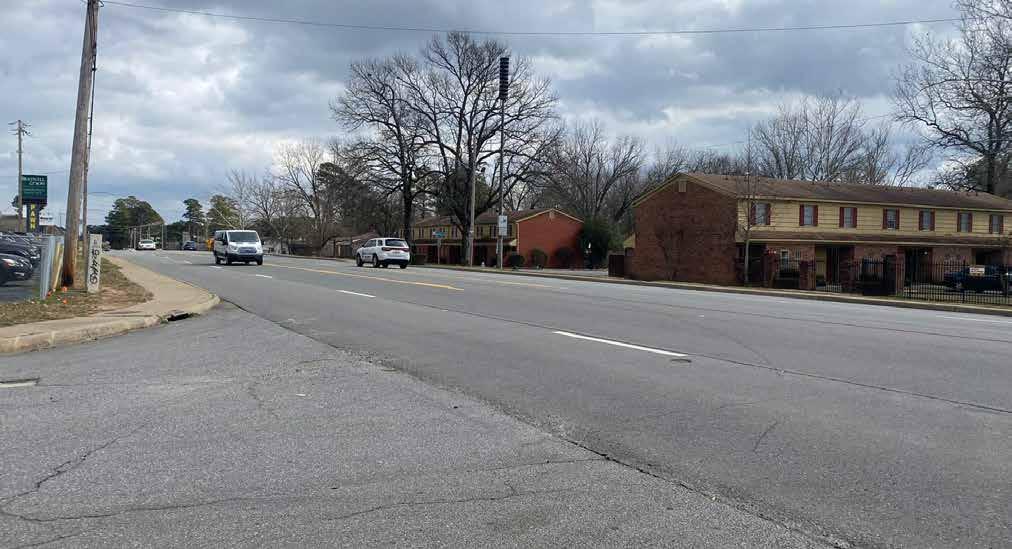
This 4.5 mile segment of Baseline Rd consists of four segments that scored in the top 20 HIN segments with safety improvement needs in the Region and three top 20 High Injury Intersections in the Region. This section of Baseline Rd provides connectivity to a wide range of businesses, residential and recreation areas, a few schools, and the Southwest Community Center.
The very high density of intersecting neighborhood roads and commercial driveways for various businesses, shops, restaraunts, and grocery stores, many of which have multiple access points and wider
than normal driveways, make it difficult for drivers on Baseline Rd to predict where vehicles will be pulling into or out of parking lots. About 58 percent of all crashes and about 66 percent of the fatal and serious injury crashes within this project area occurred at intersections and commercial driveways. The high density of access points and a continuous two-way left-turn lane creates the risk for head-on, sideswipe in the opposite direction, and angle type crashes along the entire section.
Based on public comments, field observations, and crash data analysis, the existing pedestrian infrastructure is inadequate to safely support the high
volume of pedestrians that walk along Baseline Rd from nearby neighborhoods, between businesses, from schools, from the Southwest Community Center, and from Rock Region Metro Route 22 and Route 23 bus stops along the corridor. Many sections of the sidewalk are narrow, overgrown, and deteriorating, and the abundance of commercial driveways and intersections results in an abundance of gaps in the sidewalk. There are also many large gaps between traffic signals where pedestrians can cross safely, such as the 1.5 mile gap between the signal at Geyer Springs Rd and Scott Hamilton Dr/Hilaro Springs Rd. Six of the 13 fatal and serious injury crashes involving pedestrians occurred along Baseline Rd within this gap between signals. About 64 percent of the fatal and serious injury crashes along this section of Baseline Rd occurred at night. Drivers find it difficult to anticipate which driveways and intersections vehicles ahead are turning in or out of during the day and find it nearly impossible to do so in poorly lit nighttime conditions. Pedestrians are also much harder to see at night if there is insufficient lighting or if they cross outside of the street light’s range. Rock Region bus drivers noted that it is often difficult to see riders waiting at stops at night.
All of the countermeasures included in the Baseline Rd project are recommended to address crashes that occur in the dark, at intersections and commercial driveways, and along bus routes, and crashes involving pedestrians and bicyclists.
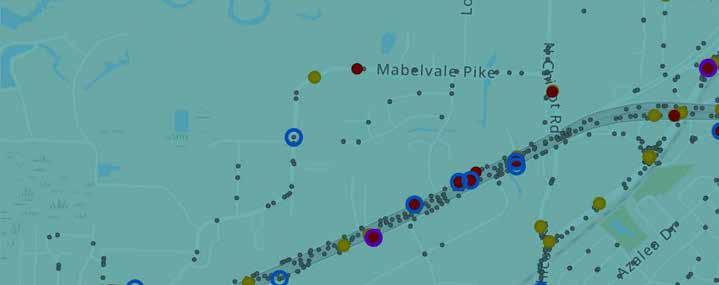

Crash Severity
Count Within Project Area
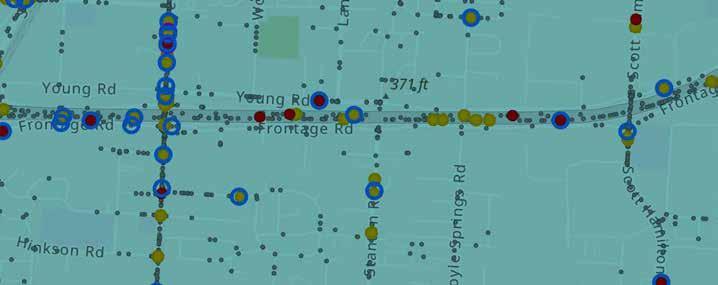
740 178 1,805 Total for All Crash Severities
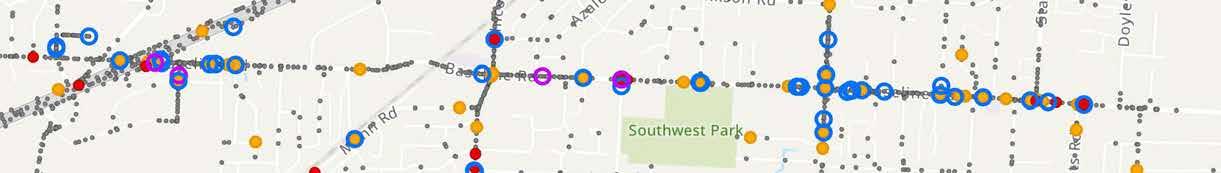
Bikeway (Separated from Vehicular Traffic) Entire Section
High Visibility Crosswalk Pavement Markings8 Signalized Intersections
Pedestrian Refuge Median/Island Geyer Springs Rd
Pedestrian Hybrid Beacon (PHB)
4 Midblock Crossings
Sidewalk Buffer Where Possible
Sidewalk Railing
Railing Along Sidewalk on South Side of Baseline Rd Near St Theresa's Catholic School
Install Pedestrian Signal at Signalized IntersectionI-30 Southbound Frontage Road
Convert Diagonal Ramps to Directional RampsEntire Section Vehicular Countermeasures
Speed Enforcement Entire Section
Retroreflective Backplates
Access Management (Accompanied by removal of or conversion of TWLTL to dedicated left-turn lane)
8 Signalized Intersections
Entire Section, Particularly Near Geyer Springs Rd Intersection
Safety Lighting Entire Section
Add Advance Warning Signage
Add/Improve Pavement Markings (Add stop bar and crosswalk pavement markings across all minor street approaches to Baseline Rd where there is a stop condition and sidewalk)
Traffic Signal Adjustments
3 Crossings
Entire Section and for Lanes at I-30 Northbound Frontage Rd Intersection
Replace Red Balls with Red Through Arrows for all EB lanes at I-30 Southbound Frontage Rd Intersection
Adjust Signal Timings (Add Leading Pedestrian Interval (LPI)) Geyer Springs Rd
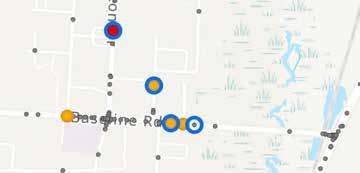
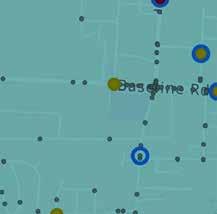
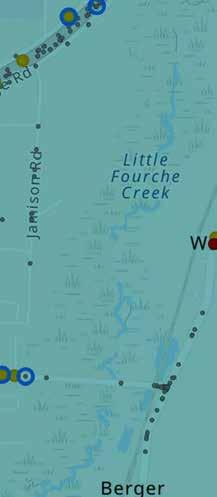
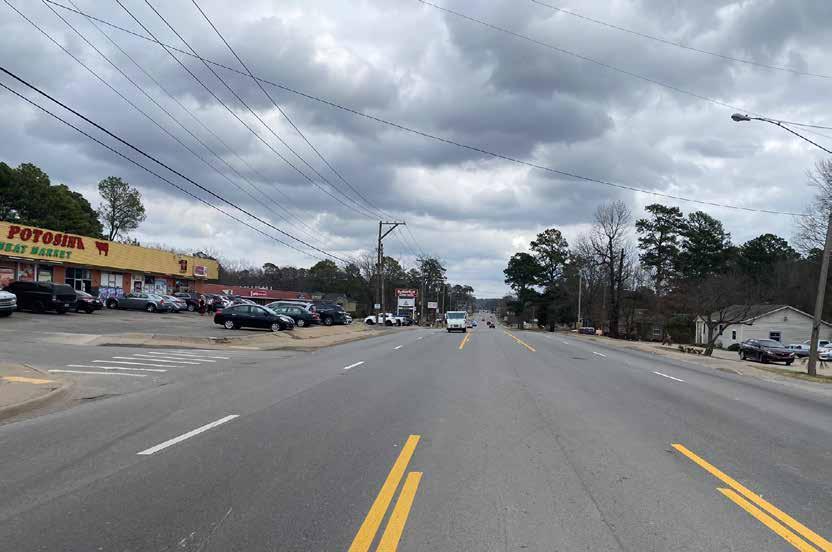
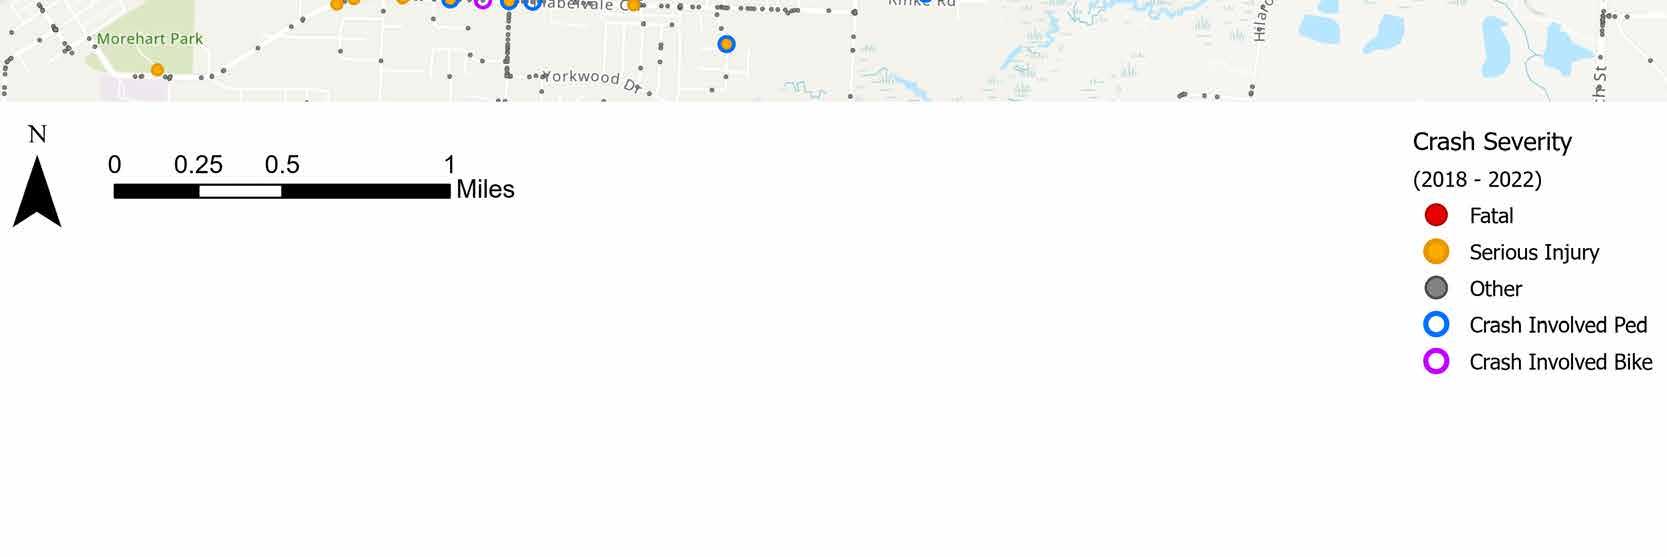
Segment: From Kenwood Rd to North St • Jurisdiction: City of Benton
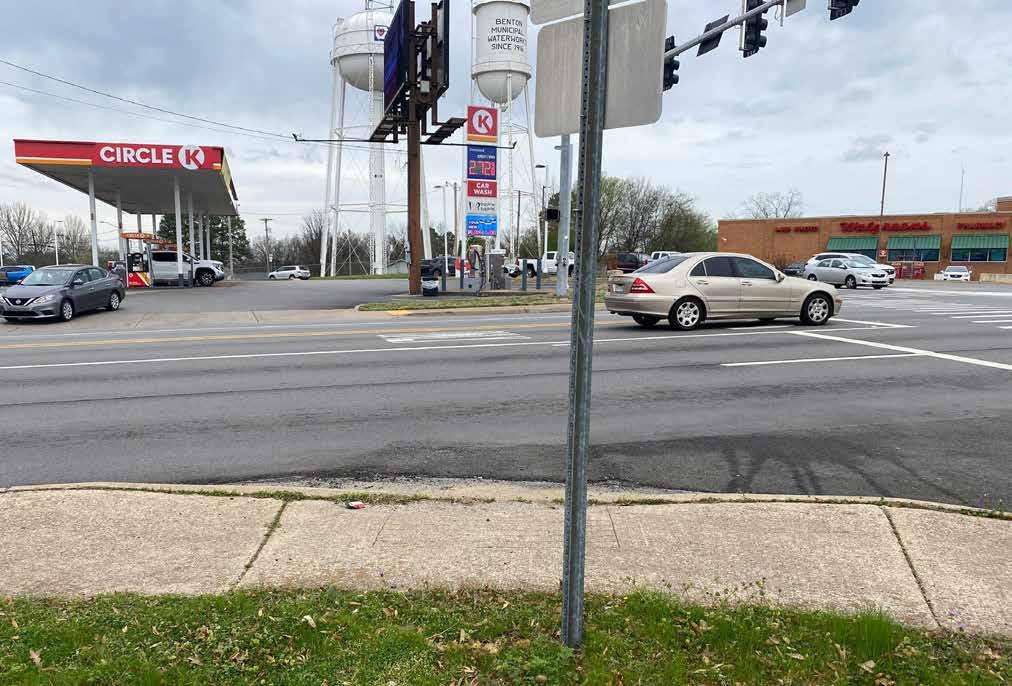
This project along Carpenter St/East St (SH 35) is made up of two HIN segments that scored in the top 5 HIN state route segments within Saline County with safety improvement needs and connects two of the top 10 High Injury Intersections with safety improvement needs in Saline County, at Market St and at Military Rd.
Half of the serious injury crashes within
this project’s extents occurred along the curve at the eastbound approach to Market St. Vehicles exiting the interstate may be traveling faster than appropriate and are not prepared to stop at the traffic signal at Market St or are not expecting other vehicles turing onto or off of side streets within the curve. The speed limit sign posted after the interstate exit ramp may not be seen if drivers are looking to the left, towards the upcoming curve, or if drivers are looking to
change into the left lane because the right lane becomes a right-turn only lane where the curve begins. Similar factors may lead to drivers not seeing the advance warning sign for the upcoming traffic signal and may be distracted by the curve, changing lanes, or avoiding turning vehicles.
About 42 percent of the crashes along this section of Carpenter St/East St (SH 35) were rear-end crashes and about 30 percent were angle crashes, a majority of which occurred at the intersections with Main St, Military Rd, Narroway St, Carpenter St, and East St.
The geometry of the intersections where any two or three of these roads meets is angled, immediately adjacent to another intersection, and contains commercial driveway access points. The sharp angles, road name changes, misaligned approaches, and triangular islands likely overwhelms and confuses drivers. Despite most of these roads having sidewalks, the driveways create breaks in the sidewalk and there are no clear protected crossings, making the area difficult for pedestrians to navigate as well.
Most of the countermeasures identified for the project on this section of Carpenter St/East St (SH 35) are recommended to address crashes that occur along the curved approach to Market St and intersection geometry challenges. Due to the complexity of the intersection geometries and high density of access points around the intersections involving Main St, Military Rd, Narroway St, Carpenter St, and East St, and not clear crash patterns within them, further study is recommended in this area.
Countermeasure Location(s)
Vulnerable Road User Countermeasures
Bikeway (Separated from Vehicular Traffic) Entire Section
High Visibility Crosswalk Pavement Markings 3 Signalized Intersections
Pedestrian Refuge Median/IslandMilitary Rd
Add/Improve Sidewalk Entire Section
Sidewalk Buffer Where Possible
Install Pedestrian Signal at Signalized Intersection 2 Signalized Intersections
Convert Diagonal Ramps to Directional Remaps Entire Section
Vehicular Countermeasures
Transverse Rumble Strips
Retroreflective Backplates
At Speed Limit Sign at SB Approach to Short St Intersection
2 Signalized Intersections
Access Management Entire Section
Add Advance Warning Signage I-30 Northbound Frontage Rd
Add Advance Warning Signage (With Flashing Beacon)
Add/Improve Pavement Markings
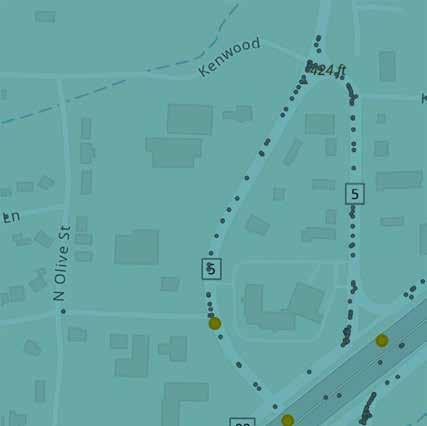

Southbound Approach to Market St Intersection or “Be Prepared to Stop” Supplemental Plaque
(Add stop bar and crosswalk pavement markings across all minor street approaches to Hwy 35/ Carpenter St/East St where there is a stop condition and sidewalk) Entire Section
Other Countermeasures
Further Study Needed (RSA)
Around Carpenter St, East St, Military Rd, Narroway St, and Main St Intersections


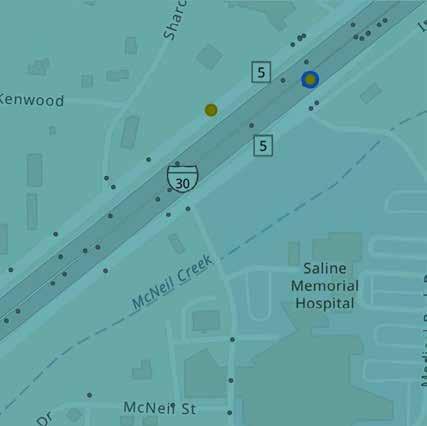

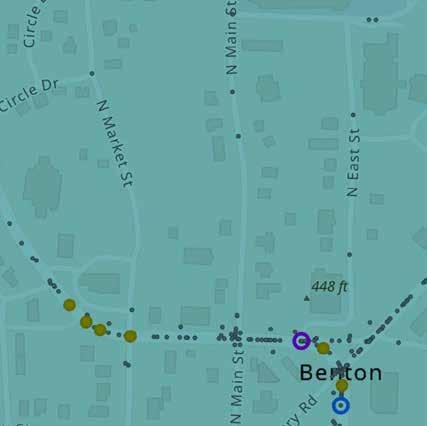

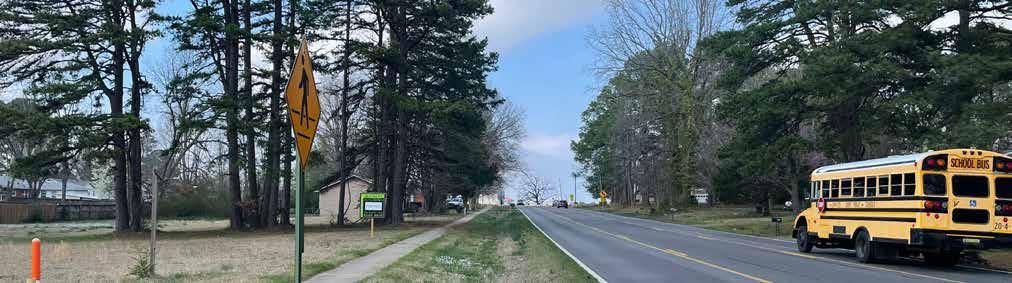
Project Location Discussion
This 4.1 mile section of Hwy 89/Pine St consists of four HIN segments that scored in the top 20 HIN segments with safety improvement needs in the Region. This section of Hwy 89/Pine St connects Hwy 67 to the downtown area of the City of Cabot, providing access to various businesses, neighborhoods, and multiple schools. Lincoln St intersects Pine St near the bend in the corridor and provides access to four closely located public schools that range from elementary to high school. Public comments identified the need to improve operations in the vicinity of the schools, particularly for emergency vehicles that are unable to respond to incidents quickly when there is school traffic. Field observations identified the need for improvements to the pedestrian and bicycle infrastructure along the corridor, particularly in the vicinity of schools. Sidewalks exists in short sections along one side or the other ofPine St south of Lincoln St, resulting in pedestrians crossing back and forth across Pine St. The sidewalk does not extend all the way to Bill Foster
Memorial Hwy, where there two more large public schools are located.
Although this section of Hwy 89/Pine St does not have an access point density as high as other project locations, there are still many businesses with multiple driveways and driveways within intersections. This likely contributed to the 60 percent of crashes having occurred at intersections. Almost half of the crashes within the project’s extents were rear-end crashes. Drivers may be following too close and are not prepared for a vehicle to pull into the intersection approach from a driveway or do not slow down in time when the vehicle in front of them unexpectedly turns into a driveway instead of continues to the intersection. A serious injury rear-end crash occurred at the offset T-intersecitons of Panther Trl and Bradley Dr, likely due to a following vehicle accelerating after the Panther Trl signal and hitting the vehicle ahead as it turned onto Bradley Dr. This intersection layout also risks head-on and angle crashes as northbound vehicles accelerate after the signal and hit opposing vehicles turning left onto Bradley Dr. The abundance of access points and
a continuous two-way left-turn lane also creates the risk for head-on, sideswipe in the opposite direction, and angle type crashes.
Project Recommended Countermeasures
Hwy 89/Pine St is currently a state route but is anticipated to become the City of Cabot’s responsibility in the near future. ARDOT is currently reconstructing the Hwy 67 and Hwy 89 Interchange, as well as converting the intersection of Rockwood Dr and Hwy 89 to a roundabout. This ARDOT project will also include pedestrian infrastructure to improve safety and connectivity between the residential areas, shopping centers, and other businesses on either side of Hwy 67.
Most of the countermeasures identified for the Hwy 89/Pine St project are recommended to address crashes that occur at intersections and at night and crashes involving pedestrians and bicyclists. While the access management recommendation for this location is similar to the recommendation in other projects, referring to the consolidation and relocation of access points where possible, this project’s access management includes an additional aspect of managing access. This project recommends the consideration of additional roadway and trail connections to the various schools along Lincoln St to disperse vehicles and encourage the use of alternate modes of transportation.
The Central Arkansas Regional Greenway Plan proposes a greenway loop connecting the schools along Lincoln St to nearby neighborhoods, as well as a trails along Pine St and an alternate route to Pine St to the south of Main St that connect two more schools and neighborhoods near Bill Foster Memorial Hwy.
Crash Severity
Count Within Project Area
Bikeway (Separated from Vehicular Traffic)
Along Pine St, Main St, Adams St, Locust St, Panther Trl, and Bill Foster Memorial Hwy
High Visibility Crosswalk Pavement Markings 9 Signalized Intersections
Pedestrian Refuge Median/Island Bill Foster Memorial Hwy
Rectangular Rapid Flashing Beacon (RRFB) Near Pine St and Main St Intersection
Add/Improve Sidewalk East of 2nd Street
Sidewalk Buffer East of 2nd Street
Install Pedestrian Signal at Signalized Intersection (With Accessible Pedestrian Signal (APS))
Convert Diagonal Ramps to Directional Ramps
Retroreflective Backplates
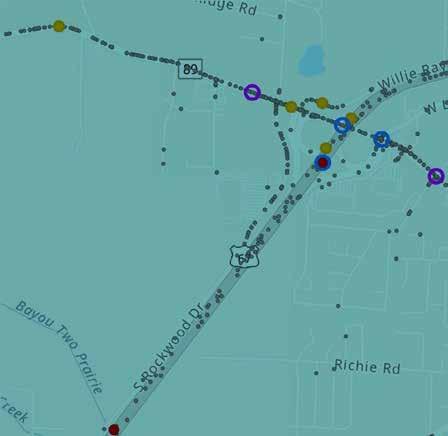
6 Signalized Intersections
Entire Section
Install Pedestrian Signal at Signalized Intersection
11 Signalized Intersections
Access Management (Accompanied by review of medians and turn lanes)
Access Management
Add Advance Warning Signage
Add Pavement Markings
Add/Improve Pavement Markings (Add stop bar and crosswalk pavement markings across all minor street approaches to Pine St where there is a stop condition and sidewalk)
Add Pavement Markings
Add Pavement Markings
Intersection Reconfiguration
Traffic Siganl Adjustments
Entire Section, Particularly Near Lincoln St and Bill Foster Memorial Hwy Intersections
Develop Alternate Routes for School Traffic on Lincoln St, Consider Widening Bellamy St
Offset T-Intersections at Panther Trl and at Bradley Dr, and RRFB Proposed Near Pine St and Main St Intersection and Crossing at Lincoln St
Yield for Hwy 67 Off-Ramp Northbound Right-Turn Movement and 'Puppy Tracks' for Dual Left-Turns at 2nd St Northbound Approach
Entire Section
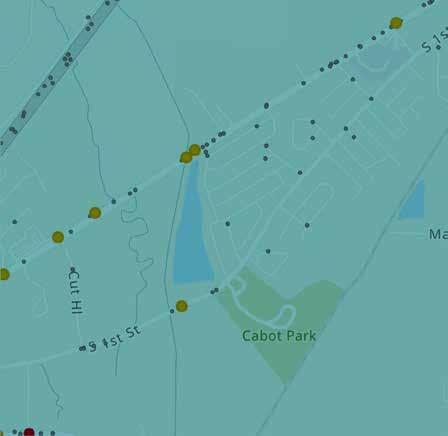
Add ‘Puppy Tracks’ for Westbound Approach at 2nd St to Guide Through Vehicles
Lane Designation Arrow Pavement Markings for Large Queues at Bill Foster Memorial Hwy Intersection Approaches

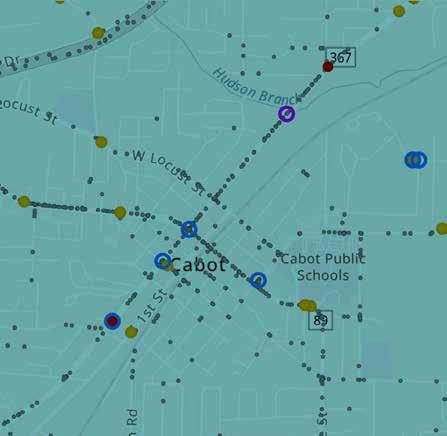
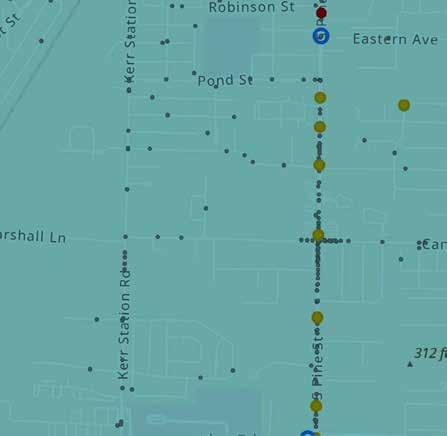
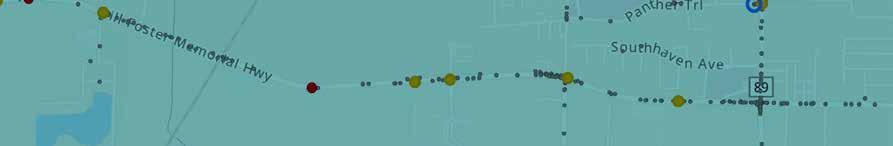
Align Offset T-Intersections, such as Panther Trl and Bradley Dr
Make Left-Turn Indication Consistent Along Entire Section
Segment: From Bruce St to Moix Blvd • Jurisdiction: City of Conway
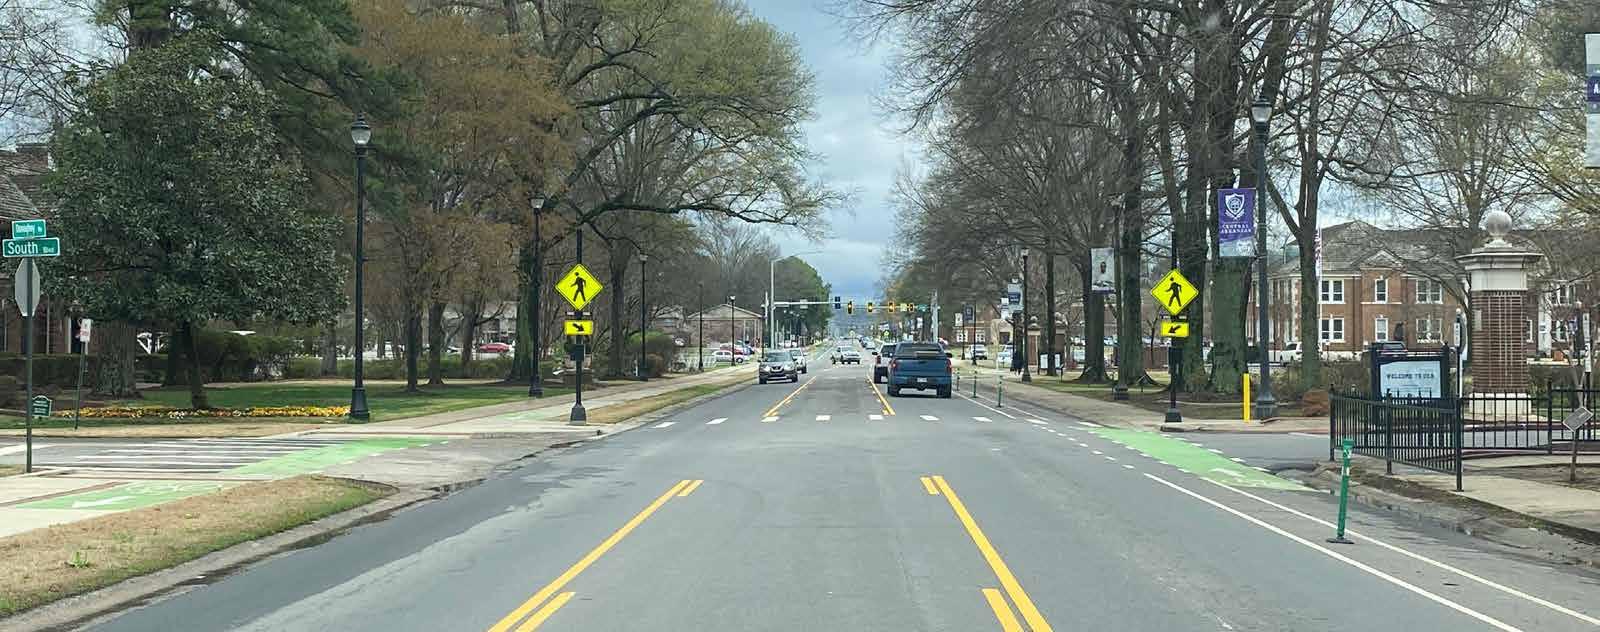
This almost 1 mile long project along Donaghey Ave is made up of one HIN segment that scored in the top 5 HIN local road segments with safety improvement needs within Faulkner County. This section of Donaghey Ave passes between the east edge of the University of Central Arkansas campus and student housing and provides access to restaraunts along Dave Ward Dr, therefore students contribute to a higher volume of pedestrian and bicycle traffic in the area. Bike
lanes with green paint and crossings with rectangular rapid flashing beacons (RRFBs) and pedestrian refuge islands were recently constructed along this section to improve safety for these vulnerable road users.
However, these improvements end at the Dave Ward Dr intersection despite there being four crashes involving pedestrians and bicyclists on Donaghey Ave between Dave Ward Dr and Moix Blvd. The southbound bike lane suddenly ends approximately 400 feet before Dave Ward Dr and the pedestrian
crossing distances are very long across each leg of the intersection. Public comments also identified the need to slow vehicles along the corridor because drivers often must decelerate quickly to stop in time for a pedestrian using an RRFB, likely contributing to over 65 percent of the crashes along the corridor being rear-ends.
Most of the public comments along this corridor identified the need to improve leftturn treatments. Some of these concerns were related to the inconsistent signal
Crash Severity
indications for protected vs permissive left-turns, as well as signal timing conflict between the protected left-turn phase and the walk phase for pedestrians, particularly at the intersection at Bruce St. Many rearend crashes have occurred within this intersection, possibly a result of drivers beginning to make a left-turn then suddenly stopping in the middle of the intersection when they realize there is a pedestrian is in the crosswalk. Other concerns were related to confusion caused by the striping of a two-way left-turn lane at the approaches to intersections where there is no left-turn, such as at Robins St.
All of the countermeasures identified for the Donaghey Ave project are recommended to address crashes that occur at intersections, particularly those related to left-turns, and crashes involving pedestrians and bicyclists.
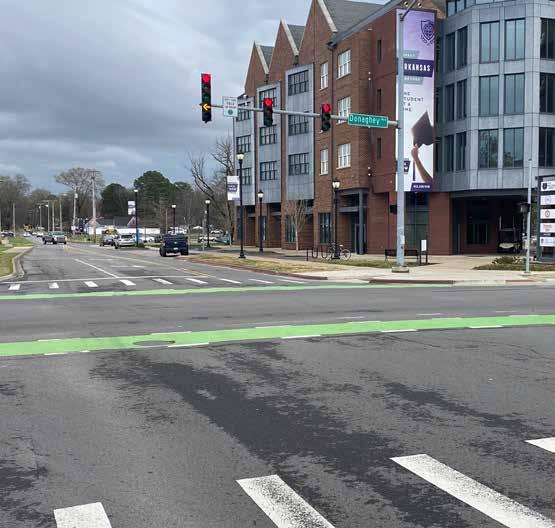
Injury Minor Injury
Count Within Project Area
Lanes
High Visibility Crosswalk Pavement Markings
3 Signalized Intersections
Sidewalk Buffer Where Possible
Convert Existing Pedestrian Signal to Accessible Pedestrian Signal (APS)
Where Not Already Implemented
Convert Diagonal Ramps to Directional Ramps Entire Section
Vehicular Countermeasures
Retroreflective Backplates
2 Signalized Intersections
Access Management Entire Section
Safety Lighting Entire Section
Add Advance Warning Signage (With Flashing Beacon) RRFBs
Add/Improve Pavement Markings (Add stop bar and crosswalk pavement markings across all minor street approaches to Donaghey Ave where there is a stop condition and sidewalk)
Adjust Traffic Signal Timings
Avoid Conflict Between Left-Turns and Pedestrians at Bruce St
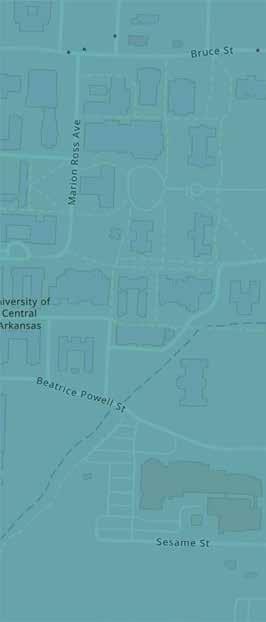

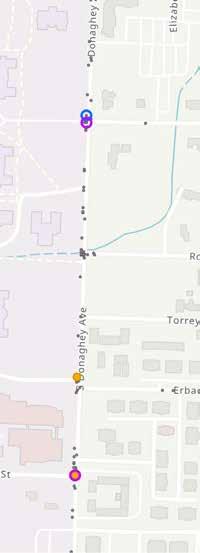
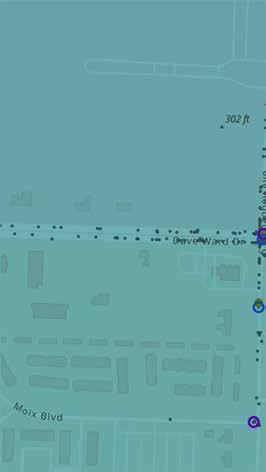
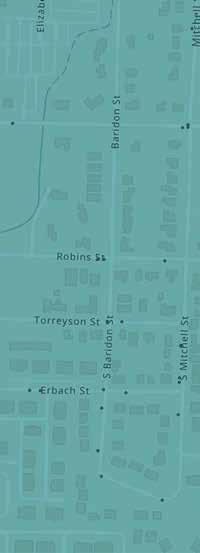
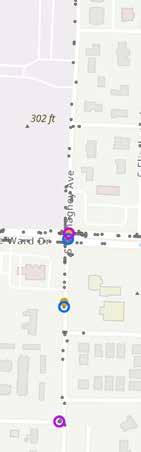

Segment: From Old Congo Rd to Alcoa Blvd • Jurisdiction: City of Benton
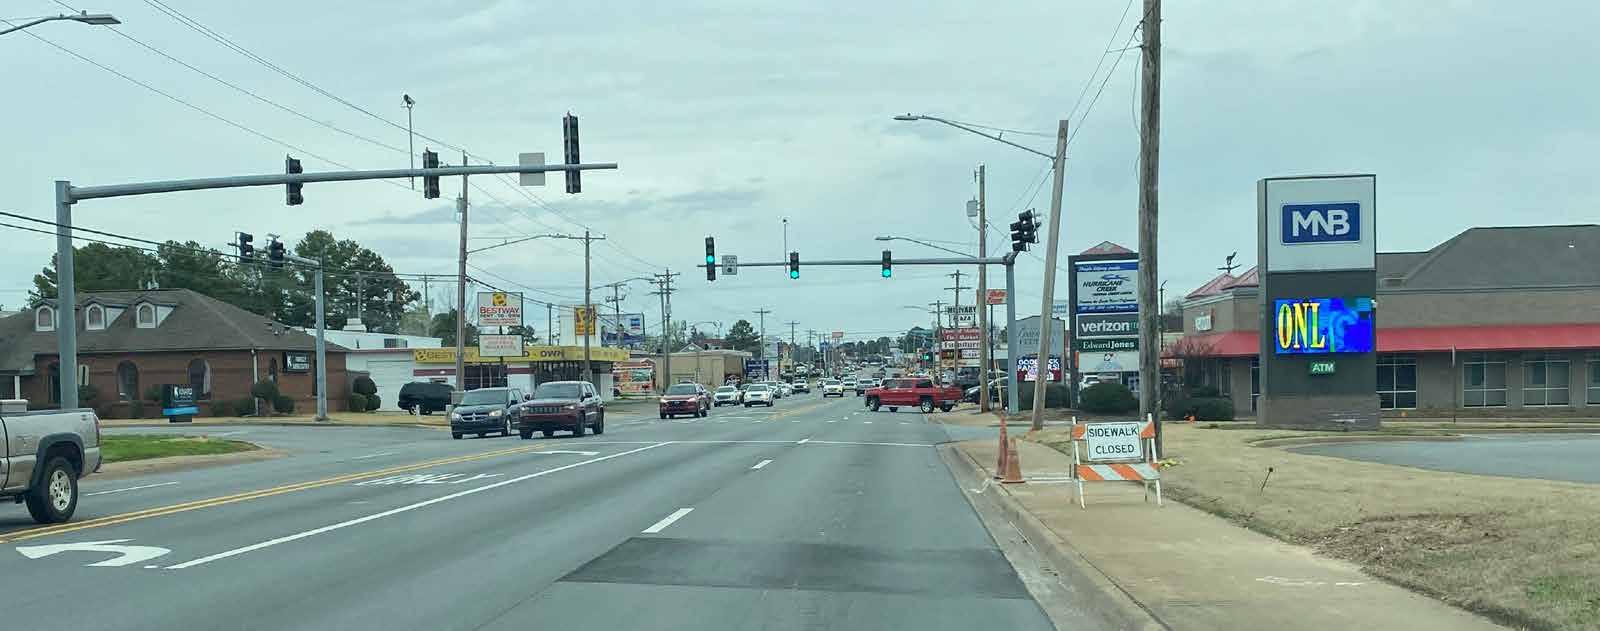
This 0.8 mile project on Military Rd consists of one HIN segment that scored in the top 5 HIN local road segments with safety improvement needs within Saline County and connects two of the top 10 High Injury Intersections with safety improvement needs in Saline County, at Landers Dr and the US Post Office driveway.
This section of Military Rd runs parallel to I-30 and is lined with a wide range of businesses, shops, restaraunts, and grocery stores on
both sides. The high density of access points along the north and south sides of Military Rd and a continuous two-way left-turn lane creates the risk for head-on, sideswipe in the opposite direction, and angle type crashes along the entire section.
Residential area borders the businesses on the south side of the road, leading to many pedestrians walking to the businesses and needing to cross Military Rd to get to the large grocery stores on the north side. However, there are large gaps between
traffic signals where pedestrians can cross more safely which has lead to a serious injury crash involving a pedestrian. The abundance of commercial driveways and intersections also results in an abundance of gaps in the sidewalk.
Most of the countermeasures identified for the Military Rd project are recommended to address crashes that occur at intersections and commercial driveways and crashes involving pedestrians and bicyclists.
Count Within Project Area
High Visibility Crosswalk Pavement Markings
Pedestrian Hybrid Beacon (PHB)
3 Signalized Intersections
Midblock Crossing Near Subway
Improve Sidewalk Entire Section
Sidewalk Buffer Where Possible
Install Pedestrian Signal at Signalized Intersection
Convert Diagonal Ramps to Directional Ramps
2 Signalized Intersections
Entire Section
Vehicular Countermeasures
Review Lanes and Pavement Markings and Possibly Reconfigure to Reduce Speeds
Retroreflective Backplates
Access Management (Accompanied by removal of or conversion of TWLTL to dedicated left-turn lane)
Add/Improve Pavement Markings
Entire Section
3 Signalized Intersections
Entire Section
(Add stop bar and crosswalk pavement markings across all minor street approaches to Military Rd where there is a stop condition and sidewalk) Entire Section


Segment: From Wayne Ln to Carson Bridge Rd • Jurisdiction: Lonoke County
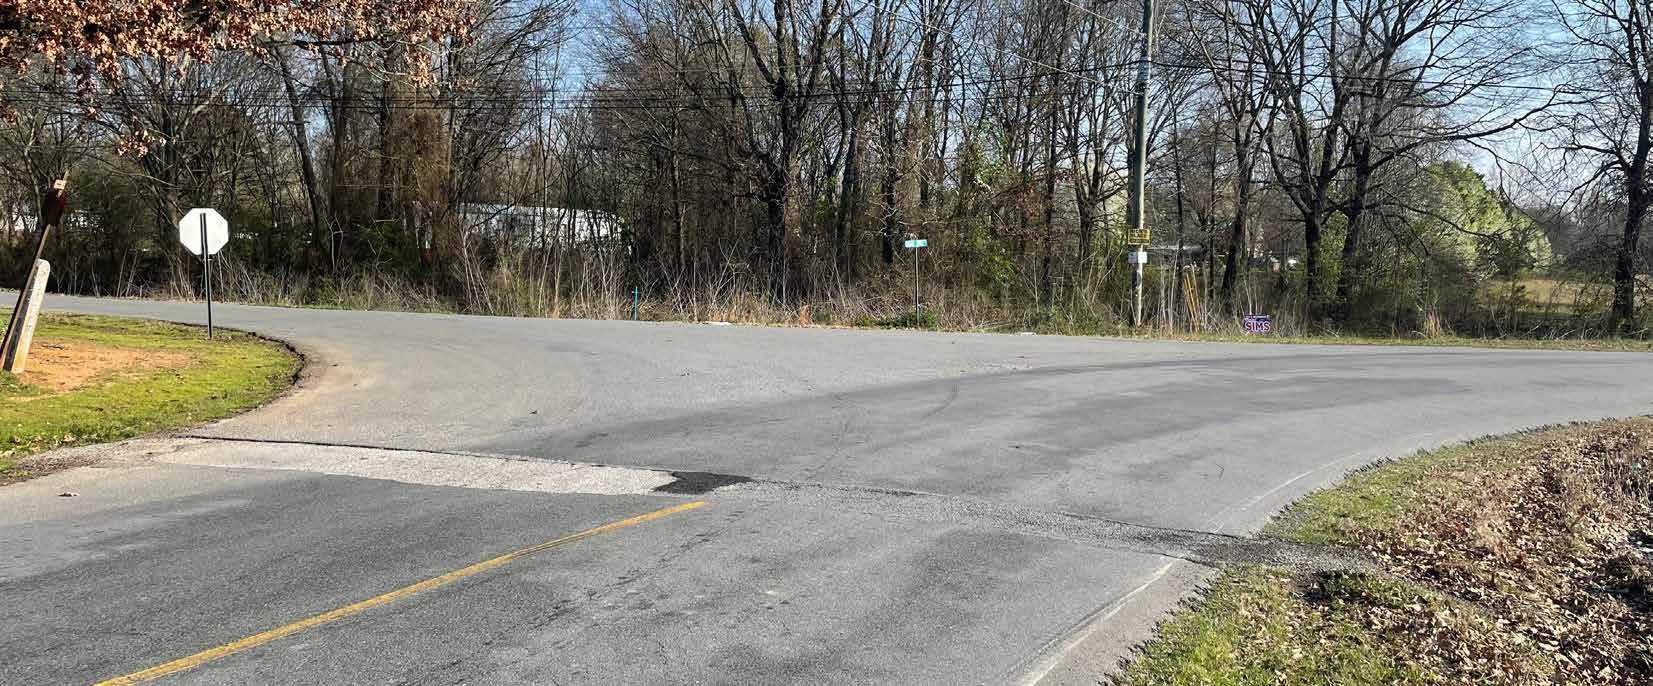
This two mile section of Kerr Rd consists of two HIN segments that ranked in the top 5 local road HIN segments within Lonoke County needing safety improvements. The project location is contained between two 90-degree curves that do not have chevrons or sufficient warning signage at either approach. An advance curve warning sign with a speed limit 20 MPH sign is present
at the westbound approach to the west curve, but appears to have been hit as it is angled away from the road, below eye level, and is blocked by overgrown vegetation. An advance curve warning sign is also present at the southbound approach to the east curve and is similarly in poor condition and not very visible.
This two-lane road has very narrow lanes with no shoulder and a ditch along a large
portion of the corridor. The centerline and edgeline pavement markings have faded and no edgeline exists around the east curve to indicate that Kerr Rd curves at Carson Bridge Rd to direct drivers from continuing straight onto Carson Bridge Rd. There is also no stop bar at the stop sign for the westbound approach of Carson Bridge Rd at the east curve.
About two thirds of the crashes within this


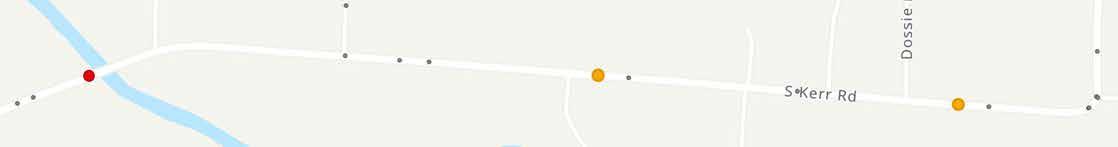

project’s extents occurred between dusk and dawn, including three of the four fatal and serious injury crashes. There is no lighting provided along this section of Kerr Rd for visibility at night. Dense vegetation and tall trees along both sides of some portions of the road may cast shadows during the day, making it difficult for drivers to see during the day as well.
All of the countermeasures identified for the Kerr Rd project are recommended to address crashes that occur at the 90-degree curves at either end of the project extents and run off the road crashes. Although most of the crashes were at night, corridor lighting is not included in this project due to the feasibility challenges at this rural location. Longitudinal rumble strips, pavement markings, and increased signage are alternate countermeasures anticipated to improve safety along the corridor, including at night.
About two thirds of the crashes within this project’s extents occurred between dusk and dawn, including three of the four fatal and serious injury crashes.
Countermeasure Location(s)
Vulnerable Road User Countermeasures
Enhanced Curve Delineation 2 90-Degree Curves
Longitudinal Rumble Strips
Centerline and Edgeline of Entire Section (Or Raised Reflective Pavement Markers)
Add Advance Warning Signage In Advance of 2 90-Degree Curves with Supplemental Reduced Speed Plaque
Centerline and Edgeline Along Entire Section
Add/Improve Pavement Markings
(Add Solid White Edgeline Stripe Through Curve at Carson Bridge Intersection and Stop Bar at Carson Bridge Westbound Approach Stop Sign)
Guardrail At Approaches to Bridge
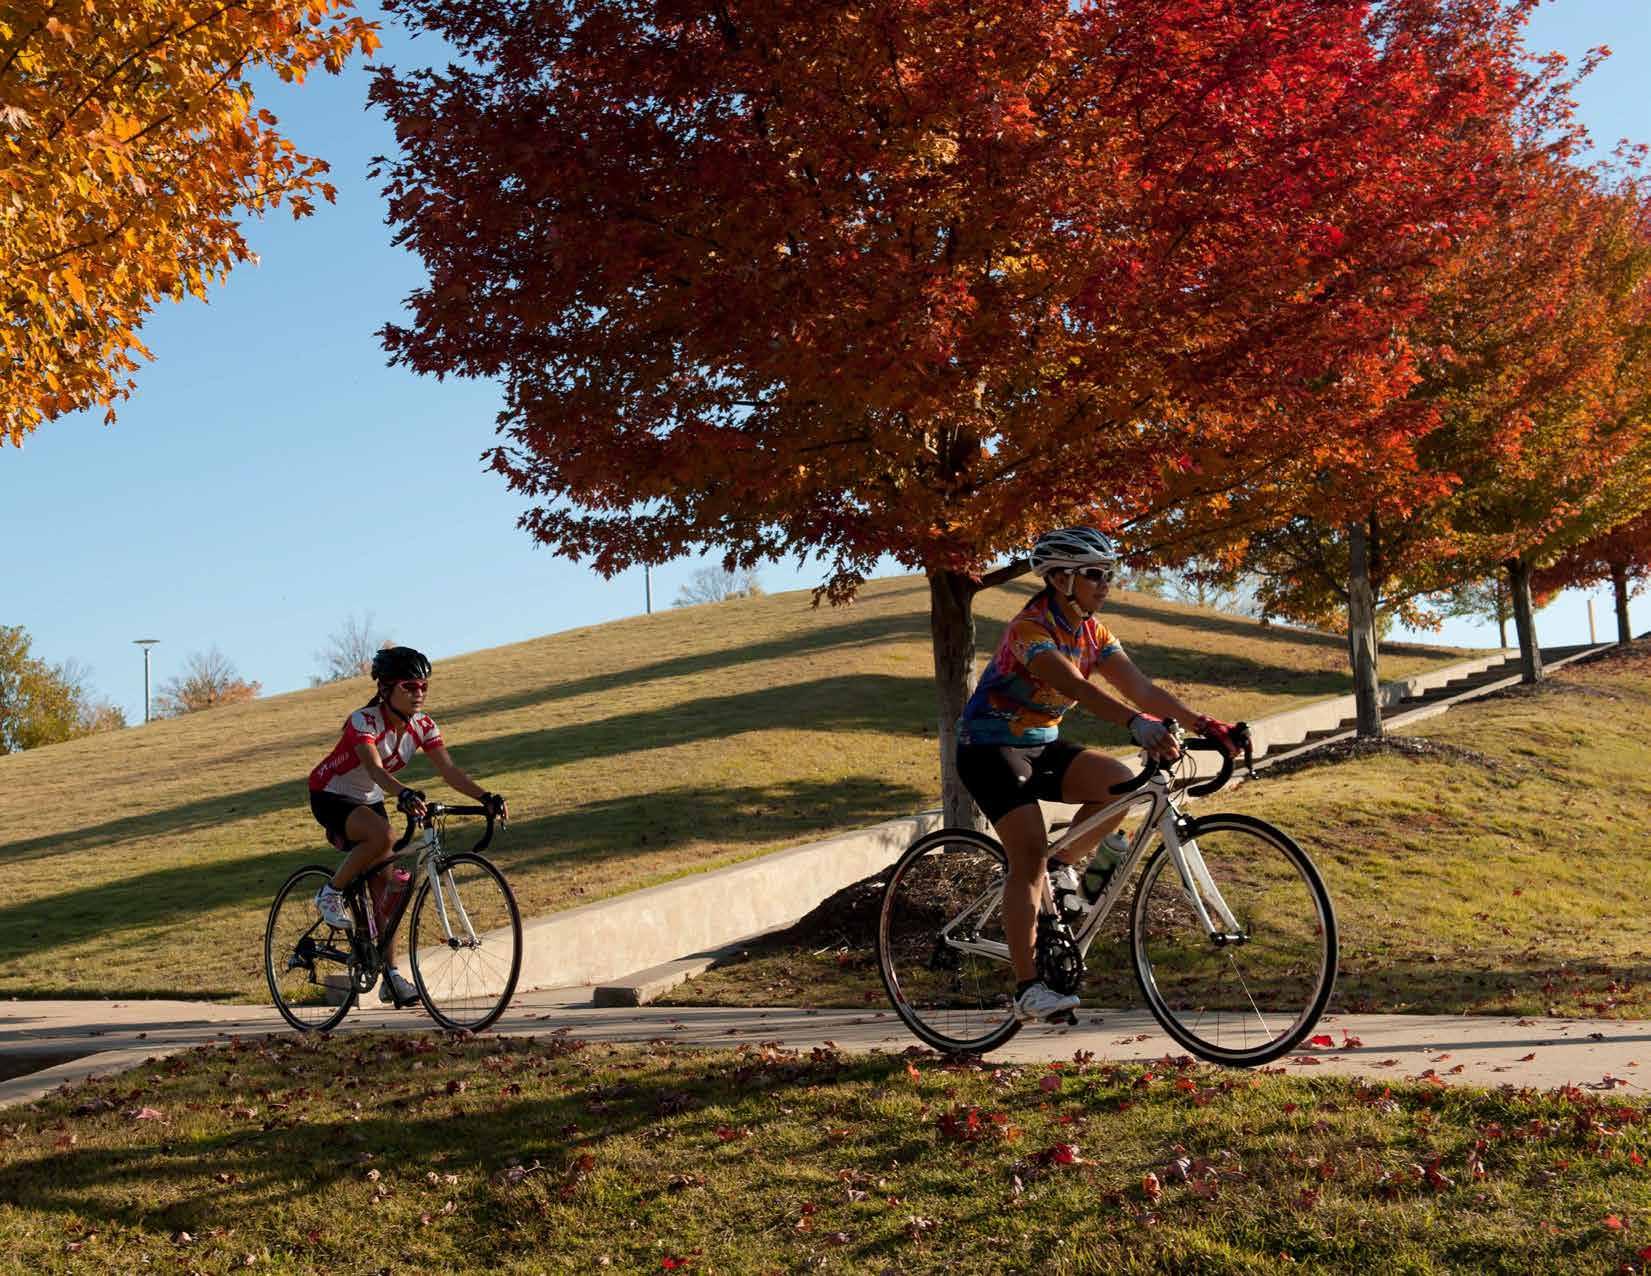
Add Side Path
Add High Visibility Crosswalk Pavement Markings
Add Pedestrian Refuge Medium/Island
Add Pedestrian Hybrid Beacon (PHB)
Vulnerable Road User Infrastructure
$1,400,000 Per Mile (one side)Assumes urban area with driveway crossings.
$3,000 Per Crossing
$20,000 Per Crossing
$150,000 Per Crossing
Add Rectangular Rapid Flashing Beacon (RRFB)$30,000 Per Crossing Assumes three assemblies.
Add Sidewalk
Add Sidewalk Buffer
$700,000 Per Mile (one side)
$800,000 Per Mile (one side)
Assumes reconstruction of existing driveways. Does not include right-of-way, utility relocation, and site modifications.
Assumes reconstruction of existing driveways. Does not include right-of-way, utility relocation, and site modifications.
Add Pedestrian Signal at Signalized Intersection$10,000 Per Crossing Assumes one signal on each side of crossing.
Convert Diagonal Ramps to Directional Ramps$30,000 Per Corner Assumes changing one single ramp to two directional ramps.
Create Grade Separated Crossing
Enhance Curve Delineation
Add Longitudinal Rumble Strips
Add Retroreflective Backplates
Access Management
Add Lighting
Add Advance Warning Signage
Add/Improve Pavement Markings
Add Traffic Signal
$4,000,000 Per Crossing Assumes pedestrian bridge over road.
Vehicular Infrastructure
$750 Per 100' of Curve
$15,000 Per Approach Assumes three lane approach.
$300 Per Backplate
$1,250,000 Per Mile (Both Sides)
Reduction in curb cuts and removal of or conversion of two-way left turn to dedicated left turn. Does not include right-of-way, utility relocation, and site modifications.
$375,000 Per Mile Assumes new poles at 200 feet spacing.
$20,000 Per Approach Assumes two static signs with a flashing beacon on each.
$2,000 Per Approach
$400,000 Per Intersection Assumes four-legged intersection.
Update Left-Turn Signal to Flashing Yellow Arrow$10,000 Per Approach
Intersection Reconfiguration
Add Bus Stop Bulb-Out
$4,750,000 Per Intersection
Transit Infrastructure
$45,000 Per Bulb-Out


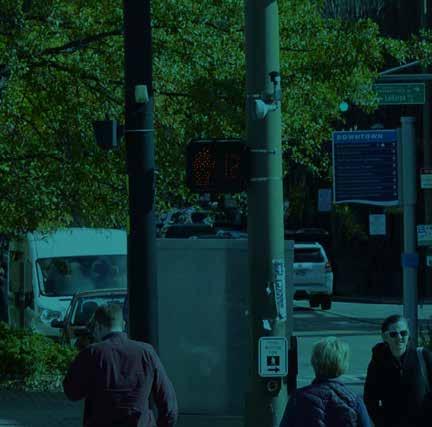
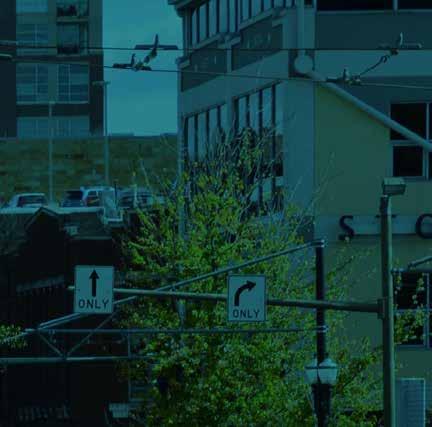
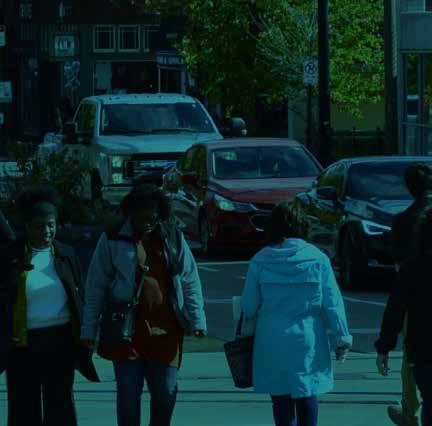
Our Goal: 40% reduction in fatal and serious injury crashes by 2040 40 by 40
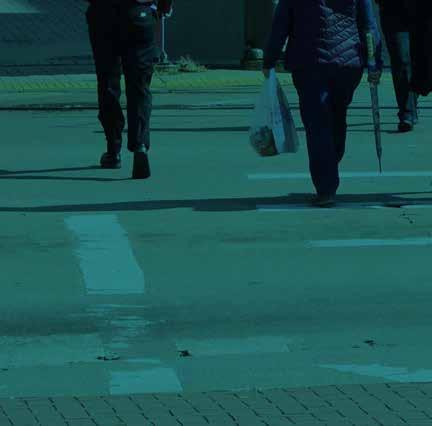


Supplemental County Level Plan
November 2024


The information provided in this document is intended to be used for informational purposes only. No expressed or implied warranties are made by Metroplan, Kimley-Horn, Traffic Engineering Consultants, Crafton Tull, and Laneshift concerning the accuracy, completeness, reliability, and usability of this information. Further investigation such as field verification, site condition assessments, engineering analysis, and design are necessary prior to implementing any of the guidance contained herein.
This report was funded in part through grant(s) from the Federal Highway Administration and Federal Transit Administration, U.S. Department of Transportation. The views and opinions of the authors expressed herein do not necessarily state or reflect those of the U.S. Department of Transportation.
Notice of Nondiscrimination Metroplan complies with all civil rights provisions of the federal statutes and related authorities that prohibit discrimination in programs and activities receiving federal financial assistance. Therefore, Metroplan does not discriminate on the basis of race, sex, color, age, national origin, religion, disability, or income status, in admission or access to and treatment in Metroplan’s programs and activities, as well as Metroplan’s hiring or employment practices. Complaints of alleged discrimination and inquiries regarding Metroplan’s nondiscrimination policies may be addressed to Sydney Dozier, Title VI/ADA/504 Coordinator, 501 West Markham Street, Suite B, Little Rock, AR 72201, (501) 372-3300, or the following e-mail address: sdozier@metroplan.org
(Hearing and speech impaired may dial 711.) This notice is available upon request from the Title VI/ADA/504 Coordinator in large print, audiotape or braille.
November 20, 2024
24-13
National Highway Traffic Safety Administration
Pedestrian Hybrid Beacon
Rectangular Rapid Flashing Beacon
Road Safety Audit
Safety Action Plan Advisory Committee
Strategic Highway Safety Plan SS4A Safe Streets and Roads for All
Two Way Left Turn USDOT US Department of Transportation VMT Vehicle Miles Traveled
Vulnerable Road User


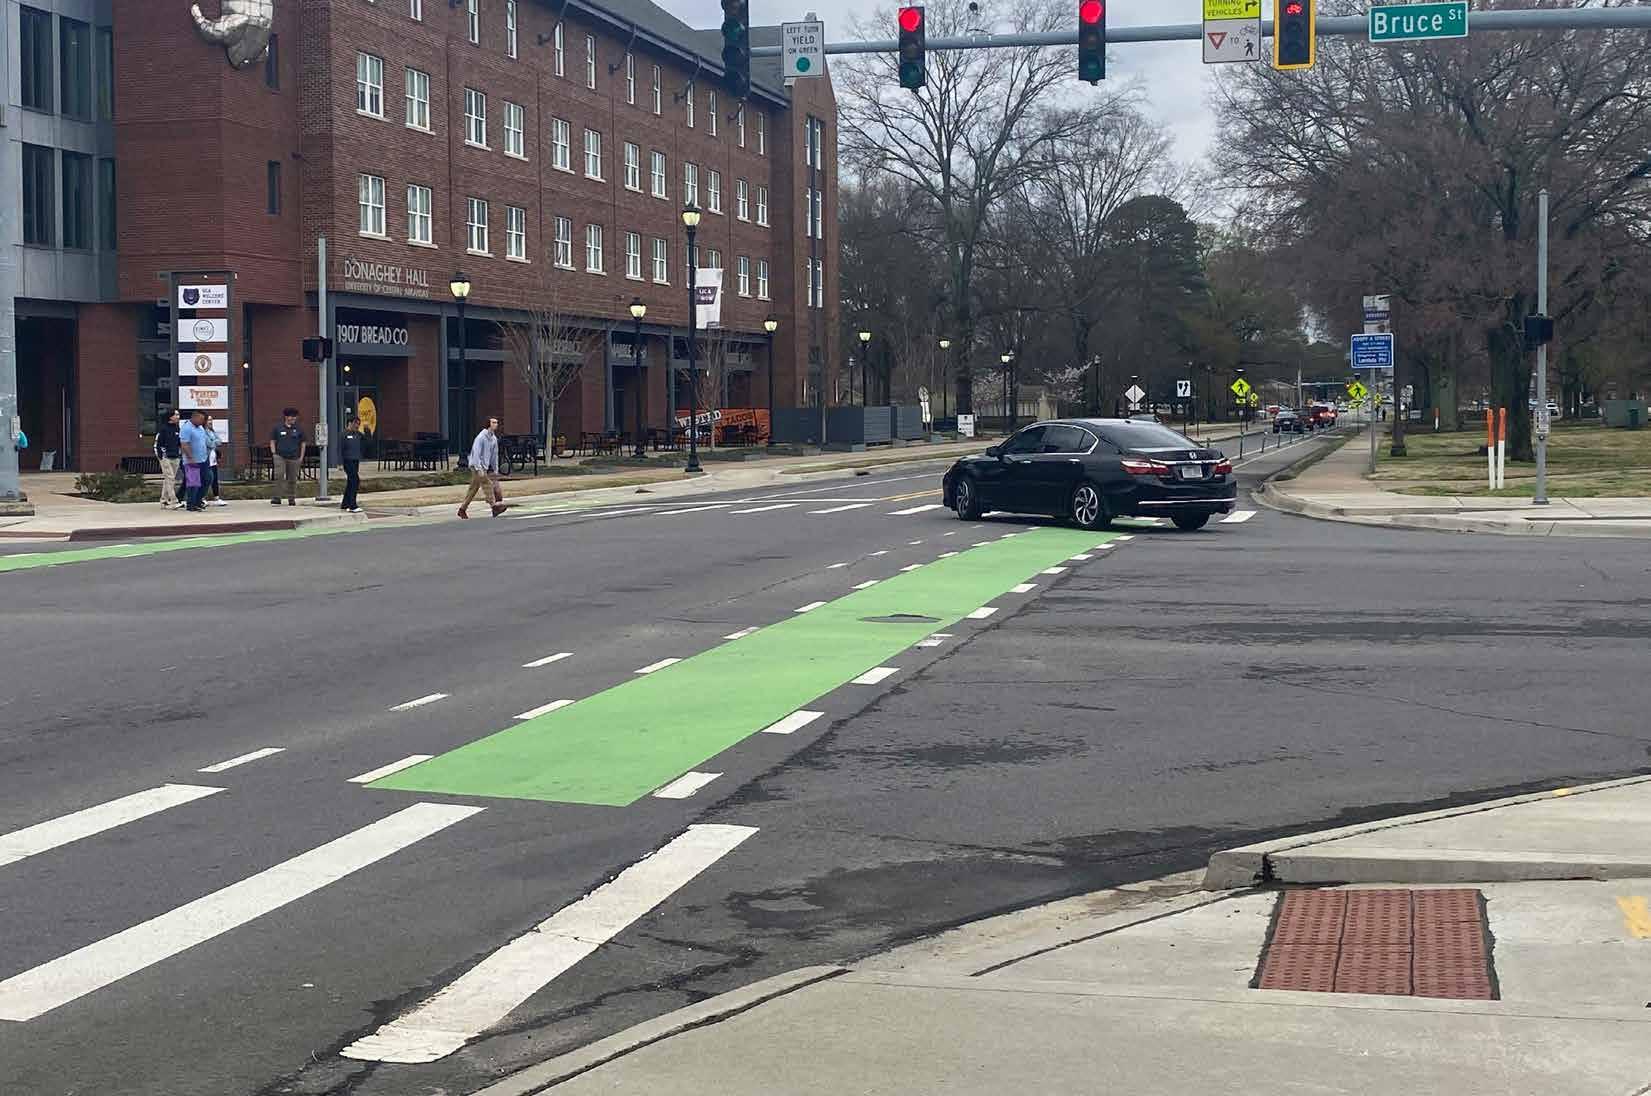
The purpose of the Faulkner County Supplemental County Level Plan is to address the specific safety needs and projects identified by local stakeholders within Faulkner County. The Supplemental County Level Plan expands on the Central Arkansas Safety Action Plan by focusing on additional segments and intersections located within Faulker County’s High Injury Network (HIN) and High Injury Intersections that were not already addressed in Central Arkansas Safety Action Plan. Unlike the Central Arkansas Safety Action Plan, which considers the entire Central Arkansas Region as a whole and consists of Faulkner, Lonoke, Pulaski, and Saline Counties, this Supplemental County Level Plan focuses exclusively on Faulkner County (“the County”). Its main objectives are to identify projects and implement strategies that can help Faulkner County reduce fatal and serious injury crashes on its roadways, with the ultimate goal of eliminating these crashes all together. This is a crucial step towards achieving the same goal of eliminating fatal and serious injury crashes for the entire Central Arkansas Region. The Central Arkansas Safety Action Plan used a primarily data driven approach to develop regional projects. The Supplemental County Level Plan is also primarily data driven, but relies on input from local agencies to select segments and intersections as a key selection criteria in developing regional projects.
The Central Arkansas Safety Action Plan was created to determine which corridors have the greatest need for safety improvements and identify projects and strategies to help Central Arkansas reduce fatal and serious injuries on the Region’s roadways. The plan was developed by Metroplan and funded through a grant from the United States Department of Transportation (USDOT) Safe Streets and Roads for All (SS4A) Program. Central Arkansas leaders from the Metroplan Board of Directors committed to a goal of reducing fatal and serious injury crashes in Central Arkansas by 40 percent by the year 2040. The leaders set several interim goals starting with a baseline to be established in 2025 and incremental steps through the year 2050 to get an 80% reduction.
The Central Arkansas Safety Action Plan includes a large public engagement effort. Several engagement methods were used, including both online and in person public engagement, which consisted of an online survey and an interactive mapping activity, open houses, and booths at community events. The project team conducted stakeholder engagement, which included workshops with the Metroplan Board, meetings with the Safety Action Plan Advisory Committee (SAPAC), and stakeholder walk audits. The public and stakeholder engagement efforts were used to identify projects and implement strategies to increase safety in Central Arkansas.
The Central Arkansas Safety Action Plan includes a list of Regional High Injury Network (HIN) segments and High Injury Intersections. The threshold crash per mile value for segments included in the HIN was
two fatal and serious injury crashes per mile or greater from 2018 through 2022. High injury intersections had at least two fatal and serious injury crashes that occurred within 250 feet of the intersection from 2018 through 2022. These segments and intersections were scored and prioritized based on SS4A key objectives to assess the level of need for safety improvements, such as the number of fatal and serious injury crashes, underserved areas, and locations where vulnerable road users such as pedestrians and people on bikes are frequently present. The Central Arkansas Safety Action Plan identifies the 20 highest scoring Regional HIN and 20 highest scoring Regional High Injury Intersections. In addition to the top 20 regionwide segments and intersections, the five highest scoring state route HIN segments and the five highest scoring local roads in each county were identified. Similarity, the five highest scoring intersections of two state routes or a state route and local road, as well as the five highest scoring intersections of two local roads were identified, where applicable.
The Central Arkansas Safety Action Plan also includes a Safety Countermeasures Toolbox, made up of countermeasures recommended by the Federal Highway Administration (FHWA), National Highway Transportation Safety Administration (NHTSA), and Arkansas Department of Transportation (ARDOT) that have been historically proven to increase safety on roadways. Countermeasures include changes in roadway geometry, operations, signage, pavement markings, and access management. These countermeasures have a positive impact on reducing fatal and serious injury crashes and may be used on roadways not identified in the Faulkner County Supplemental Plan. The full list of recommended safety
countermeasures can be viewed in Section 5- Safety Countermeasures Toolbox of the Central Arkansas Safety Action Plan
Ten location-specific projects were developed for the regionwide top 20 segments and top 20 intersections. The ten location-specific projects incorporate the regionwide top 20 segments and top 20 intersections. All but one of the regional projects are in Pulaski County, with the remaining project in Faulkner County. Additional location-specific projects were developed for the highest scoring state route and highest scoring local road in Faulkner, Lonoke, and Saline Counties These location-specific projects consist of combinations of safety improvements from the Safety Countermeasures Toolbox identified in the Central Arkansas Safety Action Plan that are expected to reduce crashes, particularly fatal and serious injury crashes and crashes involving vulnerable road users, within the vicinity of the project location. To view the regional projects that are in Faulkner County, please refer to the Central Arkansas Safety Action Plan
The Central Arkansas Safety Action Plan also includes a list of systemic improvements, developed based on the regional crash analysis and roadway network review. The systemic improvements consist of countermeasures that are implemented based on high-risk roadway features correlated with a particular crash type. Proposed policies to support recommended systemic improvements are included to provide guidance on incorporating safety countermeasures in future roadway and transportation projects.


The main objective of this plan is to identify projects and implement strategies that can help Faulkner County reduce fatal and serious injury crashes on its roadways, with the ultimate goal of eliminating these crashes all together.

by


Our Goal: 40% reduction in fatal and serious injury crashes by 2040


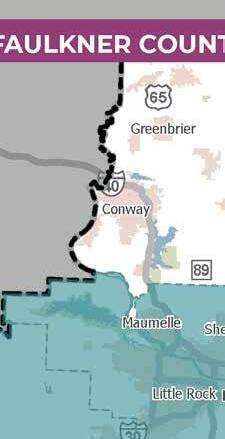


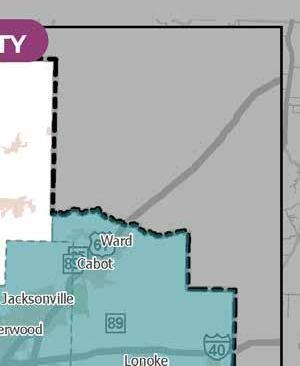
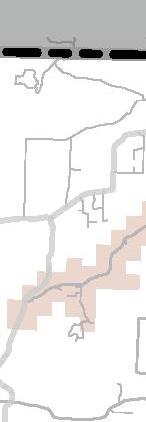
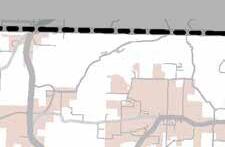
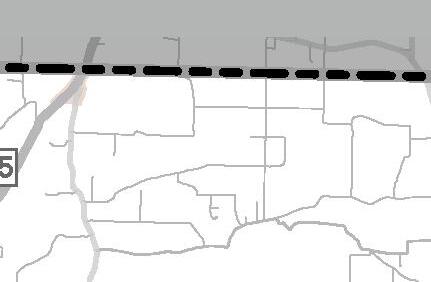

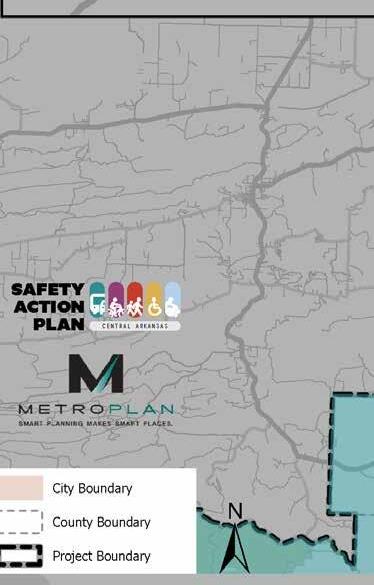
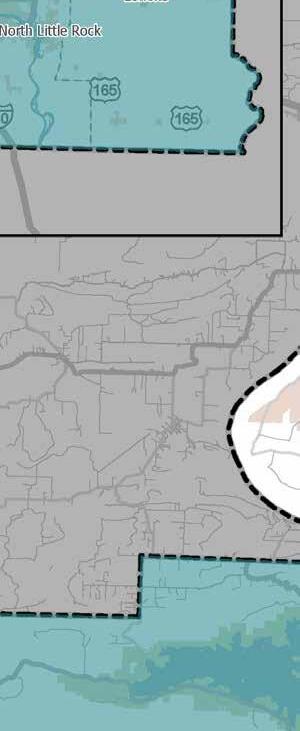
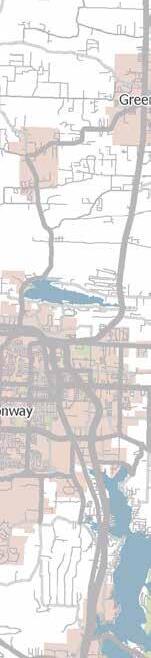

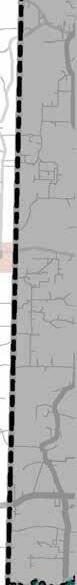
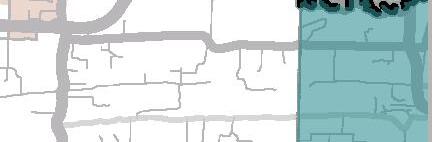
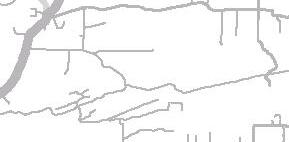
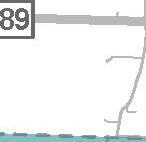
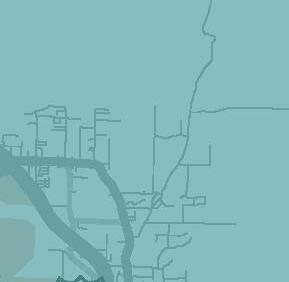
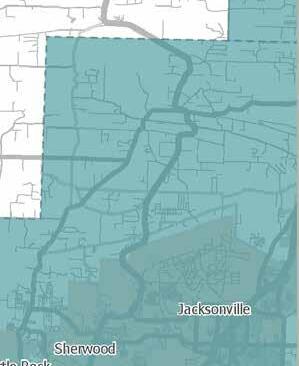
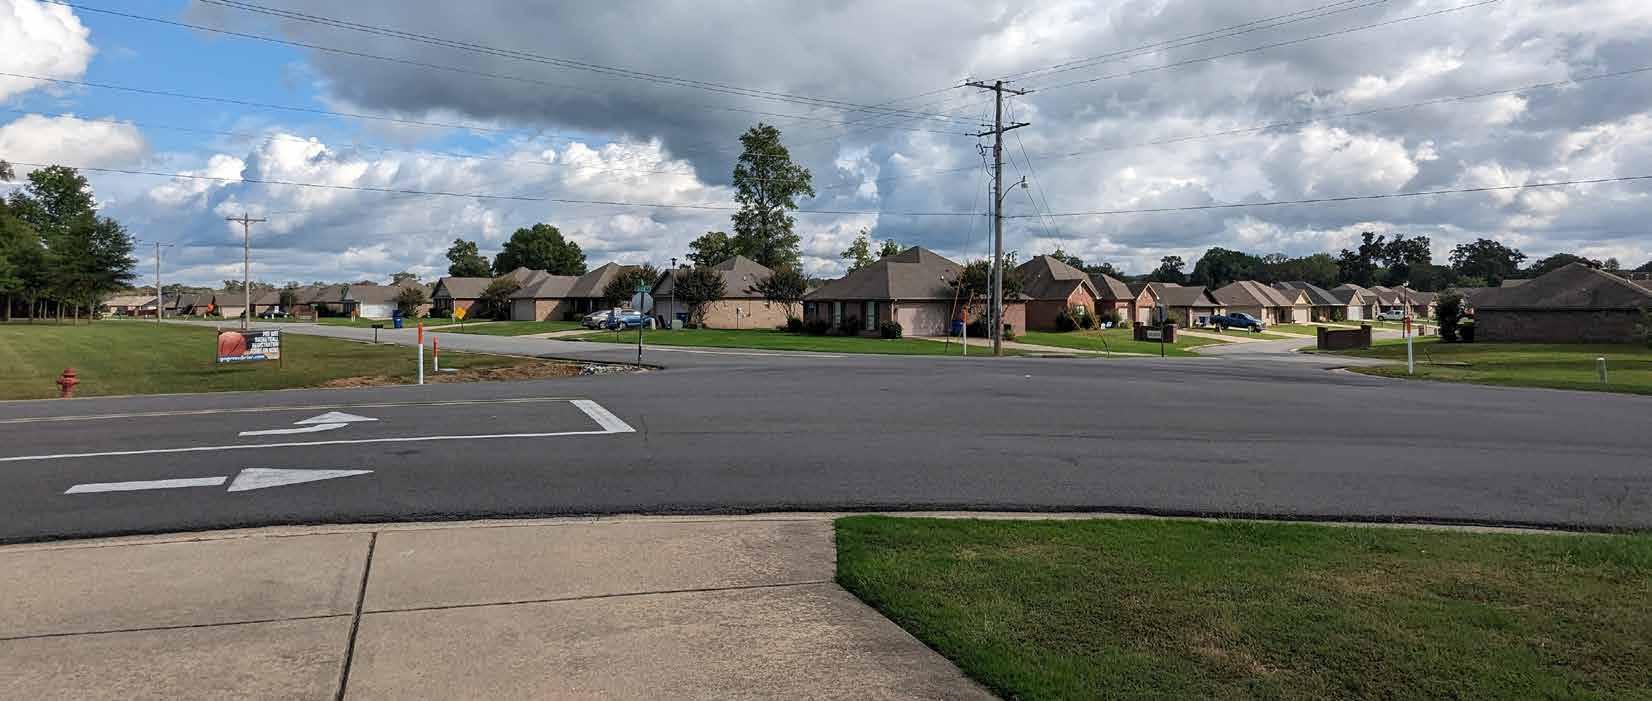
Faulkner County, shown in Figure 1, is located in the Central Arkansas Region and has an approximate population of 130,000 as of July 2023, according to the US Census Bureau. This population accounts for roughly 17 percent of the total population in the Central Arkansas Region. Faulkner County encompasses approximately one fourth of the Central Arkansas Region and includes the Cities of Conway, Greenbrier, Guy, Holland, Mayflower, Quitman, Vilonia, and Wooster. Lane miles within Faulkner County make up 19 percent of the total lane miles within the Central Arkansas Region.
Faulkner County is located in the Central Arkansas Region and has an approximate population of 130,000 as of July 2023.
Faulkner County saw a decline in 2019 but otherwise have stayed in the range of 17 to 19 crashes per year.
A crash analysis was conducted to identify patterns and trends in crash types and common factors contributing to fatal and serious injury crashes within Faulkner County.
From 2018 to 2022, there were over 16 thousand reported crashes within Faulkner County, representing nearly 15 percent of all crashes in the Central Arkansas Region. Of these crashes, 77 resulted in fatalities and 339 resulted in serious injuries. Fatal crashes within Faulkner County saw a decline in 2019 but otherwise have stayed in the range of 17 to 19 crashes per year. Serious injury crashes have seen an increase in crashes each year except 2021.
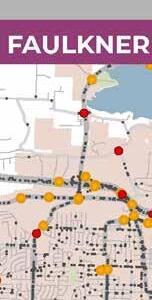
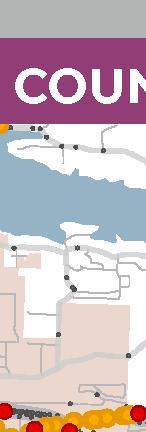
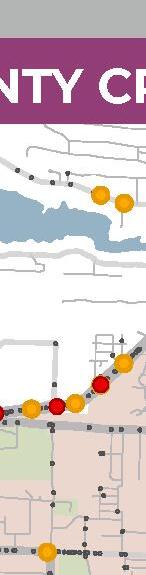
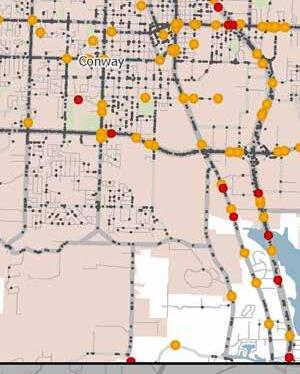
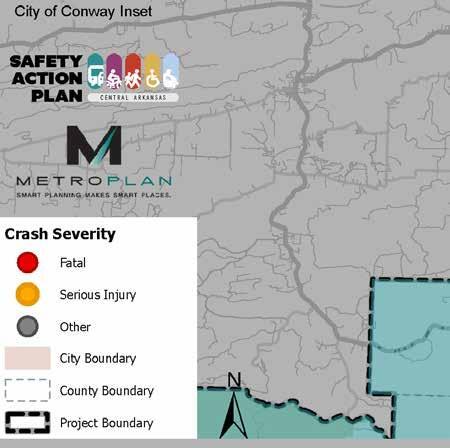
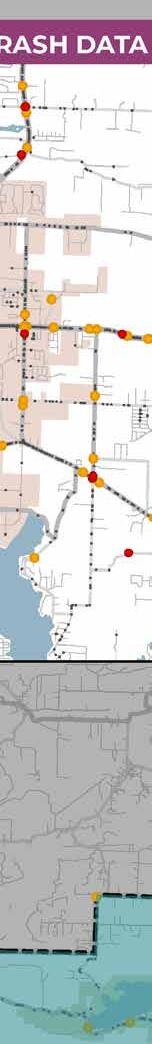
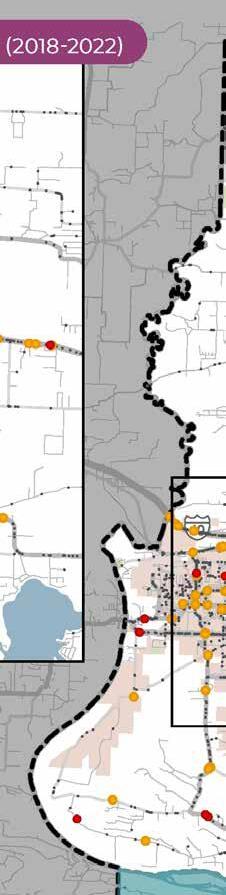
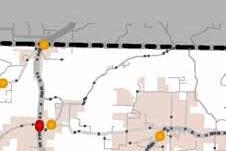
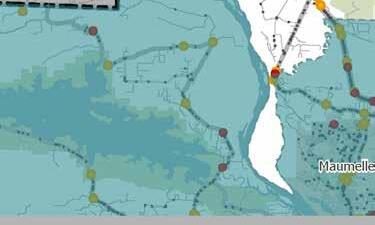
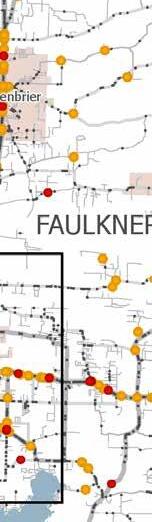
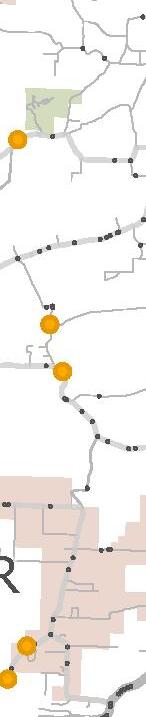
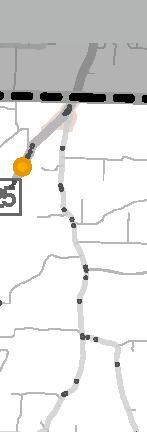
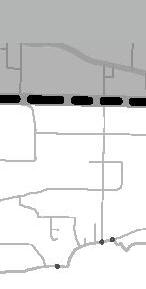
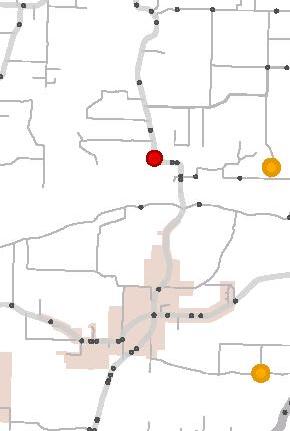
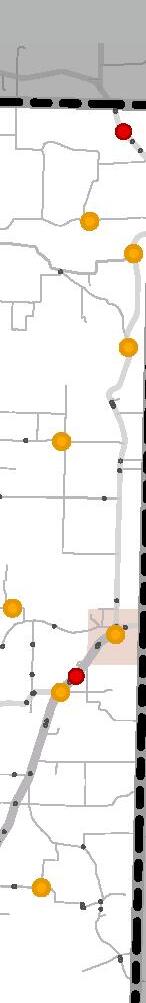
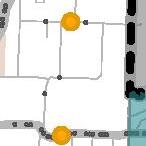
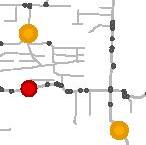
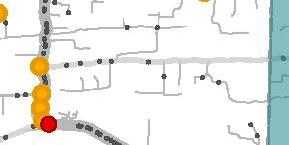
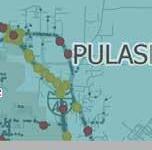
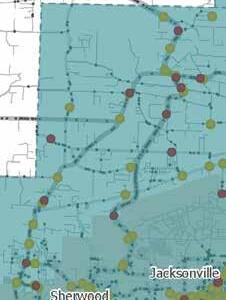


The Arkansas Strategic Highway Safety Plan (SHSP) identifies focus areas of safety for the State and provides a framework for reducing fatal and serious injury crashes on all public roads. Projects funded by the Highway Safety Improvement Program (HSIP) must reflect the SHSP at a strategic level. The focus areas are crash types and factors that are prominent throughout the State and often lead to fatal and serious injury crashes. Crash data from 2018 through 2022 was filtered to analyze crashes within Faulkner County related to the SHSP focus areas. A summary of the crash data over the last five years for crashes within Faulkner County for each of the SHSP focus areas is provided in Table 1. During the review of Faulkner County's highest SHSP focus areas for fatal and
serious injury crashes, it was determined that intersection-related, distracted driving, and motorcycle crashes ranked as the top three SHSP focus areas. Intersection related crashes being the highest SHSP focus area aligns with the Central Arkansas Region top SHSP focus area. Within Faulkner County, intersection related crashes have increased every year besides a constant period from 2020 to 2021. Distracted driving crashes are the second highest SHSP focus area for fatal and serious injury crashes in both the Region and Faulkner County. The third highest SHSP focus area within Faulkner County was motorcycle crashes. Motorcycle crashes within Faulkner County have seen a gradual rise over the five-year period, except for a slight decrease in 2019.
The increasing trends observed in the top three SHSP focus areas in Faulkner County over the past five years are a matter
of concern. This is not in line with the regional goal of reducing fatal and serious injury crashes by 40 percent by 2040 and ultimately reaching zero. It is important for Faulkner County to continue to prioritize safety and invest in targeted and systemic countermeasures that can address these SHSP focus areas.
A Regional High Injury Network (HIN) was developed as part of the Central Arkansas Safety Action Plan. The HIN is made up of one-mile segments with a high frequency of fatal and serious injury crashes. The HIN is a way to identify parts of a roadway network with higher rates of fatal and serious injury crashes. The Central Arkansas HIN consists of about 19 percent of the functionally classed roadway miles within the Central Arkansas Region that are not interstates, freeways, or expressways. These roadways account for approximately 77 percent of fatal and serious injury crashes that did not occur on interstates, freeways, or expressways from 2018 through 2022. Faulkner County contains 81 Regional HIN segments, accounting for approximately 15 percent of the Regional HIN, shown in Figure 3. To reduce fatal and serious injury crashes in Faulkner County, it is important to prioritize targeted countermeasures on the HIN segments, which have the highest number of fatal and serious injury crashes.
A Regional High Injury Intersection set was also established as part of the Central Arkansas Safety Action Plan, Figure 4 shows high injury intersections within Faulkner
County. Faulkner County contains 27 intersections that make up approximately 19 percent of the Regional High Injury Intersections.
The USDOT Equitable Transportation Communities (ETC) national census tract data helps identify historical underinvestment in disadvantaged communities. This information shows the cumulative burden these communities experience in various areas. The ETC Explorer uses 2020 census tracts and data to analyze five components, each of which have numerous factors that make up their score: Transportation Insecurity, Climate and Disaster Risk Burden, Health Vulnerability, and Social Vulnerability. The overlay of disadvantaged census tracts, shown in Figure 3 and Figure 4, revealed that almost 60 percent of HIN segments and almost 90 percent of HII within Faulkner County fall within a disadvantaged community. Equity is an important component in funding for projects through the USDOT SS4A Implementation Grant Program. Location of a segment or intersection within a disadvantaged census tract is used in this study as part of the scoring to rank segments and intersections when prioritizing projects.
A dashboard was created as a component of the Central Arkansas Safety Action Plan. The dashboard includes crash data statistics, the interactive Regional High Injury Network, and recommended projects for the Region.
The interactive safety dashboard can be found here: Central Arkansas Safety Dashboard
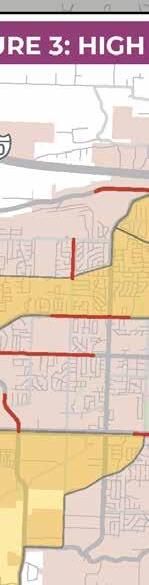
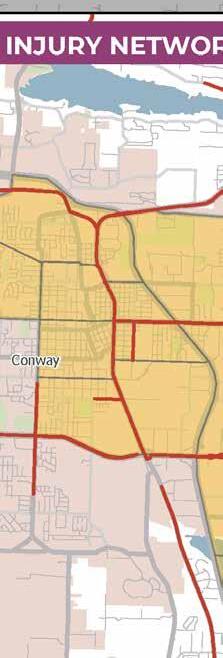
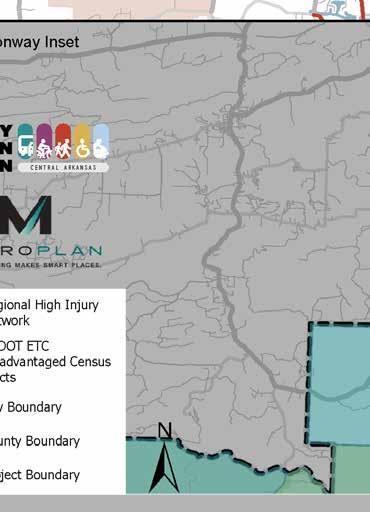
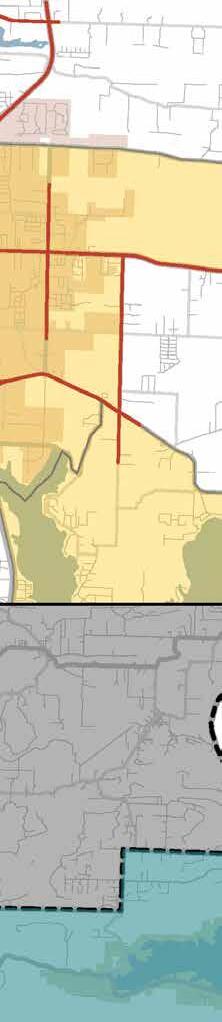
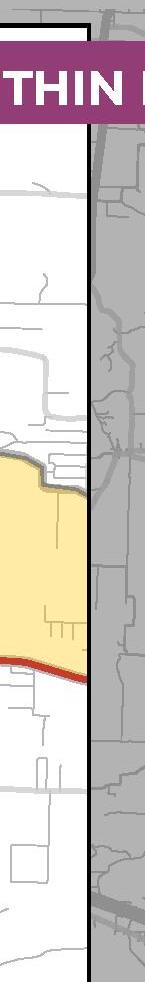
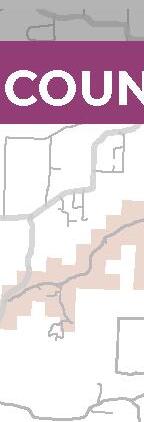
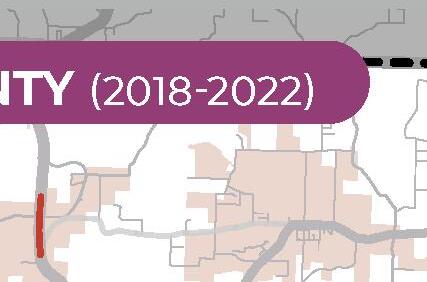
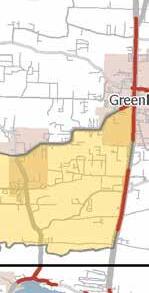
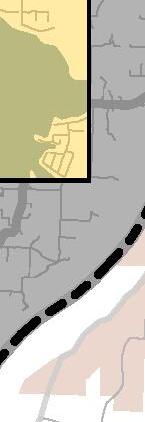
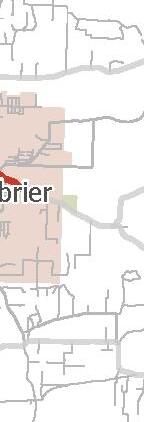
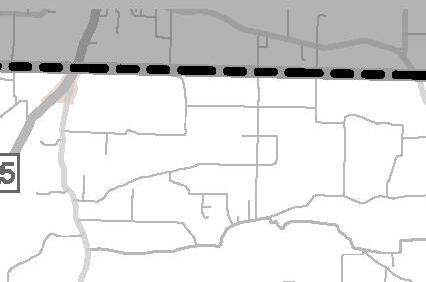
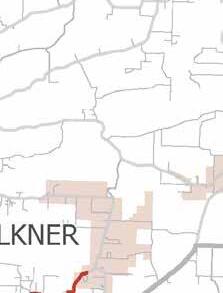
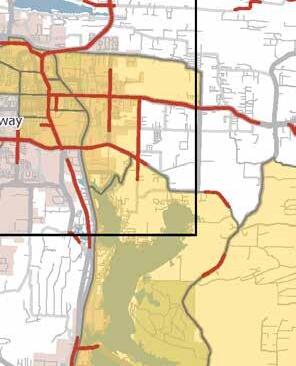
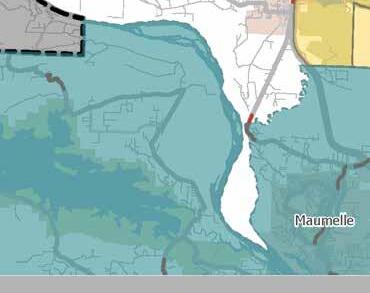
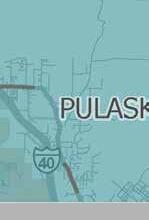
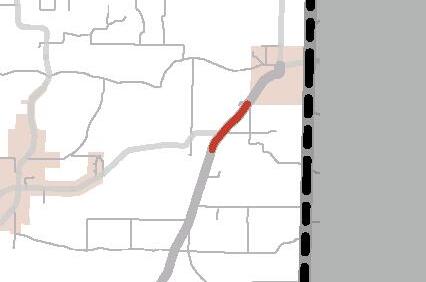
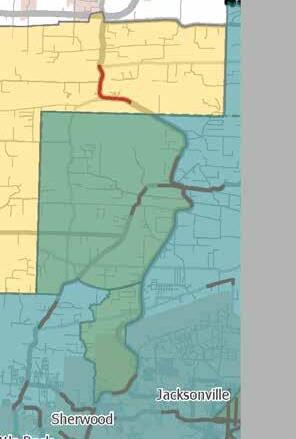


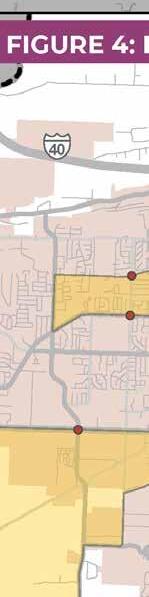


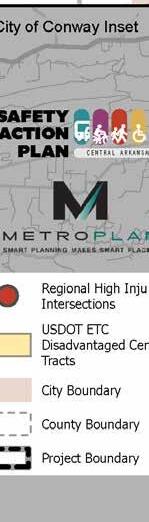
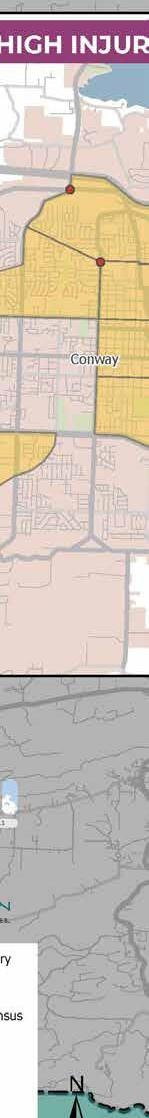
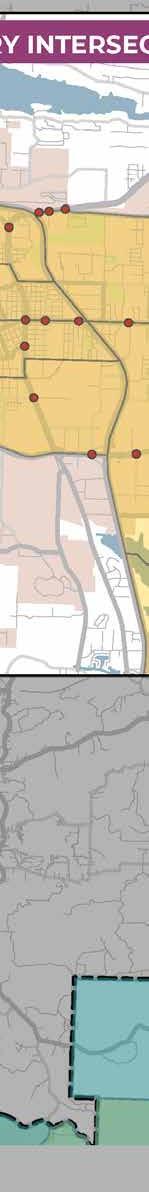
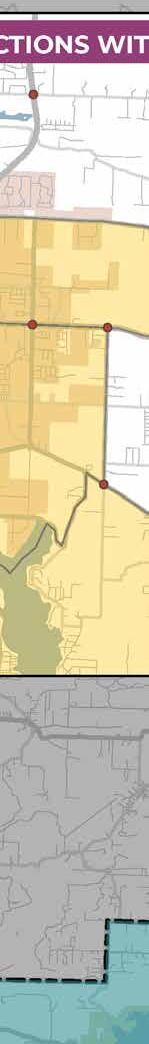

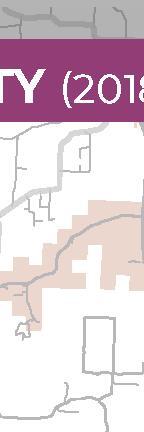
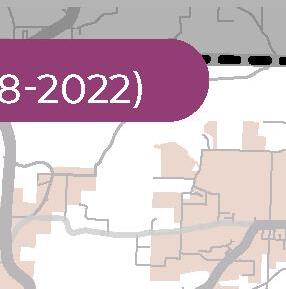
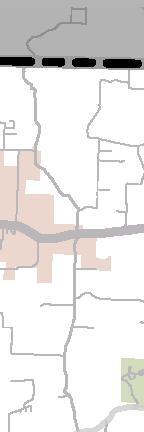
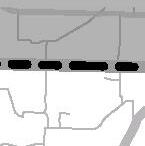
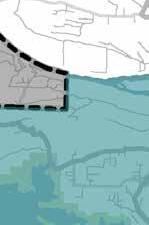

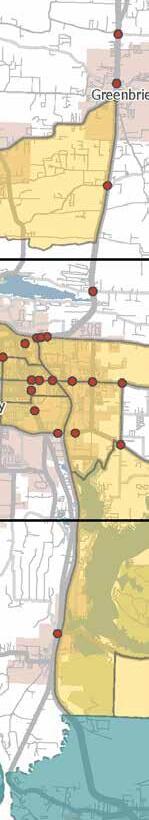
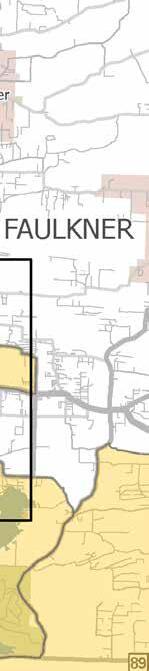
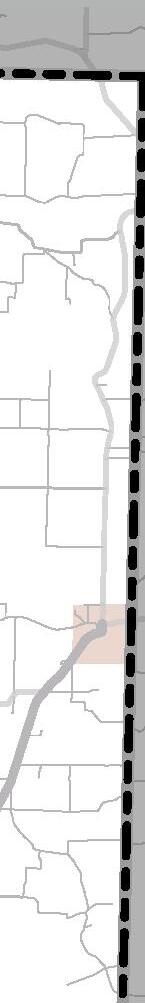
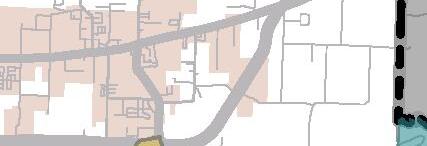
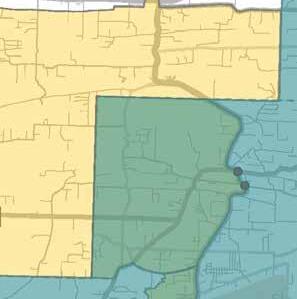

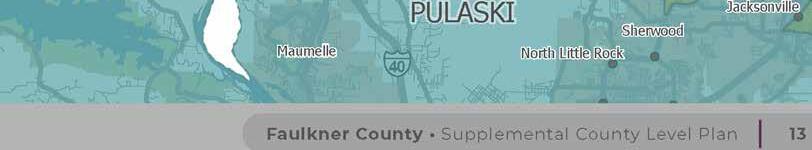

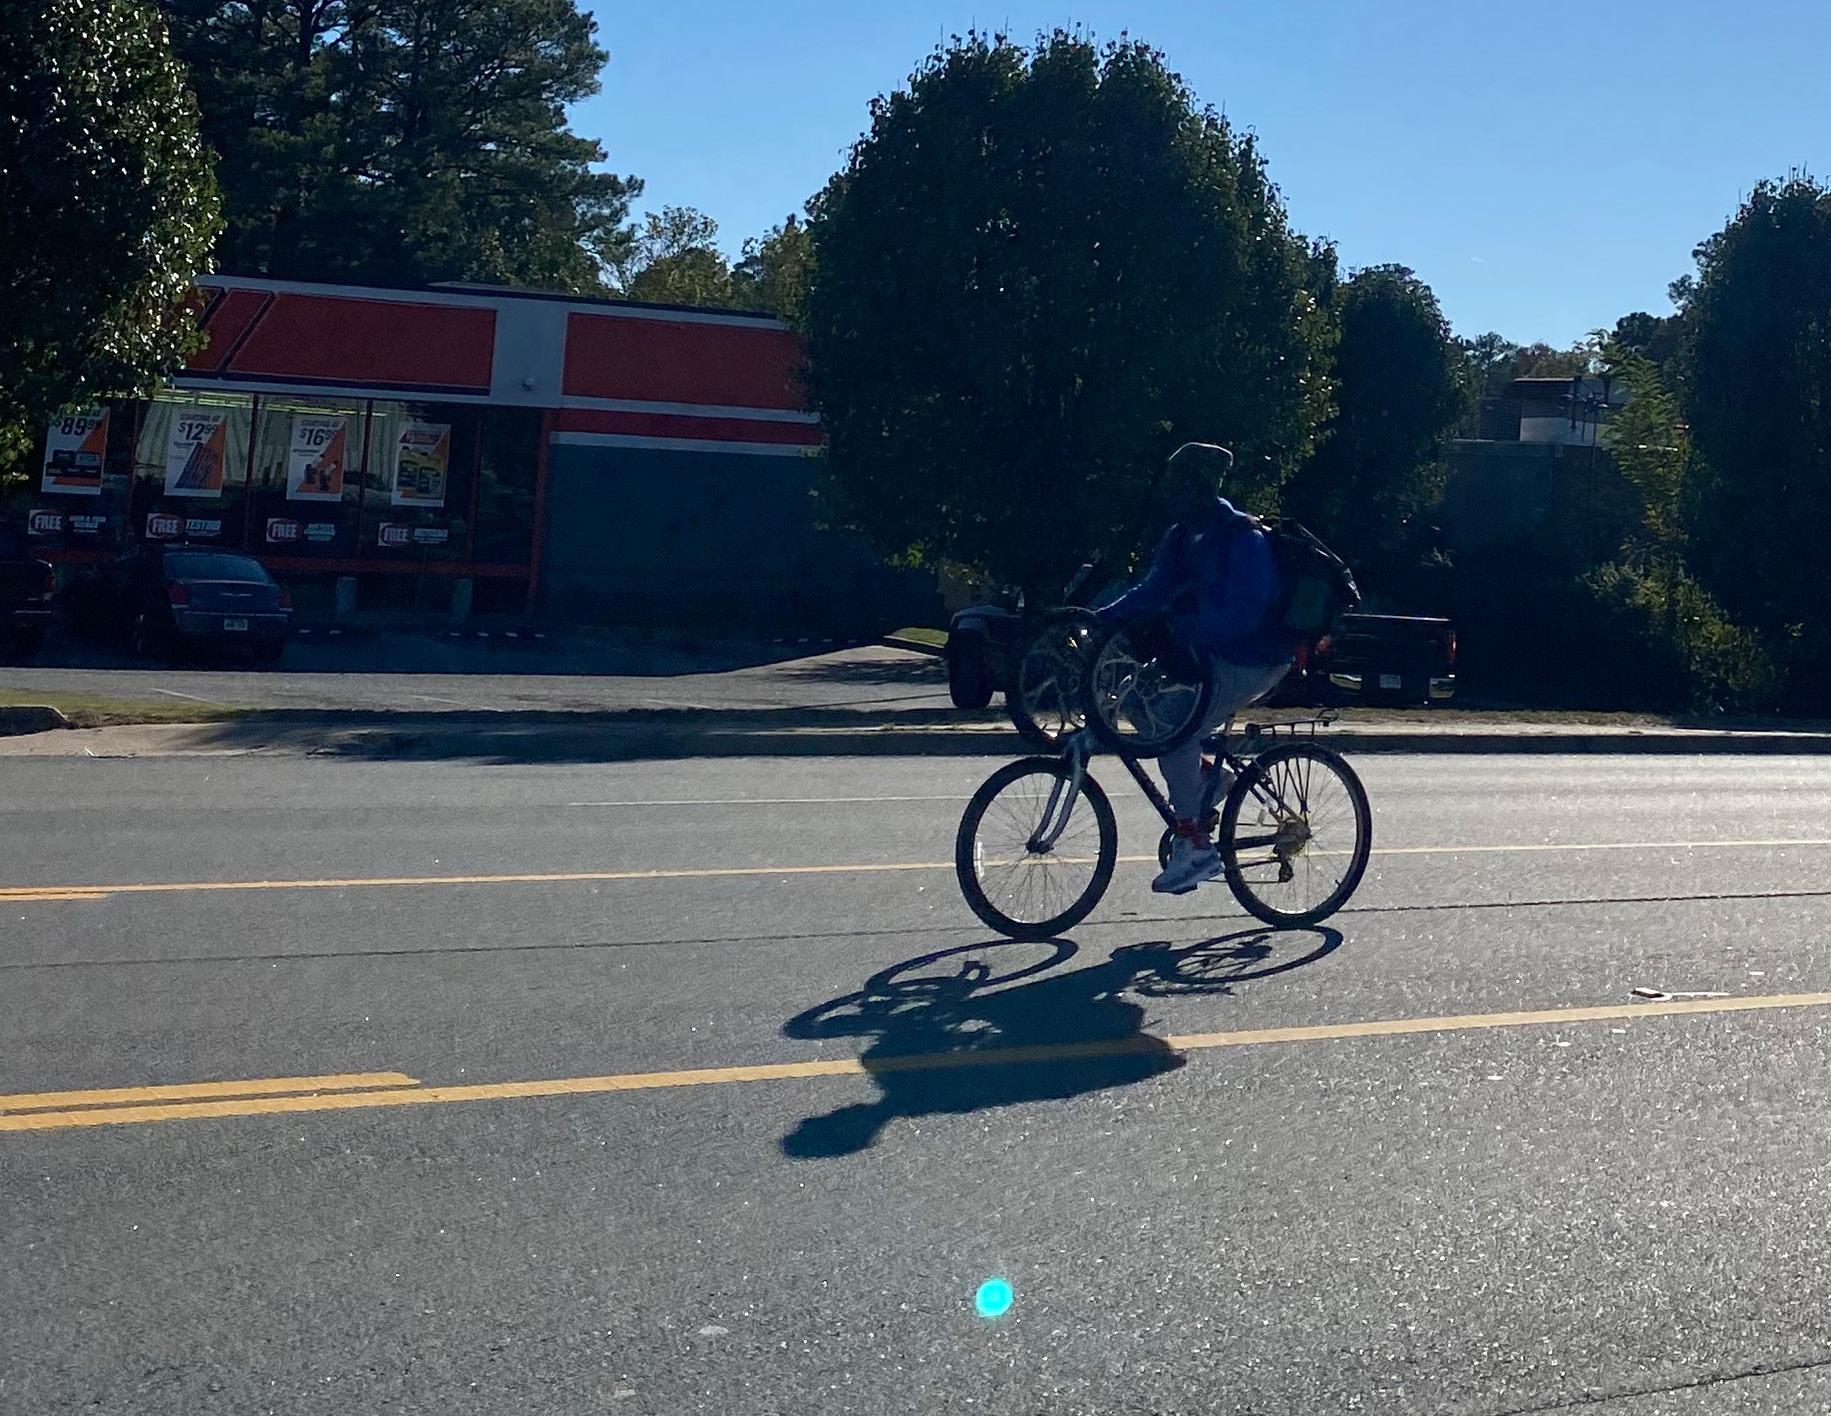
Safety for vulnerable road users, including pedestrians and bicyclists, is another important component in funding for projects through the USDOT SS4A Implementation Grant Program.


To account for crashes involving nonmotorized modes of transportation, fatal and serious injury crashes that involved a pedestrian or a bicycle within Faulkner County from 2018 through 2022 were overlayed onto the Regional HIN, as shown in Figure 5 and Figure 6. Of the 81 HIN segments within Faulkner County, 27 segments contained a crash that involved a pedestrian and 26 of them contained a crash that involved a bicyclist. Please note that the lines shown on the HIN maps may represent multiple one-mile segments combined into one line, as pedestrian or bicycle crashes may have occurred along multiple segments of a corridor. Safety for vulnerable road users, including pedestrians and bicyclists, is another important component in funding for projects through the USDOT SS4A Implementation Grant Program. Crashes on a segment or intersection that involved vulnerable road users is used in this study as part of the scoring to rank segments and intersections when prioritizing projects.

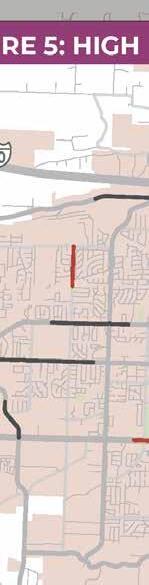
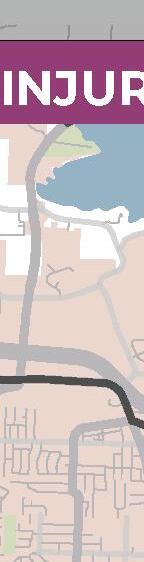
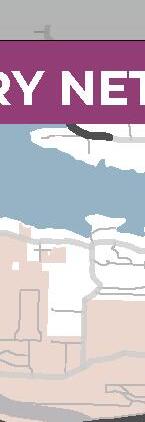
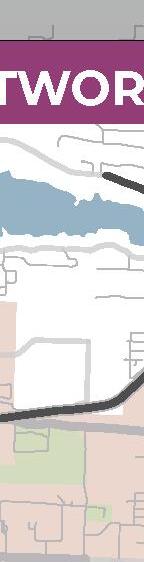
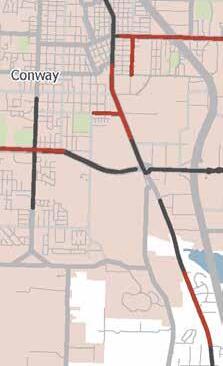
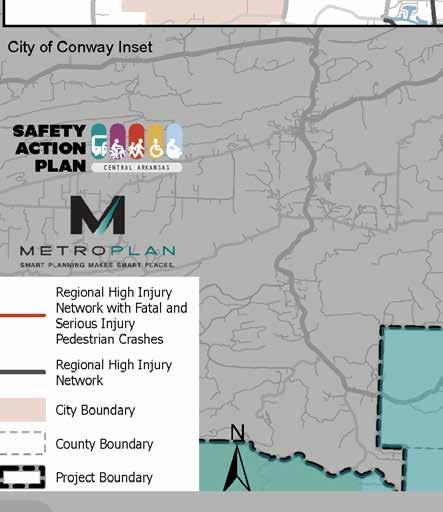
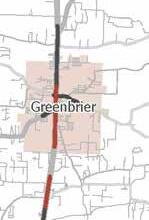
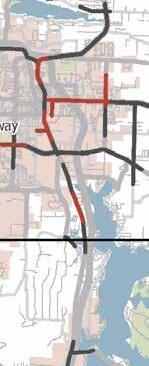
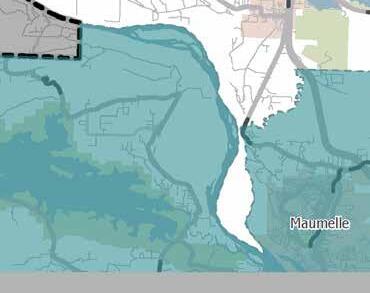

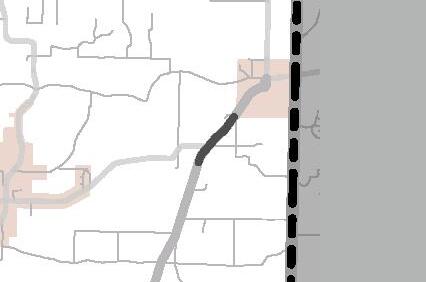
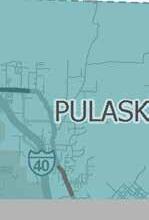
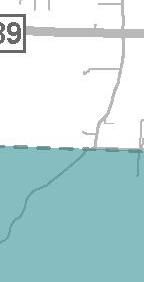
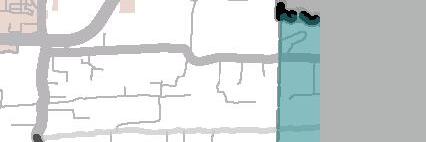
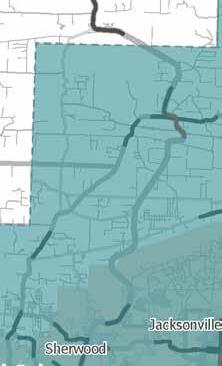


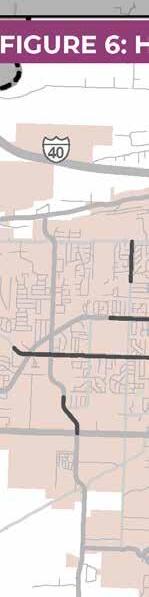


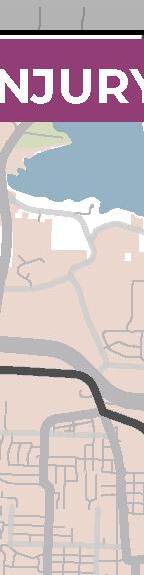
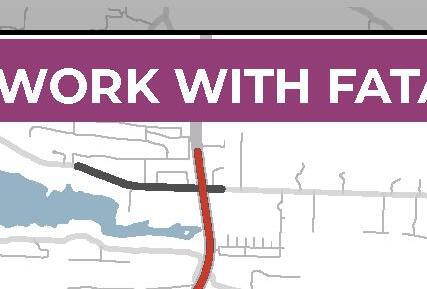
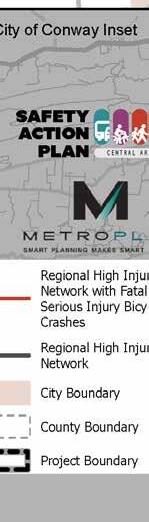
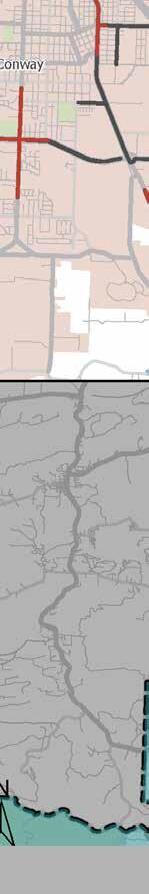
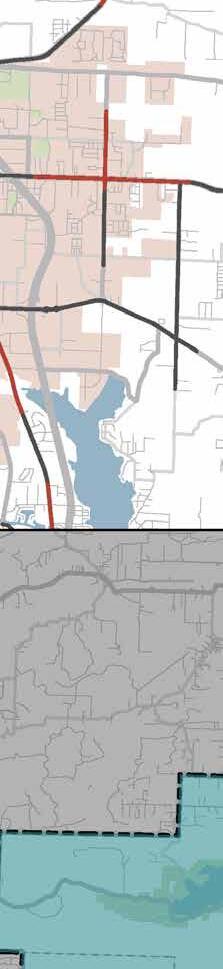

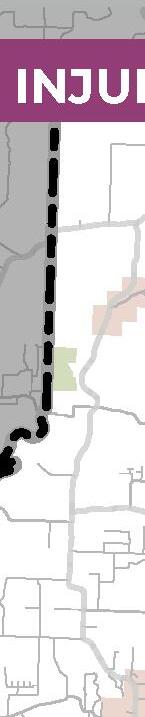
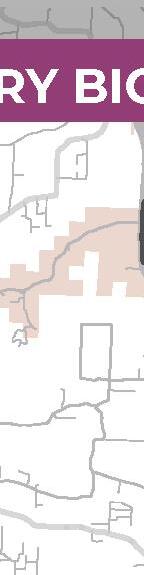
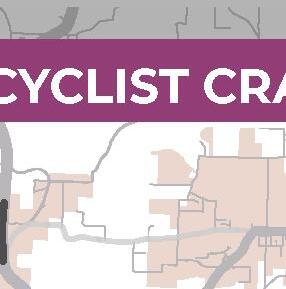
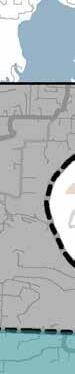
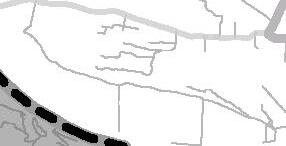
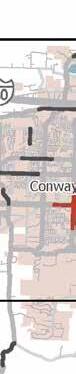
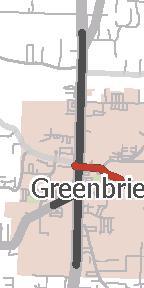
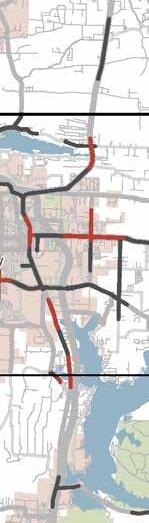

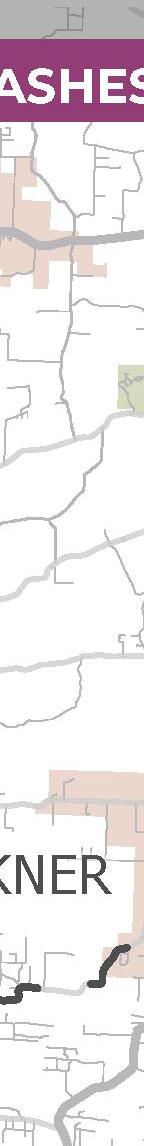

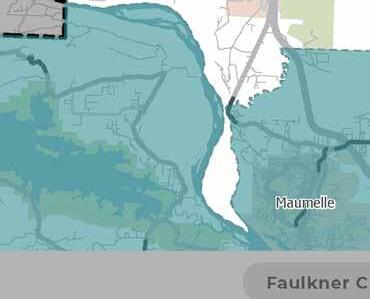
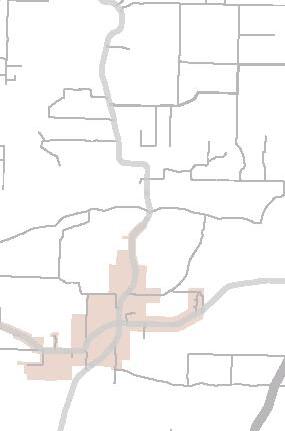


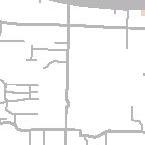
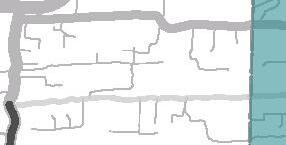
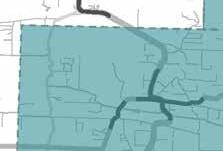
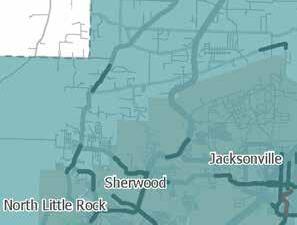


As part of the Central Arkansas Safety Action Plan, high injury segments and intersections were ranked through a needs score. The needs score included the corridor or intersections crash history, equity data, location characteristics, and stakeholder input. Additional detail about the scoring criteria can be found in the Central Arkansas Safety Action Plan.
Table 2 includes the top HIN segment in each city within Faulkner County that had a segment on the HIN. Table 3 includes the top High Injury Intersection in each city within Faulkner County that had an intersection considered to be a High Injury Intersection. The top segment or intersection in unincorporated Faulkner County is also included in the tables. Segments or intersections that were included in the Central Arkansas Safety Action Plan are identified in the “Top 20 Regional Plan” column. Additional information on these segments and intersections can be found in that plan.
Location-specific projects were developed for the Faulkner County Supplemental County Level Plan in order to address safety improvements within specific areas. These projects were identified by considering the highest scoring HIN segment within each city in Faulkner County and the highest scoring HIN segment in unincorporated Faulkner County. However, if a city of the County expressed the need for a different segment within their jurisdiction to be prioritized, that segment was selected based on the agency’s input. The projects listed in Table 4 were recognized by stakeholders as having the greatest need for safety improvements within their respective jurisdictions.
For each location-specific project identified in Table 4 that is not already included in the Central Arkansas Safety Action Plan, additional detail has been included on the subsequent pages. Detail includes a crash map of the segment, count of crashes on the segments from 2018 to 2022, and suggested countermeasures. As noted earlier, the full list of countermeasures can be viewed in Section 5 - Safety Countermeasures Toolbox of the Central Arkansas Safety Action Plan.
*Additional detail and maps for these location specific projects can be found in the Central Arkansas Safety Action Plan.
Segment: Spring Meadows Dr to Happy Hills Rd
Jurisdiction: City of Holland
Enhanced Curve Delineation
Add/Improve Pavement Markings
Add Shoulder
Longitudinal Rumble Strips
Add Advance Warning Signage
Segment: SH 365 to Crafton St
Jurisdiction: City of Mayflower
Add/Improve Sidewalk
Enhanced Curve Delineation
Add/Improve Pavement Markings
Safety Lighting
Add Shoulder
Segment: Magnolia Dr to Business
Park Dr
Jurisdiction: City of Greenbriar
Sidewalk Buffer
High Visibility Crosswalk Pavement Markings
Vehicular Countermeasures
Access Management (Accompanied by removal of or conversion of TWLTL to dedicated left-turn lane)
Add/Improve Pavement Markings
Safety Lighting
Retroreflective Backplates
Add Shoulder


Segment: Solomon Grove Rd to Pontiac Ln
Jurisdiction: City of Twin Groves
Segment: Compassion Ln to Elliot Rd/SH 287
Jurisdiction: Faulkner County
Segment: US 64 and SH 107
Jurisdiction: City of Vilonia
Add/Improve Pavement Markings Safety
Retroreflective Backplates Add Advance Warning Signage
Retroreflective Backplates
Access Management (Accompanied by removal of or conversion of TWLTL to dedicated left-turn lane)


Our Goal: 40% reduction in fatal and serious injury crashes by 2040 40 by 40


Supplemental County Level Plan
November 2024


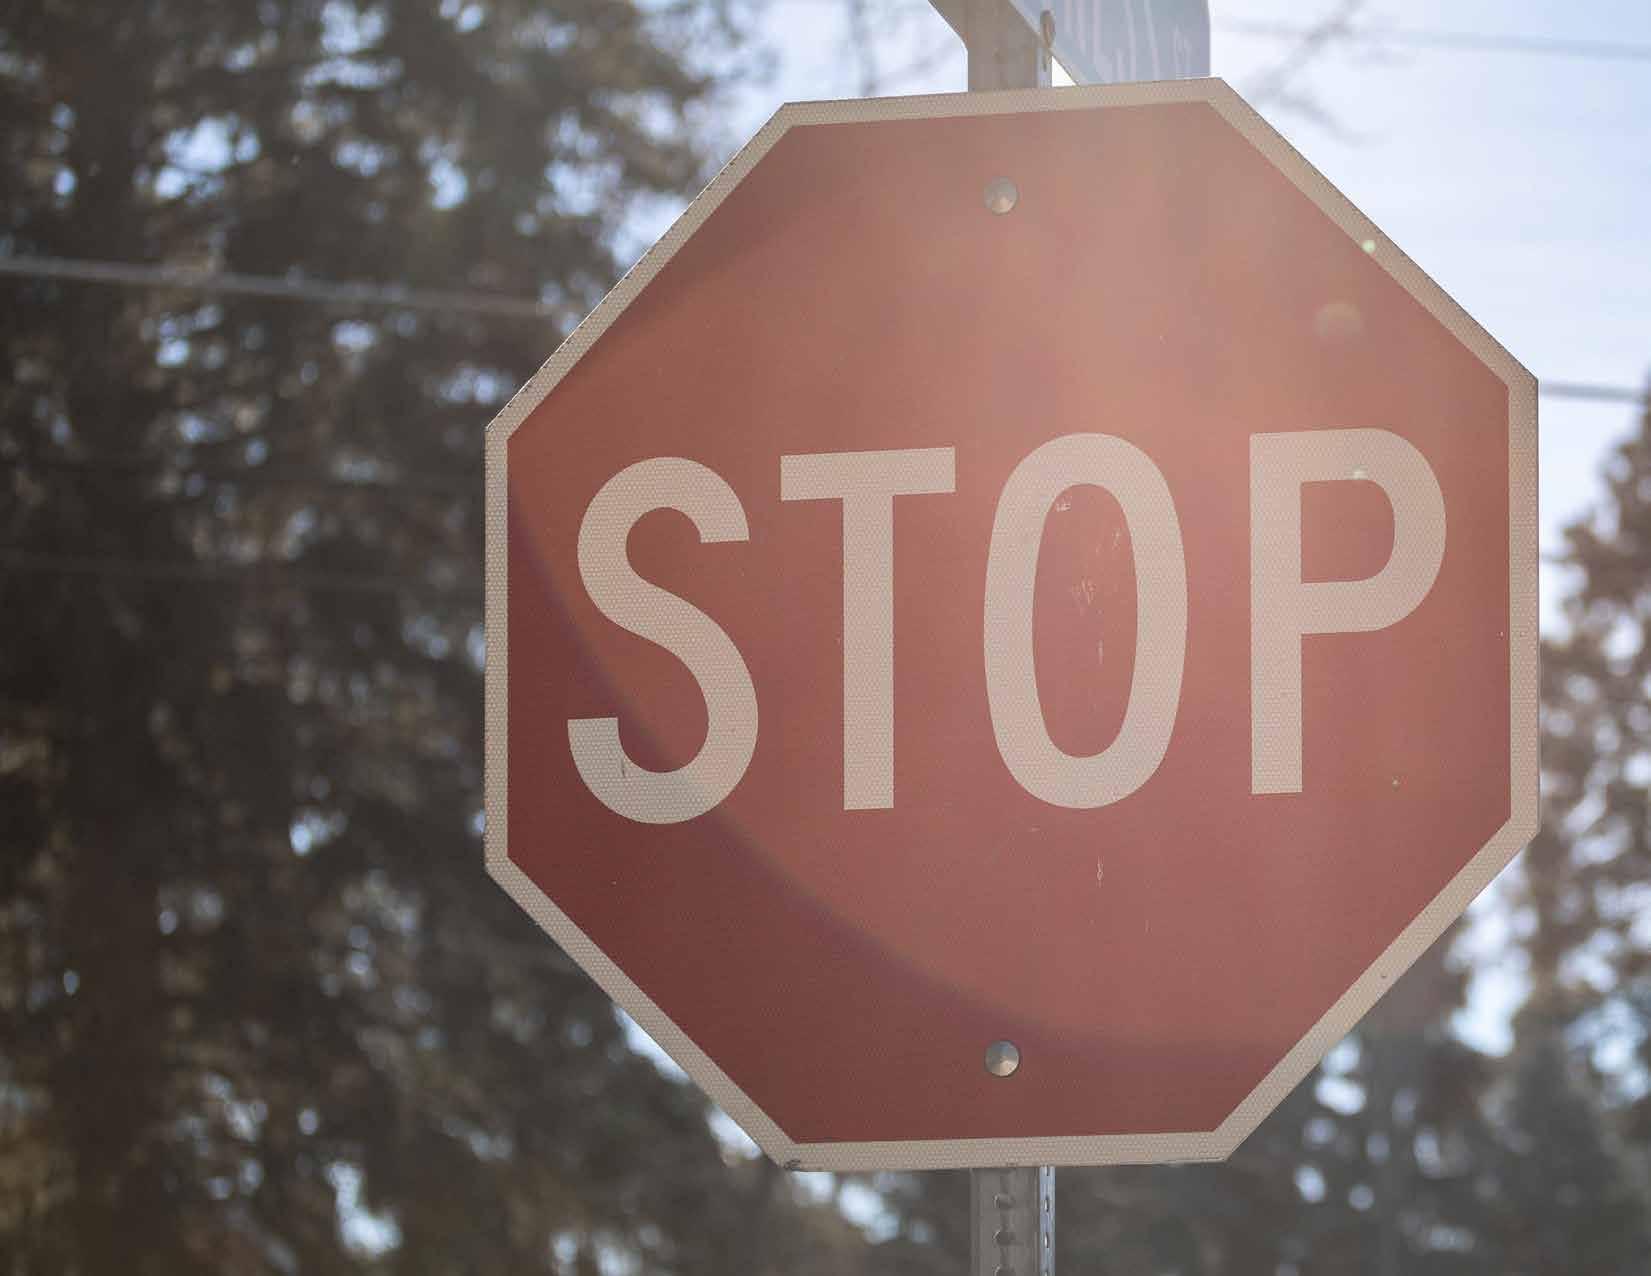


The information provided in this document is intended to be used for informational purposes only. No expressed or implied warranties are made by Metroplan, Kimley-Horn, Traffic Engineering Consultants, Crafton Tull, and Laneshift concerning the accuracy, completeness, reliability, and usability of this information. Further investigation such as field verification, site condition assessments, engineering analysis, and design are necessary prior to implementing any of the guidance contained herein.
This report was funded in part through grant(s) from the Federal Highway Administration and Federal Transit Administration, U.S. Department of Transportation. The views and opinions of the authors expressed herein do not necessarily state or reflect those of the U.S. Department of Transportation.
Notice of Nondiscrimination Metroplan complies with all civil rights provisions of the federal statutes and related authorities that prohibit discrimination in programs and activities receiving federal financial assistance. Therefore, Metroplan does not discriminate on the basis of race, sex, color, age, national origin, religion, disability, or income status, in admission or access to and treatment in Metroplan’s programs and activities, as well as Metroplan’s hiring or employment practices. Complaints of alleged discrimination and inquiries regarding Metroplan’s nondiscrimination policies may be addressed to Sydney Dozier, Title VI/ADA/504 Coordinator, 501 West Markham Street, Suite B, Little Rock, AR 72201, (501) 372-3300, or the following e-mail address: sdozier@metroplan.org
(Hearing and speech impaired may dial 711.)
This notice is available upon request from the Title VI/ADA/504 Coordinator in large print, audiotape or braille.
by the Metroplan Board of Directors
November 20, 2024 Resolution: 24-13
National Highway Traffic Safety Administration
Pedestrian Hybrid Beacon
Rectangular Rapid Flashing Beacon
Road Safety Audit
Safety Action Plan Advisory Committee
Strategic Highway Safety Plan SS4A Safe Streets and Roads for All TWLT Two Way Left Turn USDOT US Department of Transportation VMT Vehicle Miles Traveled
Vulnerable Road User


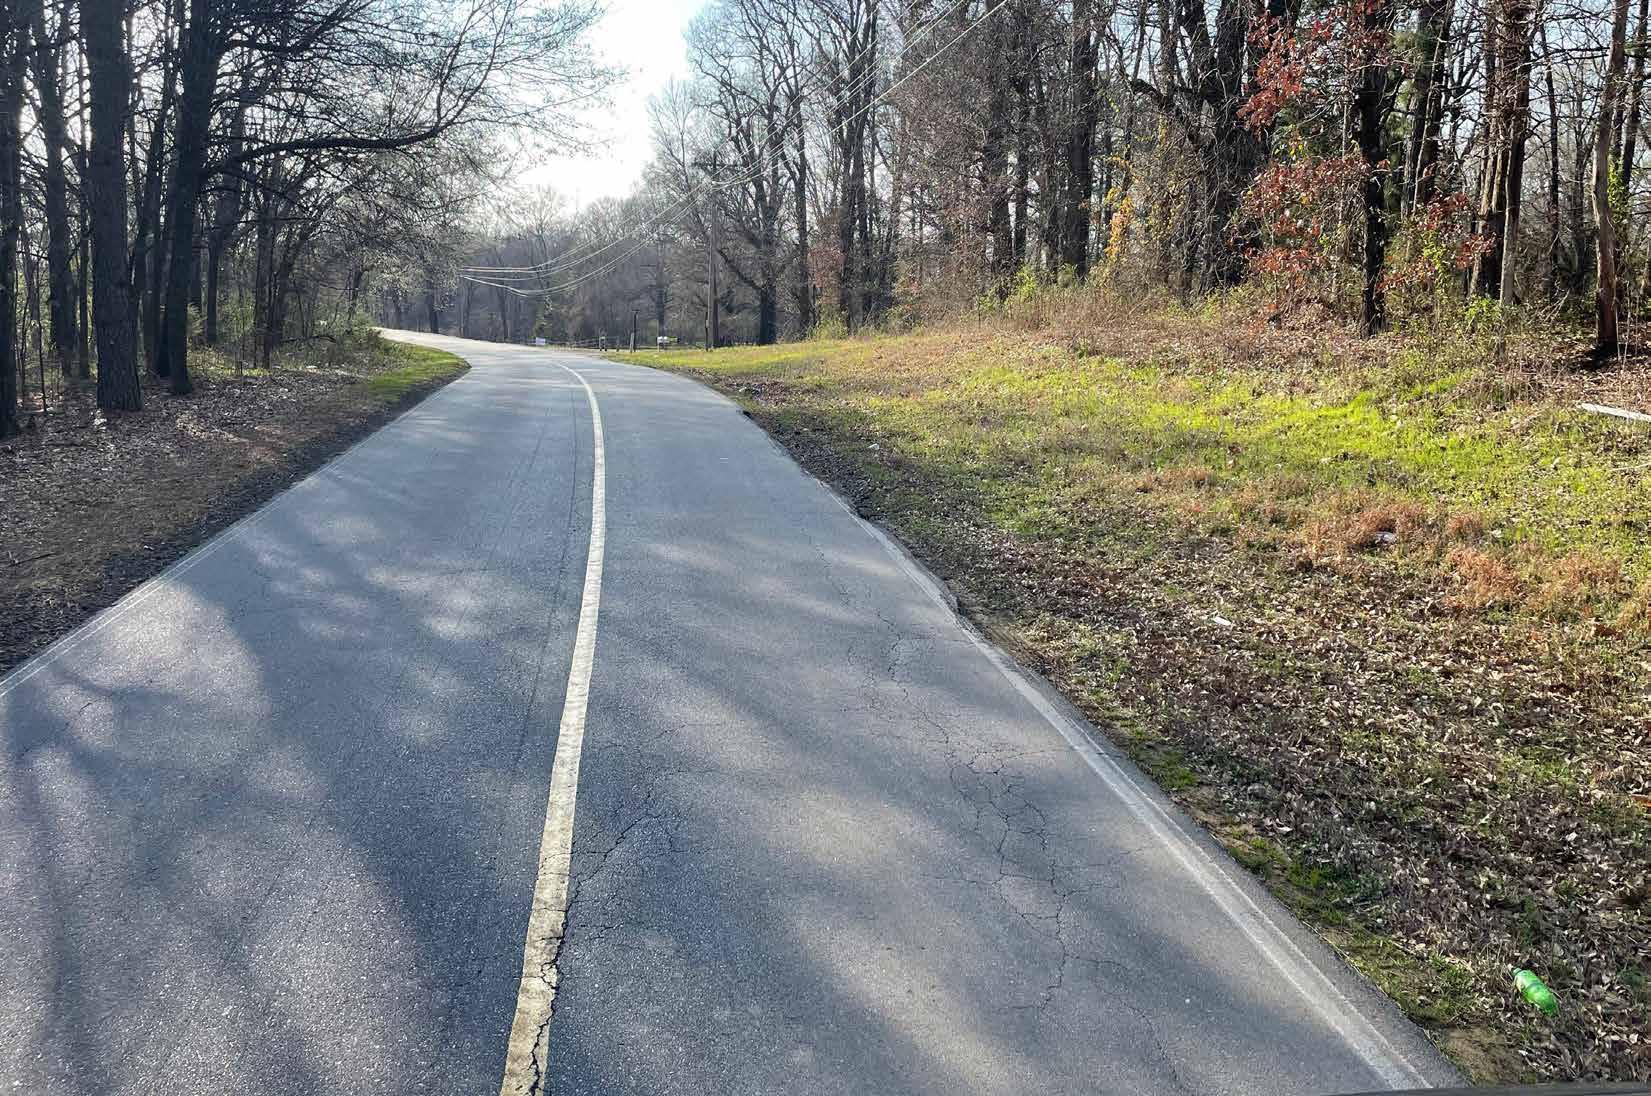
The purpose of the Lonoke County Supplemental County Level Plan is to address the specific safety needs and projects identified by local stakeholders within Lonoke County. The Supplemental County Level Plan expands on the Central Arkansas Safety Action Plan by focusing on additional segments and intersections located within Lonoke County’s High Injury Network (HIN) and High Injury Intersections that were not already addressed in Central Arkansas Safety Action Plan. Unlike the Central Arkansas Safety Action Plan, which considers the entire Central Arkansas Region as a whole and consists of Faulkner, Lonoke, Pulaski, and Saline Counties, this Supplemental County Level Plan focuses exclusively on Lonoke County (“the County”). Its main objectives are to identify projects and implement strategies that can help Lonoke County reduce fatal and serious injury crashes on its roadways, with the ultimate goal of eliminating these crashes all together. This is a crucial step towards achieving the same goal of eliminating fatal and serious injury crashes for the entire Central Arkansas Region. The Central Arkansas Safety Action Plan used a primarily data driven approach to develop regional projects. The Supplemental County Level Plan is also primarily data driven, but relies on input from local agencies to select segments and intersections as a key selection criteria in developing regional projects.
The Central Arkansas Safety Action Plan was created to determine which corridors have the greatest need for safety improvements and identify projects and strategies to help Central Arkansas reduce fatal and serious injuries on the Region’s roadways. The plan was developed by Metroplan and funded through a grant from the United States Department of Transportation (USDOT) Safe Streets and Roads for All (SS4A) Program. Central Arkansas leaders from the Metroplan Board of Directors committed to a goal of reducing fatal and serious injury crashes in Central Arkansas by 40 percent by the year 2040. The leaders set several interim goals starting with a baseline to be established in 2025 and incremental steps through the year 2050 to get an 80% reduction.
The Central Arkansas Safety Action Plan includes a large public engagement effort. Several engagement methods were used, including both online and in person public engagement, which consisted of an online survey and an interactive mapping activity, open houses, and booths at community events. The project team conducted stakeholder engagement, which included workshops with the Metroplan Board, meetings with the Safety Action Plan Advisory Committee (SAPAC), and stakeholder walk audits. The public and stakeholder engagement efforts were used to identify projects and implement strategies to increase safety in Central Arkansas.
The Central Arkansas Safety Action Plan includes a list of Regional High Injury Network (HIN) segments and High Injury Intersections. The threshold crash per mile value for segments included in the HIN was
two fatal and serious injury crashes per mile or greater from 2018 through 2022. High injury intersections had at least two fatal and serious injury crashes that occurred within 250 feet of the intersection from 2018 through 2022. These segments and intersections were scored and prioritized based on SS4A key objectives to assess the level of need for safety improvements, such as the number of fatal and serious injury crashes, underserved areas, and locations where vulnerable road users such as pedestrians and people on bikes are frequently present. The Central Arkansas Safety Action Plan identifies the 20 highest scoring Regional HIN and 20 highest scoring Regional High Injury Intersections. In addition to the top 20 regionwide segments and intersections, the five highest scoring state route HIN segments and the five highest scoring local roads in each county were identified. Similarity, the five highest scoring intersections of two state routes or a state route and local road, as well as the five highest scoring intersections of two local roads were identified, where applicable.
The Central Arkansas Safety Action Plan also includes a Safety Countermeasures Toolbox, made up of countermeasures recommended by the Federal Highway Administration (FHWA), National Highway Transportation Safety Administration (NHTSA), and Arkansas Department of Transportation (ARDOT) that have been historically proven to increase safety on roadways. Countermeasures include changes in roadway geometry, operations, signage, pavement markings, and access management. These countermeasures have a positive impact on reducing fatal and serious injury crashes and may be used on roadways not identified in the Lonoke County Supplemental Plan. The full list of recommended safety
countermeasures can be viewed in Section 5- Safety Countermeasures Toolbox of the Central Arkansas Safety Action Plan
Ten location-specific projects were developed for the regionwide top 20 segments and top 20 intersections. The ten location-specific projects incorporate the regionwide top 20 segments and top 20 intersections. All but one of the regional projects are in Pulaski County, with the remaining project in Faulkner County. Additional location-specific projects were developed for the highest scoring state route and highest scoring local road in Faulkner, Lonoke, and Saline Counties These location-specific projects consist of combinations of safety improvements from the Safety Countermeasures Toolbox identified in the Central Arkansas Safety Action Plan that are expected to reduce crashes, particularly fatal and serious injury crashes and crashes involving vulnerable road users, within the vicinity of the project location. To view the regional projects that are in Lonoke County, please refer to the Central Arkansas Safety Action Plan
The Central Arkansas Safety Action Plan also includes a list of systemic improvements, developed based on the regional crash analysis and roadway network review. The systemic improvements consist of countermeasures that are implemented based on high-risk roadway features correlated with a particular crash type. Proposed policies to support recommended systemic improvements are included to provide guidance on incorporating safety countermeasures in future roadway and transportation projects

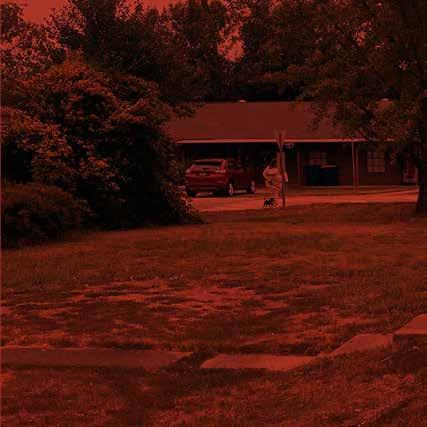

The main objective of this plan is to identify projects and implement strategies that can help Lonoke County reduce fatal and serious injury crashes on its roadways, with the ultimate goal of eliminating these crashes all together.
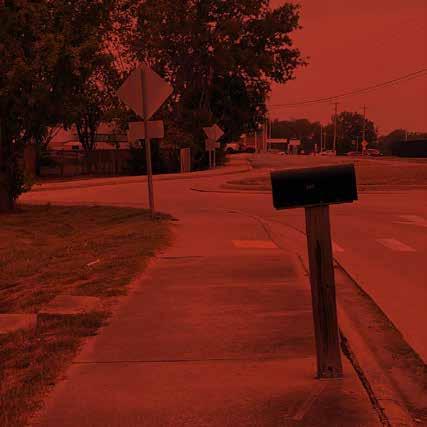
by
Our Goal:

reduction in fatal and serious injury crashes by 2040
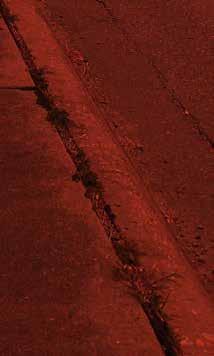

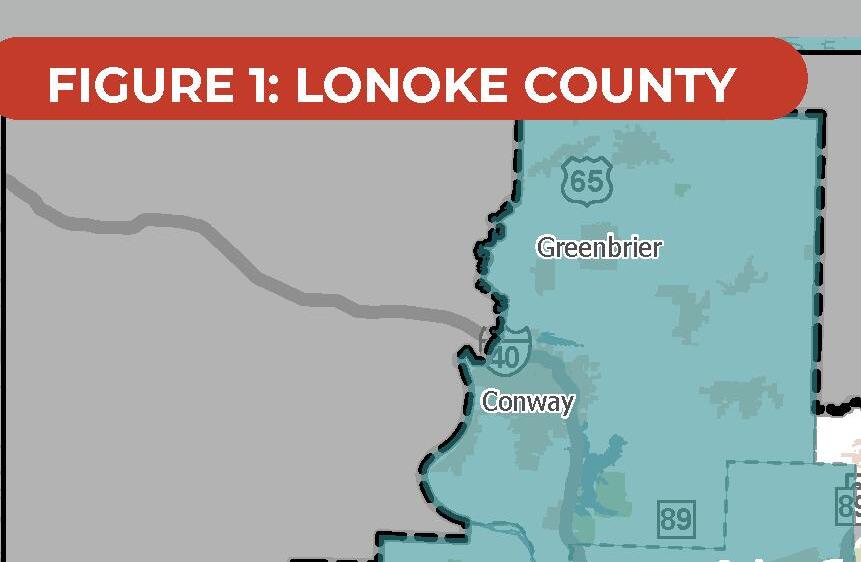

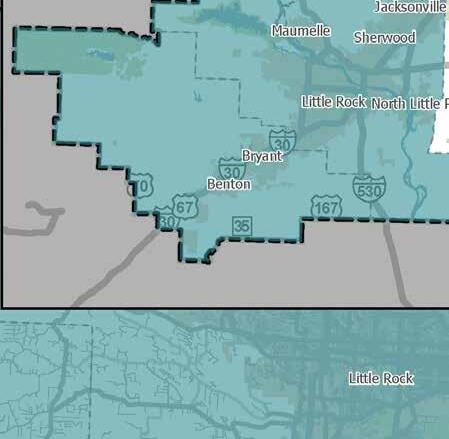
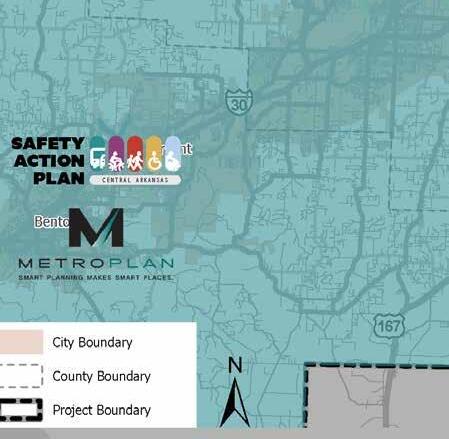
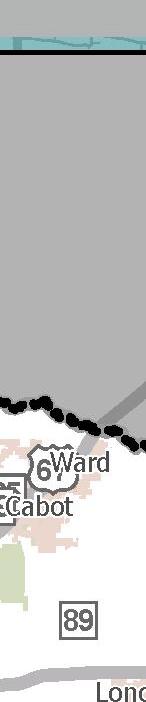
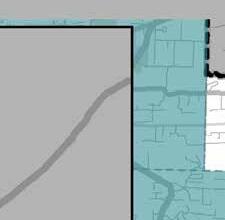
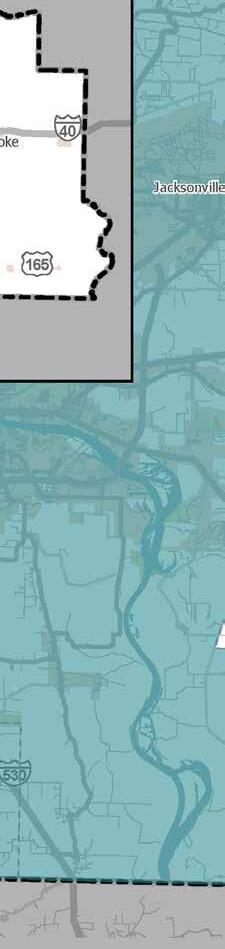


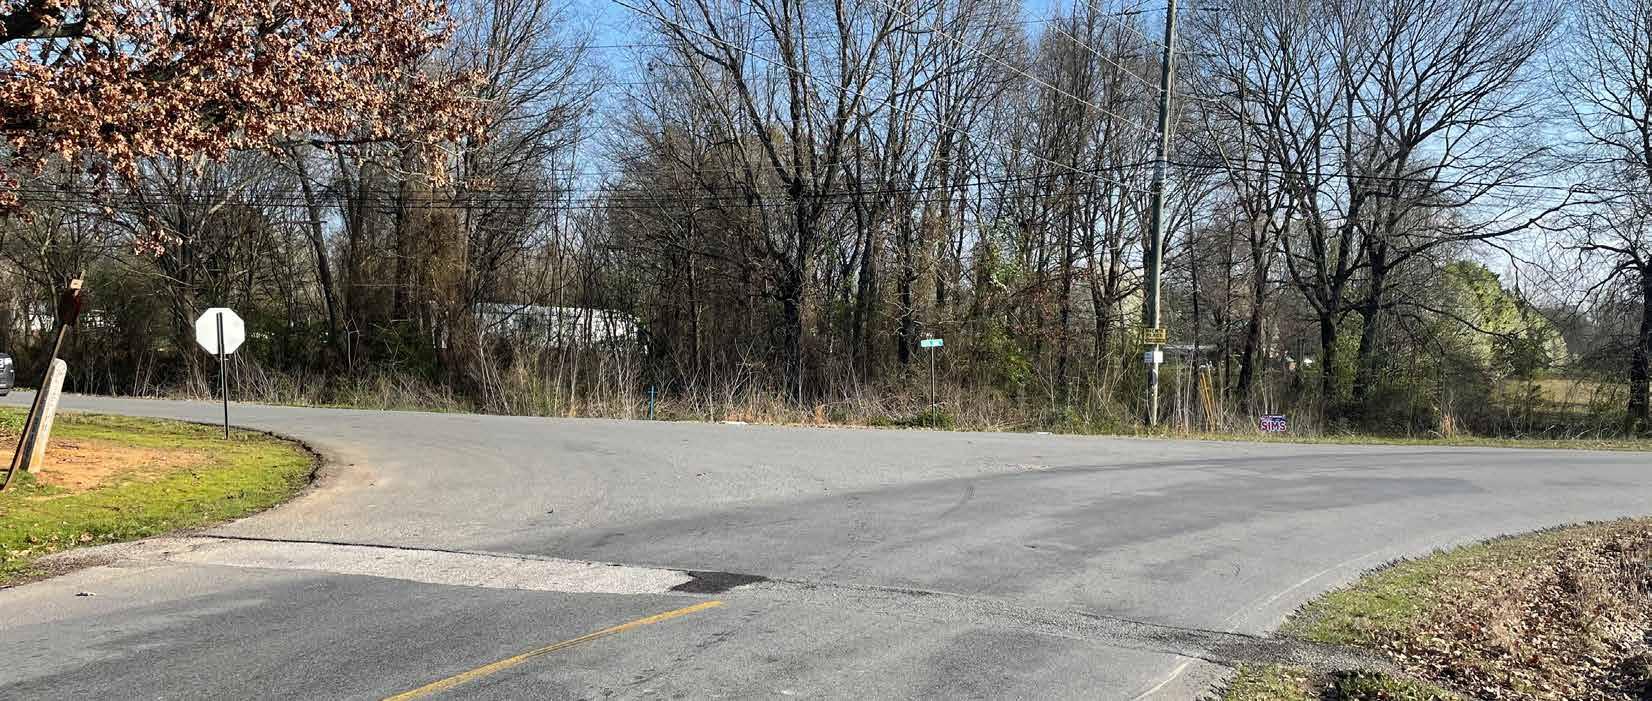
Lonoke County, shown in Figure 1, is located in the Central Arkansas Region and has an approximate population of 76,000 as of July 2023, according to the US Census Bureau. This population accounts for roughly 10 percent of the total population in the Central Arkansas Region. Lonoke County encompasses approximately one fourth of the Central Arkansas Region and includes the Cities of Austin, Cabot, Carlisle, Coy, England, Keo, Lonoke, and Ward. Lane miles within Lonoke County make up 17 percent of the total lane miles within the Central Arkansas Region.
Lonoke County is located in the Central Arkansas Region and has an approximate population of 76,000 as of July 2023.
Through five years, fatal and serious injury crashes have increased every year until 2022 where in both cases, crashes decreased.
A crash analysis was conducted to identify patterns and trends in crash types and common factors contributing to fatal and serious injury crashes within Lonoke County.
From 2018 to 2022, there were a total of 7,791 reported crashes within Lonoke County, representing six percent of all crashes in the Central Arkansas Region. Of these crashes within Lonoke County, 53 resulted in fatalities and 219 resulted in serious injuries. Through five years, fatal and serious injury crashes have increased every year until 2022 where in both cases, crashes decreased.
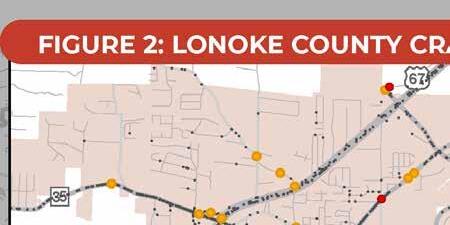
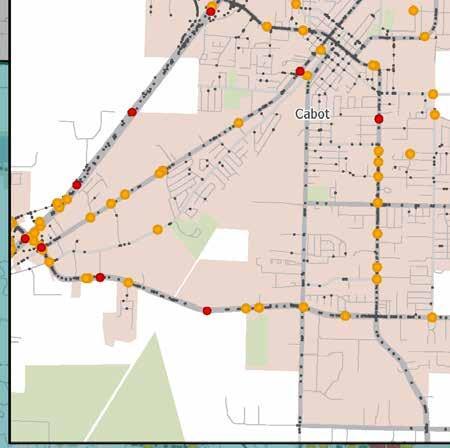


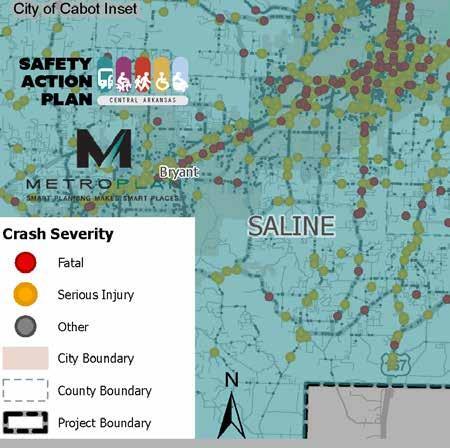
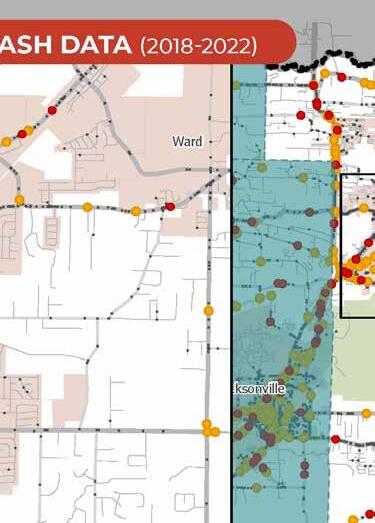
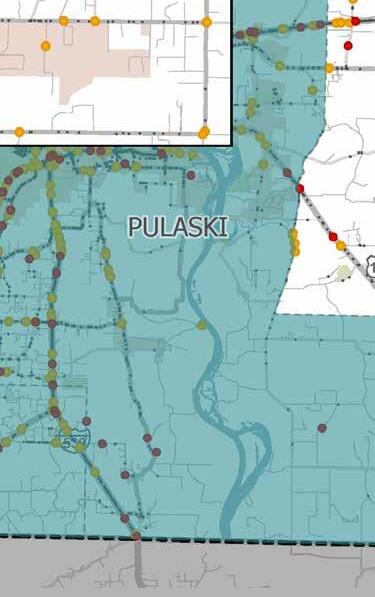
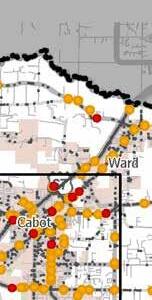
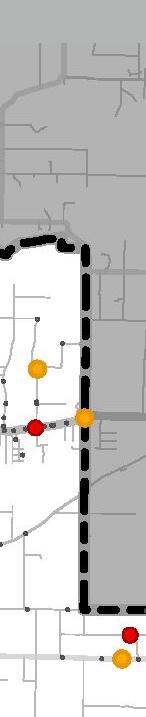
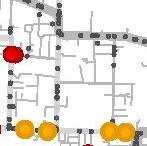
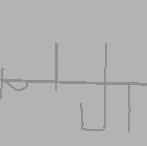
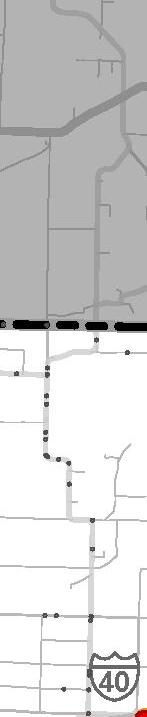
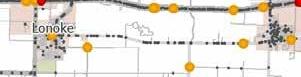
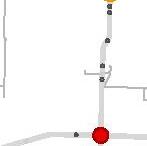
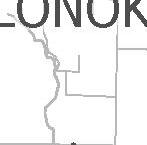
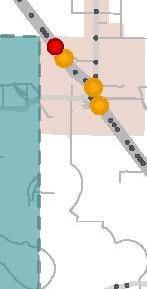
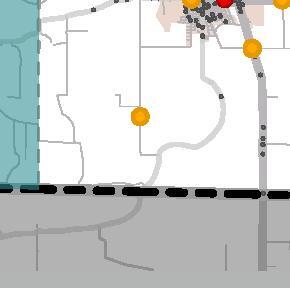
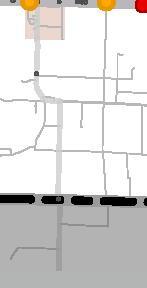
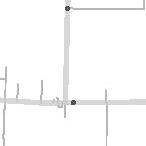
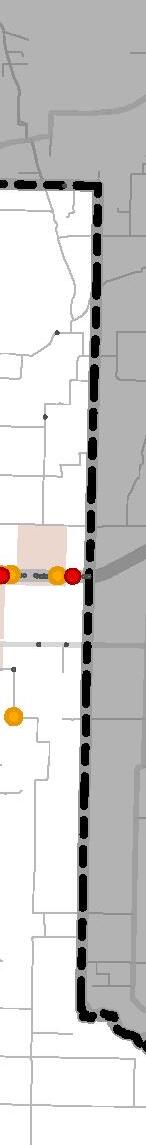
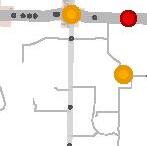
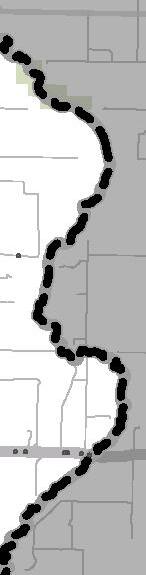
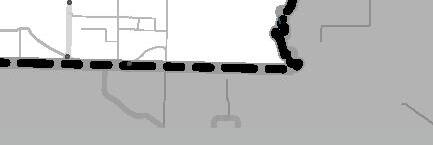
The Arkansas Strategic Highway Safety Plan (SHSP) identifies focus areas of safety for the State and provides a framework for reducing fatal and serious injury crashes on all public roads. Projects funded by the Highway Safety Improvement Program (HSIP) must reflect the SHSP at a strategic level. The focus areas are crash types and factors that are prominent throughout the State and often lead to fatal and serious injury crashes. Crash data from 2018 through 2022 was filtered to analyze crashes within Lonoke County related to the SHSP focus areas. A summary of the crash data over the last five years for crashes within Lonoke County for each of the SHSP focus areas is provided in Table 1.
During the review of Lonoke County’s highest SHSP focus areas for fatal and
serious injury crashes, it was found that intersection-related, distracted driving, and roadway departure crashes were the top three SHSP focus areas. It is worth noting that intersection-related crashes were identified as the highest priority in Lonoke County, which aligns with the Central Arkansas Region’s focus as well. Over the years, intersection-related crashes in Lonoke County have seen an increase, with the exception of a decrease in 2021. Distracted driving crashes rank second in both the Region and Lonoke County as a significant concern for fatal and serious injury incidents. The third highest focus area within Lonoke County is roadway departure crashes. This is consistent with the county’s predominantly rural nature, as rural areas tend to experience higher rates of roadway departure crashes. Between 2018 and 2021, Lonoke County experienced an upward trend in roadway
departure and distracted driving crashes. However, in 2022, there was a decrease in fatal and serious injury crashes Over the past five years, intersection-related crashes have been on the rise, although there was a decrease in 2021. To ensure the safety of Lonoke County, it is crucial to continue prioritizing safety in targeted and systemic measures that address these SHSP focus areas.
A Regional High Injury Network (HIN) was developed as part of the Central Arkansas Safety Action Plan. The HIN is made up of one-mile segments with a high frequency of fatal and serious injury crashes. The HIN is a way to identify parts of a roadway network with higher rates of fatal and serious injury crashes. Lonoke County contains 52 Regional HIN segments, accounting for approximately 10 percent of the Regional HIN, shown in Figure 3. To reduce fatal and serious injury crashes in Lonoke County, it is important to prioritize targeted countermeasures on the HIN segments, which have the highest number of fatal and serious injury crashes.
A Regional High Injury Intersection set was also established as part of the Central Arkansas Safety Action Plan, Figure 4 shows high injury intersections within Lonoke County. Lonoke County contains 8 intersections that make up approximately five percent of the Regional High Injury Intersections.
The USDOT Equitable Transportation Communities (ETC) national census tract data helps identify historical underinvestment in disadvantaged communities. This information shows the cumulative burden these communities experience in various areas. The ETC Explorer uses 2020 census tracts and data to analyze five components, each of which have numerous factors that make up their score: Transportation Insecurity, Climate and Disaster Risk Burden, Health Vulnerability, and Social Vulnerability. The overlay of disadvantaged census tracts, shown in Figure 3 and Figure 4, revealed that almost 45 percent of HIN segments and almost 15 percent of High Injury Intersections within Lonoke County fall within a disadvantaged community. Equity is an important component in funding for projects through the USDOT SS4A Implementation Grant Program. Location of a segment or intersection within a disadvantaged census tract is used in this study as part of the scoring to rank segments and intersections when prioritizing projects.
A dashboard was created as a component of the Central Arkansas Safety Action Plan. The dashboard includes crash data statistics, the interactive Regional High Injury Network, and recommended projects for the Region. The interactive safety dashboard can be found here: Central Arkansas Safety Dashboard


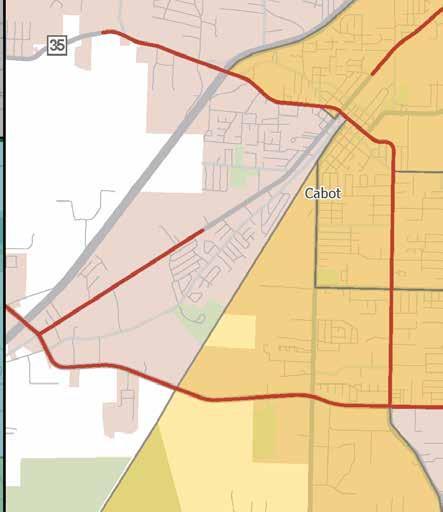
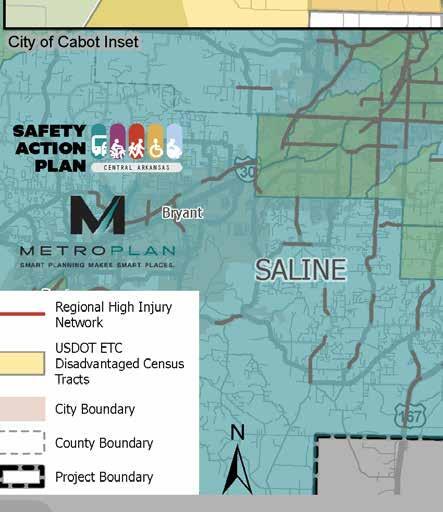
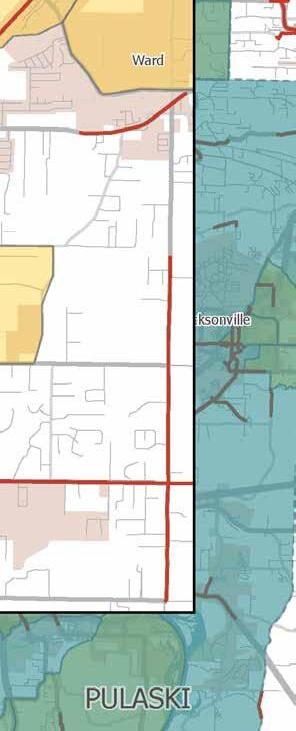

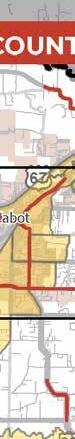
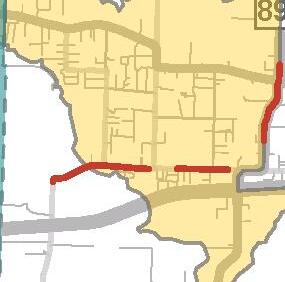
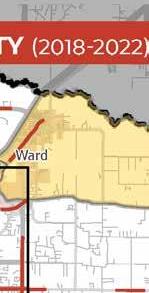
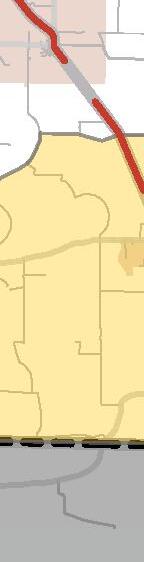
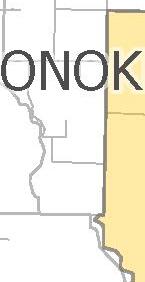
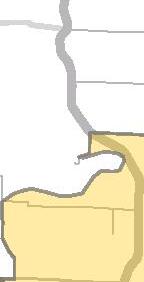
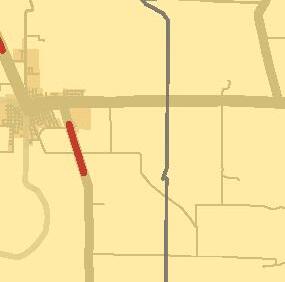
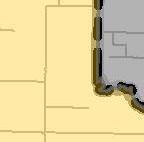
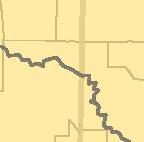
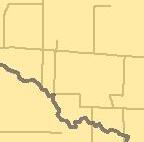
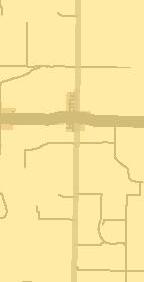
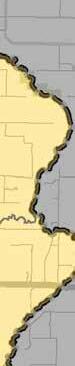
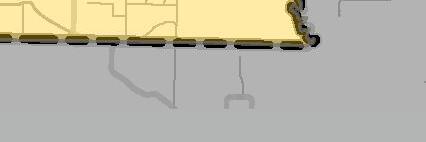


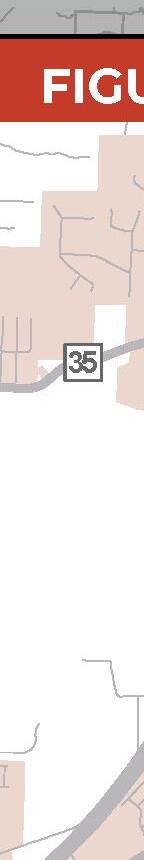
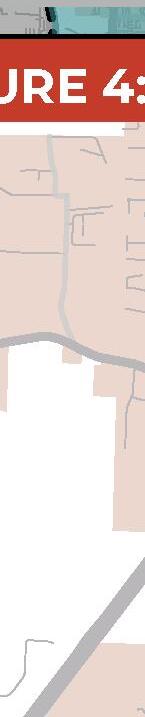

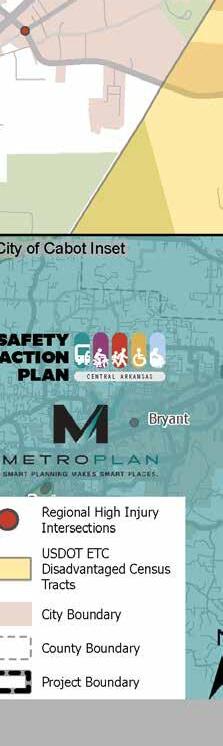
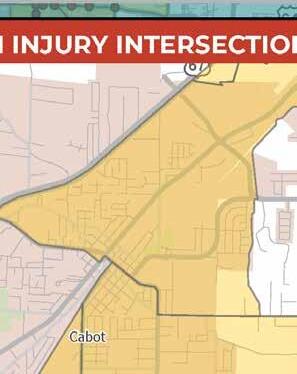
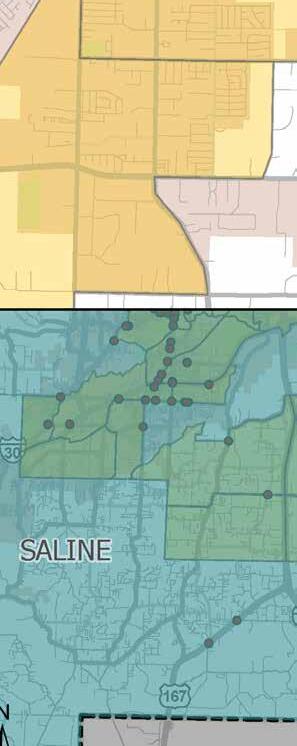
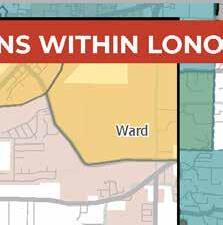
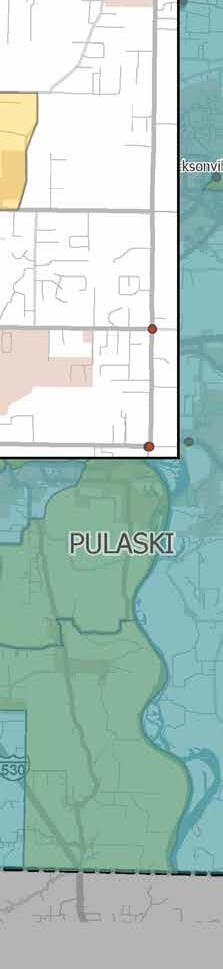
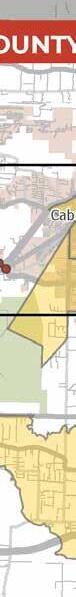

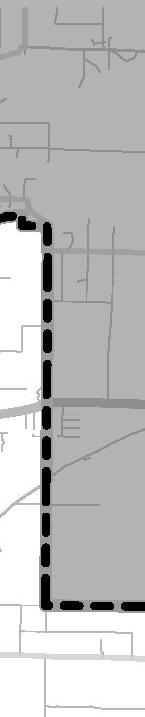
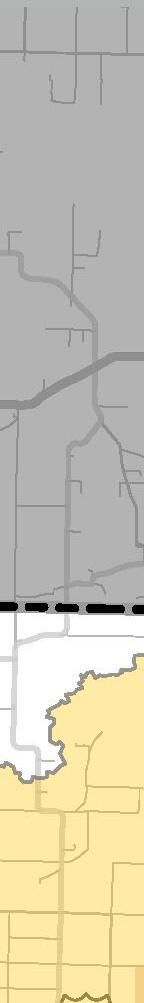
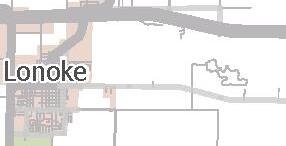
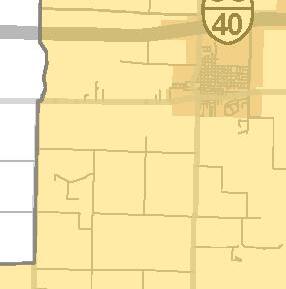

Safety for vulnerable road users, including pedestrians and bicyclists, is another important component in funding for projects through the USDOT SS4A Implementation Grant Program.


To account for crashes involving nonmotorized modes of transportation, fatal and serious injury crashes that involved a pedestrian or a bicycle within Lonoke County from 2018 through 2022 were overlayed onto the Regional HIN, as shown in Figure 5 and Figure 6. Of the 52 HIN segments within Lonoke County, 8 segments contained a crash that involved a pedestrian and 5 of them contained a crash that involved a bicyclist. Please note that the lines shown on the HIN maps may represent multiple one-mile segments combined into one line, as pedestrian or bicycle crashes may have occurred along multiple segments of a corridor. Safety for vulnerable road users, including pedestrians and bicyclists, is another important component in funding for projects through the USDOT SS4A Implementation Grant Program. Crashes on a segment or intersection that involved vulnerable road users is used in this study as part of the scoring to rank segments and intersections when prioritizing projects.

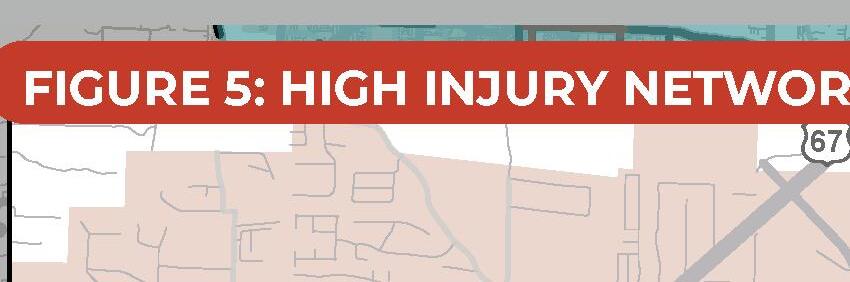


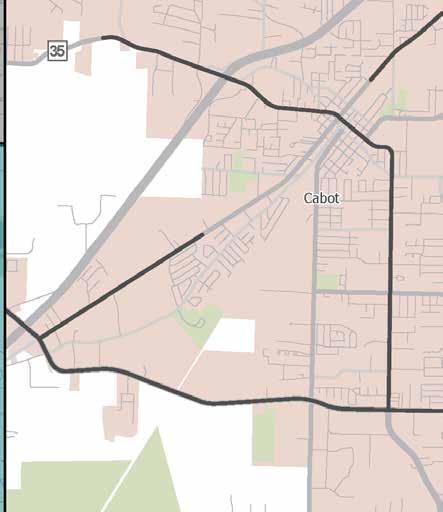
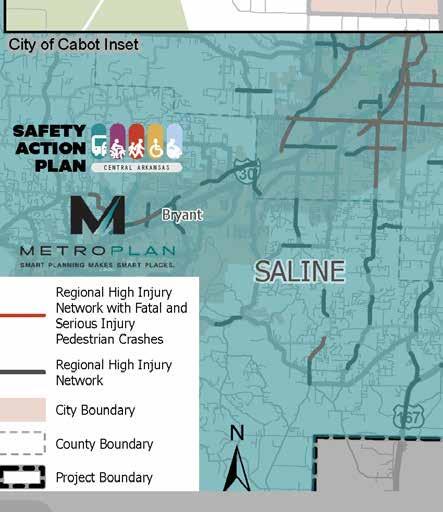
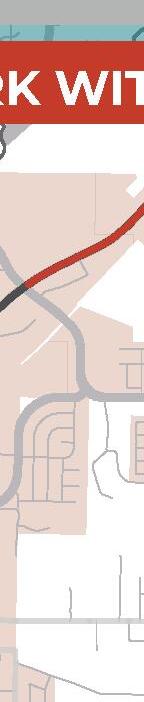

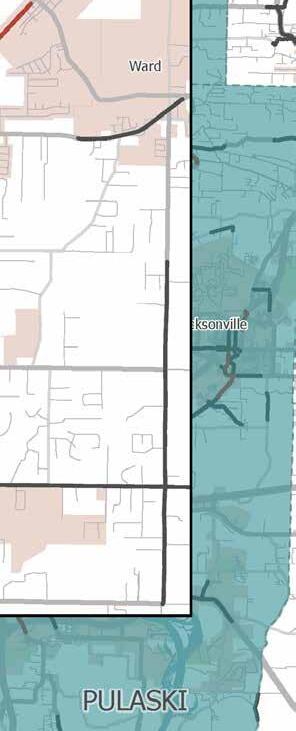
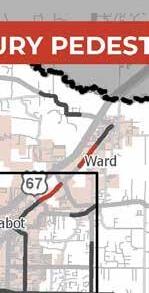
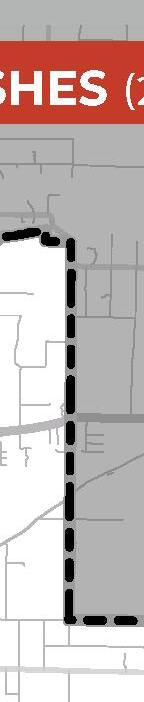
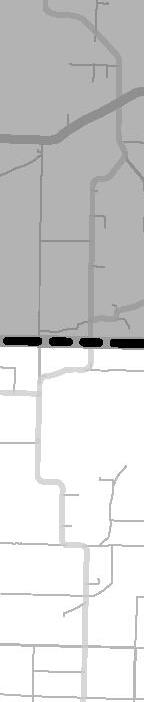
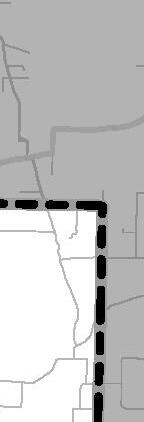
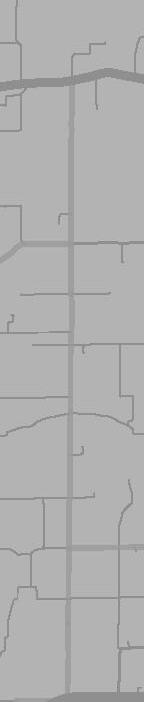
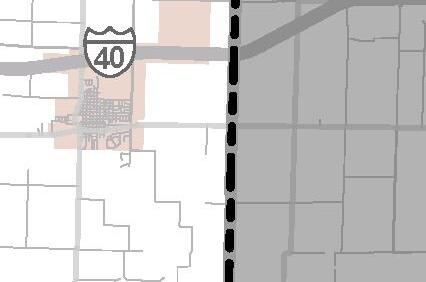


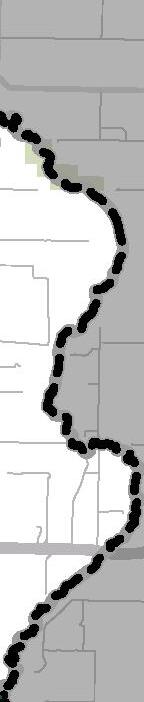
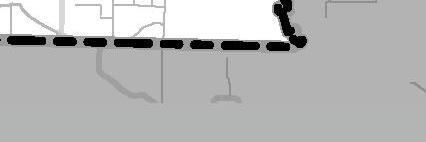

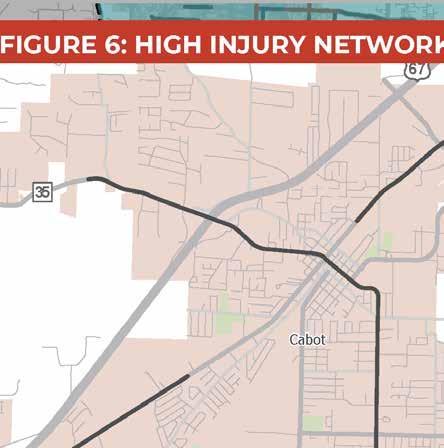
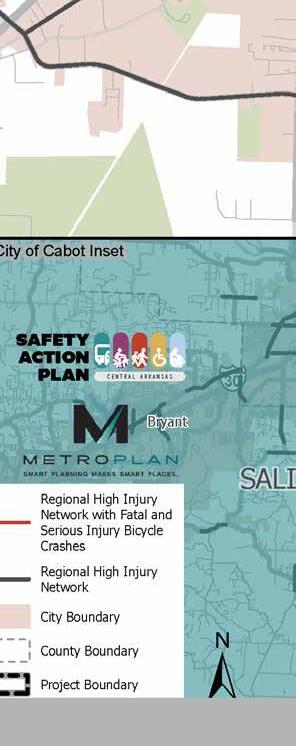
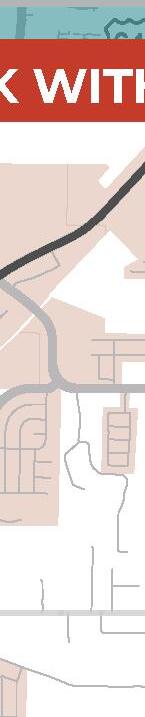
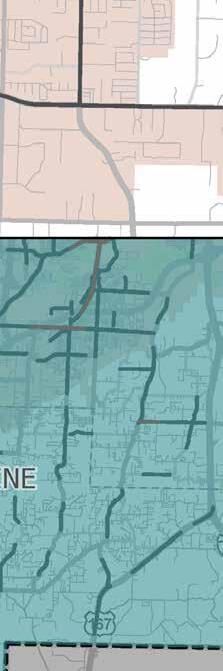
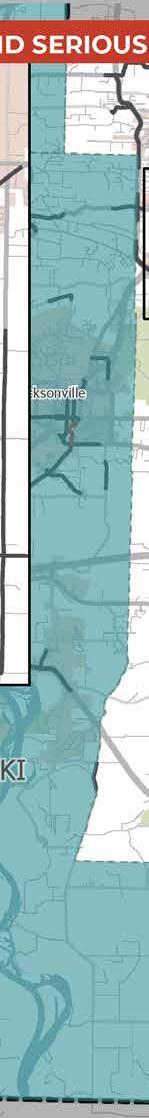
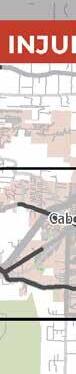
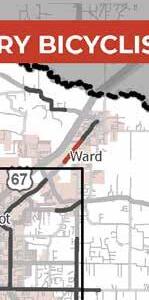
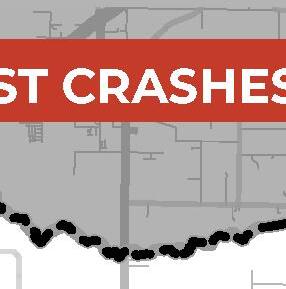
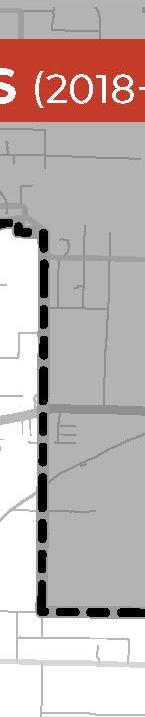

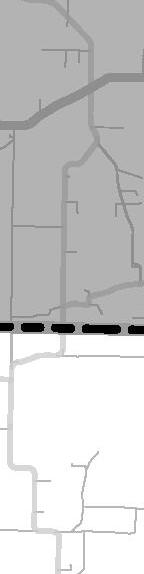
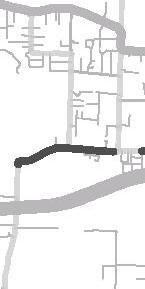

As part of the Central Arkansas Safety Action Plan, high injury segments and intersections were ranked through a needs score. The needs score included the corridor or intersections crash history, equity data, location characteristics, and stakeholder input. Additional detail about the scoring criteria can be found in the Central Arkansas Safety Action Plan.
Table 2 includes the top HIN segment in each city within Lonoke County that had a segment on the HIN. Table 3 includes the top High Injury Intersection in each city within Lonoke County that had an intersection considered to be a High Injury Intersection. The top segment or intersection in unincorporated Lonoke County is also included in the tables. Segments or intersections that were included in the Central Arkansas Safety Action Plan are identified in the “Top 20 Regional Plan” column. Additional information on these segments and intersections can be found in that plan.
Location-specific projects were developed for the Lonoke County Supplemental County Level Plan in order to address safety improvements within specific areas. These projects were identified by considering the highest scoring HIN segment within each city in Lonoke County and the highest scoring HIN segment in unincorporated Lonoke County. However, if the County or a city expressed the need for a different segment within their jurisdiction to be prioritized, that location was selected based on the agency’s input. The projects listed in Table 4 were recognized by stakeholders as having the greatest need for safety improvements within their respective jurisdiction.
For each location-specific project identified in Table 4 that is not already included in the Central Arkansas Safety Action Plan, additional detail has been included on the subsequent pages. Detail includes a crash map of the segment, count of crashes on the segments from 2018 to 2022, and suggested countermeasures. As noted earlier, the full list of countermeasures can be viewed in Section 5 - Safety Countermeasures Toolbox of the Central Arkansas Safety Action Plan.
4: Lonoke County Location-Specific Projects
*Additional detail and maps for these location specific projects can be found in the Central Arkansas Safety Action Plan.
Segment: S Pine St to Linda Ln
Jurisdiction: City of Cabot
High Visibility Crosswalk Pavement Markings
Add/Improve Sidewalk
Pedestrian Hybrid Beacon (PHB)
Segment: Cambridge St to Carl Lee Rd
Jurisdiction: City of England
Pavement Markings
Pavement
Shrubs
Add Advance Warning Signage
Safety Lighting
Add Shoulder


Segment: SH 15 to Cemetery Rd
Jurisdiction: City of Keo


Segment: Central High Rd to Elam St Jurisdiction: Lonoke County
Jurisdiction:


Our Goal: 40% reduction in fatal and serious injury crashes by 2040 40 by 40


Supplemental County Level Plan
November 2024


The information provided in this document is intended to be used for informational purposes only. No expressed or implied warranties are made by Metroplan, Kimley-Horn, Traffic Engineering Consultants, Crafton Tull, and Laneshift concerning the accuracy, completeness, reliability, and usability of this information. Further investigation such as field verification, site condition assessments, engineering analysis, and design are necessary prior to implementing any of the guidance contained herein.
This report was funded in part through grant(s) from the Federal Highway Administration and Federal Transit Administration, U.S. Department of Transportation. The views and opinions of the authors expressed herein do not necessarily state or reflect those of the U.S. Department of Transportation.
Notice of Nondiscrimination Metroplan complies with all civil rights provisions of the federal statutes and related authorities that prohibit discrimination in programs and activities receiving federal financial assistance. Therefore, Metroplan does not discriminate on the basis of race, sex, color, age, national origin, religion, disability, or income status, in admission or access to and treatment in Metroplan’s programs and activities, as well as Metroplan’s hiring or employment practices. Complaints of alleged discrimination and inquiries regarding Metroplan’s nondiscrimination policies may be addressed to Sydney Dozier, Title VI/ADA/504 Coordinator, 501 West Markham Street, Suite B, Little Rock, AR 72201, (501) 372-3300, or the following e-mail address: sdozier@metroplan.org
(Hearing and speech impaired may dial 711.)
This notice is available upon request from the Title VI/ADA/504 Coordinator in large print, audiotape or braille. Adopted by the Metroplan Board of Directors Date: November 20, 2024 Resolution: 24-13
ADA Americans with Disabilities Act
ARDOT Arkansas Department of Transportation
ETC Equitable Transportation Communities
FHWA Federal Highway Administration
HIN High Injury Network GIS Geographic Information System KABCO Injury Severity Scale
Fatal Injury
Possible Injury
No Apparent Injury
NHTSA National Highway Traffic Safety Administration
PHB Pedestrian Hybrid Beacon RRFB Rectangular Rapid Flashing Beacon RSA Road Safety Audit SAPAC Safety Action Plan Advisory Committee
SHSP Strategic Highway Safety Plan
SS4A Safe Streets and Roads for All
TWLT Two Way Left Turn
USDOT US Department of Transportation
VMT Vehicle Miles Traveled
VRU Vulnerable Road User


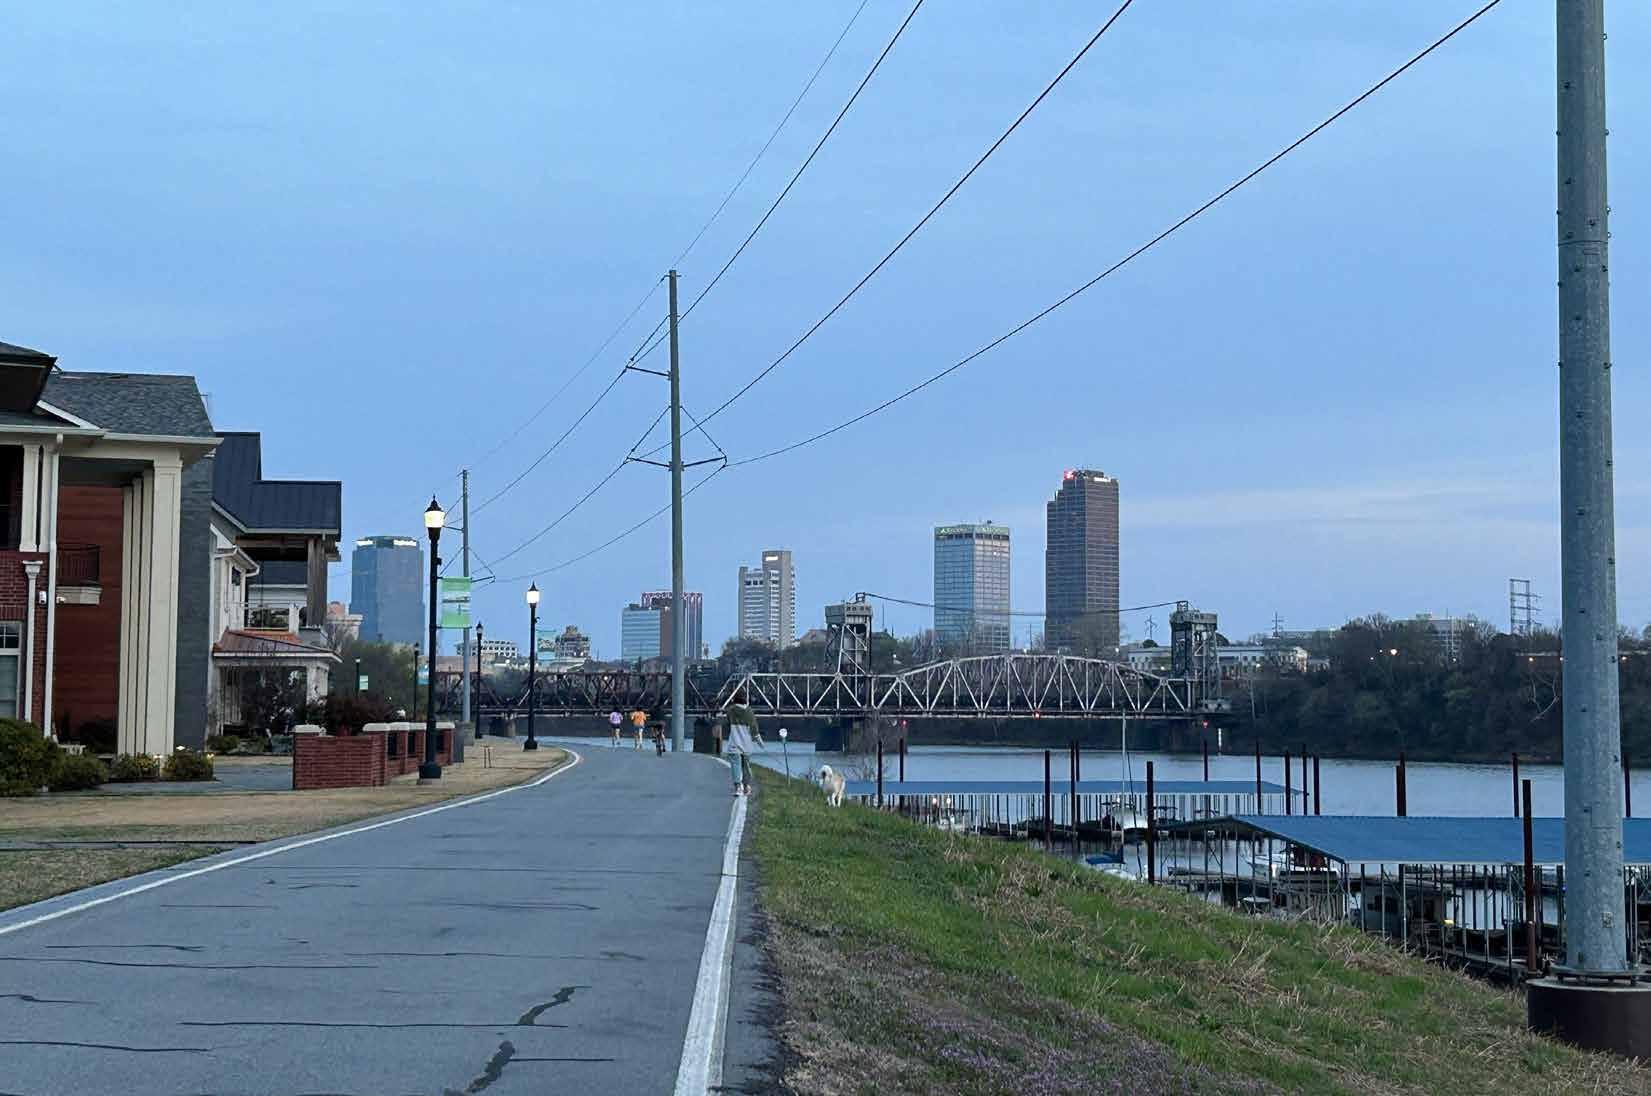
The purpose of the Pulaski County Supplemental County Level Plan is to address the specific safety needs and projects identified by local stakeholders within Pulaski County. The Supplemental County Level Plan expands on the Central Arkansas Safety Action Plan by focusing on additional segments and intersections located within Pulaski County’s High Injury Network (HIN) and High Injury Intersections that were not already addressed in Central Arkansas Safety Action Plan. Unlike the Central Arkansas Safety Action Plan, which considers the entire Central Arkansas Region as a whole and consists of Faulkner, Lonoke, Pulaski, and Saline Counties, this Supplemental County Level Plan focuses exclusively on Pulaski County (“the County”). Its main objectives are to identify projects and implement strategies that can help Pulaski County reduce fatal and serious injury crashes on its roadways, with the ultimate goal of eliminating these crashes all together. This is a crucial step towards achieving the same goal of eliminating fatal and serious injury crashes for the entire Central Arkansas Region. The Central Arkansas Safety Action Plan used a primarily data driven approach to develop regional projects. The Supplemental County Level Plan is also primarily data driven, but relies on input from local agencies to select segments and intersections as a key selection criteria in developing regional projects.
The Central Arkansas Safety Action Plan was created to determine which corridors have the greatest need for safety improvements and identify projects and strategies to help Central Arkansas reduce fatal and serious injuries on the Region’s roadways. The plan was developed by Metroplan and funded through a grant from the United States Department of Transportation (USDOT) Safe Streets and Roads for All (SS4A) Program. Central Arkansas leaders from the Metroplan Board of Directors committed to a goal of reducing fatal and serious injury crashes in Central Arkansas by 40 percent by the year 2040. The leaders set several interim goals starting with a baseline to be established in 2025 and incremental steps through the year 2050 to get an 80% reduction.
The Central Arkansas Safety Action Plan includes a large public engagement effort. Several engagement methods were used, including both online and in person public engagement, which consisted of an online survey and an interactive mapping activity, open houses, and booths at community events. The project team conducted stakeholder engagement, which included workshops with the Metroplan Board, meetings with the Safety Action Plan Advisory Committee (SAPAC), and stakeholder walk audits. The public and stakeholder engagement efforts were used to identify projects and implement strategies to increase safety in Central Arkansas.
The Central Arkansas Safety Action Plan includes a list of Regional High Injury Network (HIN) segments and High Injury Intersections. The threshold crash per mile value for segments included in the HIN was
two fatal and serious injury crashes per mile or greater from 2018 through 2022. High injury intersections had at least two fatal and serious injury crashes that occurred within 250 feet of the intersection from 2018 through 2022. These segments and intersections were scored and prioritized based on SS4A key objectives to assess the level of need for safety improvements, such as the number of fatal and serious injury crashes, underserved areas, and locations where vulnerable road users such as pedestrians and people on bikes are frequently present. The Central Arkansas Safety Action Plan identifies the 20 highest scoring Regional HIN and 20 highest scoring Regional High Injury Intersections. In addition to the top 20 regionwide segments and intersections, the five highest scoring state route HIN segments and the five highest scoring local roads in each county were identified. Similarity, the five highest scoring intersections of two state routes or a state route and local road, as well as the five highest scoring intersections of two local roads were identified, where applicable.
The Central Arkansas Safety Action Plan also includes a Safety Countermeasures Toolbox, made up of countermeasures recommended by the Federal Highway Administration (FHWA), National Highway Transportation Safety Administration (NHTSA), and Arkansas Department of Transportation (ARDOT) that have been historically proven to increase safety on roadways. Countermeasures include changes in roadway geometry, operations, signage, pavement markings, and access management. These countermeasures have a positive impact on reducing fatal and serious injury crashes and may be used on roadways not identified in the Pulaski County Supplemental Plan. The full list of recommended safety
countermeasures can be viewed in Section 5- Safety Countermeasures Toolbox of the Central Arkansas Safety Action Plan
Ten location-specific projects were developed for the regionwide top 20 segments and top 20 intersections. The ten location-specific projects incorporate the regionwide top 20 segments and top 20 intersections. All but one of the regional projects are in Pulaski County, with the remaining project in Faulkner County. Additional location-specific projects were developed for the highest scoring state route and highest scoring local road in Faulkner, Lonoke, and Saline Counties These location-specific projects consist of combinations of safety improvements from the Safety Countermeasures Toolbox identified in the Central Arkansas Safety Action Plan that are expected to reduce crashes, particularly fatal and serious injury crashes and crashes involving vulnerable road users, within the vicinity of the project location. To view the regional projects that are in Pulaski County, please refer to the Central Arkansas Safety Action Plan
The Central Arkansas Safety Action Plan also includes a list of systemic improvements, developed based on the regional crash analysis and roadway network review. The systemic improvements consist of countermeasures that are implemented based on high-risk roadway features correlated with a particular crash type. Proposed policies to support recommended systemic improvements are included to provide guidance on incorporating safety countermeasures in future roadway and transportation projects


The main objective of this plan is to identify projects and implement strategies that can help Pulaski County reduce fatal and serious injury crashes on its roadways, with the ultimate goal of eliminating these crashes all together.


by

Our Goal: 40% reduction in fatal and serious injury crashes by 2040


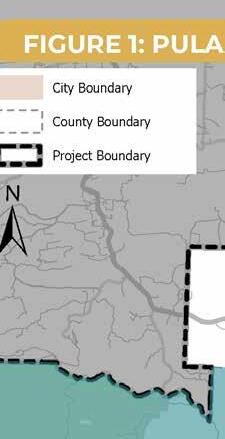
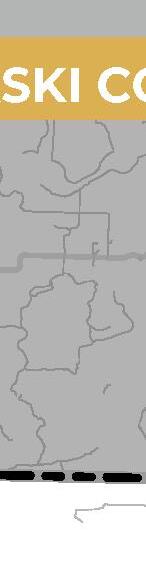


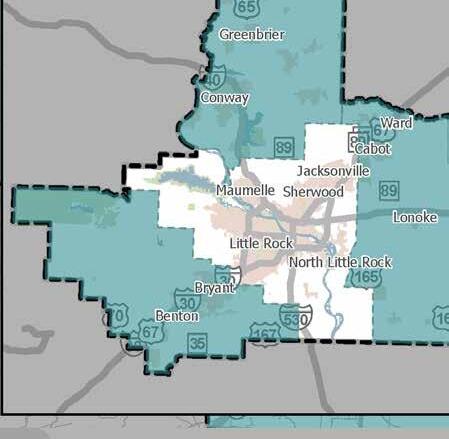

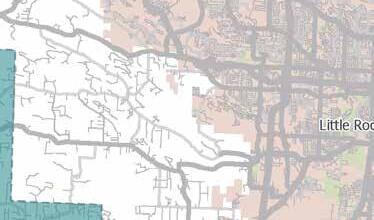
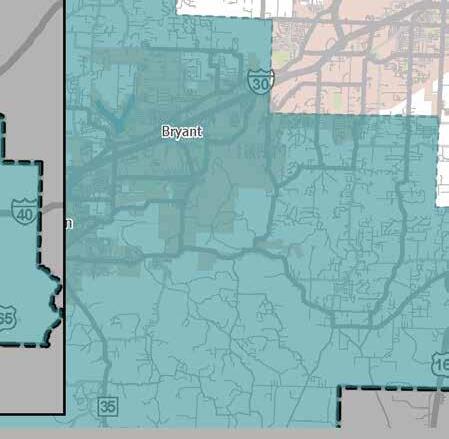
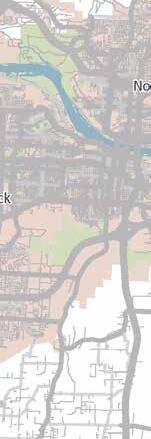
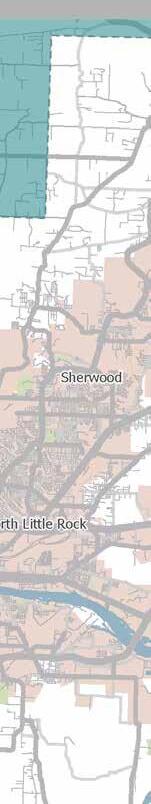
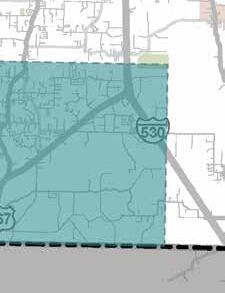


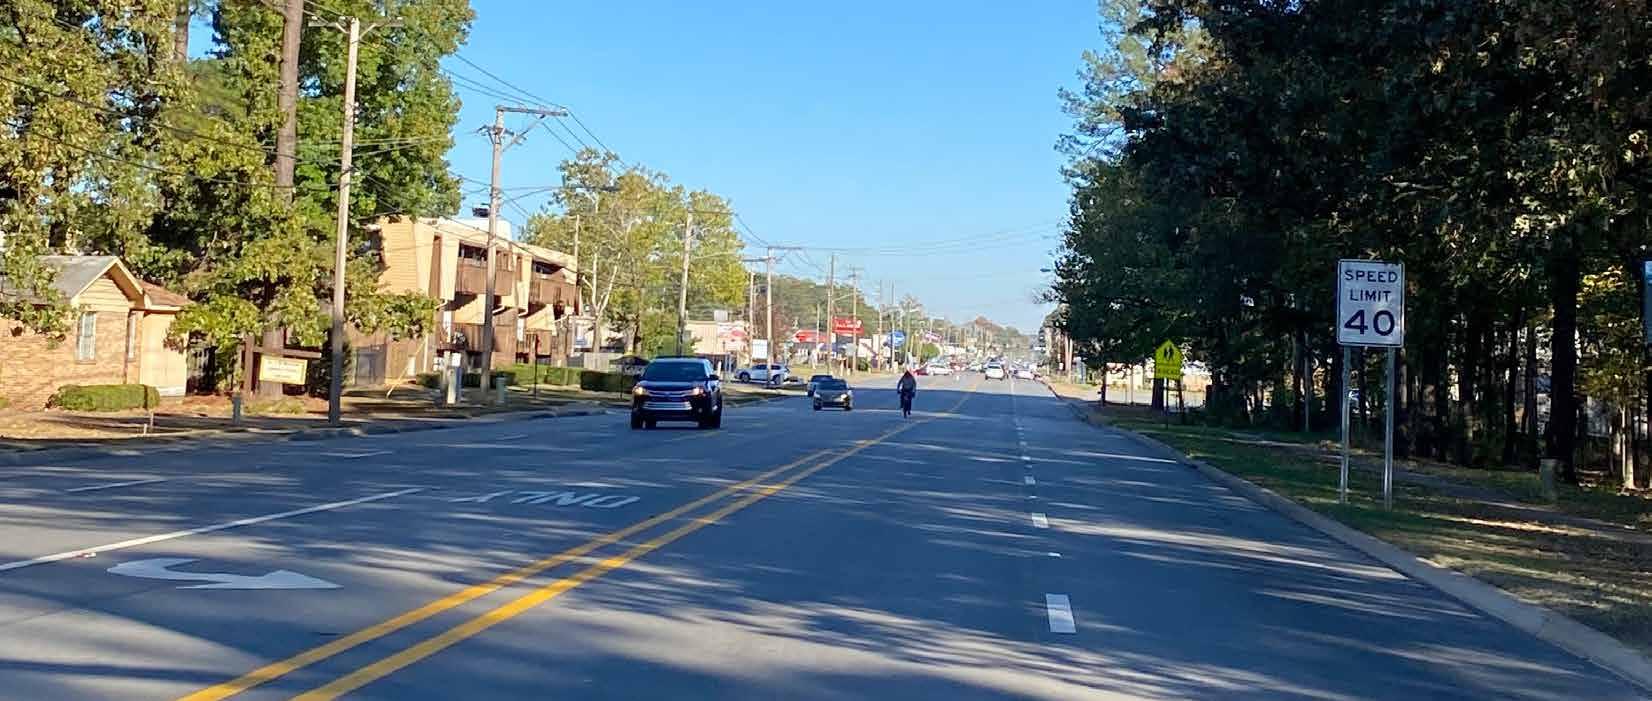
Pulaski County, shown in Figure 1, is located in the Central Arkansas Region and has an approximate population of 400,000 as of July 2023, according to the US Census Bureau. This population accounts for roughly 55 percent of the total population in the Central Arkansas Region. Pulaski County encompasses approximately one fourth of the Central Arkansas Region and includes the Cities of Alexander, Jacksonville, Little Rock, Maumelle, North Little Rock, and Sherwood. Lane miles within Pulaski County make up 40 percent of the total lane miles within the Central Arkansas Region.
Pulaski County is located in the Central Arkansas Region and has an approximate population of 400,000 as of July 2023.
The number of fatal crashes has been increasing each year, except for a decrease in 2021.
A crash analysis was conducted to identify patterns and trends in crash types and common factors contributing to fatal and serious injury crashes within Pulaski County.
From 2018 to 2022, there were over 80 thousand reported crashes within Pulaski County, representing nearly 70 percent of all crashes in the Central Arkansas Region. Out of the total crashes, 345 crashes resulted in fatalities, while 1,338 crashes led to serious injuries. The number of fatal crashes has been increasing each year, except for a decrease in 2021. However, in 2022, the number of fatal crashes rose back up to the same level as in 2020. On the other hand, the number of serious injuries peaked at 314 in 2020 and has been decreasing each year since.

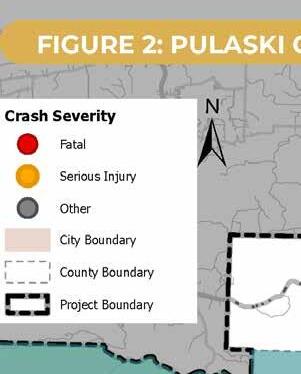

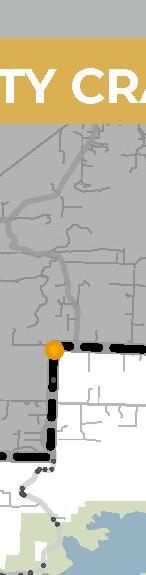
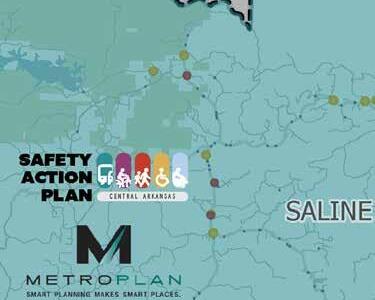
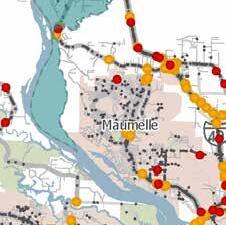
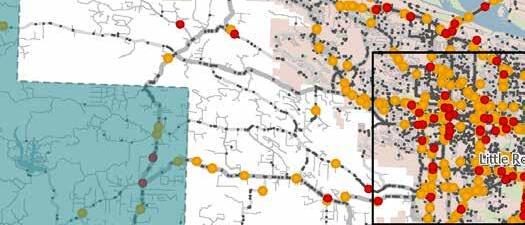
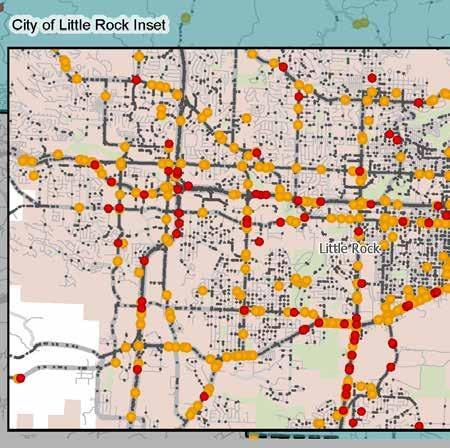
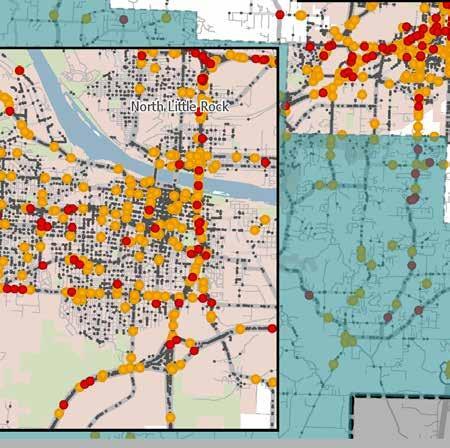
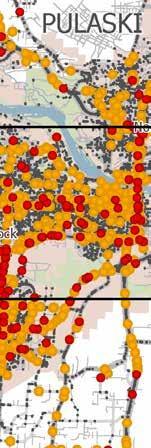
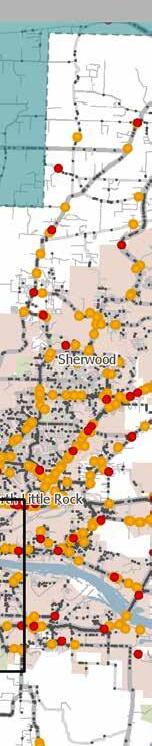
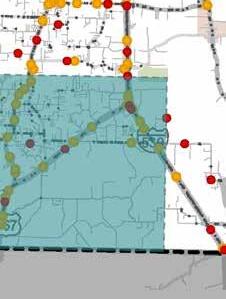


The Arkansas Strategic Highway Safety Plan (SHSP) identifies focus areas of safety for the State and provides a framework for reducing fatal and serious injury crashes on all public roads. Projects funded by the Highway Safety Improvement Program (HSIP) must reflect the SHSP at a strategic level. The focus areas are crash types and factors that are prominent throughout the State and often lead to fatal and serious injury crashes. Crash data from 2018 through 2022 was filtered to analyze crashes within Pulaski County related to the SHSP focus areas. A summary of the crash data over the last five years for crashes within Pulaski County for each of the SHSP focus areas is provided in Table 1.
During the review of Pulaski County’s highest SHSP focus areas for fatal and serious injury
crashes, it was found that intersectionrelated, distracted driving, and non-motorist crashes were the top three SHSP focus areas. These SHSP focus areas align with the top three areas of concern for the Central Arkansas Region. This correlation is likely due to the fact that Pulaski County contains over half of the population in the Central Arkansas Region and 40 percent of the total lane miles within Central Arkansas.
Non-motorist crashes within Pulaski County have been experiencing a decline since 2020. However, the trends for the top two SHSP focus areas in Pulaski County over the past five years are a cause for concern, as intersection-related and distracted driving crashes have shown an increasing trend This is not in line with the regional goal of reducing fatal and serious injury crashes by 40 percent by 2040 and ultimately reaching zero. It is important for Pulaski County to
continue to prioritize safety and invest in targeted and systemic countermeasures that can address these SHSP focus areas
A Regional High Injury Network (HIN) was developed as part of the Central Arkansas Safety Action Plan. The HIN is made up of one-mile segments with a high frequency of fatal and serious injury crashes. The HIN is a way to identify parts of a roadway network with higher rates of fatal and serious injury crashes. The Central Arkansas HIN consists of about 19 percent of the functionally classed roadway miles within the Central Arkansas Region that are not interstates, freeways, or expressways. These roadways account for approximately 77 percent of fatal and serious injury crashes that did not occur on interstates, freeways, or expressways from 2018 through 2022. Pulaski County contains 338 Regional HIN segments, accounting for approximately 64 percent of the Regional HIN, shown in Figure 3. To reduce fatal and serious injury crashes in Pulaski County, it is important to prioritize targeted countermeasures on the HIN segments, which have the highest number of fatal and serious injury crashes.
A Regional High Injury Intersection set was also established as part of the Central Arkansas Safety Action Plan, Figure 4
shows high injury intersections within Pulaski County. Pulaski County contains 112 intersections that make up approximately 71 percent of the Regional High Injury Intersections.
The USDOT Equitable Transportation Communities (ETC) national census tract data helps identify historical underinvestment in disadvantaged communities. This information shows the cumulative burden these communities experience in various areas. The ETC Explorer uses 2020 census tracts and data to analyze five components, each of which have numerous factors that make up their score: Transportation Insecurity, Climate and Disaster Risk Burden, Health Vulnerability, and Social Vulnerability. The overlay of disadvantaged census tracts, shown in Figure 3 and Figure 4, revealed that almost 55 percent of HIN segments and almost 62 percent of HII within Pulaski County fall within a disadvantaged community. Equity is an important component in funding for projects through the USDOT SS4A Implementation Grant Program. Location of a segment or intersection within a disadvantaged census tract is used in this study as part of the scoring to rank segments and intersections when prioritizing projects.
A dashboard was created as a component of the Central Arkansas Safety Action Plan. The dashboard includes crash data statistics, the interactive Regional High Injury Network, and recommended projects for the Region.
The interactive safety dashboard can be found here: Central Arkansas Safety Dashboard


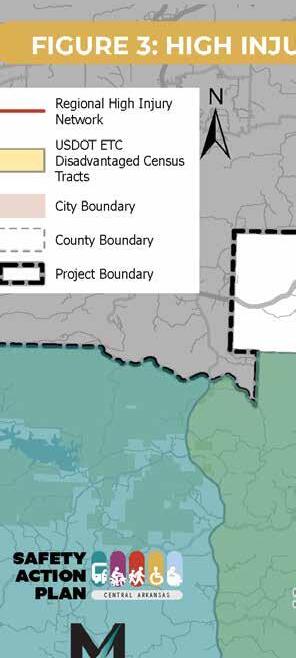


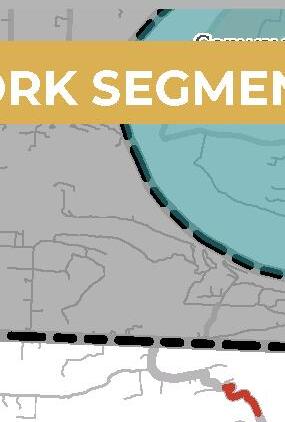
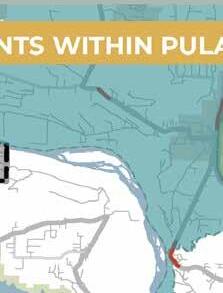

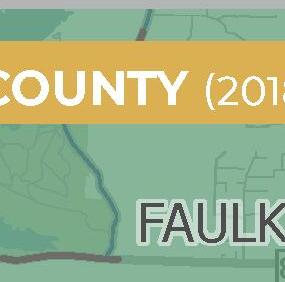
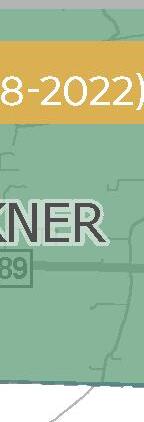
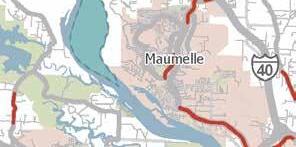
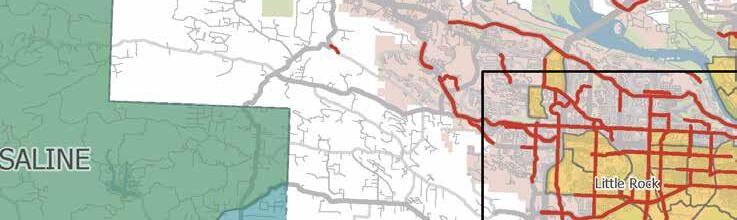
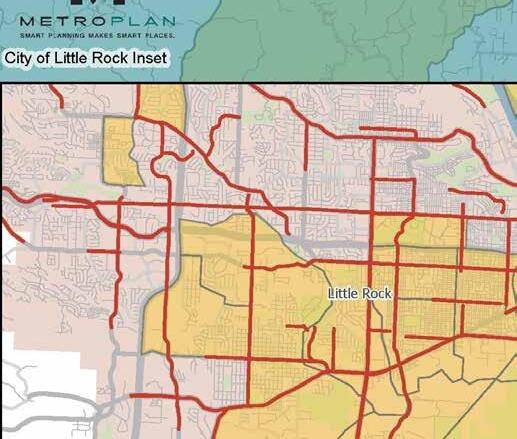
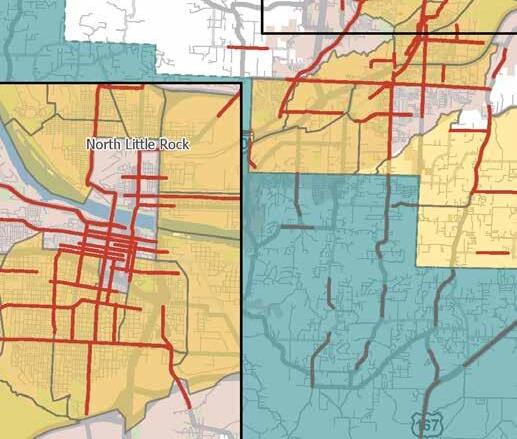
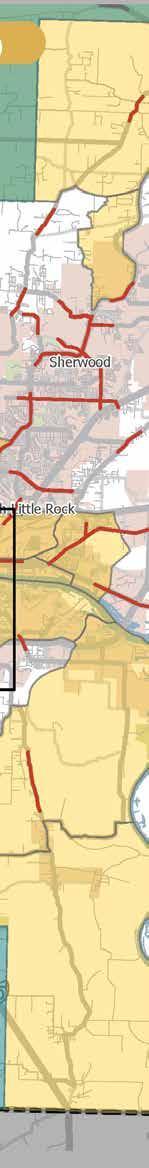


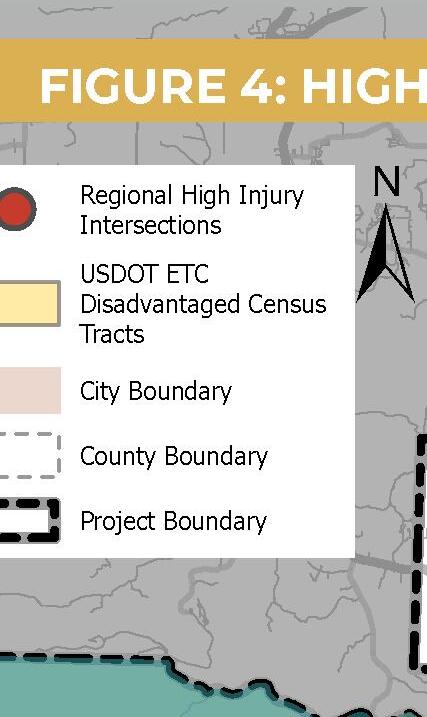


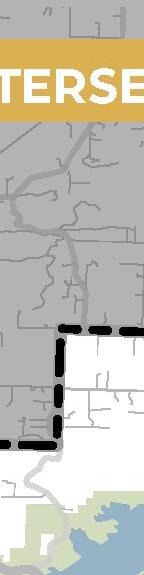
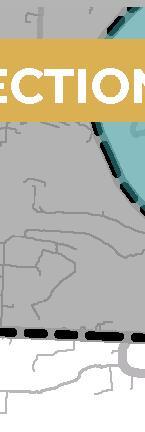
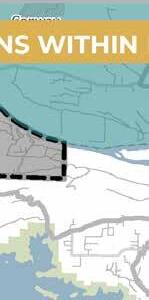
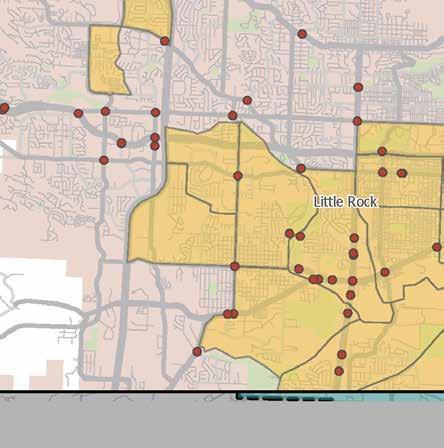
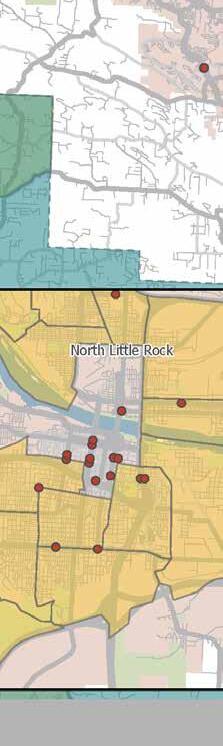
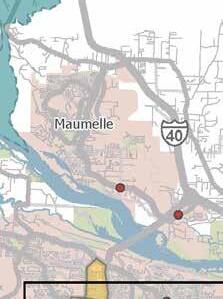
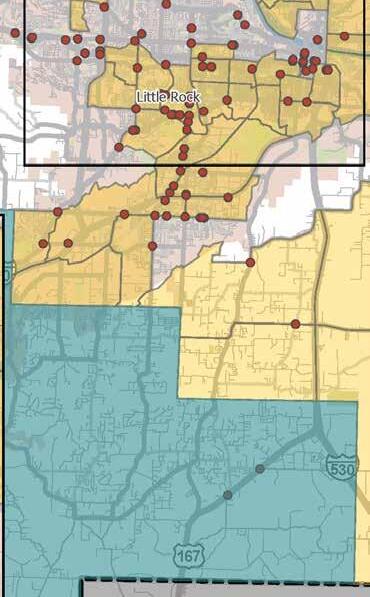


Safety for vulnerable road users, including pedestrians and bicyclists, is another important component in funding for projects through the USDOT SS4A Implementation Grant Program.
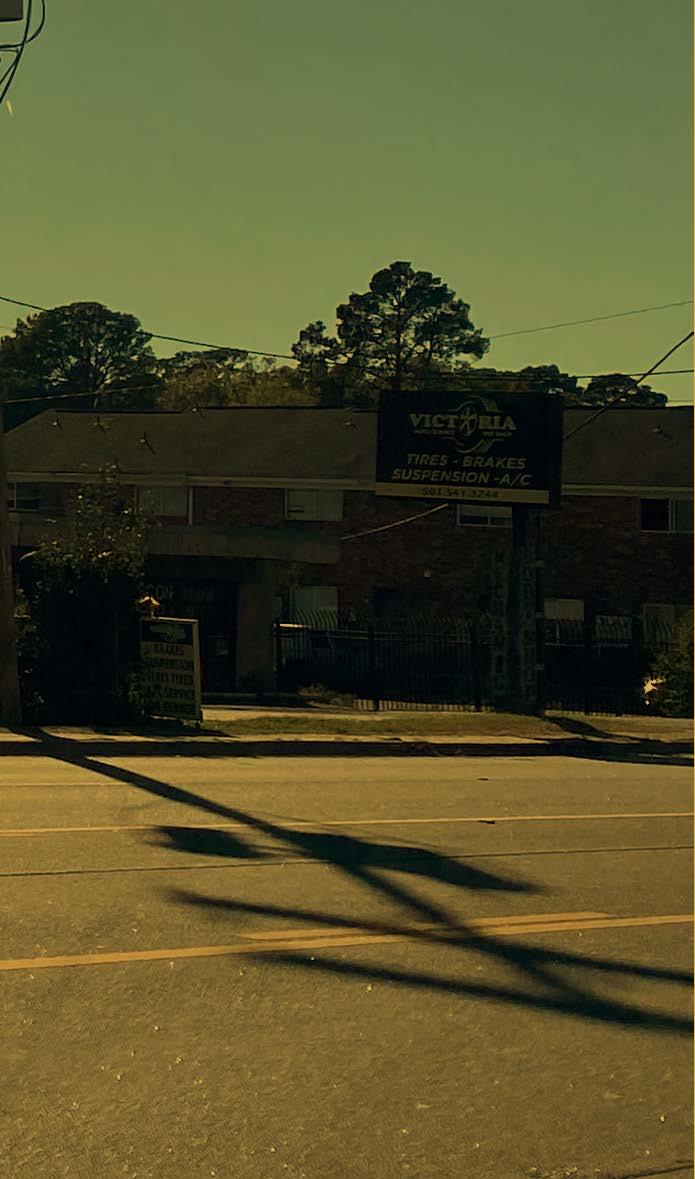

To account for crashes involving nonmotorized modes of transportation, fatal and serious injury crashes that involved a pedestrian or a bicycle within Pulaski County from 2018 through 2022 were overlayed onto the Regional HIN, as shown in Figure 5 and Figure 6. Of the 338 HIN segments within Pulaski County, 166 segments contained a crash that involved a pedestrian and 50 of them contained a crash that involved a bicyclist. Please note that the lines shown on the HIN maps may represent multiple one-mile segments combined into one line, as pedestrian or bicycle crashes may have occurred along multiple segments of a corridor. Safety for vulnerable road users, including pedestrians and bicyclists, is another important component in funding for projects through the USDOT SS4A Implementation Grant Program. Crashes on a segment or intersection that involved vulnerable road users is used in this study as part of the scoring to rank segments and intersections when prioritizing projects.


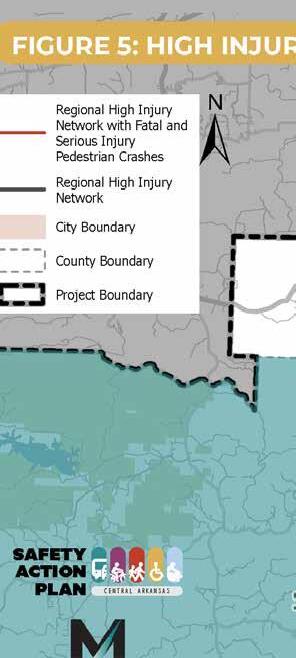
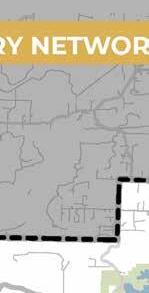
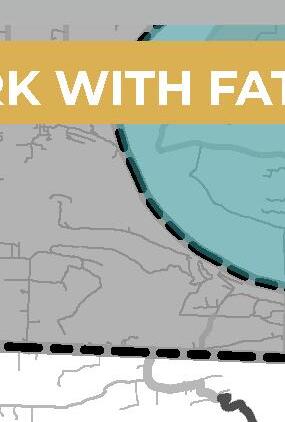
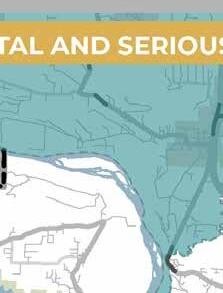


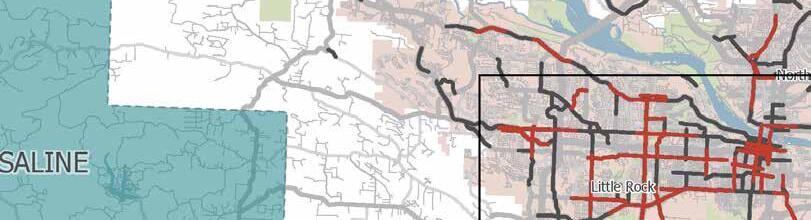
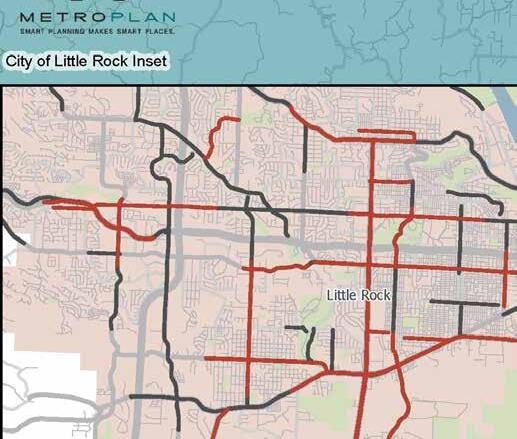
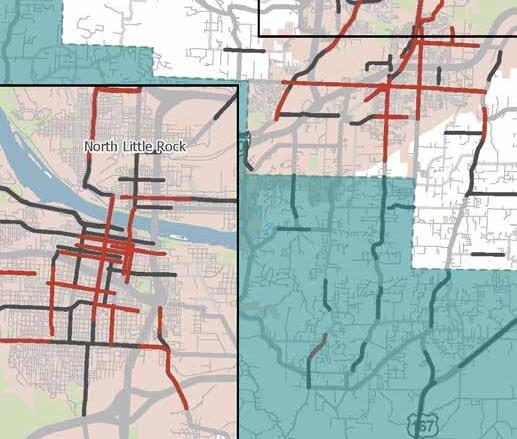
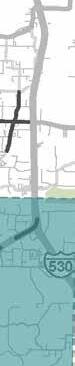
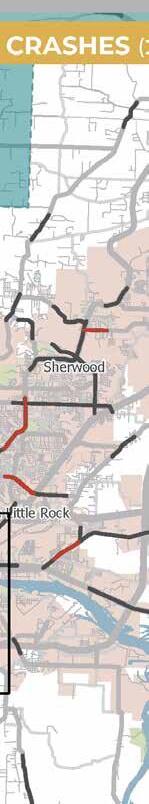


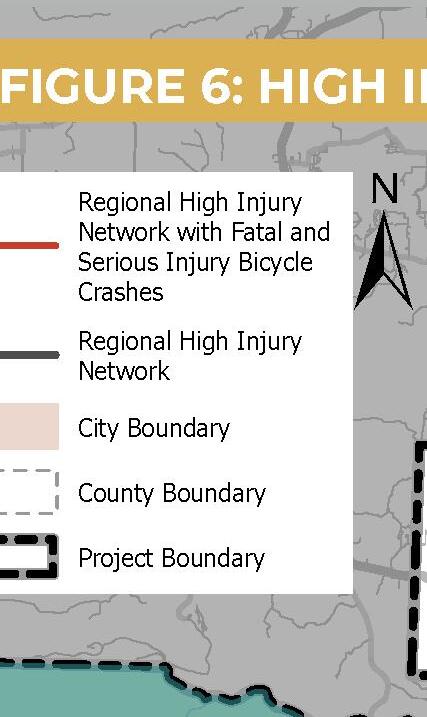
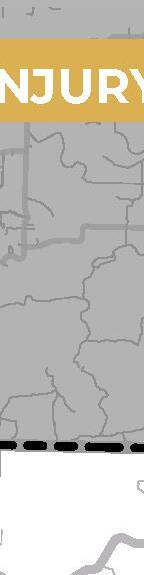

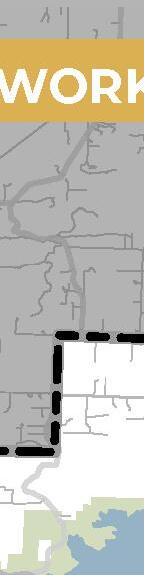
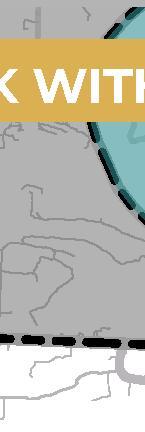
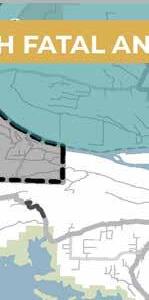


FIGURE 6: HIGH INJURY NETWORK WITH FATAL AND SERIOUS INJURY BICYCLIST CRASHES (2018-2022)

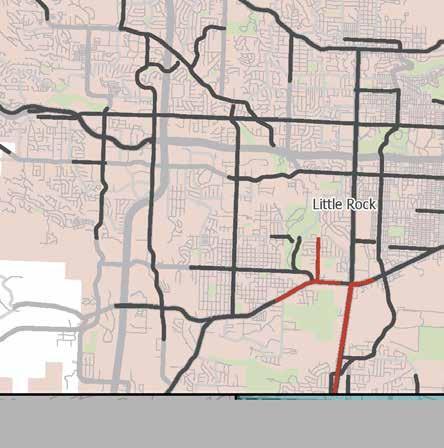
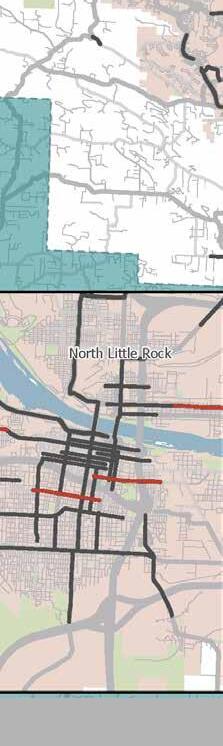

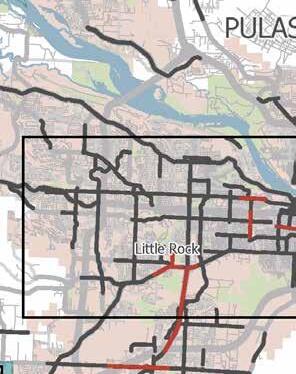
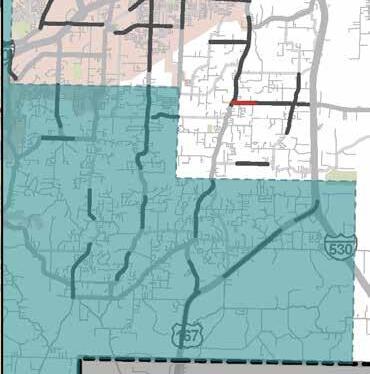


As part of the Central Arkansas Safety Action Plan, high injury segments and intersections were ranked through a needs score. The needs score included the corridor or intersections crash history, equity data, location characteristics, and stakeholder input. Additional detail about the scoring criteria can be found in the Central Arkansas Safety Action Plan.
Table 2 includes the top HIN segment in each city within Pulaski County that had a segment on the HIN. Table 3 includes the top High Injury Intersection in each city within Pulaski County that had an intersection considered to be a High Injury Intersection The top segment or intersection in unincorporated Pulaski County is also included in the tables. Segments or intersections that were included in the Central Arkansas Safety Action Plan are identified in the “Top 20 Regional Plan” column Additional information on these segments and intersections can be found in that plan
Location-specific projects were developed for the Pulaski County Supplemental County Level Plan in order to address safety improvements within specific areas. These projects were identified by considering the highest scoring HIN segment within each city in Pulaski County and the highest scoring HIN segment in unincorporated Pulaski County. However, if the County or a city expressed the need for a different segment within their jurisdiction to be prioritized, that location was selected based on the agency’s input. The projects listed in Table 4 were recognized by stakeholders as having the greatest need for safety improvements within their respective jurisdictions. For each location-specific project identified in Table 4 that is not already included in the Central Arkansas Safety Action Plan, additional detail has been included on the subsequent pages. Detail includes a crash map of the segment, count of crashes on the segments from 2018 to 2022, and suggested countermeasures. As noted earlier, the full list of countermeasures can be viewed in Section 5 - Safety Countermeasures Toolbox of the Central Arkansas Safety Action Plan.
*Additional detail and maps for these location specific projects can be found in the Central Arkansas Safety Action Plan.
Segment: IH 30 to 3rd Street (SH 111)
Jurisdiction: City of Alexander
Segment: W 9th St to La Harpe Blvd
Jurisdiction: City of Little Rock
Segment: Club Rd to Maryland Ave
Jurisdiction: City of Sherwood
Vulnerable Road User
Add/Improve Sidewalk
Vehicular Countermeasures
Add/Improve Pavement Markings
Conduct Signal Warrant (IH 30 Frontage Rd)
Safety Lighting
Enhanced Curve Delineation


High Visibility Crosswalk Pavement Markings
Evaluate Pedestrian Crossing (Intersection of W Markham St and Broadway St)
Convert Diagonal Ramps to Directional Ramps
Add/Improve Sidewalk
Sidewalk Buffer
Vehicular Countermeasures
Access Management (Accompanied by removal of or conversion of TWLTL to dedicated left-turn lane)
Safety Lighting
Retroreflective Backplates
Adjust Signal Timings
Other Countermeasures
Further Study Needed (RSA)
Add/Improve Sidewalk
Sidewalk Buffer
Install Pedestrian Mid-Block Crosswalk (Teetwood Rd)
Vehicular Countermeasures
Access Management (Accompanied by removal of or conversion of TWLTL to dedicated left-turn lane)
Safety Lighting
Add/Improve Pavement Markings
Retroreflective Backplates


Segment: Stonehenge Dr to Aviator Dr
Jurisdiction: Pulaski County
Countermeasure
Vehicular Countermeasures
Add/Improve Pavement Markings
Transverse Rumble Strips (In Advance of SH 89 Intersection)
Safety Lighting
Enhanced Curve Warning
Conduct Speed Study
Extend Shoulder


Segment: Asher Rd to Clark St
Jurisdiction: City of Wrightsville
Bike Lanes
Add/Improve Sidewalk
Sidewalk Buffer
Safety Lighting
Add Shoulder
Enhanced Curve Delineation
Add/Improve Pavement Markings
Segment: John Harden Dr to Stonewall Dr
Jurisdiction: City of Jacksonville
Sidewalk Buffer
Vulnerable Road User
Add/Improve Sidewalk
High Visibility Crosswalk Pavement Markings
Install Pedestrian Signal at Signalized Intersection (N JP Wright Loop Rd)
Vehicular Countermeasures
Add/Improve Pavement Markings
Safety Lighting
Access Management (Accompanied by removal of or conversion of TWLTL to dedicated left-turn lane)


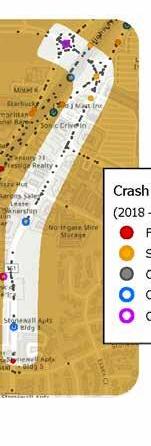
Segment: N Broadway St to IH 30
Jurisdiction: City of North Little Rock
Countermeasure
Vulnerable Road User
Sidewalk Buffer
Add/Improve Sidewalk
Pedestrian Hybrid Beacon (PHB)
High Visibility Crosswalk Pavement Markings
Vehicular Countermeasures
Add/Improve Pavement Markings
Retroreflective Backplates
Safety Lighting
Segment: Odom Blvd & Club Manor Dr
Jurisdiction: City of Maumelle
Countermeasure
Vulnerable Road User
High Visibility Crosswalk Pavement Markings
Vehicular Countermeasures
Safety Lighting
Traffic Signal
Add Advance Warning Signage
Add/Improve Pavement Markings


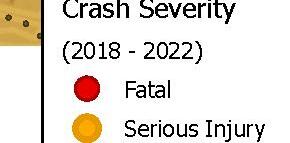


Lane miles within Pulaski County make up 40 percent of the total lane miles within the Central Arkansas Region.


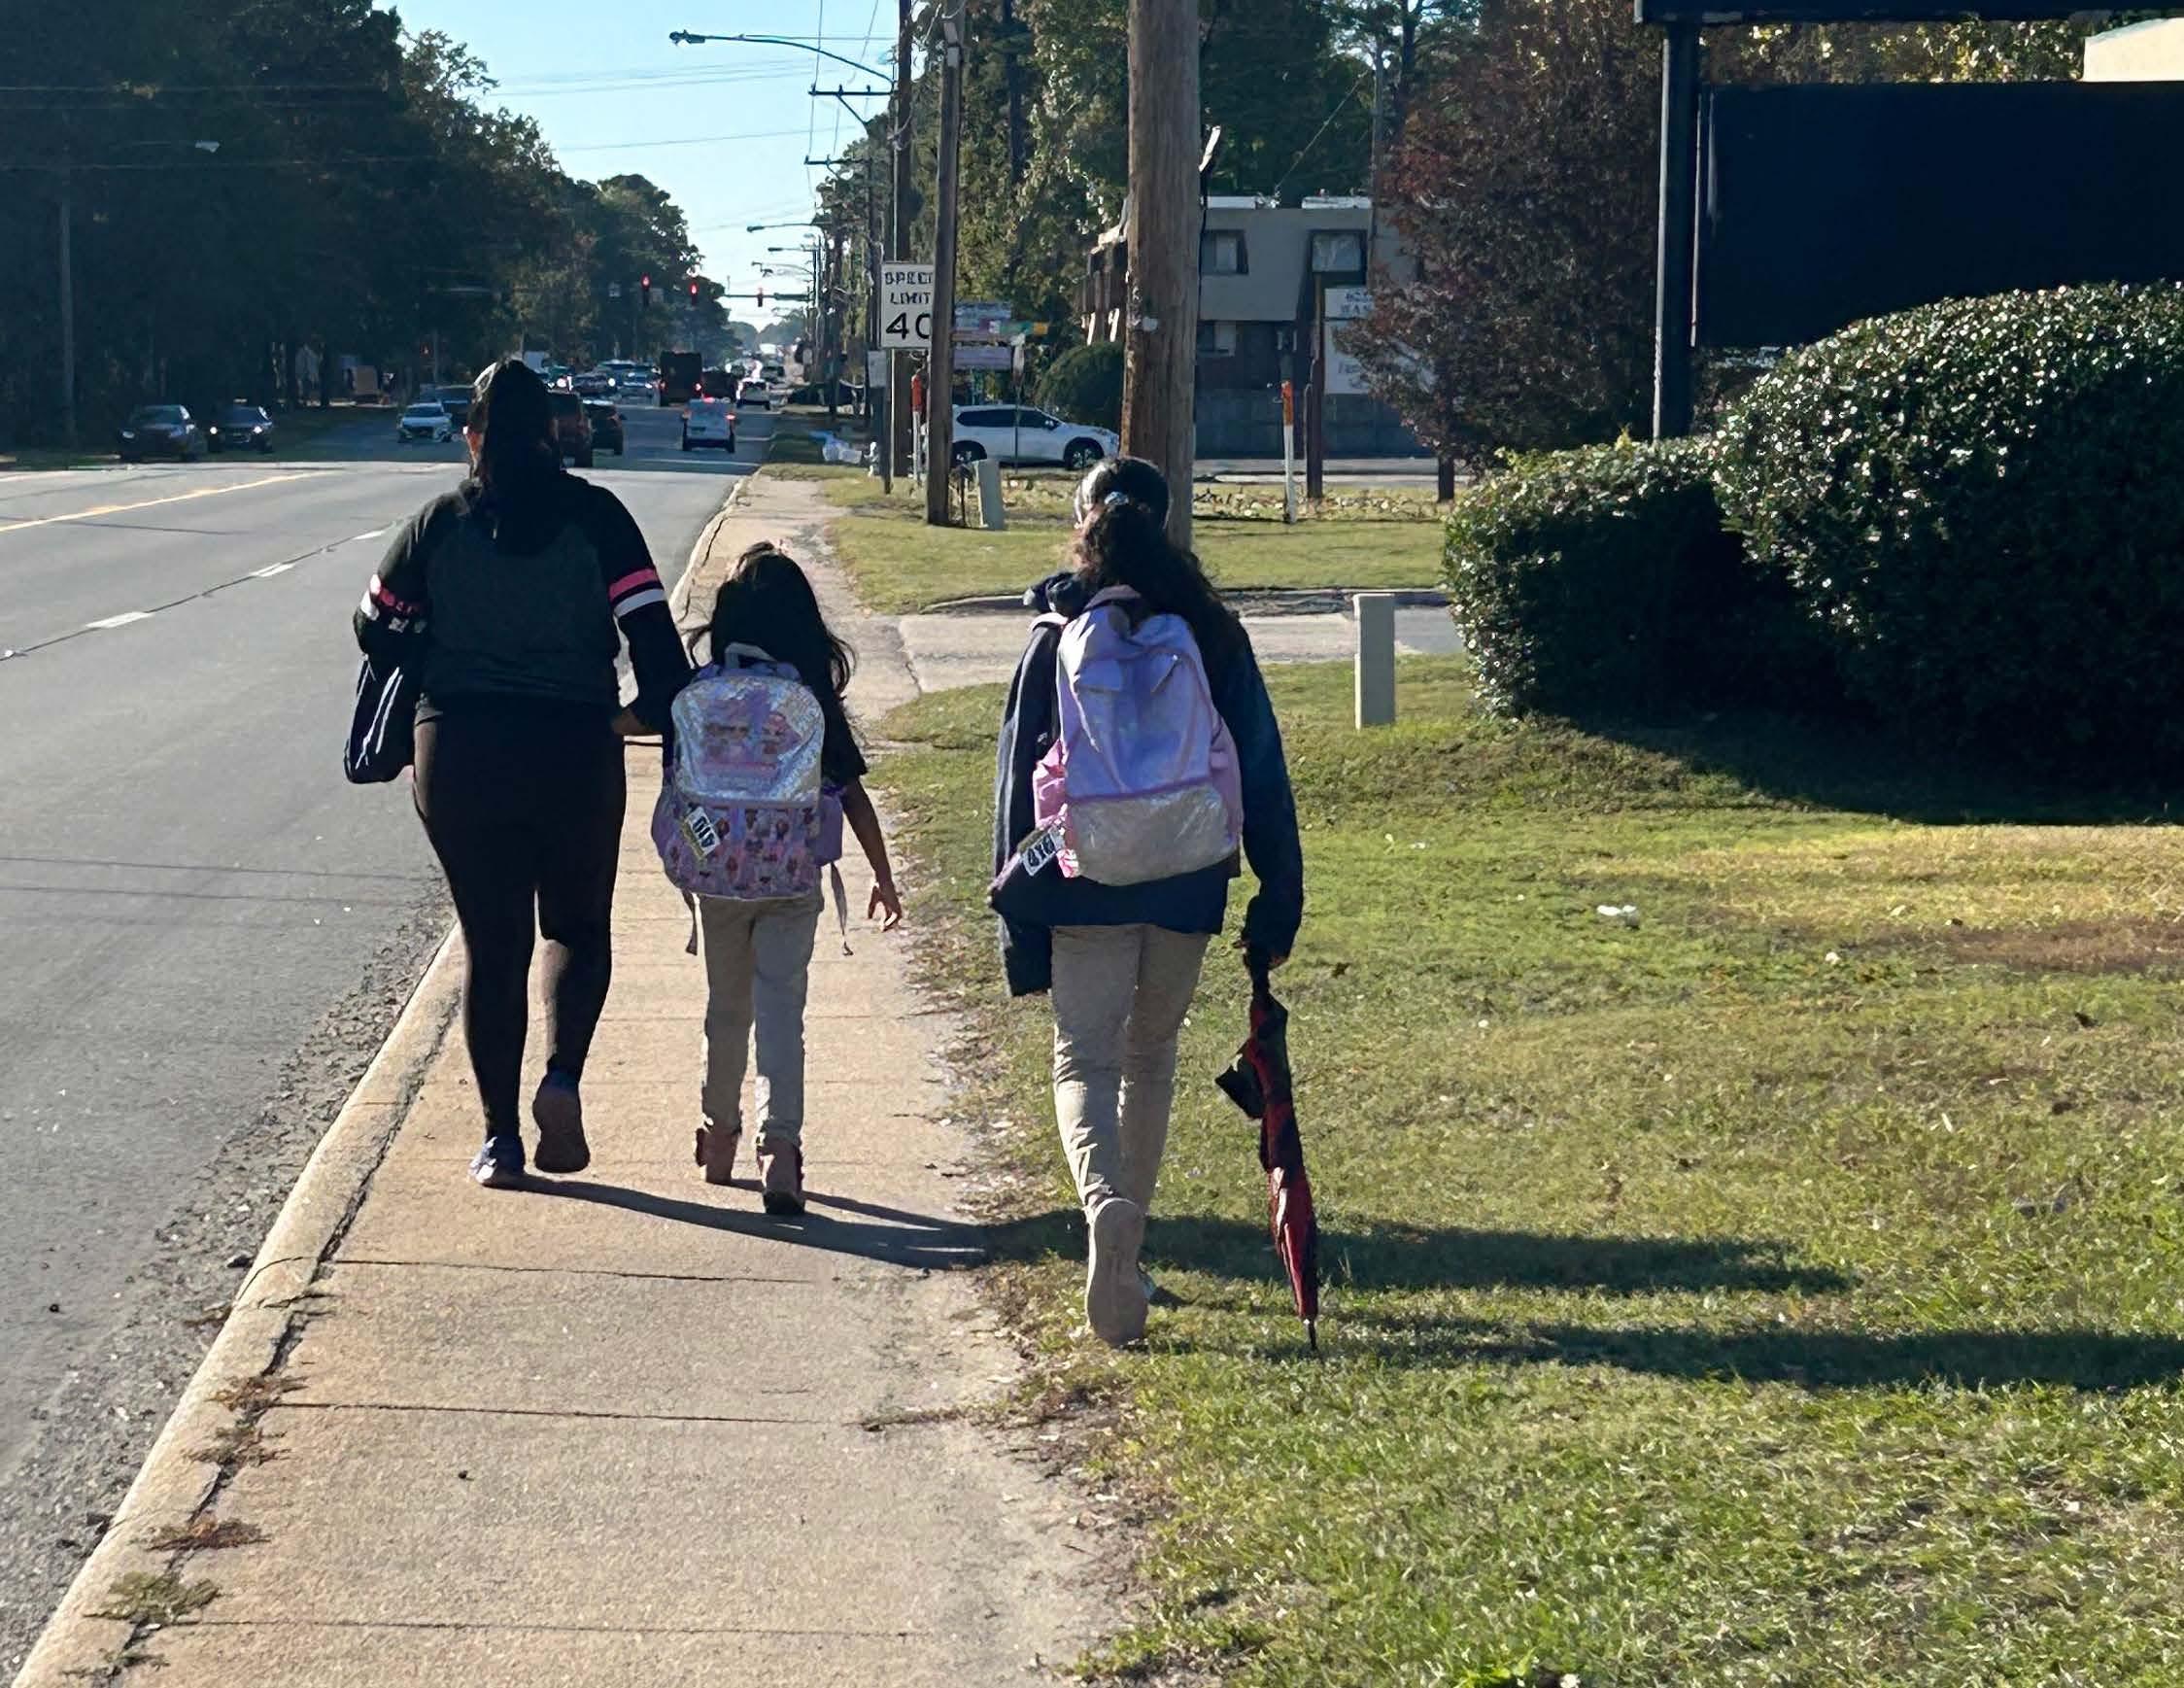


Our Goal: 40% reduction in fatal and serious injury crashes by 2040 40 by 40


Supplemental County Level Plan
November 2024


The information provided in this document is intended to be used for informational purposes only. No expressed or implied warranties are made by Metroplan, Kimley-Horn, Traffic Engineering Consultants, Crafton Tull, and Laneshift concerning the accuracy, completeness, reliability, and usability of this information. Further investigation such as field verification, site condition assessments, engineering analysis, and design are necessary prior to implementing any of the guidance contained herein.
This report was funded in part through grant(s) from the Federal Highway Administration and Federal Transit Administration, U.S. Department of Transportation. The views and opinions of the authors expressed herein do not necessarily state or reflect those of the U.S. Department of Transportation.
Notice of Nondiscrimination Metroplan complies with all civil rights provisions of the federal statutes and related authorities that prohibit discrimination in programs and activities receiving federal financial assistance. Therefore, Metroplan does not discriminate on the basis of race, sex, color, age, national origin, religion, disability, or income status, in admission or access to and treatment in Metroplan’s programs and activities, as well as Metroplan’s hiring or employment practices. Complaints of alleged discrimination and inquiries regarding Metroplan’s nondiscrimination policies may be addressed to Sydney Dozier, Title VI/ADA/504 Coordinator, 501 West Markham Street, Suite B, Little Rock, AR 72201, (501) 372-3300, or the following e-mail address: sdozier@metroplan.org
(Hearing and speech impaired may dial 711.)
This notice is available upon request from the Title VI/ADA/504 Coordinator in large print, audiotape or braille.
by the Metroplan Board of Directors
November 20, 2024
National Highway Traffic Safety Administration
Pedestrian Hybrid Beacon
Rectangular Rapid Flashing Beacon
Road Safety Audit
Safety Action Plan Advisory Committee
Strategic Highway Safety Plan
Safe Streets and Roads for All
Two Way Left Turn
US Department of Transportation
Vehicle Miles Traveled
Vulnerable Road User


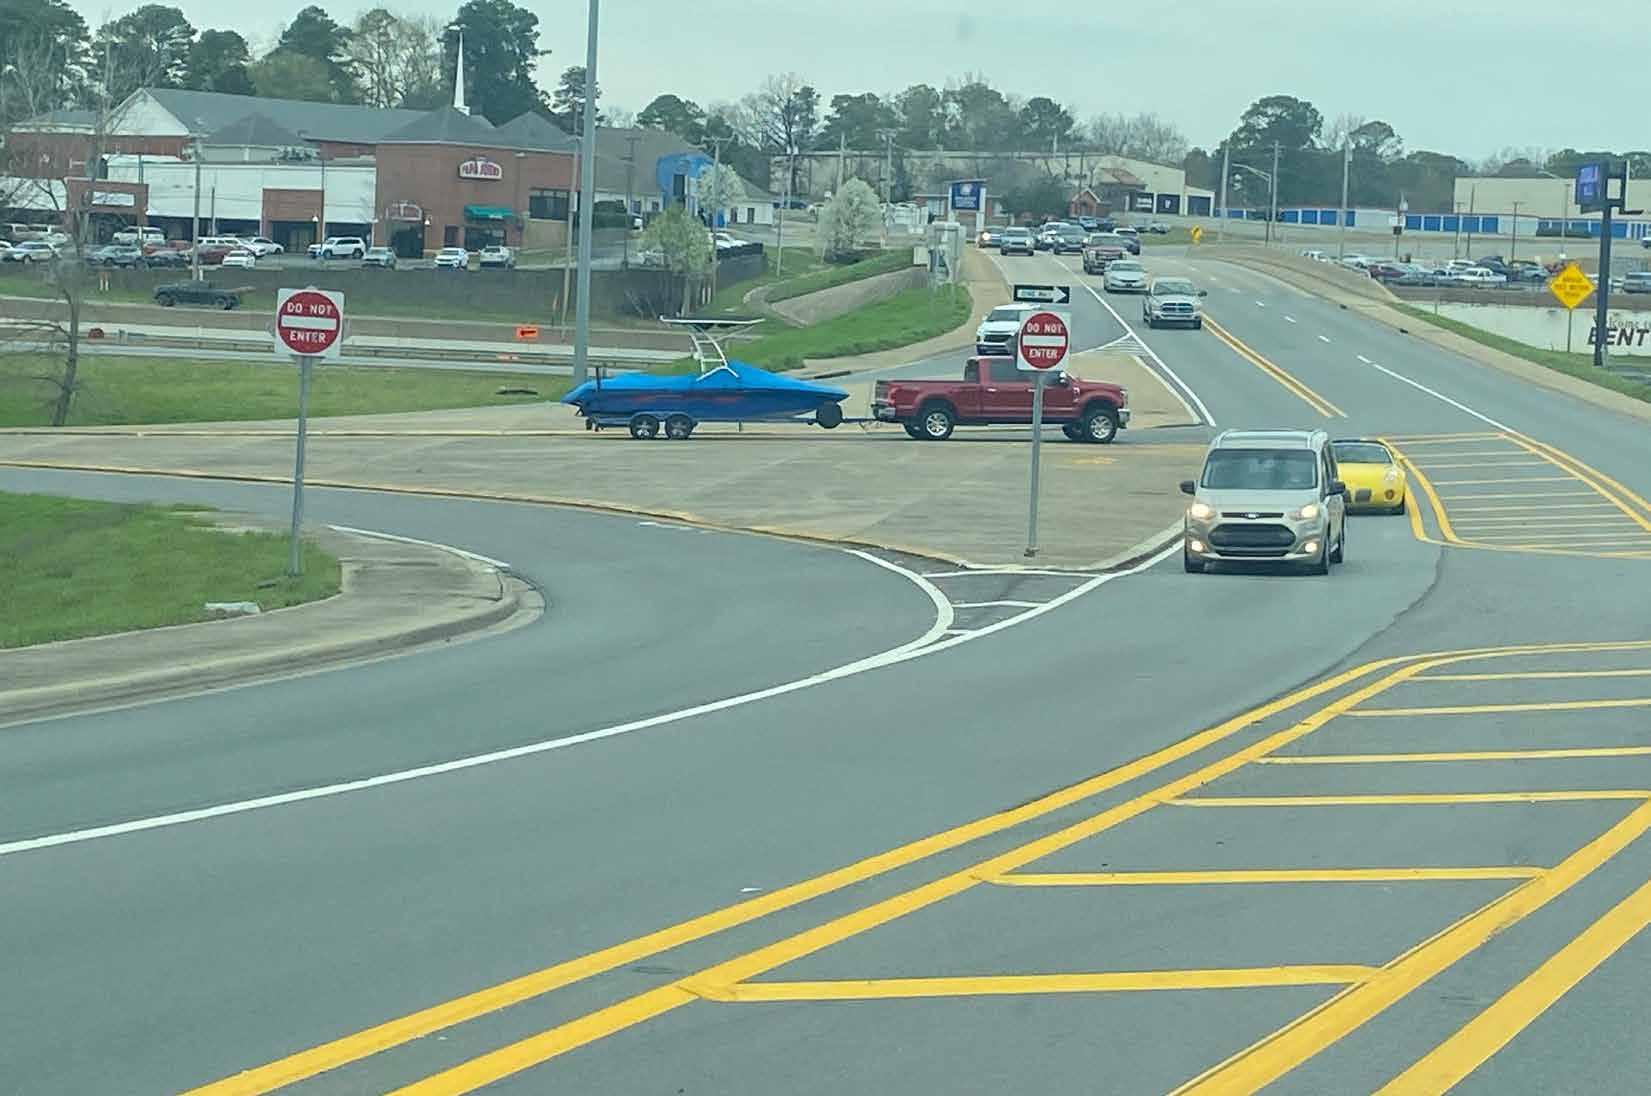
The purpose of the Saline County Supplemental County Level Plan is to address the specific safety needs and projects identified by local stakeholders within Saline County. The Supplemental County Level Plan expands on the Central Arkansas Safety Action Plan by focusing on additional segments and intersections located within Saline County’s High Injury Network (HIN) and High Injury Intersections that were not already addressed in Central Arkansas Safety Action Plan. Unlike the Central Arkansas Safety Action Plan, which considers the entire Central Arkansas Region as a whole and consists of Faulkner, Lonoke, Pulaski, and Saline Counties, this Supplemental County Level Plan focuses exclusively on Saline County (“the County”). Its main objectives are to identify projects and implement strategies that can help Saline County reduce fatal and serious injury crashes on its roadways, with the ultimate goal of eliminating these crashes all together. This is a crucial step towards achieving the same goal of eliminating fatal and serious injury crashes for the entire Central Arkansas Region. The Central Arkansas Safety Action Plan used a primarily data driven approach to develop regional projects. The Supplemental County Level Plan is also primarily data driven, but relies on input from local agencies to select segments and intersections as a key selection criteria in developing regional projects.
The Central Arkansas Safety Action Plan was created to determine which corridors have the greatest need for safety improvements and identify projects and strategies to help Central Arkansas reduce fatal and serious injuries on the Region’s roadways. The plan was developed by Metroplan and funded through a grant from the United States Department of Transportation (USDOT) Safe Streets and Roads for All (SS4A) Program. Central Arkansas leaders from the Metroplan Board of Directors committed to a goal of reducing fatal and serious injury crashes in Central Arkansas by 40 percent by the year 2040. The leaders set several interim goals starting with a baseline to be established in 2025 and incremental steps through the year 2050 to get an 80% reduction.
The Central Arkansas Safety Action Plan includes a large public engagement effort. Several engagement methods were used, including both online and in person public engagement, which consisted of an online survey and an interactive mapping activity, open houses, and booths at community events. The project team conducted stakeholder engagement, which included workshops with the Metroplan Board, meetings with the Safety Action Plan Advisory Committee (SAPAC), and stakeholder walk audits. The public and stakeholder engagement efforts were used to identify projects and implement strategies to increase safety in Central Arkansas.
The Central Arkansas Safety Action Plan includes a list of Regional High Injury Network (HIN) segments and High Injury Intersections. The threshold crash per mile value for segments included in the HIN was
two fatal and serious injury crashes per mile or greater from 2018 through 2022. High injury intersections had at least two fatal and serious injury crashes that occurred within 250 feet of the intersection from 2018 through 2022. These segments and intersections were scored and prioritized based on SS4A key objectives to assess the level of need for safety improvements, such as the number of fatal and serious injury crashes, underserved areas, and locations where vulnerable road users such as pedestrians and people on bikes are frequently present. The Central Arkansas Safety Action Plan identifies the 20 highest scoring Regional HIN and 20 highest scoring Regional High Injury Intersections. In addition to the top 20 regionwide segments and intersections, the five highest scoring state route HIN segments and the five highest scoring local roads in each county were identified. Similarity, the five highest scoring intersections of two state routes or a state route and local road, as well as the five highest scoring intersections of two local roads were identified, where applicable.
The Central Arkansas Safety Action Plan also includes a Safety Countermeasures Toolbox, made up of countermeasures recommended by the Federal Highway Administration (FHWA), National Highway Transportation Safety Administration (NHTSA), and Arkansas Department of Transportation (ARDOT) that have been historically proven to increase safety on roadways. Countermeasures include changes in roadway geometry, operations, signage, pavement markings, and access management. These countermeasures have a positive impact on reducing fatal and serious injury crashes and may be used on roadways not identified in the Saline County Supplemental Plan. The full list of recommended safety
countermeasures can be viewed in Section 5- Safety Countermeasures Toolbox of the Central Arkansas Safety Action Plan
Ten location-specific projects were developed for the regionwide top 20 segments and top 20 intersections. The ten location-specific projects incorporate the regionwide top 20 segments and top 20 intersections. All but one of the regional projects are in Pulaski County, with the remaining project in Faulkner County. Additional location-specific projects were developed for the highest scoring state route and highest scoring local road in Faulkner, Lonoke, and Saline Counties
These location-specific projects consist of combinations of safety improvements from the Safety Countermeasures Toolbox identified in the Central Arkansas Safety Action Plan that are expected to reduce crashes, particularly fatal and serious injury crashes and crashes involving vulnerable road users, within the vicinity of the project location. To view the regional projects that are in Saline County, please refer to the Central Arkansas Safety Action Plan
The Central Arkansas Safety Action Plan also includes a list of systemic improvements, developed based on the regional crash analysis and roadway network review. The systemic improvements consist of countermeasures that are implemented based on high-risk roadway features correlated with a particular crash type. Proposed policies to support recommended systemic improvements are included to provide guidance on incorporating safety countermeasures in future roadway and transportation projects


The main objective of this plan is to identify projects and implement strategies that can help Saline County reduce fatal and serious injury crashes on its roadways, with the ultimate goal of eliminating these crashes all together.
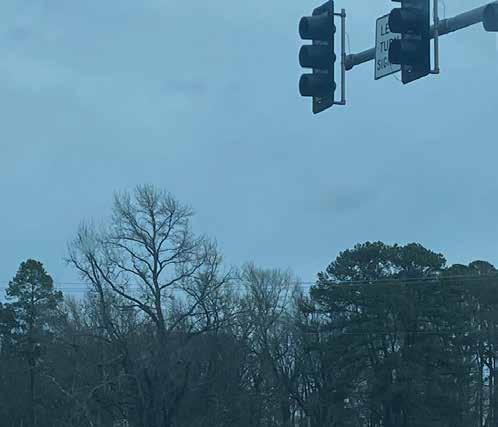
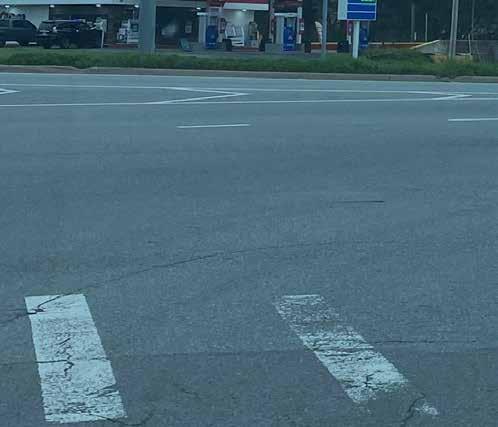
by
Our Goal:
reduction in fatal and serious injury crashes by 2040
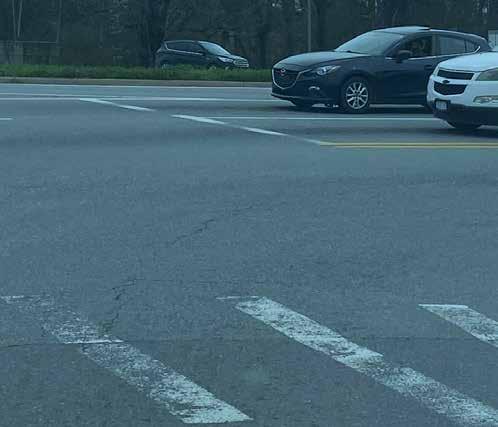

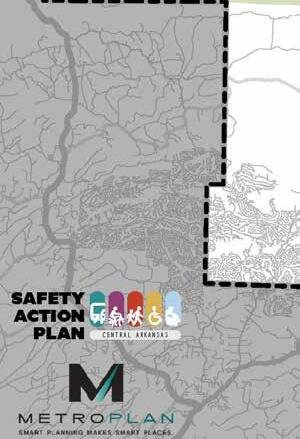

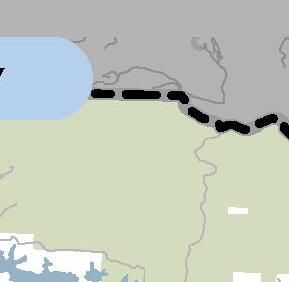

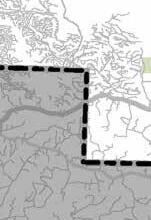
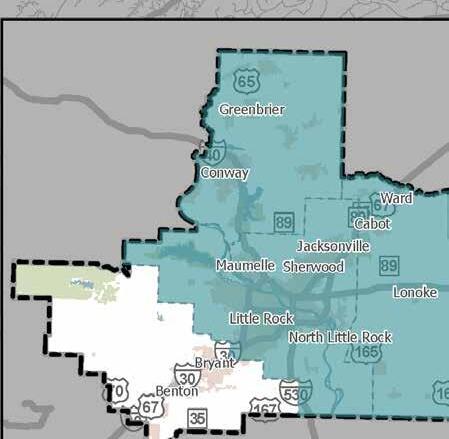


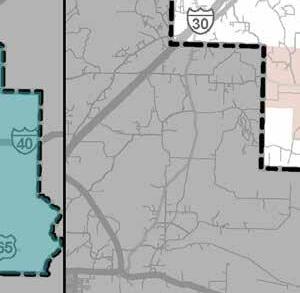


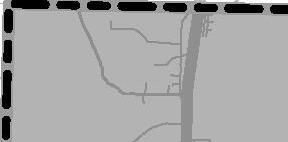
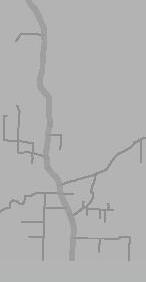

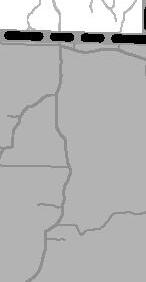


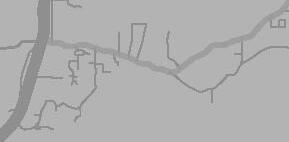
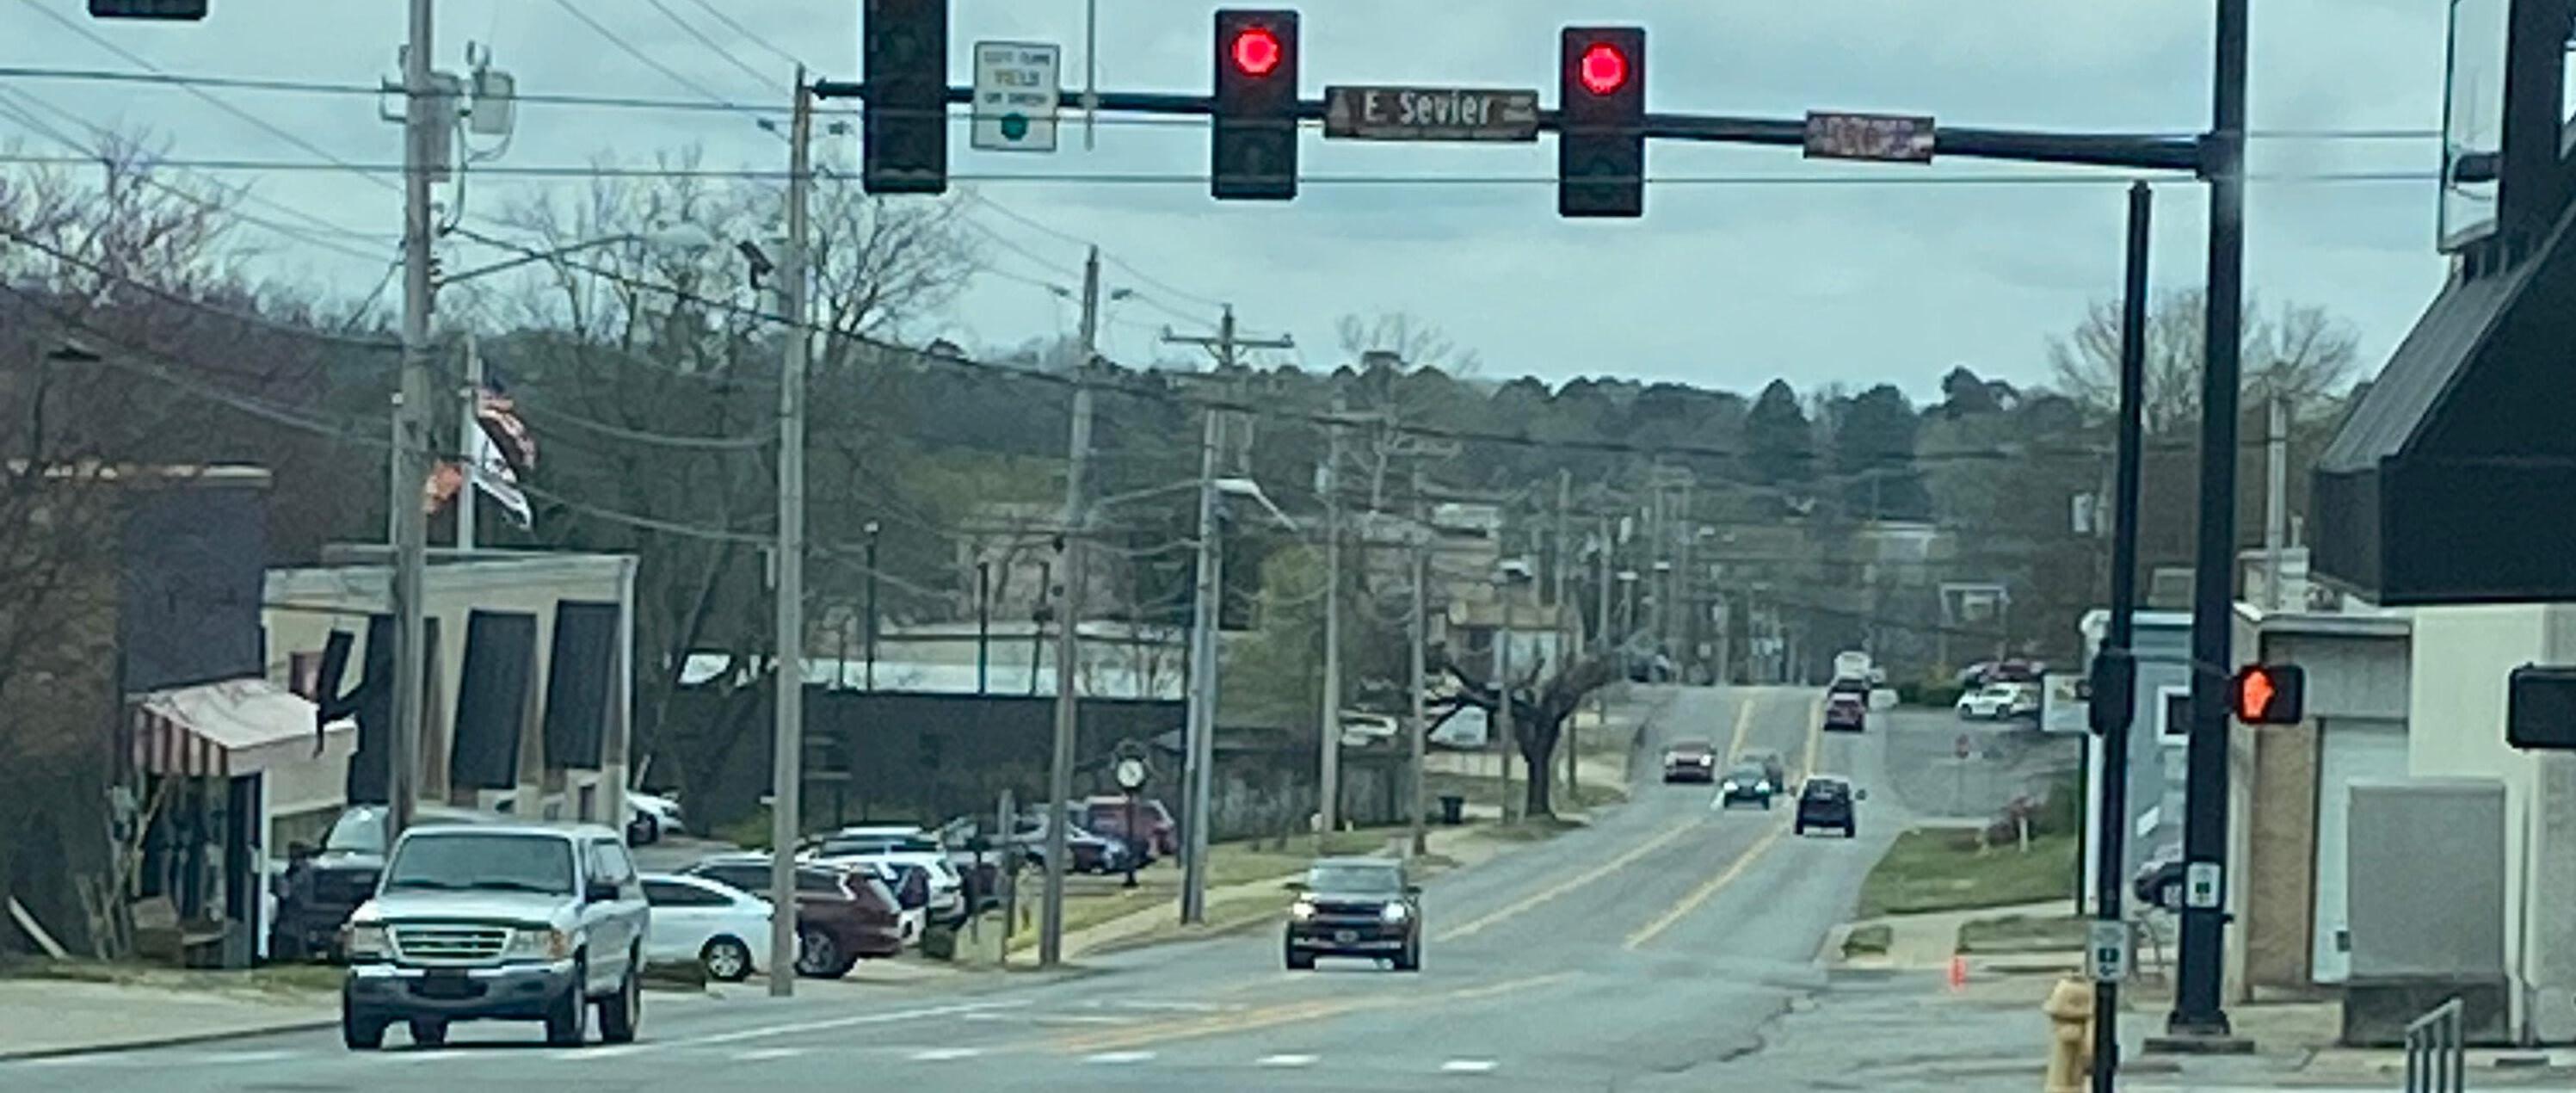
Saline County, shown in Figure 1, is located in the Central Arkansas Region and has an approximate population of 130,000 as of July 2023, according to the US Census Bureau. This population accounts for roughly 17 percent of the total population in the Central Arkansas Region. Saline County encompasses approximately one fourth of the Central Arkansas Region and includes the Cities of Alexander, Bauxite, Benton, Bryant, Haskell, and Shannon Hills. Lane miles within Saline County make up 24 percent of the total lane miles within the Central Arkansas Region.
Saline County is located in the Central Arkansas Region and has an approximate population of 130,000 as of July 2023.
From 2018 to 2022, there were over 14,000 reported crashes within Saline County, representing nearly 12 percent of all crashes in the Central Arkansas Region.
A crash analysis was conducted to identify patterns and trends in crash types and common factors contributing to fatal and serious injury crashes within Saline County.
From 2018 to 2022, there were over 14,000 reported crashes within Saline County, representing nearly 12 percent of all crashes in the Central Arkansas Region. From 2018 to 2021, there was a continuous increase in fatal and serious injury crashes. However, in 2022, there was a decrease in both fatal and serious injuries.


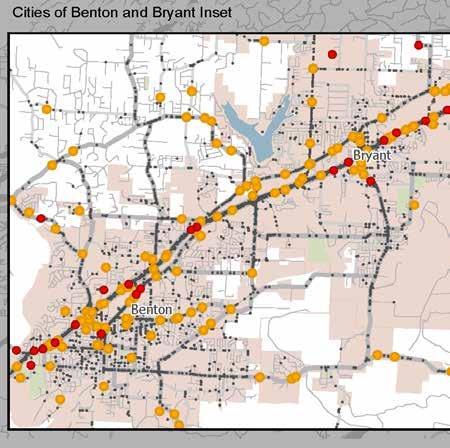


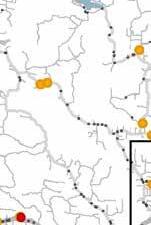
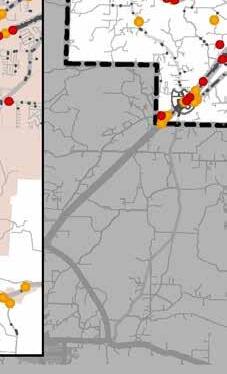
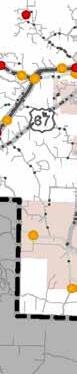
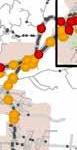
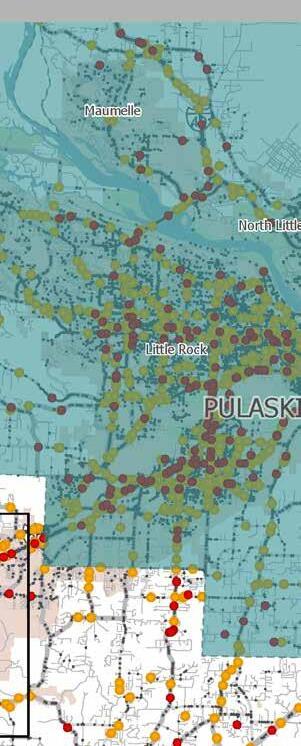

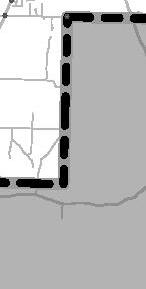
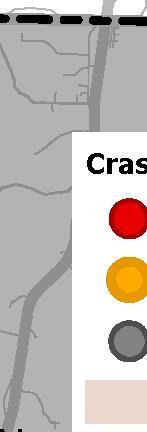
The Arkansas Strategic Highway Safety Plan (SHSP) identifies focus areas of safety for the State and provides a framework for reducing fatal and serious injury crashes on all public roads. Projects funded by the Highway Safety Improvement Program (HSIP) must reflect the SHSP at a strategic level. The focus areas are crash types and factors that are prominent throughout the State and often lead to fatal and serious injury crashes. Crash data from 2018 through 2022 was filtered to analyze crashes within Saline County related to the SHSP focus areas. A summary of the crash data over the last five years for crashes within Saline County for each of the SHSP focus areas is provided in Table 1.
During the review of Saline County’s highest SHSP focus areas for fatal and serious injury
crashes, it was found that distracted driving, intersection-related, and motorcycle crashes were the top three SHSP focus areas These SHSP focus areas also rank among the top five focus areas for the Central Arkansas Region. From 2018 to 2022, there has been a consistent increasing trend in distracted driving, intersection-related, and motorcycle crashes within Saline County, with a spike in 2021.
The trends for the top three SHSP focus areas in Saline County over the past five years are a cause for concern, as all of them show an increasing trend This is not in line with the regional goal of reducing fatal and serious injury crashes by 40 percent by 2040 and ultimately reaching zero It is important for Saline County to continue to prioritize safety and invest in targeted and systemic countermeasures that can address these SHSP focus areas.
A Regional High Injury Network (HIN) was developed as part of the Central Arkansas Safety Action Plan. The HIN is made up of one-mile segments with a high frequency of fatal and serious injury crashes. The HIN is a way to identify parts of a roadway network with higher rates of fatal and serious injury crashes. The Central Arkansas HIN consists of about 19 percent of the functionally classed roadway miles within the Central Arkansas Region that are not interstates, freeways, or expressways. These roadways account for approximately 77 percent of fatal and serious injury crashes that did not occur on interstates, freeways, or expressways from 2018 through 2022. Saline County contains 61 Regional HIN segments, accounting for approximately 11 percent of the Regional HIN, shown in Figure 3. To reduce fatal and serious injury crashes in Saline County, it is important to prioritize targeted countermeasures on the HIN segments, which have the highest number of fatal and serious injury crashes.
A Regional High Injury Intersection set was also established as part of the Central Arkansas Safety Action Plan, Figure 4
shows high injury intersections within Saline County. Saline County contains 10 intersections that make up approximately 7 percent of the Regional High Injury Intersections.
The USDOT Equitable Transportation Communities (ETC) national census tract data helps identify historical underinvestment in disadvantaged communities. This information shows the cumulative burden these communities experience in various areas. The ETC Explorer uses 2020 census tracts and data to analyze five components, each of which have numerous factors that make up their score: Transportation Insecurity, Climate and Disaster Risk Burden, Health Vulnerability, and Social Vulnerability. The overlay of disadvantaged census tracts, shown in Figure 3 and Figure 4, revealed that almost 20 percent of HIN segments and almost 50 percent of HII within Saline County fall within a disadvantaged community. Equity is an important component in funding for projects through the USDOT SS4A Implementation Grant Program. Location of a segment or intersection within a disadvantaged census tract is used in this study as part of the scoring to rank segments and intersections when prioritizing projects.
A dashboard was created as a component of the Central Arkansas Safety Action Plan. The dashboard includes crash data statistics, the interactive Regional High Injury Network, and recommended projects for the Region.
The interactive safety dashboard can be found here: Central Arkansas Safety Dashboard


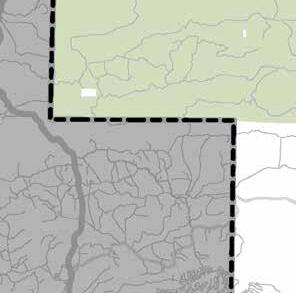
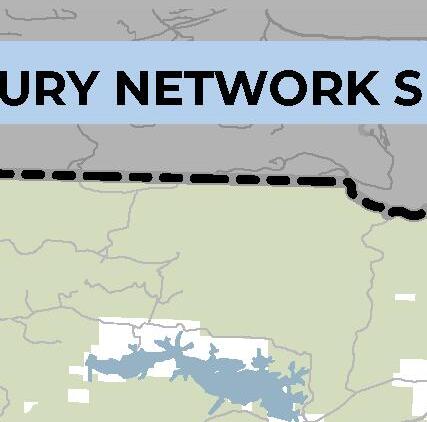


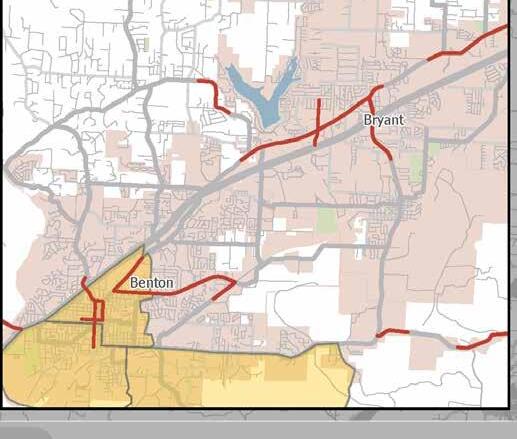
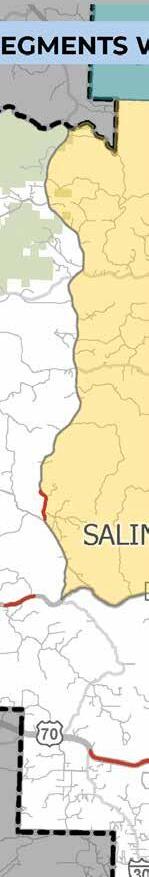


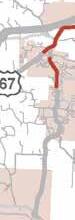
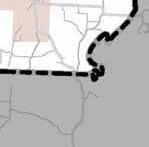
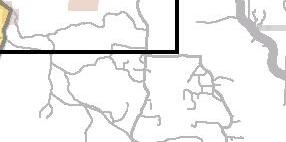


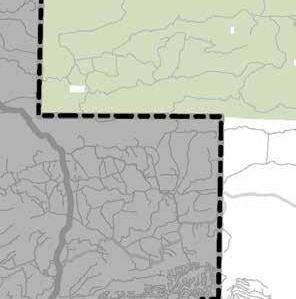

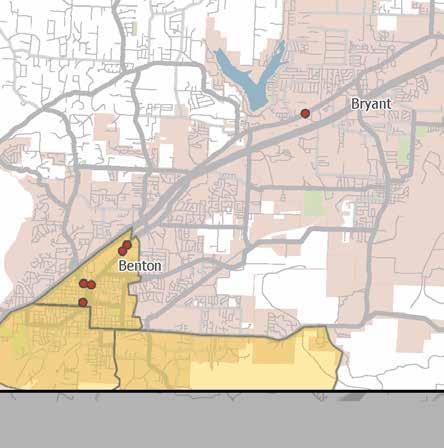
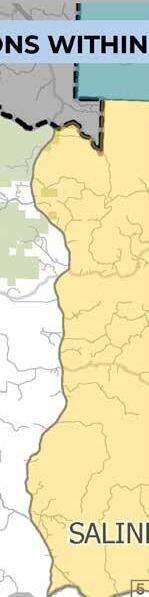


Safety for vulnerable road users, including pedestrians and bicyclists, is another important component in funding for projects through the USDOT SS4A Implementation Grant Program.
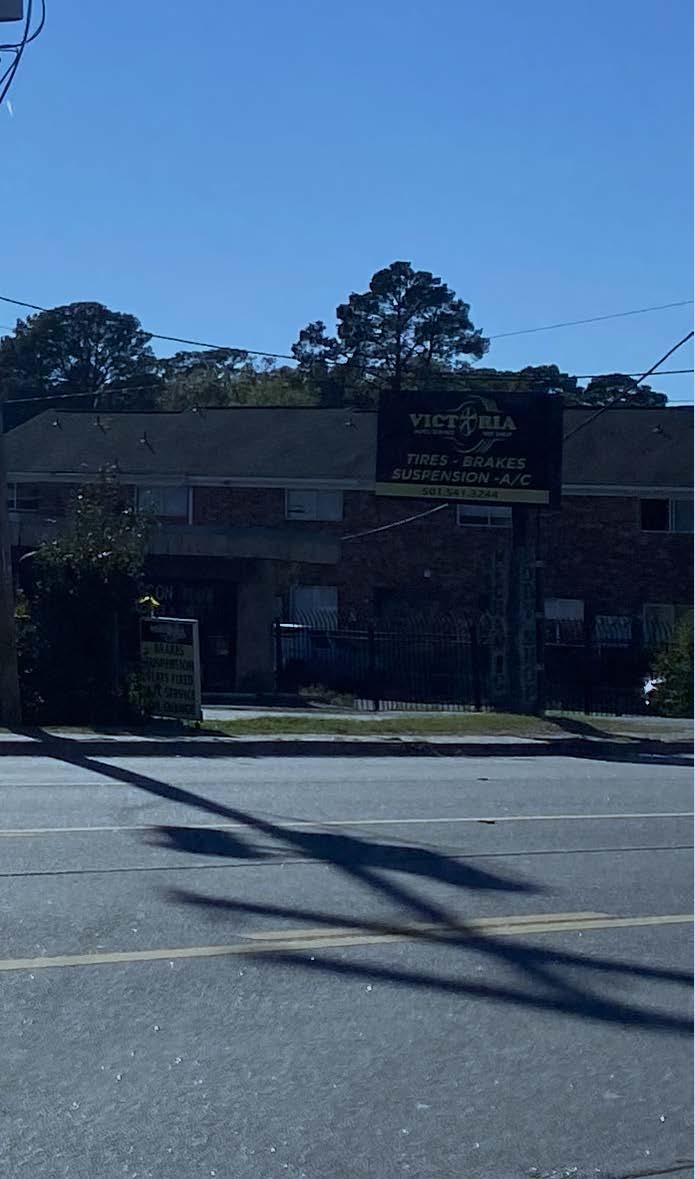
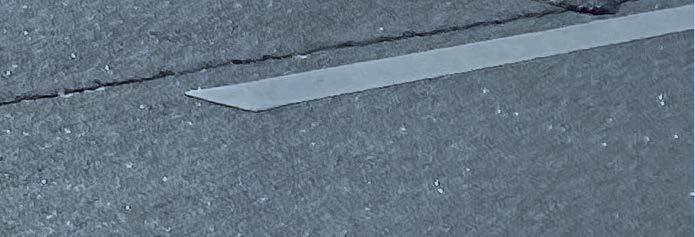
To account for crashes involving nonmotorized modes of transportation, fatal and serious injury crashes that involved a pedestrian or a bicycle within Saline County from 2018 through 2022 were overlayed onto the Regional HIN, as shown in Figure 5 and Figure 6. Of the 61 HIN segments within Saline County, 11 segments contained a crash that involved a pedestrian and 4 of them contained a crash that involved a bicyclist. Please note that the lines shown on the HIN maps may represent multiple one-mile segments combined into one line, as pedestrian or bicycle crashes may have occurred along multiple segments of a corridor. Safety for vulnerable road users, including pedestrians and bicyclists, is another important component in funding for projects through the USDOT SS4A Implementation Grant Program. Crashes on a segment or intersection that involved vulnerable road users is used in this study as part of the scoring to rank segments and intersections when prioritizing projects.


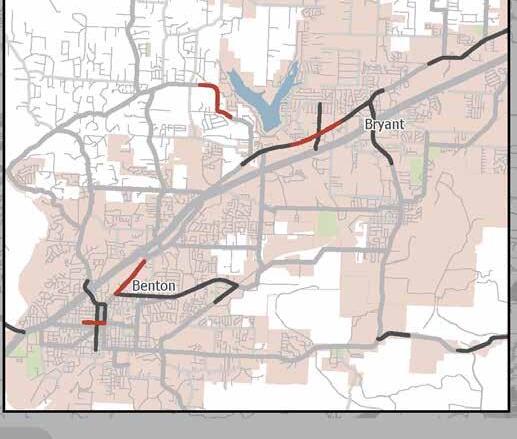
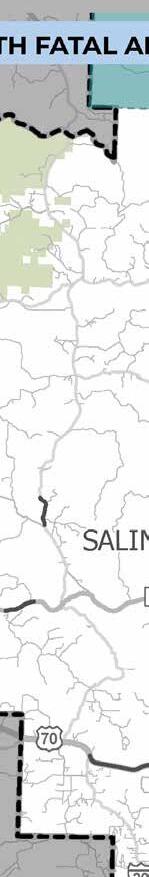


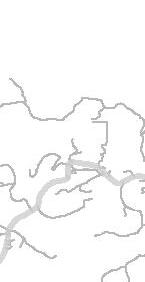
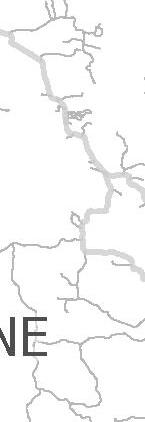

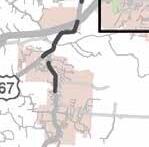
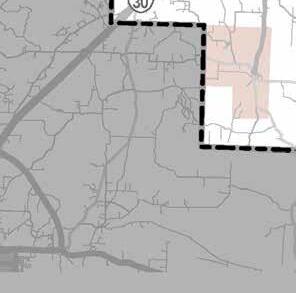
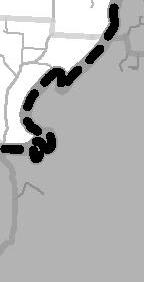
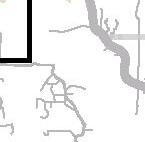

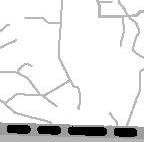


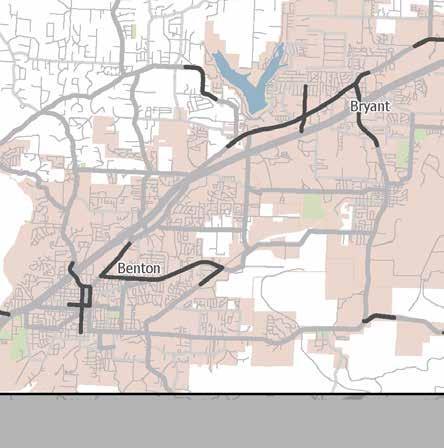


As part of the Central Arkansas Safety Action Plan, high injury segments and intersections were ranked through a needs score. The needs score included the corridor or intersections crash history, equity data, location characteristics, and stakeholder input. Additional detail about the scoring criteria can be found in the Central Arkansas Safety Action Plan.
Table 2 includes the top HIN segment in each city within Saline County that had a segment on the HIN. Table 3 includes the top High Injury Intersection in each city within Saline County that had an intersection considered to be a High Injury Intersection. The top segment or intersection in unincorporated Saline County is also included in the tables. Segments or intersections that were included in the Central Arkansas Safety Action Plan are identified in the “Top 20 Regional Plan” column. Additional information on these segments and intersections can be found in that plan.
Location-specific projects were developed for the Saline County Supplemental County Level Plan in order to address safety improvements within specific areas. These projects were identified by considering the highest scoring HIN segment within each city in Saline County and the highest scoring HIN segment in unincorporated Saline County. However, if the County or a city expressed the need for a different segment within their jurisdiction to be prioritized, that location was selected based on the agency’s input. The projects listed in Table 4 were recognized by stakeholders as having the greatest need for safety improvements within their respective jurisdictions.
For each location-specific project identified in Table 4 that is not already included in the Central Arkansas Safety Action Plan, additional detail has been included on the subsequent pages. Detail includes a crash map of the segment, count of crashes on the segments from 2018 to 2022, and suggested countermeasures. As noted earlier, the full list of countermeasures can be viewed in Section 5 - Safety Countermeasures Toolbox of the Central Arkansas Safety Action Plan.
*Additional detail and maps for these location specific projects can be found in the Central Arkansas Safety Action Plan.
Segment: Raymar Rd to Shobe Rd
Jurisdiction: City of Bryant
Segment: Whiteway Dr to Private Logging Rd
Jurisdiction: Saline County
Segment: Harp Dr to Tom Rd
Jurisdiction: City of Bauxite
Longitudinal Rumble Strips


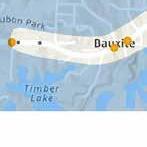

Segment: Rose Ln to Harmony Village Dr
Jurisdiction: City of Haskell
Segment: County Line Rd to Loganberry Dr
Jurisdiction: City of Shannon Hills
Segment: Military Rd & SH 5
Jurisdiction: City of Benton Countermeasure Vehicular Countermeasures
Add/Improve Pavement Markings
Safety Lighting
Add Advance Warning Signage
Retroreflective Backplates
Enhanced Curve Delineation
Conduct Speed Study
Vehicular Countermeasures
Add/Improve Pavement Markings
Safety Lighting
Add Advance Warning Signage
Add Shoulders
High Visibility Crosswalk Pavement Markings
Sidewalk Buffer
Vehicular Countermeasures
Conduct Signal Warrant
Add/Improve Pavement Markings
Safety Lighting
Add Advance Warning Signage


Our Goal: 40% reduction in fatal and serious injury crashes by 2040 40 by 40