Mercury Investor Day
Palmerston North – 15 March 2023

Palmerston North – 15 March 2023
> Industrial load reductions weighing on New Zealand demand growth; green shoots appearing (new data centres under construction, energy conversion to renewables).
> Spot prices volatile reflecting higher thermal fuel costs and hydro conditions.
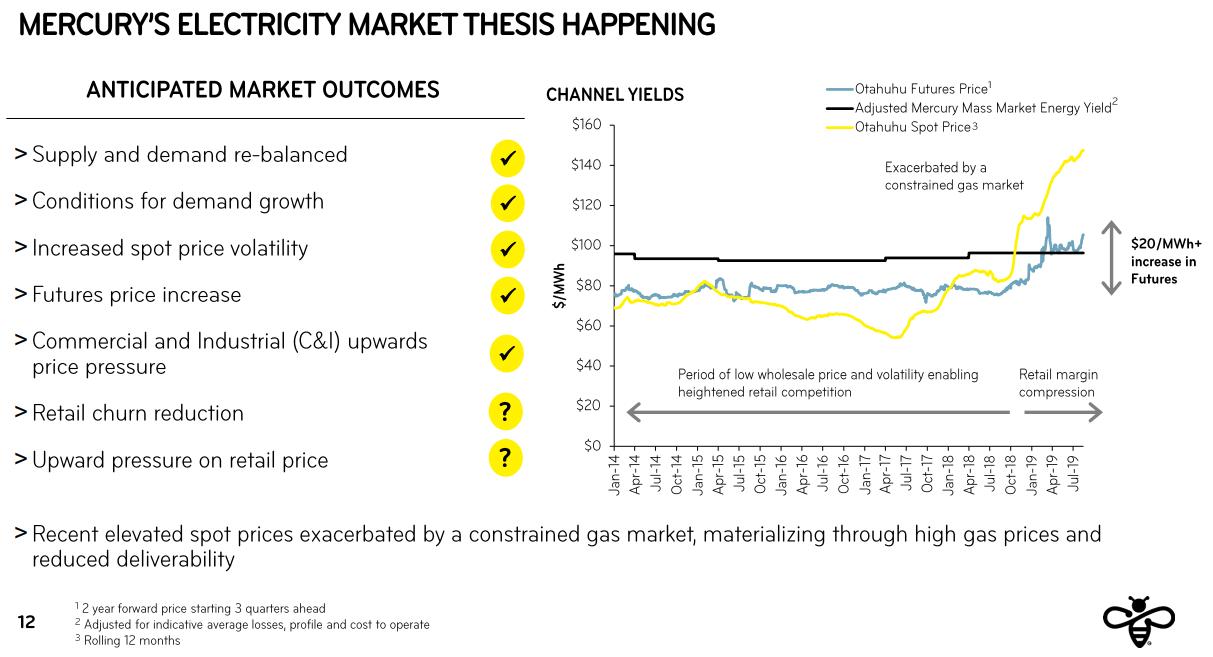
> Electricity futures prices reflect higher thermal running costs (fuel and carbon).
> Commercial & Industrial energy yields lifting when contracts mature in-line with forward curve. Contract maturities lengthening. Longer term PPAs more common.
> Retail churn lower reflecting tight market conditions and a focus on loyalty.
> Retail yields lifting but lower than inflation. Customer care a key focus.
 Graphic from 2019 Investor Day presentation
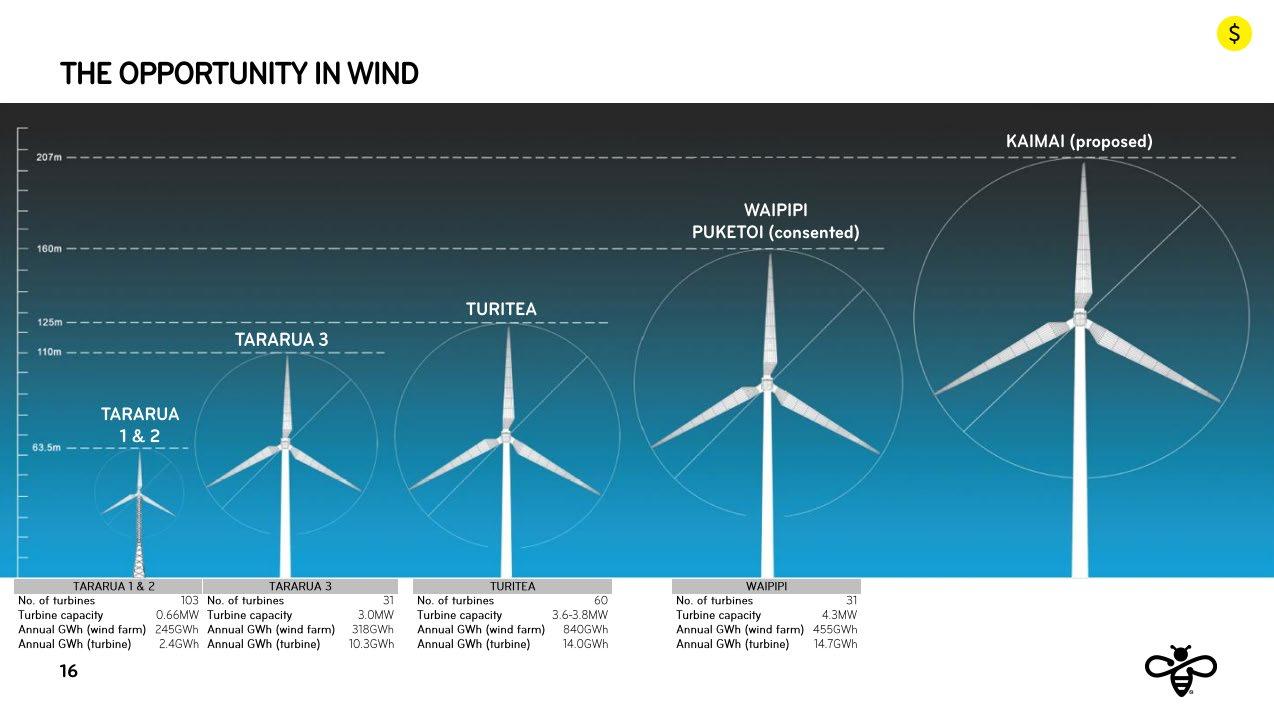
> The 2019 opportunity in wind prophetic?
> Tilt Renewables transaction in 2021 culminates in Mercury acquiring Tilt’s New Zealand operations. Tararua 1, 2 and 3, Mahinerangi and Waipipi wind farms bought.
> Turitea North complete, Turitea South commissioning in April 2023.
> Kaiwera Downs stage 1 under construction, expected to be operational in October 2023 lifting Mercury’s annualised wind production to 2,100GWh.
> Progressing Kaiwaikawe, Kaiwera Downs stage 2 and Puketoi wind farms (consents extended) through detailed investigations, constructability to business case within 618 months.
Graphic from 2019 Investor Day presentation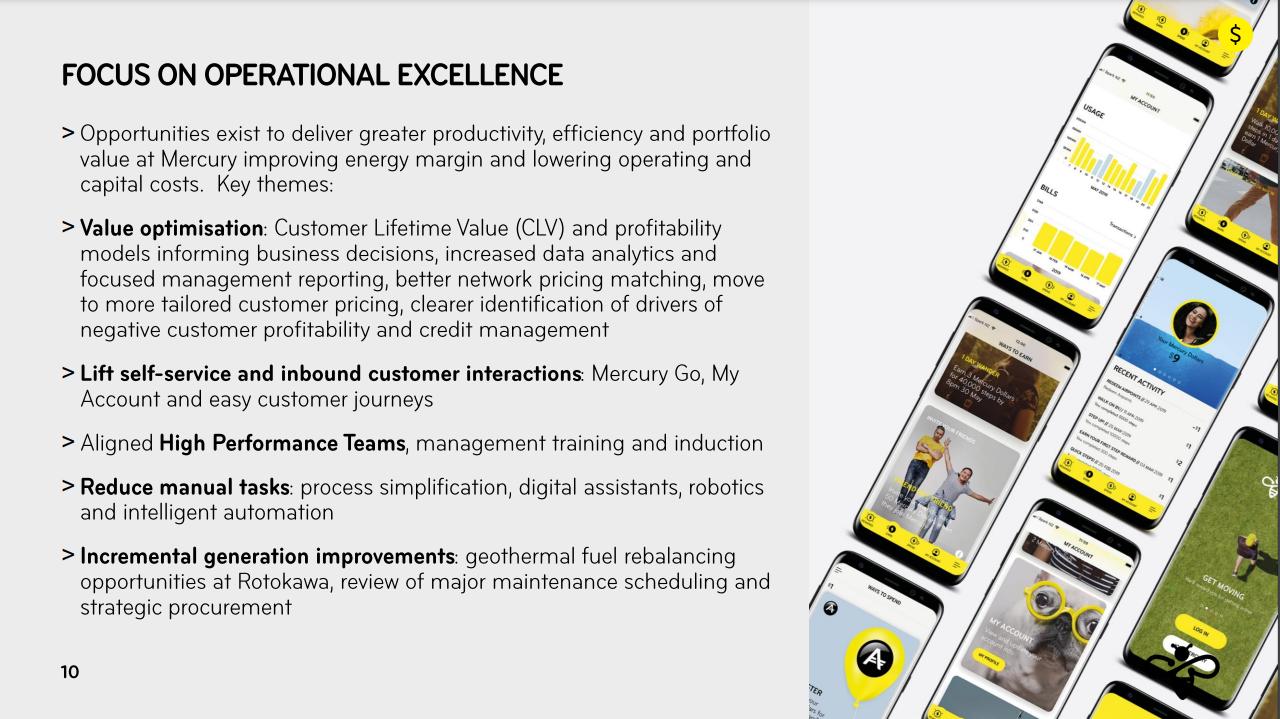
> A focus on operational excellence evolves into the Thrive programme, delivering $47m in FY22 against an improvement target of $30m. We are working to make ‘thriving’ an ongoing mindset and move towards a more adaptive operating model and adopting new ways of working.
> Mercury acquires the Trustpower mass market retail business in May 2022. Integration of retail businesses well advanced. Synergies of $35m targeted following integration.
Graphic from 2019 Investor Day presentation
Emerging from COVID disruptions – ‘the energy crisis’, digitalisation and workforce changes create a dynamic environment


The energy transition
> The global energy crisis has resulted in high prices and reactive policy changes.

> Security of supply has been tested, and governments have stepped in to maintain affordability as energy bills peak.
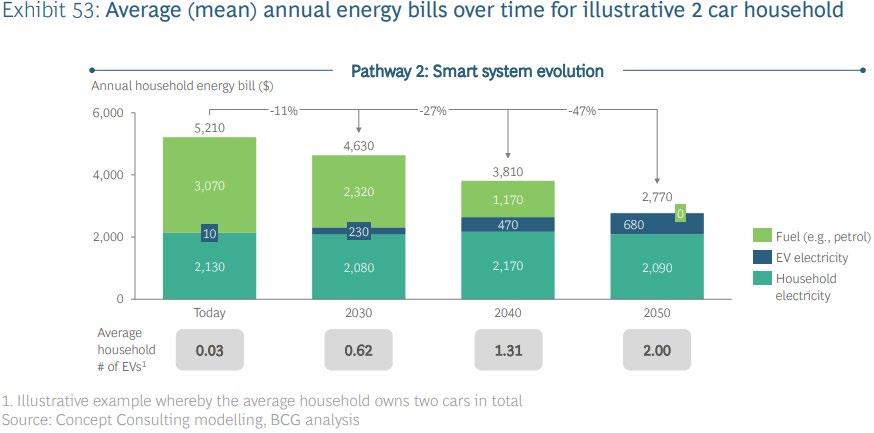
Annual UK energy bill for an ‘average’ household
£1042 Aug 2020
The digital transformation
> We are in the midst of a rapid digitalisation of society. We have seen advances in artificial intelligence and automation and exponential growth in the number IoT devices and data use.
£3549

Oct 2022

The future of work
> The workforce is changing – the population is aging, there is a growing number of employees working remotely, diversity is increasing, and turnover has jumped post-covid.
> As artificial intelligence and automation are more readily adopted, the type of work that people do will also change.
Estimated
25 billion IoT devices generating 80ZB of data by 2025
U.S. annual voluntary turnover expected to be 20% higher than pre-covid
The transitions are showing up in regulatory changes, often with interconnections that require careful management
Low carbon transition
Electricity sector changes
Telco sector changes
Emissions Reduction Plan & carbon budgets
Government Energy Strategy
Gas Transition Plan
Emissions trading scheme reviews
Resource management reform
Market transition
Retail Service Quality work programme
System resilience
Fibre pricing regulation
Flexibility market
Increase in IoT
Transport policies
Funding for industrial conversions
NZ Battery Project
Transmission & grid pricing
methodologies
Renewable energy zones
Workers will need to be adaptive, resilient, and open to change and continual learning.
= impacts electricity demand
= impacts both electricity demand and renewable generation
= impacts renewable generation
= impacts telco
> Additional ~400GWh generation volume since October 2022, mostly attributable to hydro generation (circa $45m).
> Reduction in actual and forward prices impacts on long generation (circa $15m).
> Increased hydro generation and lower prices results in a mismatch between the forecast GWAP of covered generation, and FPVV purchases and derivative settlements (circa $20m).
Lower FY23 hydro GWAP forecast (~$28/MWh) driven by combination of:
• decrease in actual / forecast prices relative to what was forecast in October
• additional hydro generation during lower priced periods


PROVIDING RESILIENT ENERGY GENERATION & ENERGY CAPACITY
BETTER TOGETHER PROTECT & ENHANCE VALUE

Leveraging location and diversity to manage risk and grow performance
Investment programme to sustain long-term performance
OPTIMISE PERFORMANCE

Incremental improvements & long term plan
MANAGE RISK
Understand risk and develop resilience of assets


PROVIDING RESILIENT ENERGY GENERATION & ENERGY CAPACITY
BETTER TOGETHER
Leveraging location and diversity to manage risk and grow performance

Safety Culture
> Safety 2.0 - “learning from” incidents – not just preventing.
Critical Risk Management
> Focus on the risks that can lead to fatality e.g. driving, height, electrical, dropped objects.
Process Safety team


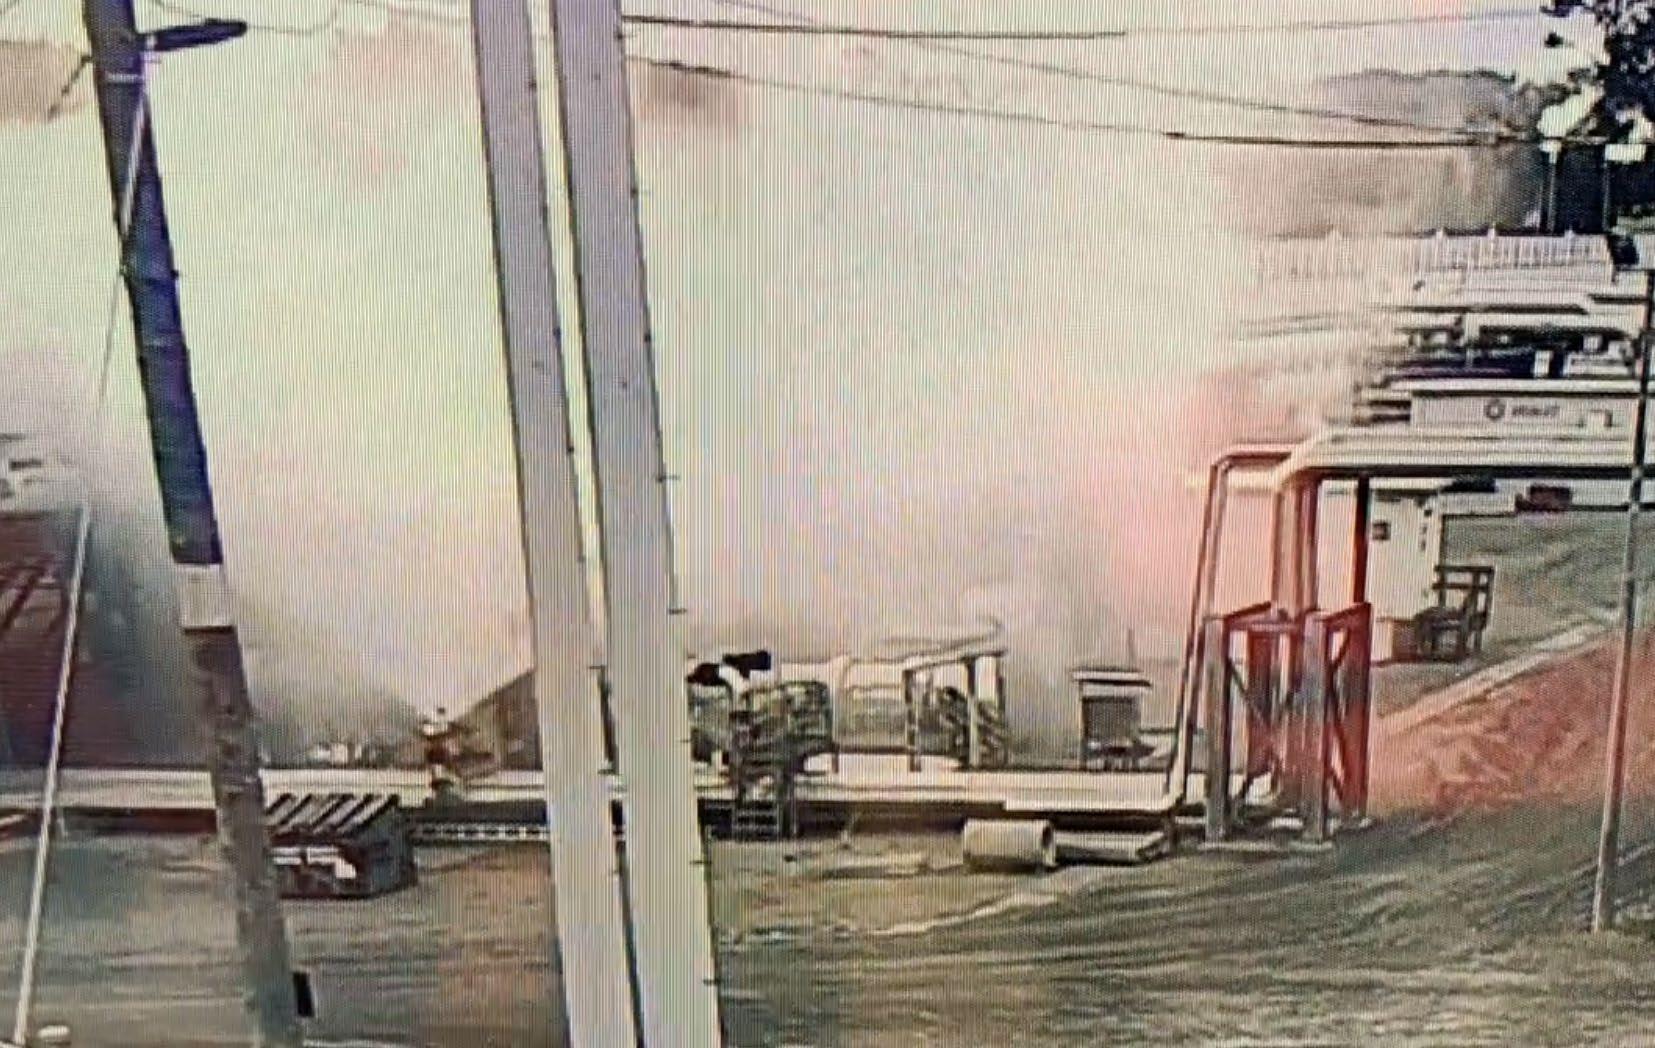
> WorkSafe prosecution from July 2021 Rotokawa loss of containment of steam.
> Process Safety team formed with seven engineers (many from oil and gas) to lift approach and risk management.
PROVIDING RESILIENT ENERGY GENERATION & ENERGY CAPACITY
PROTECT & ENHANCE VALUE
Investment programme to sustain long term performance


Karāpiro rehabilitation project is an $80m investment in the power station originally commissioned in 1946. The project includes replacement for all three generating units including generators, turbines and governors.
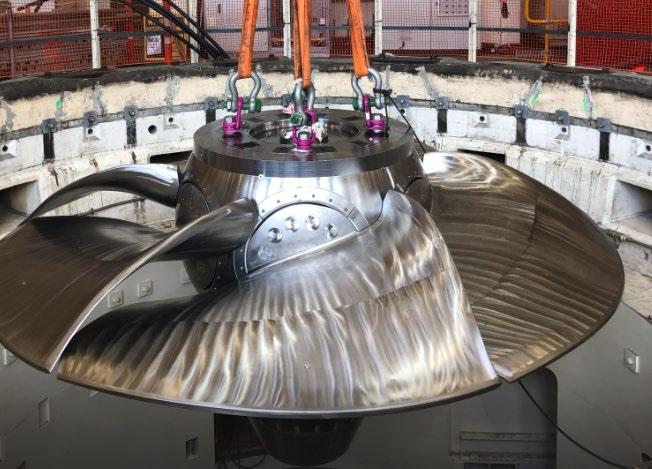
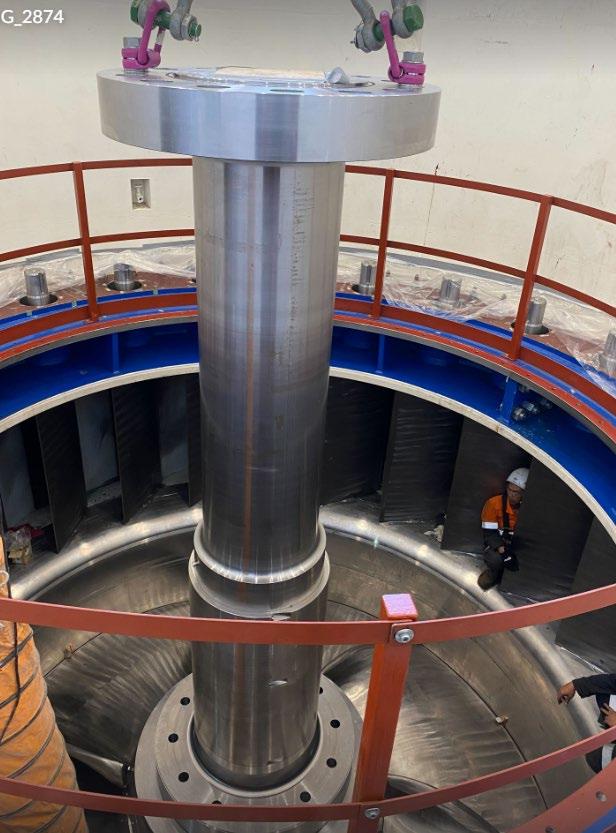
The project protects value by extending asset life by 50 years and enhances value by providing an additional 5MW per unit, increasing capacity from 96MW to 112.5MW (32GWh/year).
The main generating unit scope is being delivered by Andritz Hydro. The project includes replacement of intake gates.
Commencing eight “make up” wells and one well repair in drilling campaign FY23-FY25.
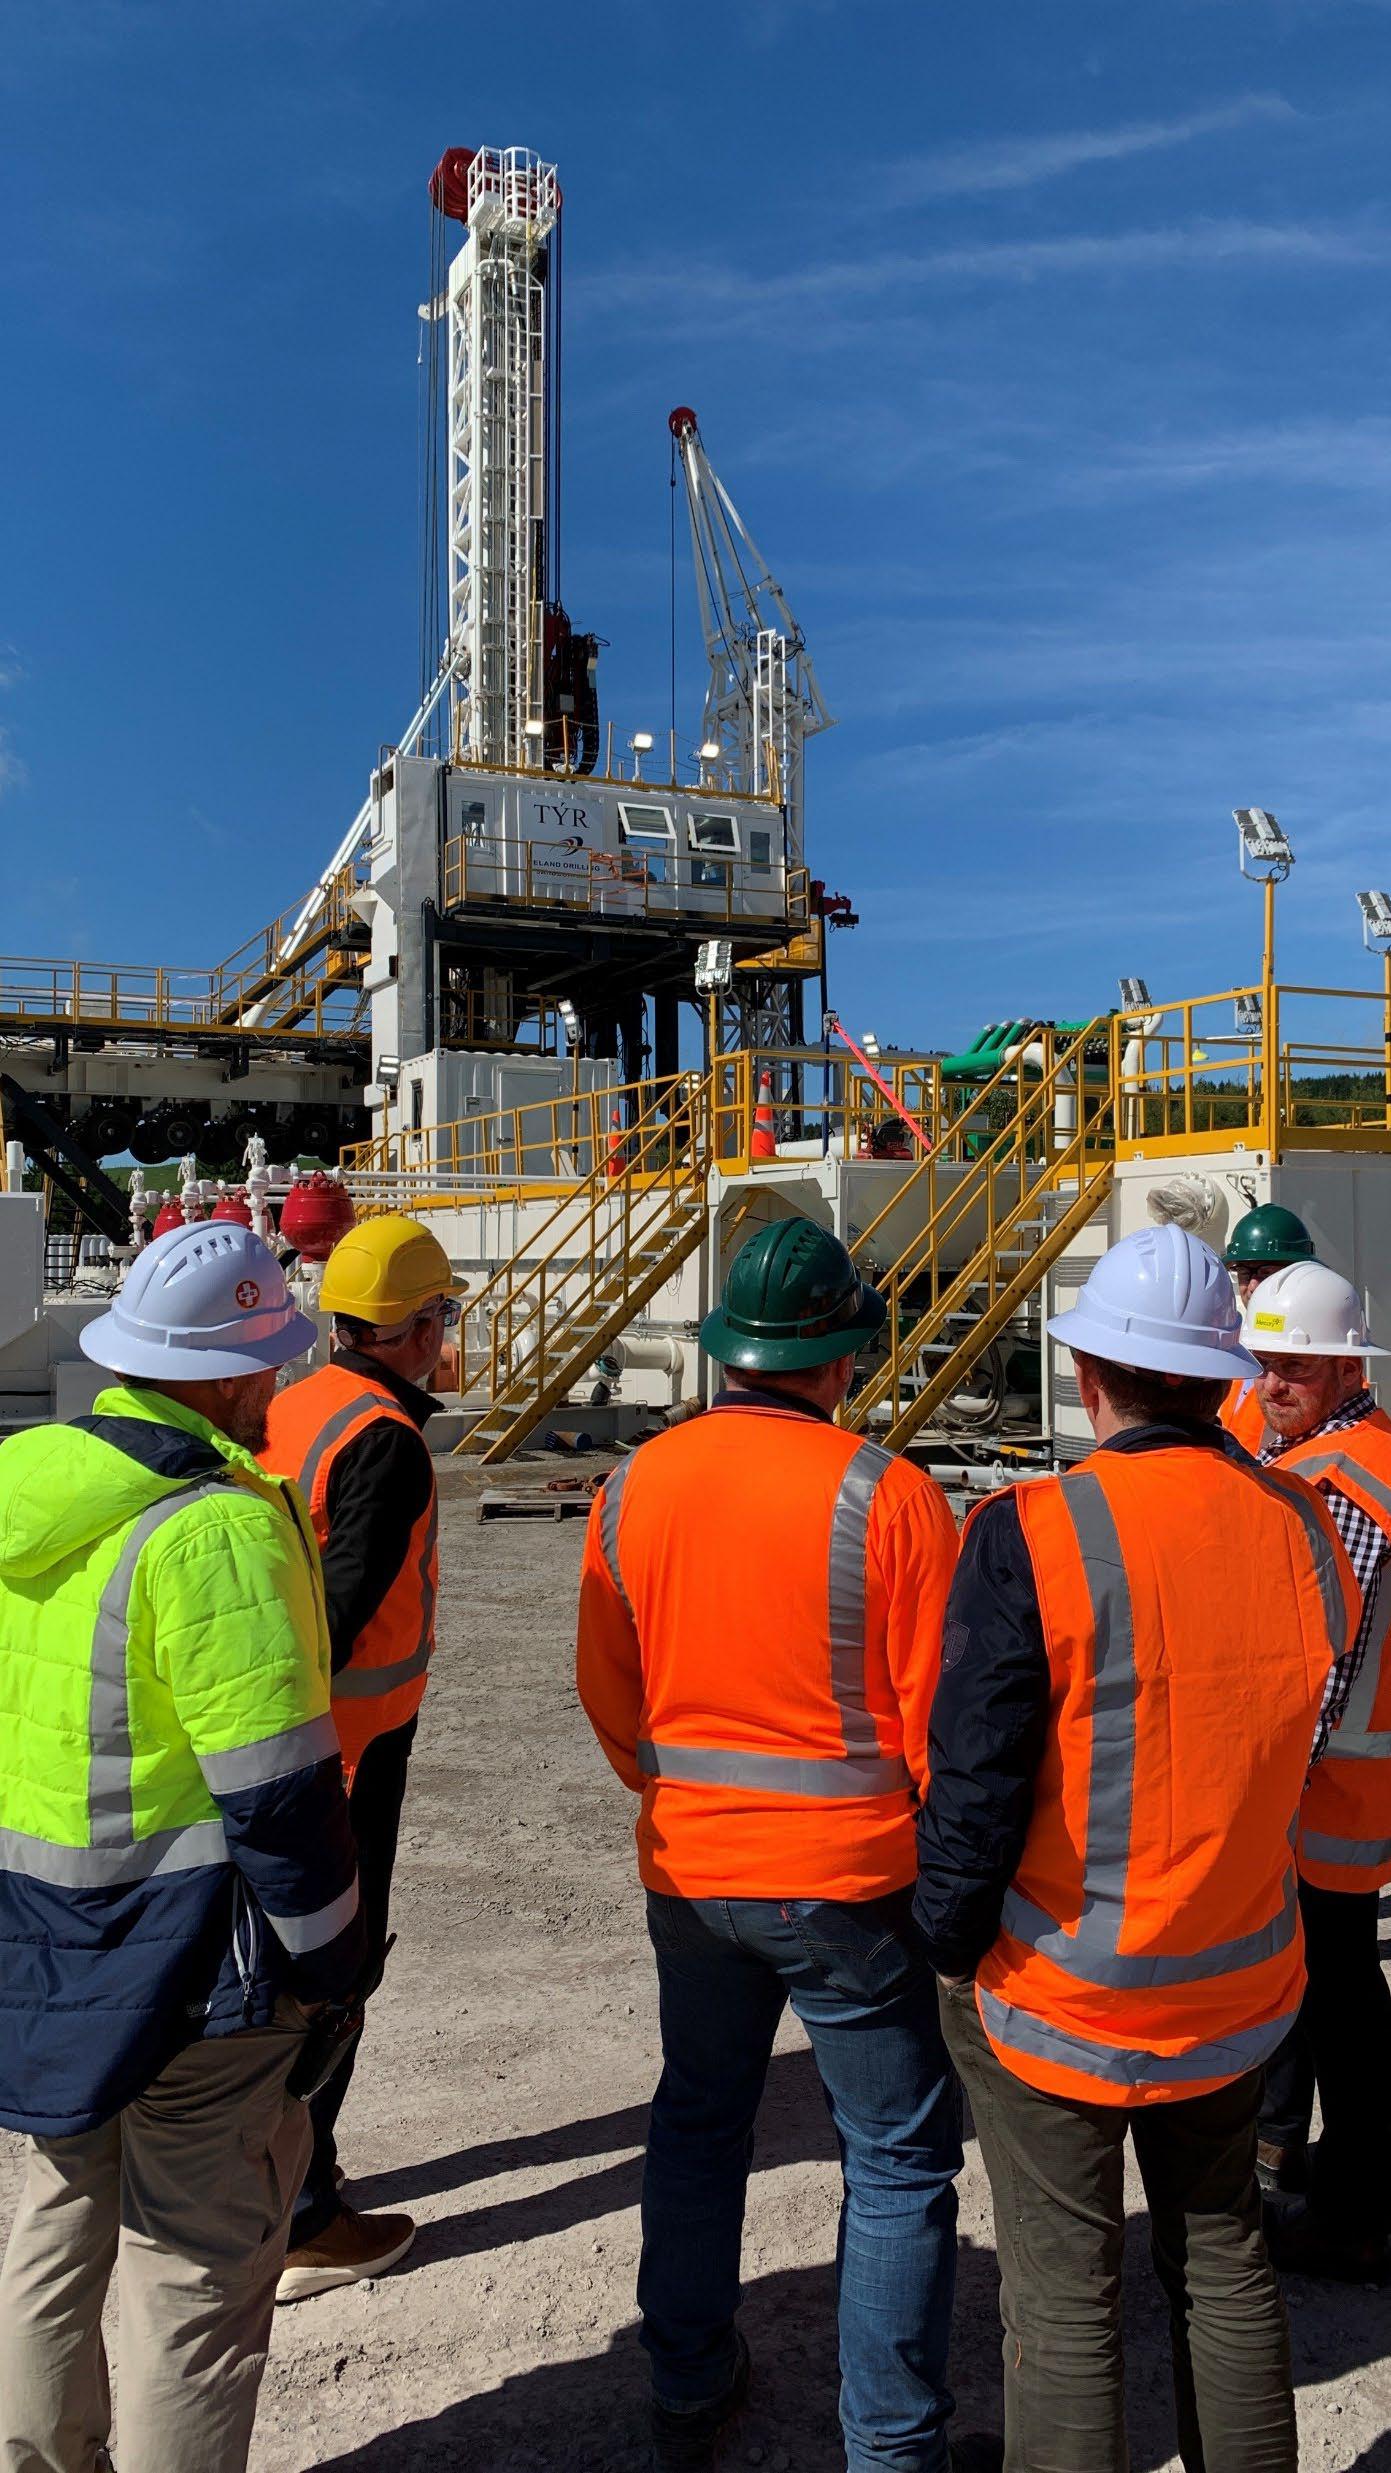

The campaign will see an investment of $128m1 and is due to commence in March 2023 and be completed in late 2024.
1 typical standard deep well project cost is ~$14m, inclusive of well pad preparation, construction and pipeline installation 2 supports OEC5 upgrade l 3 Historic average drilling rate 2014-2020 is 1.2 wells/year. Forward projection drilling rate circa 1.3 wells/year.
> Varies year-on-year due to geothermal drilling and hydro re-investment activities
> Wind SIB CAPEX minimal as almost always

> Growth reflects foundational work to improve asset resilience plus supporting growth in generating assets across wind and geothermal.
> Developing a project to enhance the value of the Ngā Tamariki Power Station by ~37MW (314GWh/year) by adding a fifth generating unit (OEC5), increasing total station capacity to ~123MW (net).
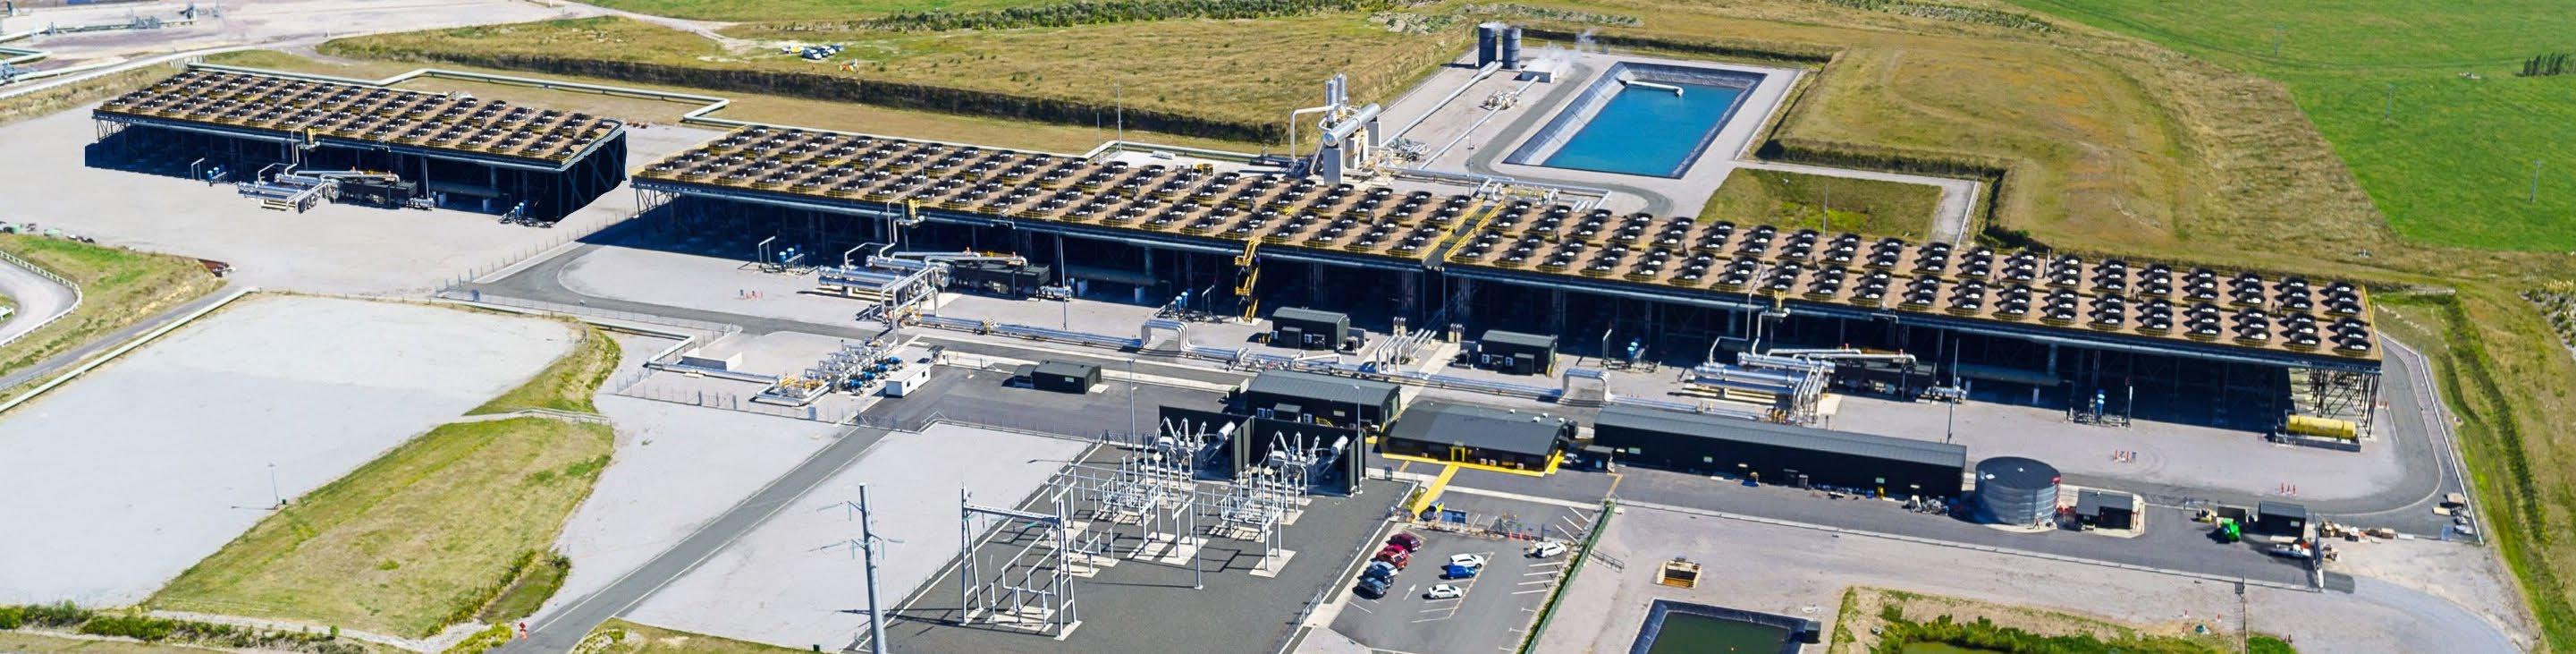
> Currently progressing negotiation of main contracts, final feasibility and resource consenting prior to final investment decision.
> The conceptual design is complete, the team is clarifying technical requirements and progressing preliminary design with Ormat (EPC Contractor) to de-risk the project and obtain firm final contract prices .
PROVIDING RESILIENT ENERGY GENERATION & ENERGY CAPACITY
OPTIMISE
PERFORMANCE
Incremental improvements and long term plan
> Hydro Production Volumes have increased in FY23 after stable and relatively low inflows in the previous three years.
> Optimisation Team formed to support continued works to maximise the value of our generating assets in the short and long term.
> Examples of Thrive improvements recently achieved:
• Maraetai power station low tailwater operation restriction removal – enables longer periods of on peak generation without spill = GWAP uplift. Annual benefit (ongoing) ~ $450k.
• Waipapa power station output and flow increase, particularly at low headwater levels – 2.5MW increase plus 20cumec flow increase = GWAP uplift, reduced spill. Annual benefit ~ $300k.
• Hydro multiple frequency keeping (ancillary service) functionality increase, water value loss reduction, maintenance legacy reduction.
> Geothermal production volumes continue to be stable, FY20 = 3,777GWh, FY21 = 3,757GWh and FY22 3,715GWh.
> Optimisation Team also maximising value of our geothermal assets.
> Examples of Thrive workstreams include:
• Improving management of non-condensable gas accumulation in Mokai OEC units (OEC31) ($100k).
• Reducing inlet pressure on Mokai STG10, ($1m @ 100% equity).
• Removal of a restriction in the NAP reinjection system, improving output ($200k @ 100% equity).
• Assessment of the motive fuel selection for NTM OEC05 which could raise capacity by 1.4MW ($2m).
• Control system optimisation at NTM improving performance ($1m).
> Wind portfolio FY22 production of 1,330GWh
• Ex-Tilt assets availability improved to 94.0% (+3.44% on FY21)
• Turitea North completion first year in operation - achieved availability of 96% (+1.5% on target).
> Wind portfolio FY23 YTD production of 889GWh
• Wind portfolio FY23 YTD availability of 94.3% (+1% on same period FY22).
• Below target of 985GWh and -2% on same period FY22.
• Wind resource FY23 YTD below forecast (wind speed -5% on forecast and -1% on same period FY22).
> Opportunities
• Availability improvement in FY23 for Turitea as second year of operation begins (+2.0% target on FY22).
• Availability improvement in FY23 for Tararua 3 with full site availability (+0.5% YTD on same period FY22).
• Asset life extension for Tararua 1&2 turbines.
• Kaiwera Downs in full production during FY24 (annualised 147GWh).
• Turitea full site production from end of FY23 (853GWh).
PROVIDING RESILIENT ENERGY GENERATION & ENERGY CAPACITY
Understand risk and develop resilience of assets
Existing 113.7MW Steam Path and Generator were damaged in 2021 and the full refurbishment is set to be completed in FY23.
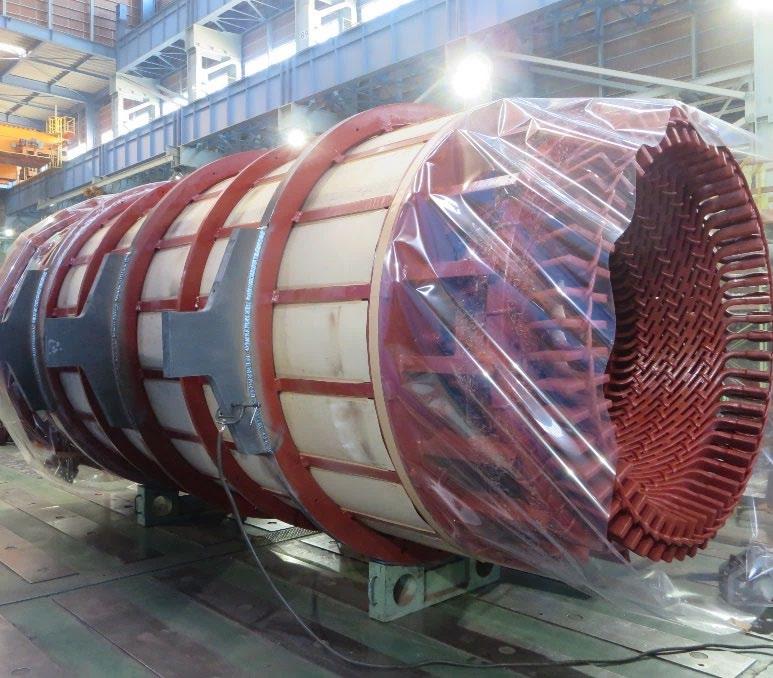
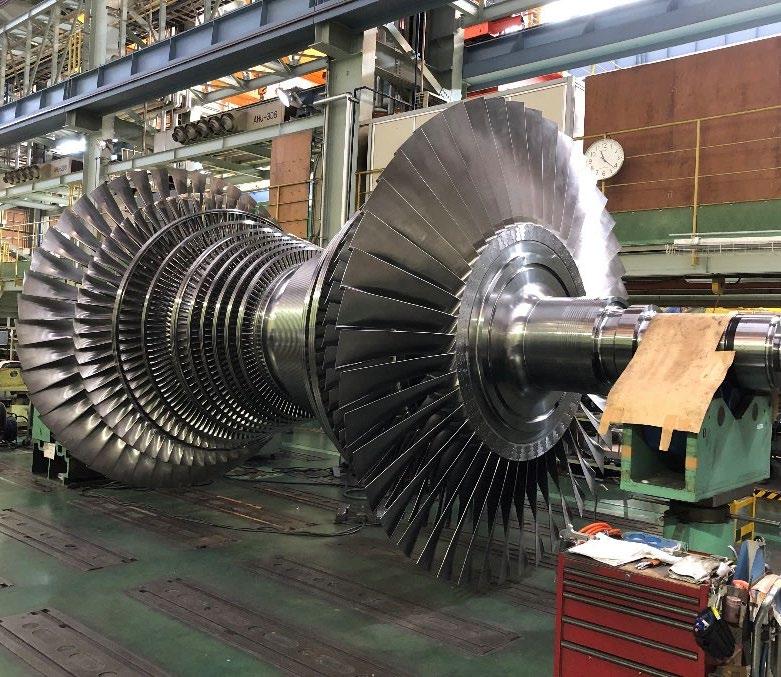
The replacement equipment is supplied by Sumitomo Corporation and manufactured by Fuji Electric in Kawasaki Japan.
The equipment is in final stages of testing, packaging and is due for shipment to New Zealand in March 2023.
The replacement of the existing Steam Path and Generator will be completed between late April and the end of June 2023.
The $36m project protects the value of generation of the Kawerau power station (net output 106MW).
Final insurance payment expected in FY24.
The asset management framework adopted by Mercury is designed to enhance, focus and accelerate delivery of strategic objectives, as follows:
1. Maximising Asset Performance through process optimisation
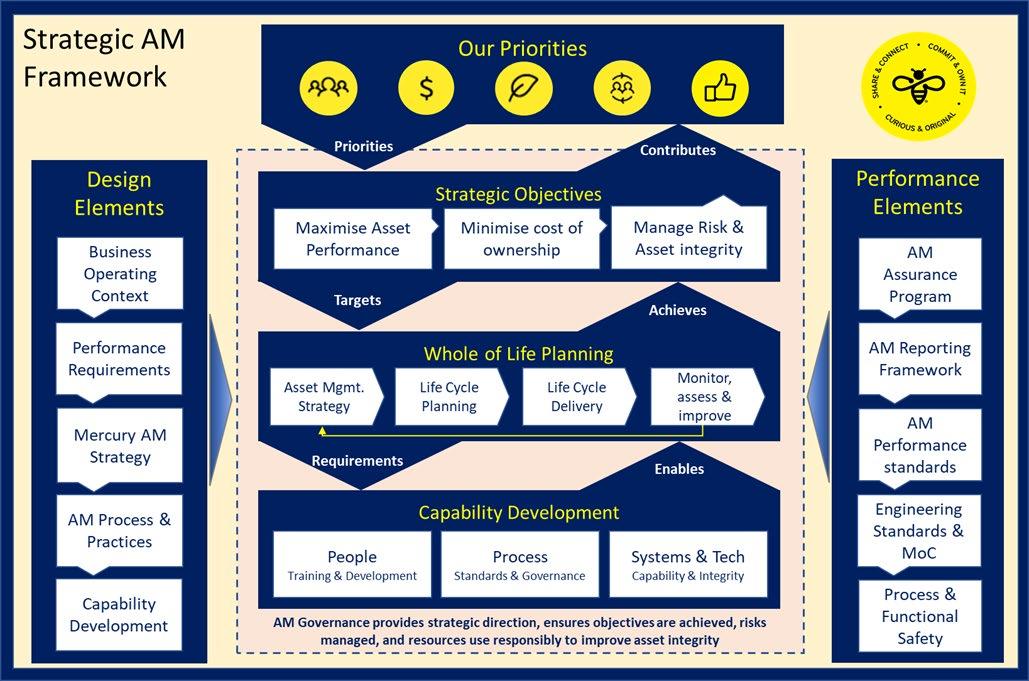
2. Minimising Cost of ownership through continuous improvement
3. Managing Asset integrity and critical risk over the long term
Critical risk management is a key pillar. Whole of life planning supported by asset condition-criticality assessments at the individual asset level allows for bespoke asset strategies to be developed and adjusted over time. This helps us protect value and minimise risk while supporting strategic and sustaining investment decisions over the life of our assets.
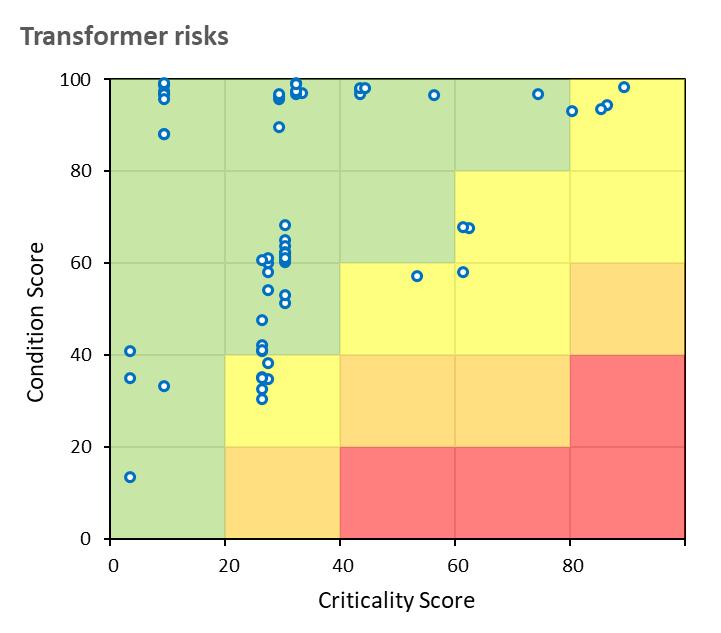
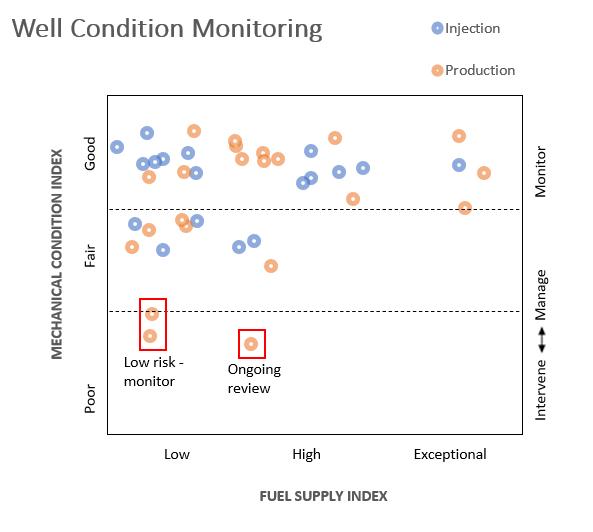
Our risk-based approach to asset management focusses re-investment on the assets that matter most.
Taking a condition-criticality approach to asset risk allows us to efficiently monitor asset lifecycle risks across our large asset portfolio.
Condition monitoring programs allow our engineers to assess assets throughout the life cycle and adjust asset strategies against defined performance standards


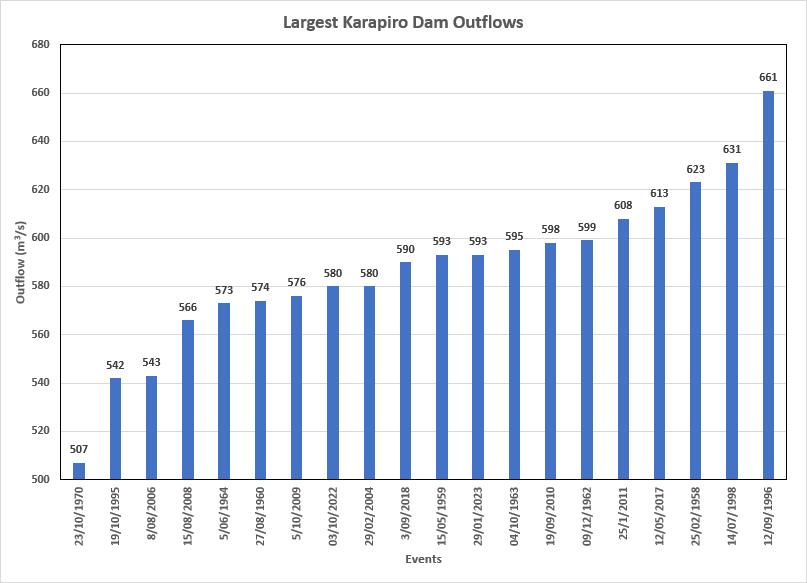
> Nine dam structures on the Waikato Hydro system aged 60-97 years.
> Including Taupō control gates.
> Contains and regulates flow from the reservoir on the River.
> Dam Safety guidelines (NZSOLD) are becoming regulations.
> Mercury team set up to measure, assess and manage risks associated with dam structures.
PROVIDING RESILIENT ENERGY GENERATION & ENERGY CAPACITY
BETTER TOGETHER PROTECT & ENHANCE VALUE
Leveraging location and diversity to manage risk and grow performance
Investment programme to sustain long term performance
OPTIMISE PERFORMANCE
Incremental improvements and long term plan
MANAGE RISK
Understand risk and develop resilience of assets
LUCIE DRUMMOND General Manager Sustainability
Working with others to ensure the pace of change supports the transition
The BCG report ‘The Future is Electric’ sets out how the electricity sector can contribute to these decarbonisation actions by navigating four key challenges:
Sector pipeline of renewables well placed to meet 2030 demand.
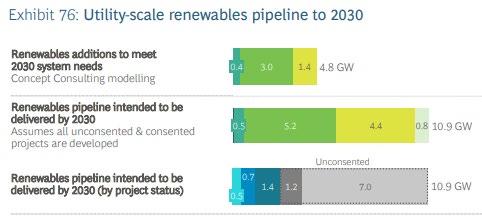
Develop new renewable generation at pace
> Industry project pipeline of 10.9GW will meet forecast requirement of 4.8GW by 2030.
> Imperative that updates to NPS REG and the new resource consent framework support pace of development.
Manage reliability during peak demand
> More battery storage and fast start peakers (including gas) required to provide supply side flexibility.
> Market to evolve to encourage right energy and capacity mix.
Source: Concept Consulting modelling; BCG analysis; Transpower (BCG The Future is Electric – November 2022)
Key transition challenges need to be navigated to ensure outcomes for end users
Managing dry year energy supply risk
> Preferred pathway in the report has a mix of more renewables (wind and solar already in pipeline), gas generation (200MW OCGT) and larger-scale demand response.
Investment in transmission and distribution
> Significant investment required in transmission and distribution. Investment for resilience likely to emerge post-cyclone Gabrielle.
> Regulatory changes needed to support network investment required to support a smart energy system and build resilience.
> Momentum for sector collective work continues –companies across the sector have been working on a sector commitment to deliver a low carbon energy system.
Positioning for opportunities and building knowledge to support preparedness
Our current climate strategy
Promoting the role of renewable energy
Collaborating with stakeholders

Positioning ourselves for climate-related opportunities
Seeking to reduce our own climate change impacts
Building knowledge of climate change
Playing our part
Progress so far
Mercury have reduced our Scope 1 emissions by ~60% since 2015
and ranks at ~40th in terms of emissions for NZ organisations covered by the ETS
Five years of climate-related disclosures
Playing a leading role
Through continued investment in renewable generation, our emissions intensity has gone from ~70kg CO2/MWh in 2015 to ~30kg CO2/MWh in 2022 vs grid average of ~100kg CO2/MWh
What’s next for FY23
Action plan to reduce our emissions – with measures and targets
Ramping up for New Zealand Climate Standard in FY24
The electricity sector can support 70% of New Zealand’s emissions reductions required to achieve net zero by 20501
Continuing to invest in research and development of technology that could support geothermal emissions reduction
> Fugitive geothermal emissions make up ~98% of Mercury’s Scope 1 emissions and ~68% of our overall GHG footprint1.
Inject NCGs here, at northern reinjection line
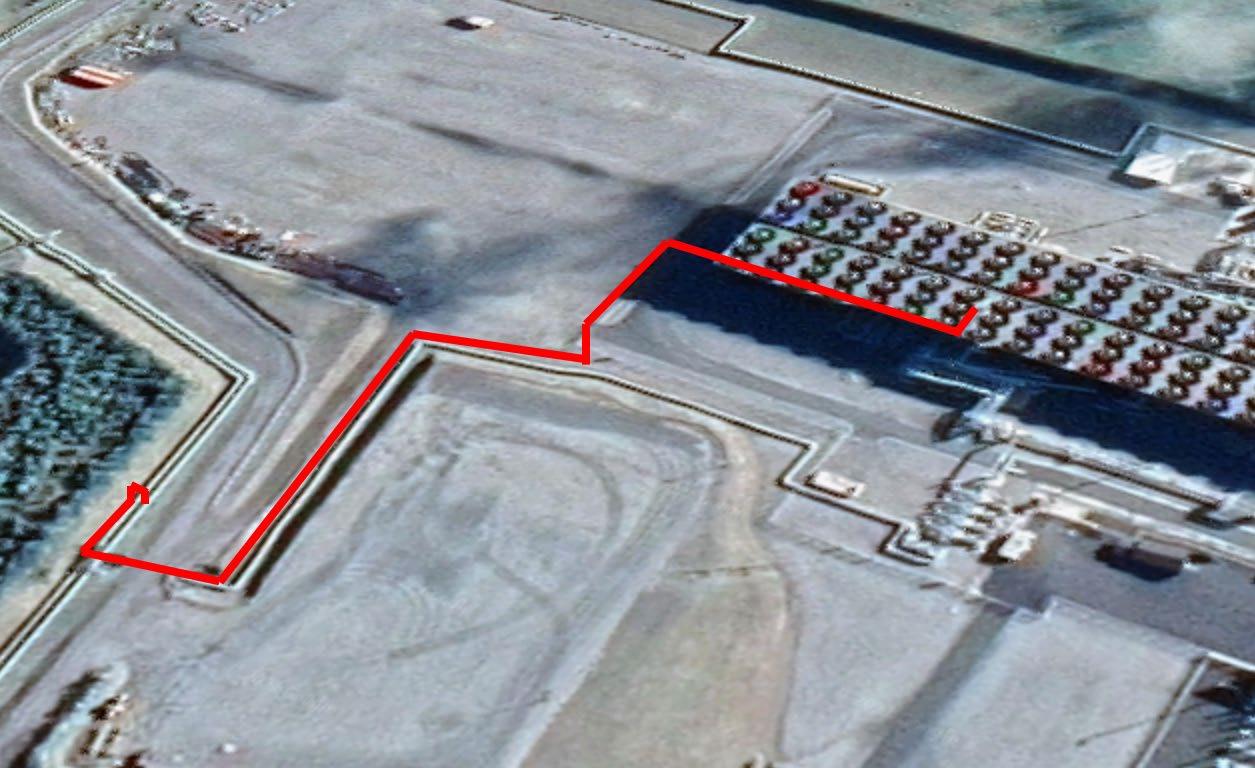
> Mercury is actively developing technology and trialling methods to reduce these emissions and is working with others in the sector.
> The trial at Ngā Tamariki started November 2021 and has reinjected over 8k tonnes CO2-e (~25% of total station emissions/year) with no adverse effects identified.
Capture NCGs here, upstream of gas vent
> Still in testing and development. The next steps are:
• expansion of the existing binary plant system – continuing to understand performance and impact on reservoir.
• starting research and development aimed at understanding a solution for flash plant emissions, specifically for the Kawerau Power Station.
Leveraging what we have learnt through voluntary disclosure as we move into the New Zealand Climate Standard
> Starting in 2018 has enabled a staged approach to improving our climate disclosures.
> In FY23 we will adopt as much of the new New Zealand Climate Standard as possible, ahead of our FY24 obligation.
> This year we are:
• introducing a third climate scenario to assist with our identification of risks and opportunities.
• focussing on addressing any disclosure gaps.
• refining our approach to disclosing ‘material risks’.
> We continue to build knowledge on predicted climate impacts specific to our business and are working with others across the sector to create energy sector scenarios that can help with understanding system risks.
Working with others on our social and environmental impact – diverse perspectives, increased capacity, aligned goals
Meaningful and enduring support for customers experiencing hardship
> Programme approach to customer care
> Addressing the digital divide
Working in effective teams with our key suppliers
Iwi relationships
Evolving how we restore natural resources
> Gathering more information to understand supply chain impacts, e.g. modern slavery
> Focussing on building culture with key contractors
> Updating our approach based on feedback received from iwi partners
> Waikato Catchment Ecological Enhancement Trust
> Taskforce of Nature-based Financial Disclosures
PHIL GIBSON TIM THOMPSON General Manager Portfolio Head of Wholesale Markets
100% renewable generation
> Three low-cost complementary fuel sources in baseload geothermal, intermittent wind with flexible hydro capable of firming and peaking


Substantial peaking capacity
> The Waikato hydro system is the largest group of peaking stations in the North Island able to firm intermittent renewables
WAIKATO HYDRO SCHEME CAPABLE OF RAMPING FROM 0 TO FULL LOAD (>1000MW) IN ~5 MINUTES
LARGEST NORTH ISLAND RESERVE PROVIDER
FLEXIBILITY TO FIRM WIND IN CONSTRUCTION
Superior asset location
> North Island generation located near major load centres; rain-fed hydro catchment inflows aligned with winter peak demand
Experienced trading & risk management
> 50+ years of senior management experience in wholesale markets, risk management and trading
* Includes only operating assets (i.e. Turitea North only)
1 Generation Weighted Average Price (GWAP) vs. Time
> Integrated portfolio, usually net long generation with movement year-on-year due to hydrology, plant availability and values of sales
Call outs:
> We have options available to replace roll off of Manawa hedge acquired with Trustpower acquisition
> The term of C&I sales is extending with ~320GWh of 10 year contracts signed in the last 12 months
> PPAs associated with intermittent generation reduce firming requirement
Generation (Long) Sales (Short)
Wind Geothermal Hydro Manawa CFD Wind PPA Mass Market
Electricity demand must grow to meet our carbon targets
> Long-term growth is inevitable as electrification is New Zealand’s best decarbonisation option
Market transitioning from solely energy constrained to energy AND capacity constrained
> Capacity currently met by flexible hydro and thermal plant
> Hydro is finite & reliable thermal capacity is being retired
> Acknowledge demand growth has yet to materialise Increased intermittency will lead to increased volatility
> “When the sun shines, the sun shines. When the wind blows, the wind blows…”
> Correlated intermittent generation will lead to spot price volatility
BCG REPORT*: “Analysis of the existing pipeline of flexible, supply-side resources identifies that the current ambition of participants may need to increase to achieve peak demand by 2030”
*BCG Report – ‘The Future is Electric’: [link]
Mercury will maintain our advantage by having the best people and development pipeline to complement our existing advantaged portfolio
Market capable of navigating the transition
> Minor modifications rather than wholesale changes are required
> Mercury will advocate for timely and appropriate modifications to market settings that ensure market confidence is maintained
Diversity is increasingly important
> Diversity of location and fuel will limit correlation and aid in portfolio management and execution
> We are technology agnostic
> We continue to incorporate market and portfolio impacts in prospect assessment
Flexibility is increasingly valuable
> Flexible capacity solutions will be needed as the market becomes increasingly constrained
> Thermal will be required as part of the transition
> Pursuing ‘flex’ options as a core feature of our growth pipeline both on the supply and demand side
> Mercury will play our part supporting thermal to ensure security of supply through the transition
Demonstrated market understanding and experience
> We have a proven track record of generation development across fuels with integration into the wider portfolio
> We understand what good projects are and how to bring them to market
GENERATION GROWTH POST 2008
Construction – ~2,800GWh*
Acquisition – ~1,100GWh
Development and project management capability
> In-house development team with domestic and international experience across wind, geothermal and solar
> Specialised expertise across the project lifecycle – from prospecting to commissioning
IN-HOUSE DEVELOPMENT TEAM
30+ pax with experience in wind, solar and geothermal in the US, UK, Australia and NZ
Proven development partner
> Long-term commercial partnerships with Māori landowners and other key stakeholders
> Established supplier relationships across geothermal and wind
*Equity share and only operating assets
GENERATION IN PARTNERSHIP
Nga Awa Purua Geothermal Power Station (65%)
Mokai Geothermal Power Station (25%)
Our development approach is to leverage Mercury’s advantages and partner where there is value and learning
Build Partner Acquire
Energy
Wind
Strong portfolio of options - strengthened through Tilt acquisition
Solar
Open to M&A
Opportunities to partner (e.g. access, supply-chain, expertise, offtake) to bring large industry pipeline to market
Geothermal Existing brownfield and greenfield options Capacity BESS
Opportunities to leverage existing portfolio and relationships both on supply and demand side DER
Growing and diversified pipeline of >2,000MW and >8,000GWh
Equivalent in size to Mercury’s existing generation portfolio
Projects in construction
Projects consented or in consenting Projects actively being developed and secured

PROJECTS UNDER CONSTRUCTION, CONSENTED OR IN CONSENTING
> Flexibility to respond to changing market conditions with premium projects secured, a pipeline of projects at various stages of readiness, and an ability to scale up and accelerate through partnership.
Kaiwaikawe
74MW, 220GWh
Ngā Tamariki OEC5 (geothermal)
37MW, 310GWh
~70% OF FULL PIPELINE
Turitea South 103MW, 370GWh
~30% OF FULL PIPELINE
Puketoi
228MW, 1,040GWh
In Construction Consented In Consenting
Mahinerangi II
138MW, 470GWh
Kaiwera Downs II
196MW, 700GWh
Kaiwera Downs I
43MW, 150GWh
CRAIG NEUSTROSKI GM Commercial Operations
15 March 2023
FIONA SMITH GM Customer Operations
NICK PUDNEY Head of Integration
BECOME FUTURE READY…
We purchased Trustpower to accelerate our retail strategy and journey to become a Future Ready organisation…

• New Zealand’s largest multi-utility business
• Capability to deliver multiple products and services
• Provides scale efficiency to reinvest in technology


> Our focus has been on bringing two businesses together while also maintaining momentum.


> Single Retail Leadership Team
> Optimised across brands

> Early synergies have been delivered
> Electricity ICP churn at 16% (annualised).
> Customer churn at 11% (annualised).

> 25K Broadband connections
> 70 employees
 Stable/Modest growth in electricity connections
Retail integration programme
Completed acquisition of NOW NZ
Stable/Modest growth in electricity connections
Retail integration programme
Completed acquisition of NOW NZ
> We purchased Trustpower to accelerate our retail strategy and journey to become a Future Ready organisation…
• New Zealand’s largest multi-utility business
• Capability to deliver multiple products and services
• Provides scale efficiency to reinvest in technology
First Stop: ‘FIT FOR NOW’
> ‘Fit For Now’ is about creating a common operating model…
That delivers:
• One brand
• Customers migrated onto a one tech stack (Gentrack and Salesforce at the core)
• One succeeding culture, supported by adaptive ways of working And enables:
• Decommissioning of duplicate technologies
• Realising synergies
> On track to realise forecast cost synergies (Opex and Capex) over 3-year period
$35m
$10m of synergies to be realised in year 1 through:

> Corporate shared services


> Technology
> Core retail business activity
Additional synergies to be realised through FY24-FY25 from:
> Shift to Common Operating Model
> Retirement of duplicate technologies
> Becoming Future Ready
BECOME FUTURE
READY…
> We purchased Trustpower to accelerate our retail strategy and journey to become a Future Ready organisation…
• New Zealand’s largest multi-utility business
• Capability to deliver multiple products and services
• Provides scale efficiency to reinvest in technology
First Stop: ‘FIT FOR NOW’
> ‘Fit For Now’ is about creating a common operating model… That delivers:
• One brand
• Customers migrated onto a one tech stack (Gentrack and Salesforce at the core)
• One succeeding culture, supported by adaptive ways of working And enables:
• Decommissioning of duplicate technologies
• Realising synergies
Next Stop: ENABLING FUTURE READY
> Fit For Now is the springboard to focusing on Enabling Future Ready
• Iterative investment into future-fit technology platforms
• Automation and robotics
• One succeeding culture
We have a clear focus over the next two years…
Two-year programme of transformation:
> enhance our capability to continuously deliver propositions which are relevant & compelling
> improving Customer Experience (CX) through insight & personalisation
> leveraging digital technology to gain efficiencies
> building adaptive capability across our people
Delivering:
> customer experience relevancy driving tenure and advocacy
> reduced risk of disruption by creating a more dynamic & capability deep organisation
> an efficient cost to serve
> a fit for future workforce
Using technology, data and insights, we have an opportunity to improve customer experience and personalisation
Note: all data depicted in this image is fictional
Enabling Future Ready means investing in the right places…
Technology:
> Digital customer: Social connections matter more than ever
> Next best action: Insight gathering bots
> Open AI language tools: ChatGPT (friend or foe)
> Digital interventions: Reduce human interventions
> Customer lifecycle: Insight = Ongoing Relevancy
One succeeding culture:
> Adaptive delivery models: Test & Learn
> Capability: Fit for future work force
> Crowd sourced capability: The power of the whole
Using technology, data and insights, we have an opportunity to provide cross-selling opportunities and increase loyalty
Note: all data depicted in this image is fictional
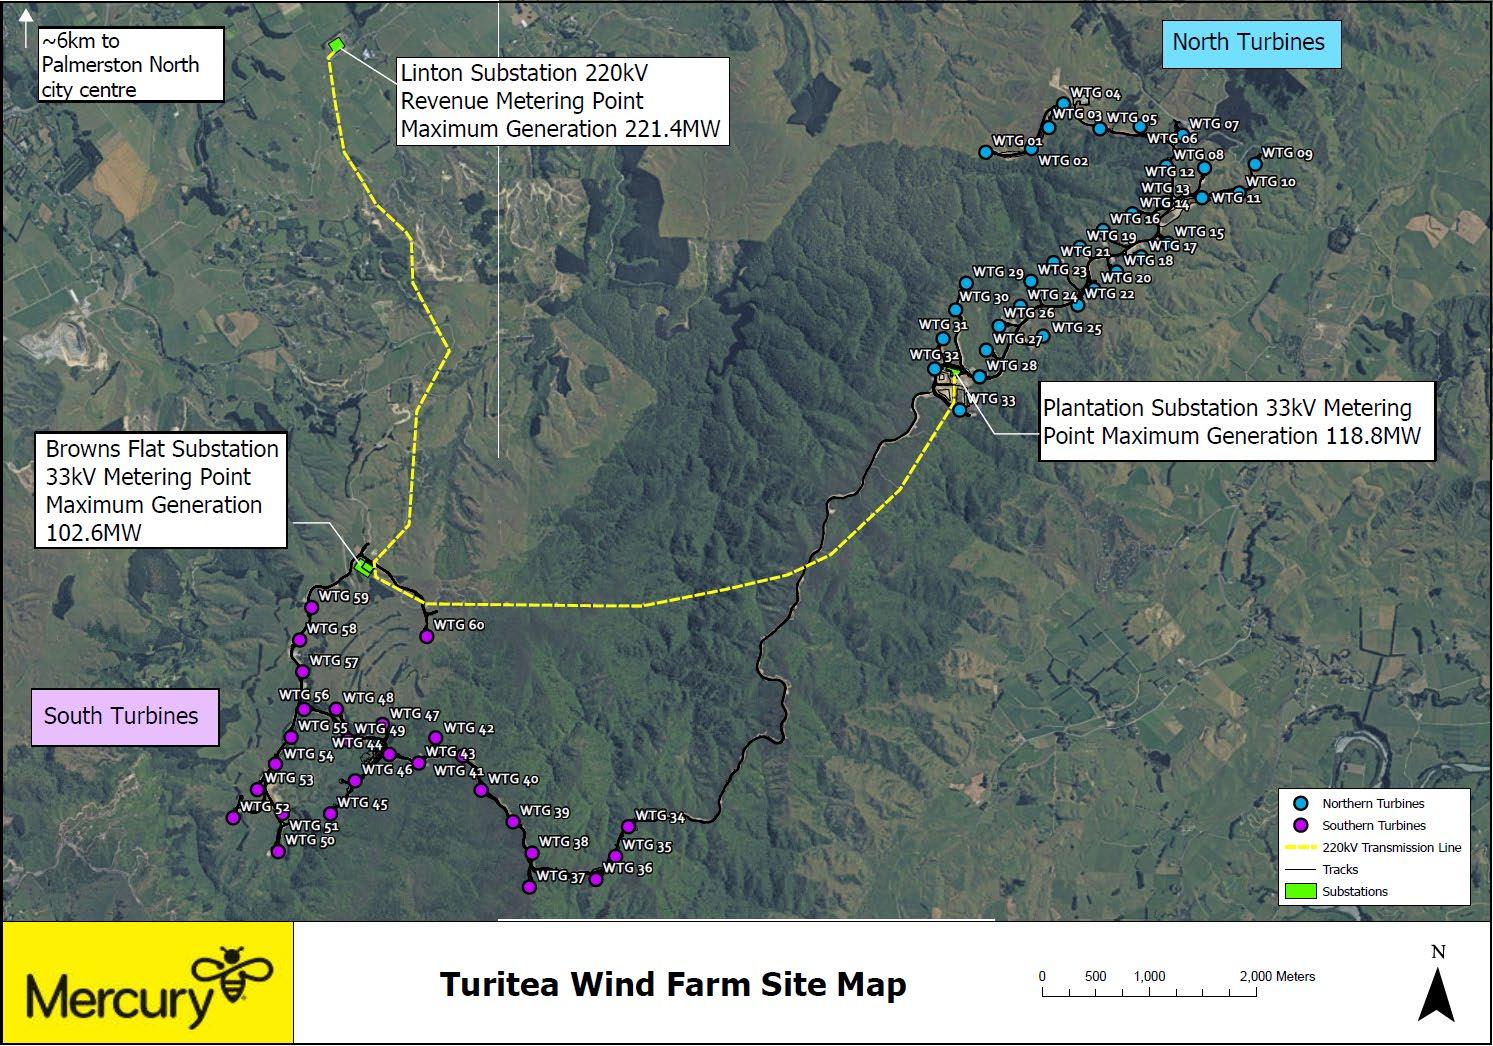
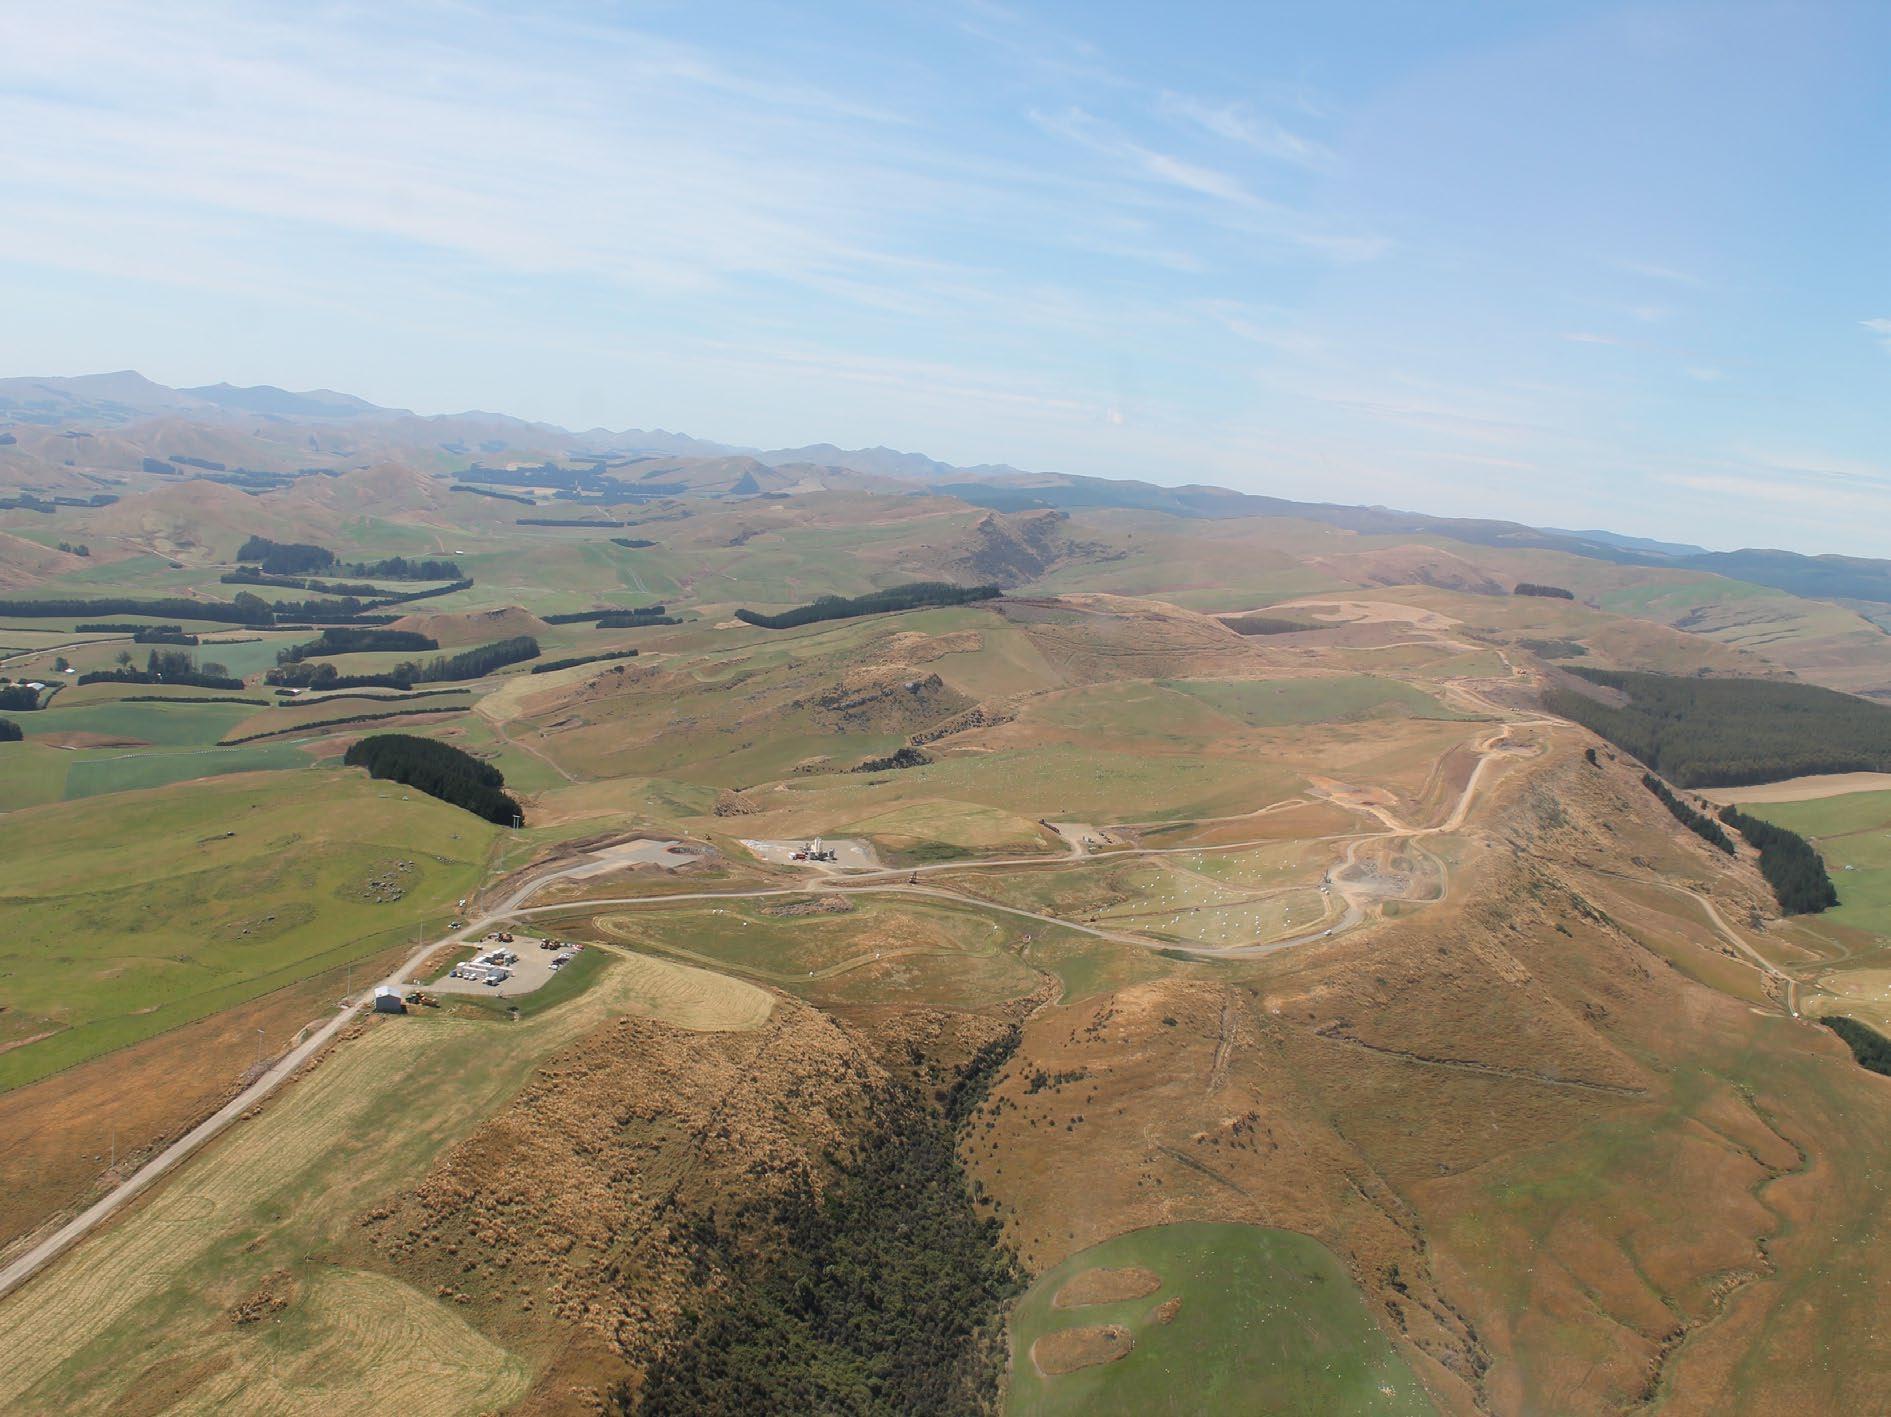
Investor Day Site Visit – Thursday 16 March 2023
2011
Early investigations and feasibility
Consented, after which the project was paused 2019
Jan 2022
Contracts signed and construction started
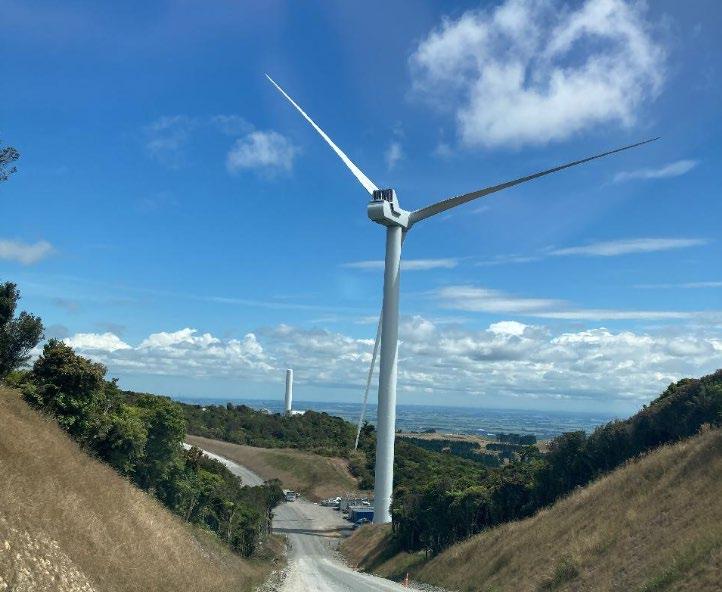
Turitea North (33 WTGs) fully online
Restarted following turbine technology and market developments
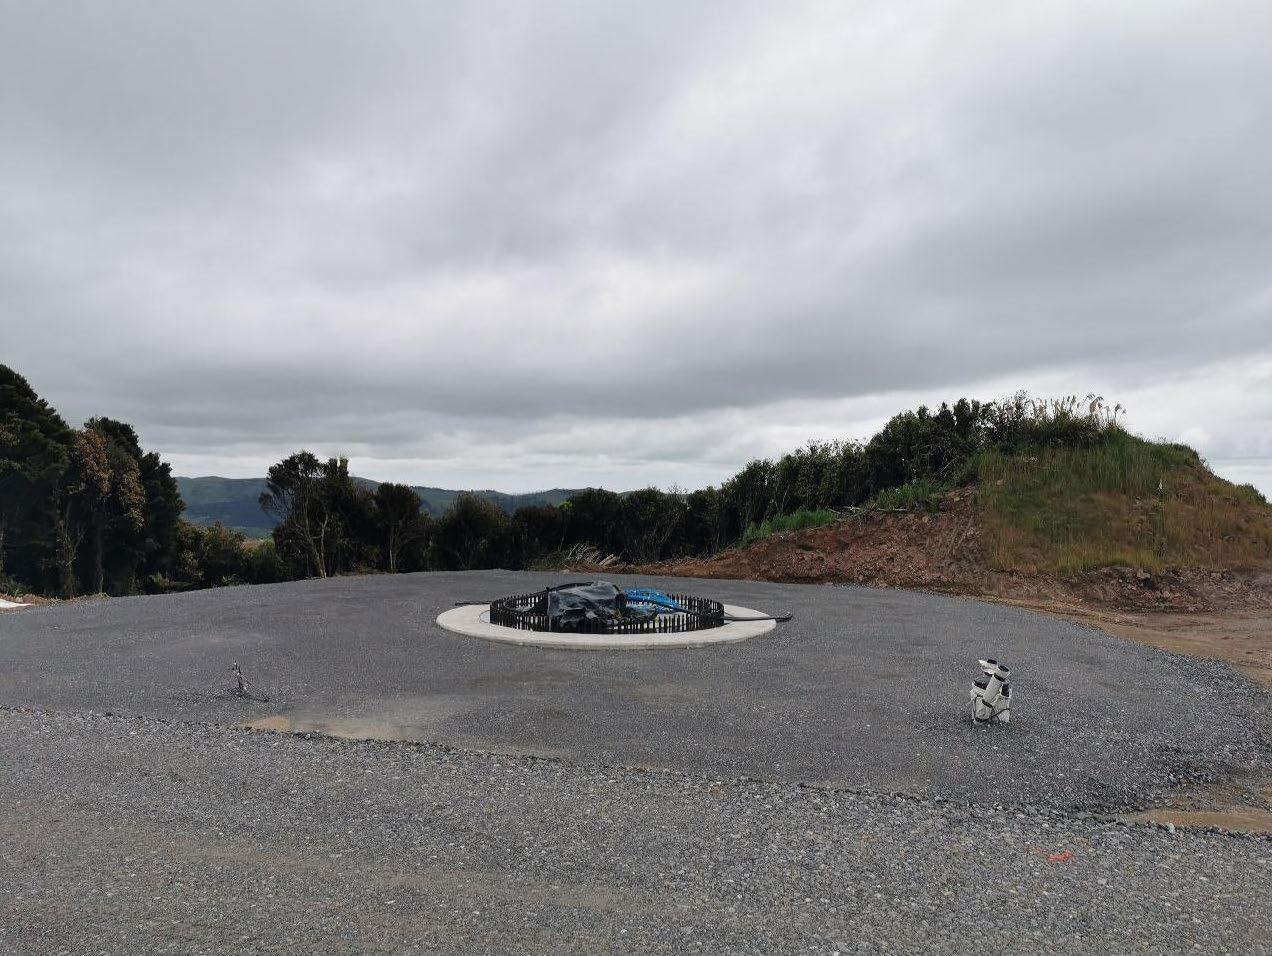
April 2023
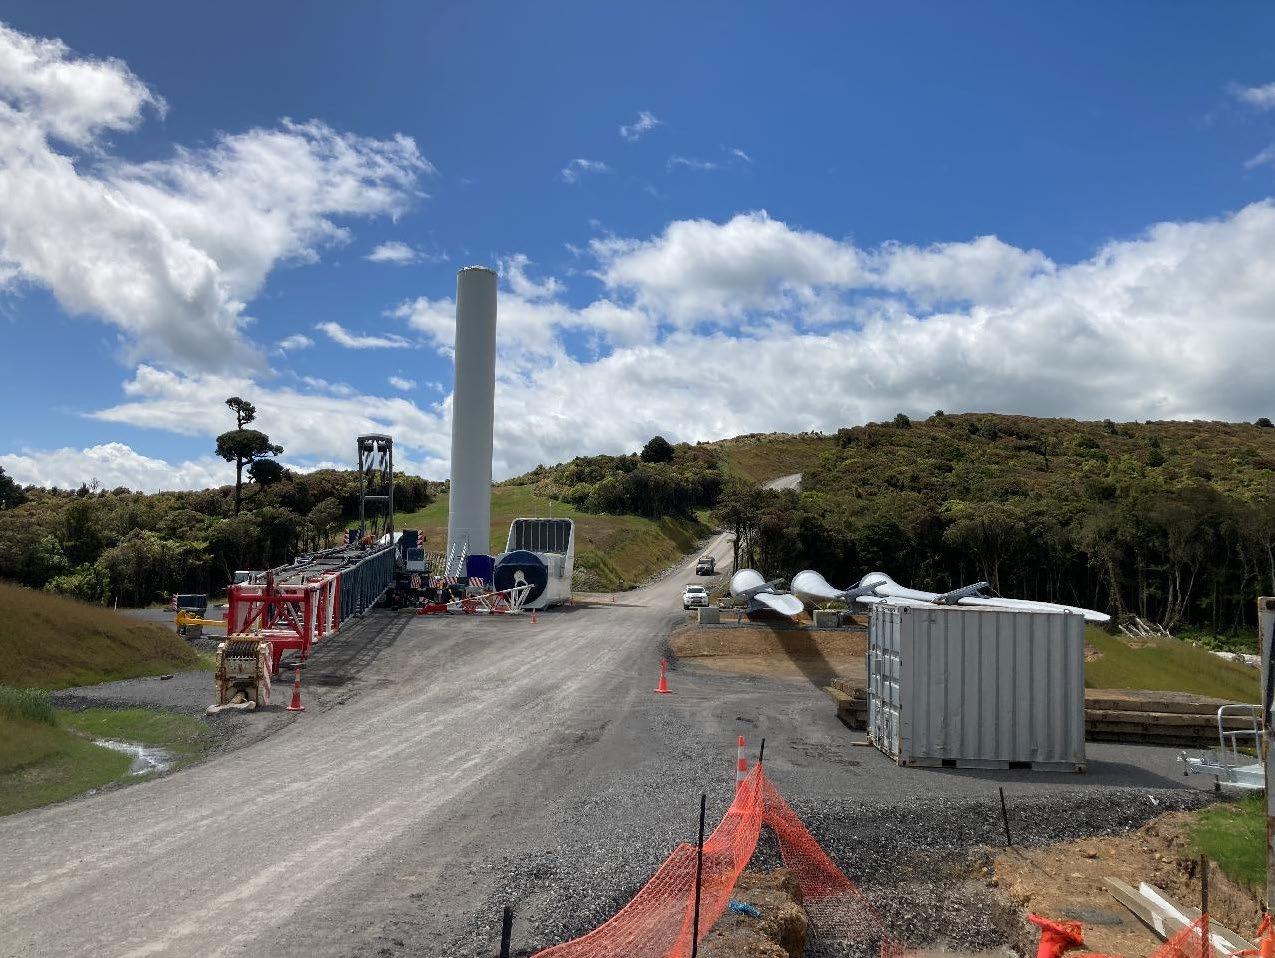
Turitea South (27 WTGs) commissioning
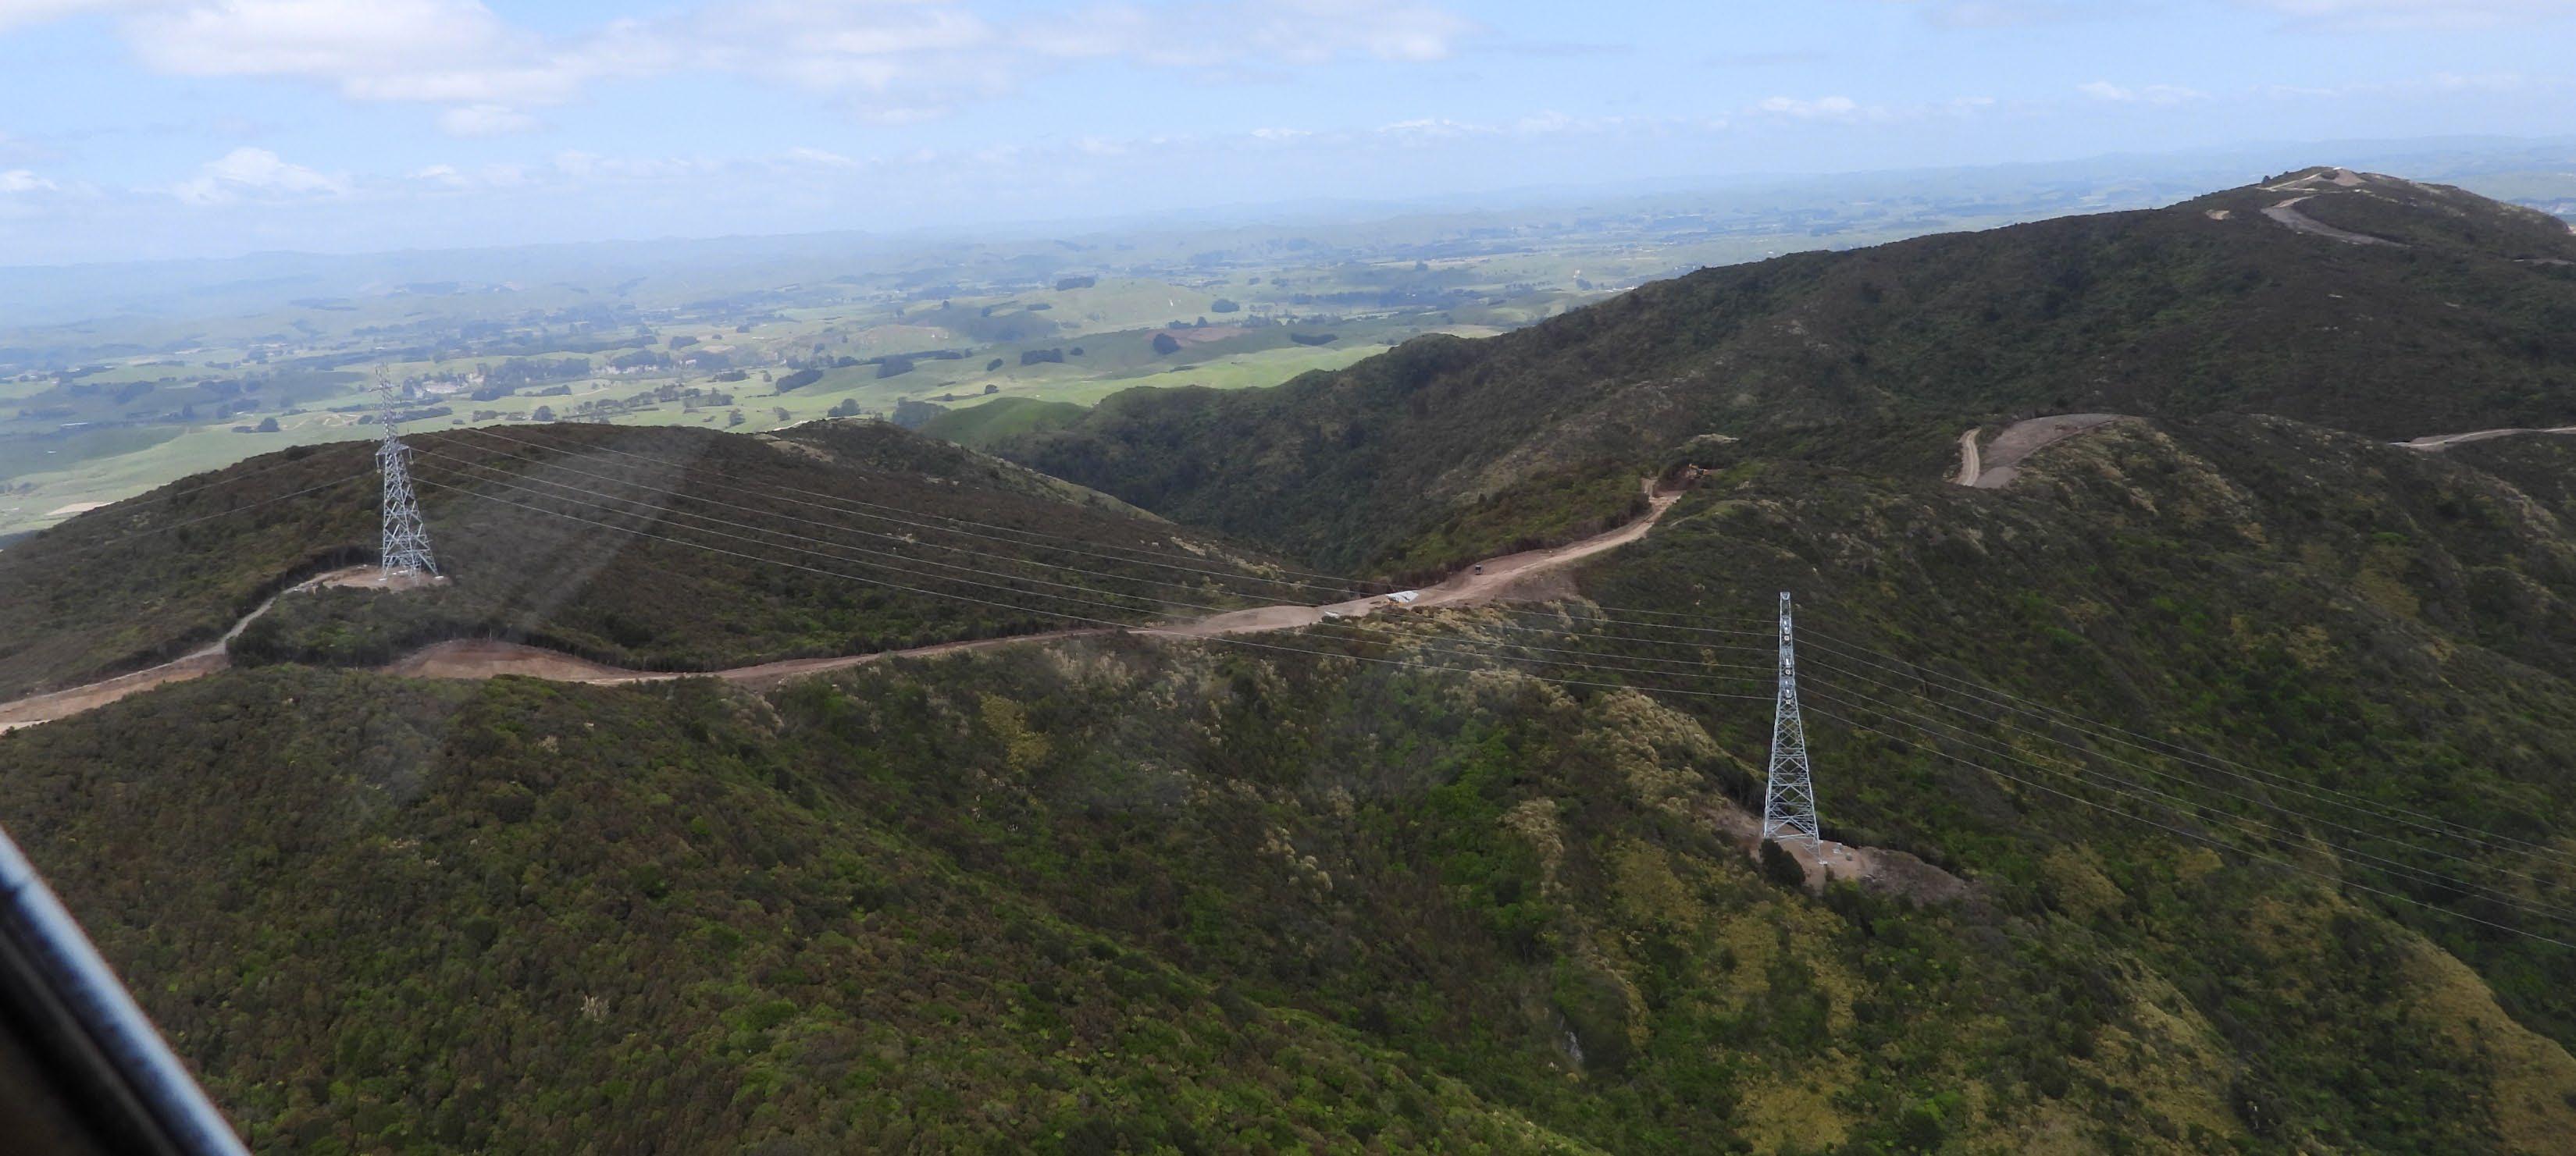
12 km, 220kV 20 poles, 18 towers (8 by helicopter)
Grid connection at Transpower’s Linton substation
Double circuit line, current configured into a single circuit
Constructed by Electrix under a Design-Build contract
2 Substations –Plantation in the North, Browns Flat in the South
Built to allow expansion for future projects i.e. Puketoi
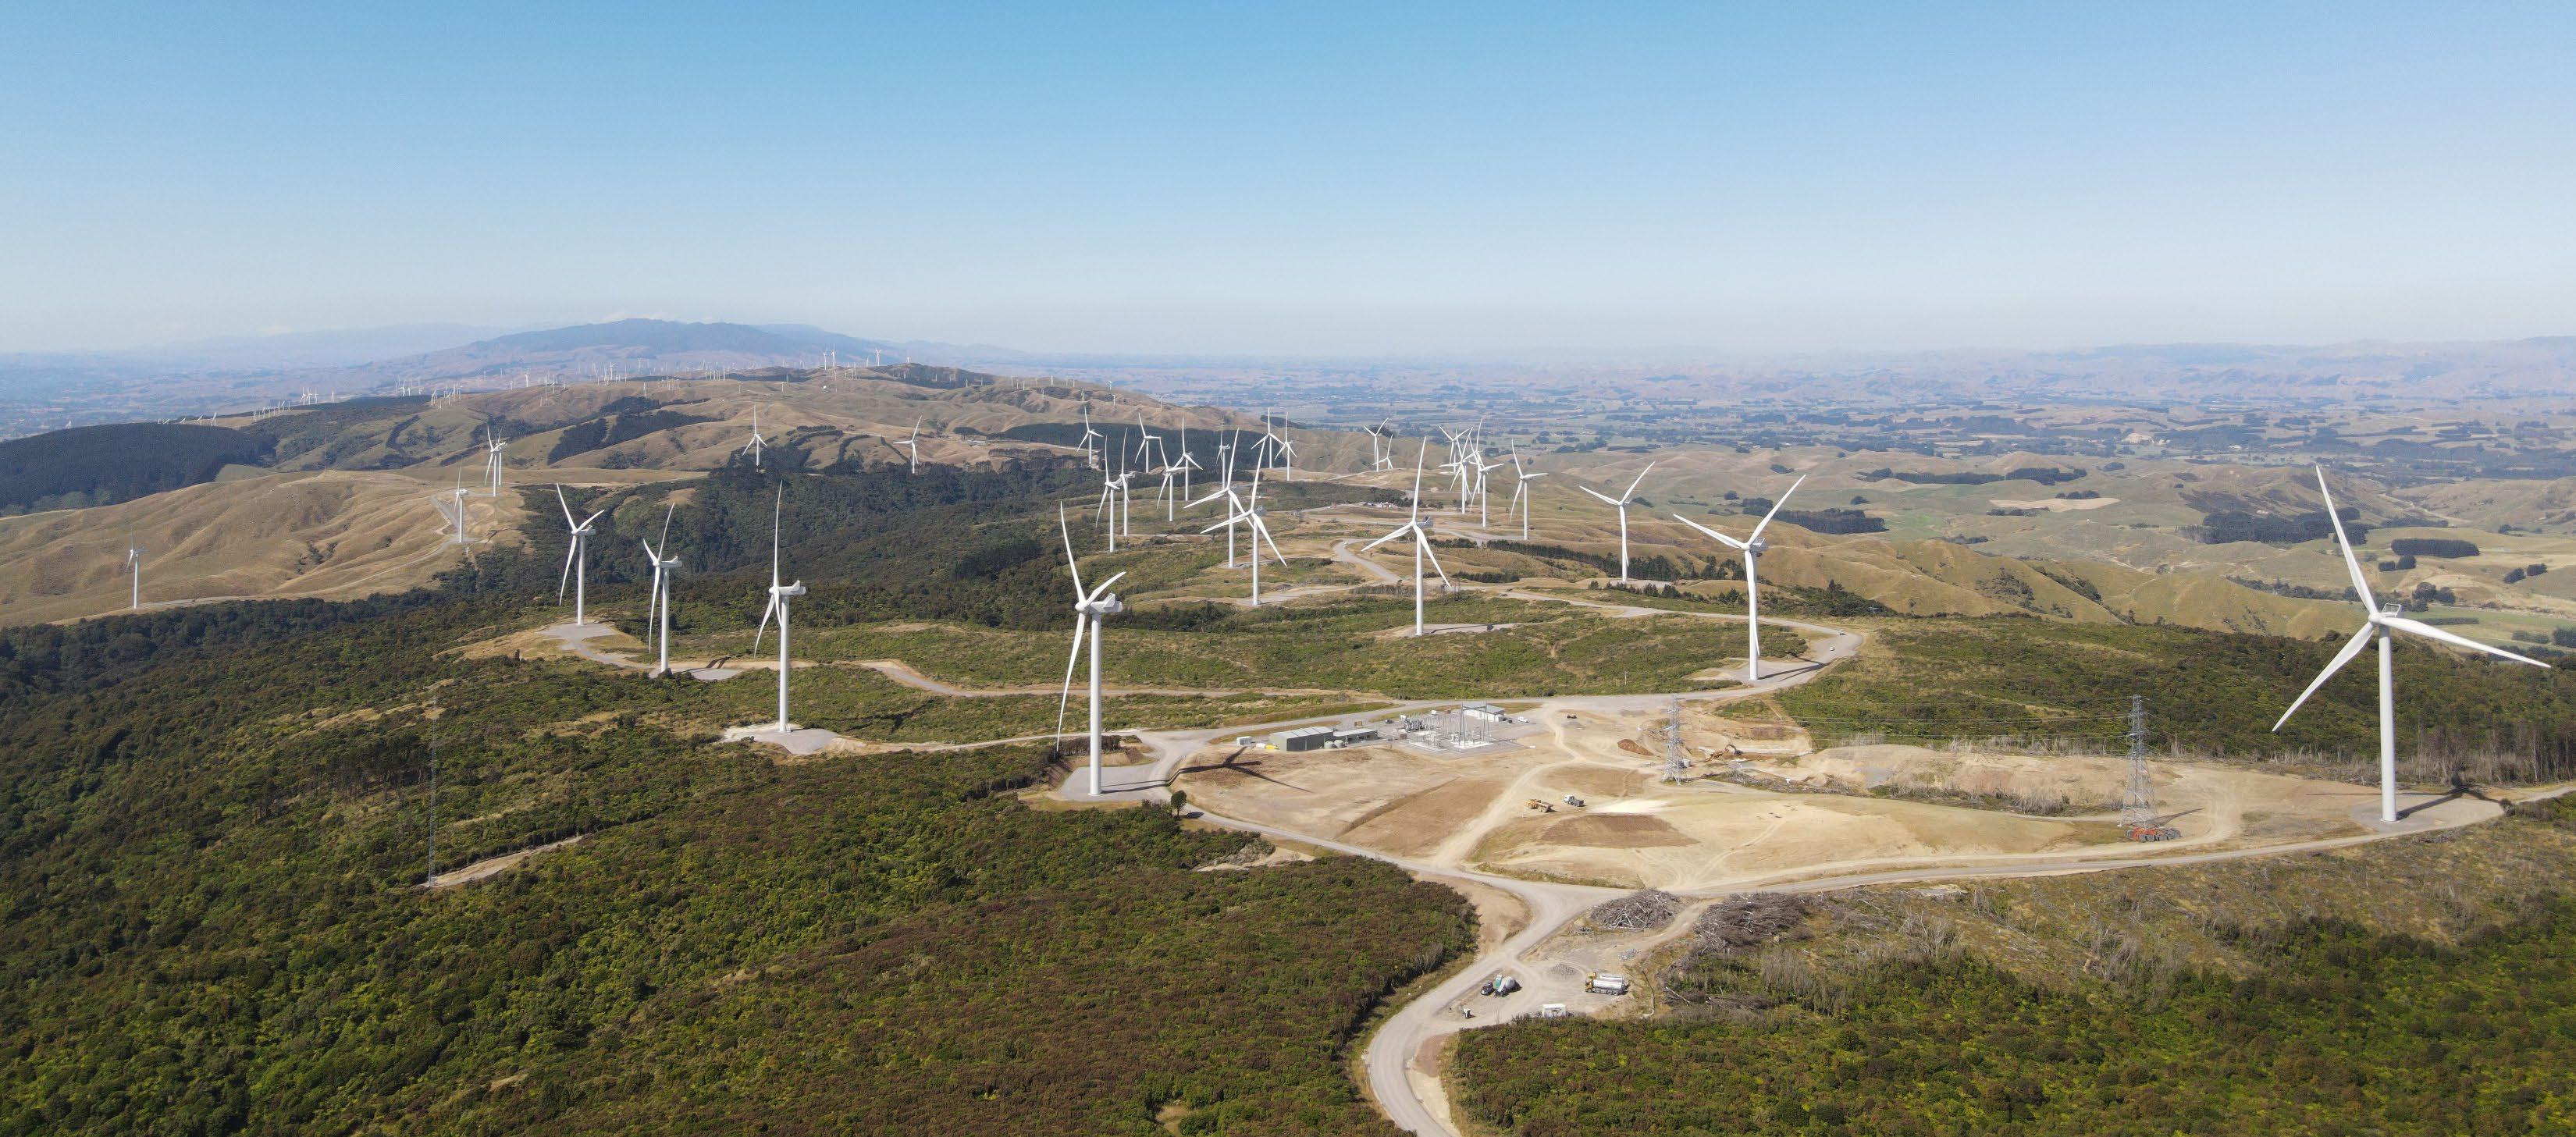
North – 119MW, 33x3.6MW
South – 103MW, 27x3.8MW
Vestas V112. 125m tip
height, 69m WTG hub
height, 55m blades
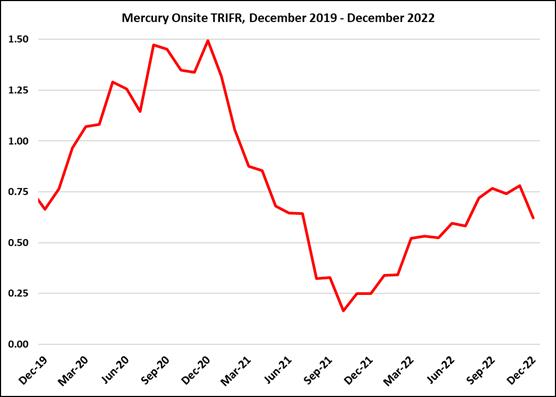
1M hours - TRIFR 10.7
~160 sediment and erosion control devices
Lizards, bats and birds
842GWh Output
North – 470 GWh
South – 372 GWh
25km of roading
42km of 33kV cable
25 year service and availability contract with Vestas

Please ensure you have:
> Covered shoes - safety shoes/boots if you have them.
> Wrist to ankle clothing.
> Jacket/layers.
> Hard hats, safety glasses and vests will be provided.
> Completed Turitea Water Catchment Reserve Health Declarations (if not already completed).
> 8:30 a.m. pickup from your accommodation.