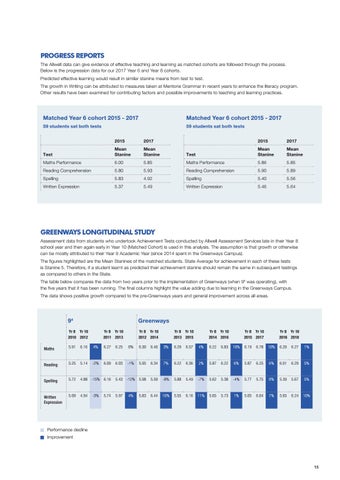
PROGRESS REPORTS The Allwell data can give evidence of effective teaching and learning as matched cohorts are followed through the process. Below is the progression data for our 2017 Year 6 and Year 8 cohorts. Predicted effective learning would result in similar stanine means from test to test. The growth in Writing can be attributed to measures taken at Mentone Grammar in recent years to enhance the literacy program. Other results have been examined for contributing factors and possible improvements to teaching and learning practices.
Matched Year 6 cohort 2015 - 2017
Matched Year 6 cohort 2015 - 2017
59 students sat both tests
59 students sat both tests 2015
2017
2015
2017
Test
Mean Stanine
Mean Stanine
Test
Mean Stanine
Mean Stanine
Maths Performance
6.00
Reading Comprehension
5.80
5.85
Maths Performance
5.86
5.85
5.93
Reading Comprehension
5.90
5.89
Spelling Written Expression
5.83
4.92
Spelling
5.40
5.56
5.37
5.49
Written Expression
5.46
5.64
GREENWAYS LONGITUDINAL STUDY Assessment data from students who undertook Achievement Tests conducted by Allwell Assessment Services late in their Year 8 school year and then again early in Year 10 (Matched Cohort) is used in this analysis. The assumption is that growth or otherwise can be mostly attributed to their Year 9 Academic Year (since 2014 spent in the Greenways Campus). The figures highlighted are the Mean Stanines of the matched students. State Average for achievement in each of these tests is Stanine 5. Therefore, if a student learnt as predicted their achievement stanine should remain the same in subsequent testings as compared to others in the State. The table below compares the data from two years prior to the implementation of Greenways (when 94 was operating), with the five years that it has been running. The final columns highlight the value adding due to learning in the Greenways Campus. The data shows positive growth compared to the pre-Greenways years and general improvement across all areas.
94
Greenways
Yr 8 Yr 10 2010 2012
Yr 8 Yr 10 2011 2013
Yr 8 Yr 10 2012 2014
Yr 8 Yr 10 2013 2015
Yr 8 Yr 10 2014 2016
Yr 8 Yr 10 2015 2017
Yr 8 Yr 10 2016 2018
Maths
5.91
6.16
4%
6.27
6.25
0%
6.30
6.46
3%
6.29
6.57
4%
6.22
6.83
10%
6.19
6.78
10%
6.20
6.27
1%
Reading
5.25
5.14
-2%
6.09
6.03
-1%
5.95
6.34
7%
6.22
6.36
2%
5.87
6.22
6%
5.87
6.25
6%
6.01
6.29
5%
Spelling
5.72
4.88 -15% 6.16
5.43 -12% 5.98
5.50
-8%
5.88
5.49
-7%
5.62
5.38
-4%
5.77
5.75
0%
5.39
5.67
5%
Written Expression
5.09
4.94
5.97
6.44
10%
5.55
6.16
11%
5.65
5.73
1%
5.65
6.04
7%
5.65
6.24
10%
-3%
5.74
4%
5.83
Performance decline Improvement
15