2040 PARK SYSTEM MASTER PLAN
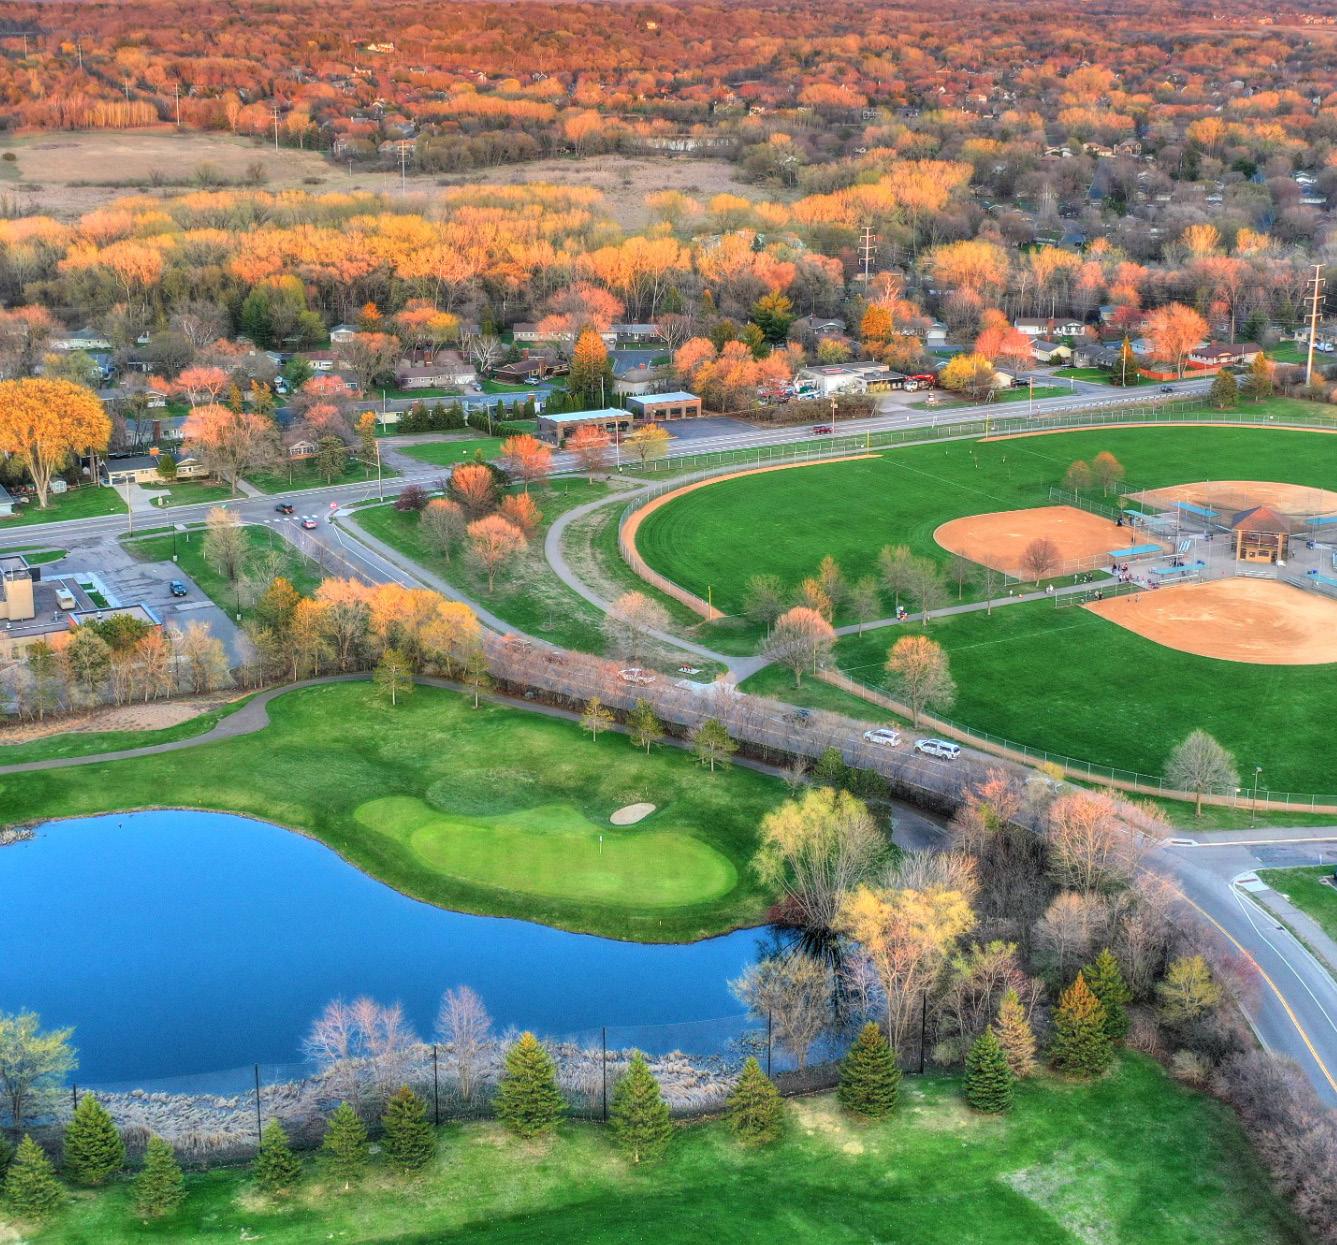

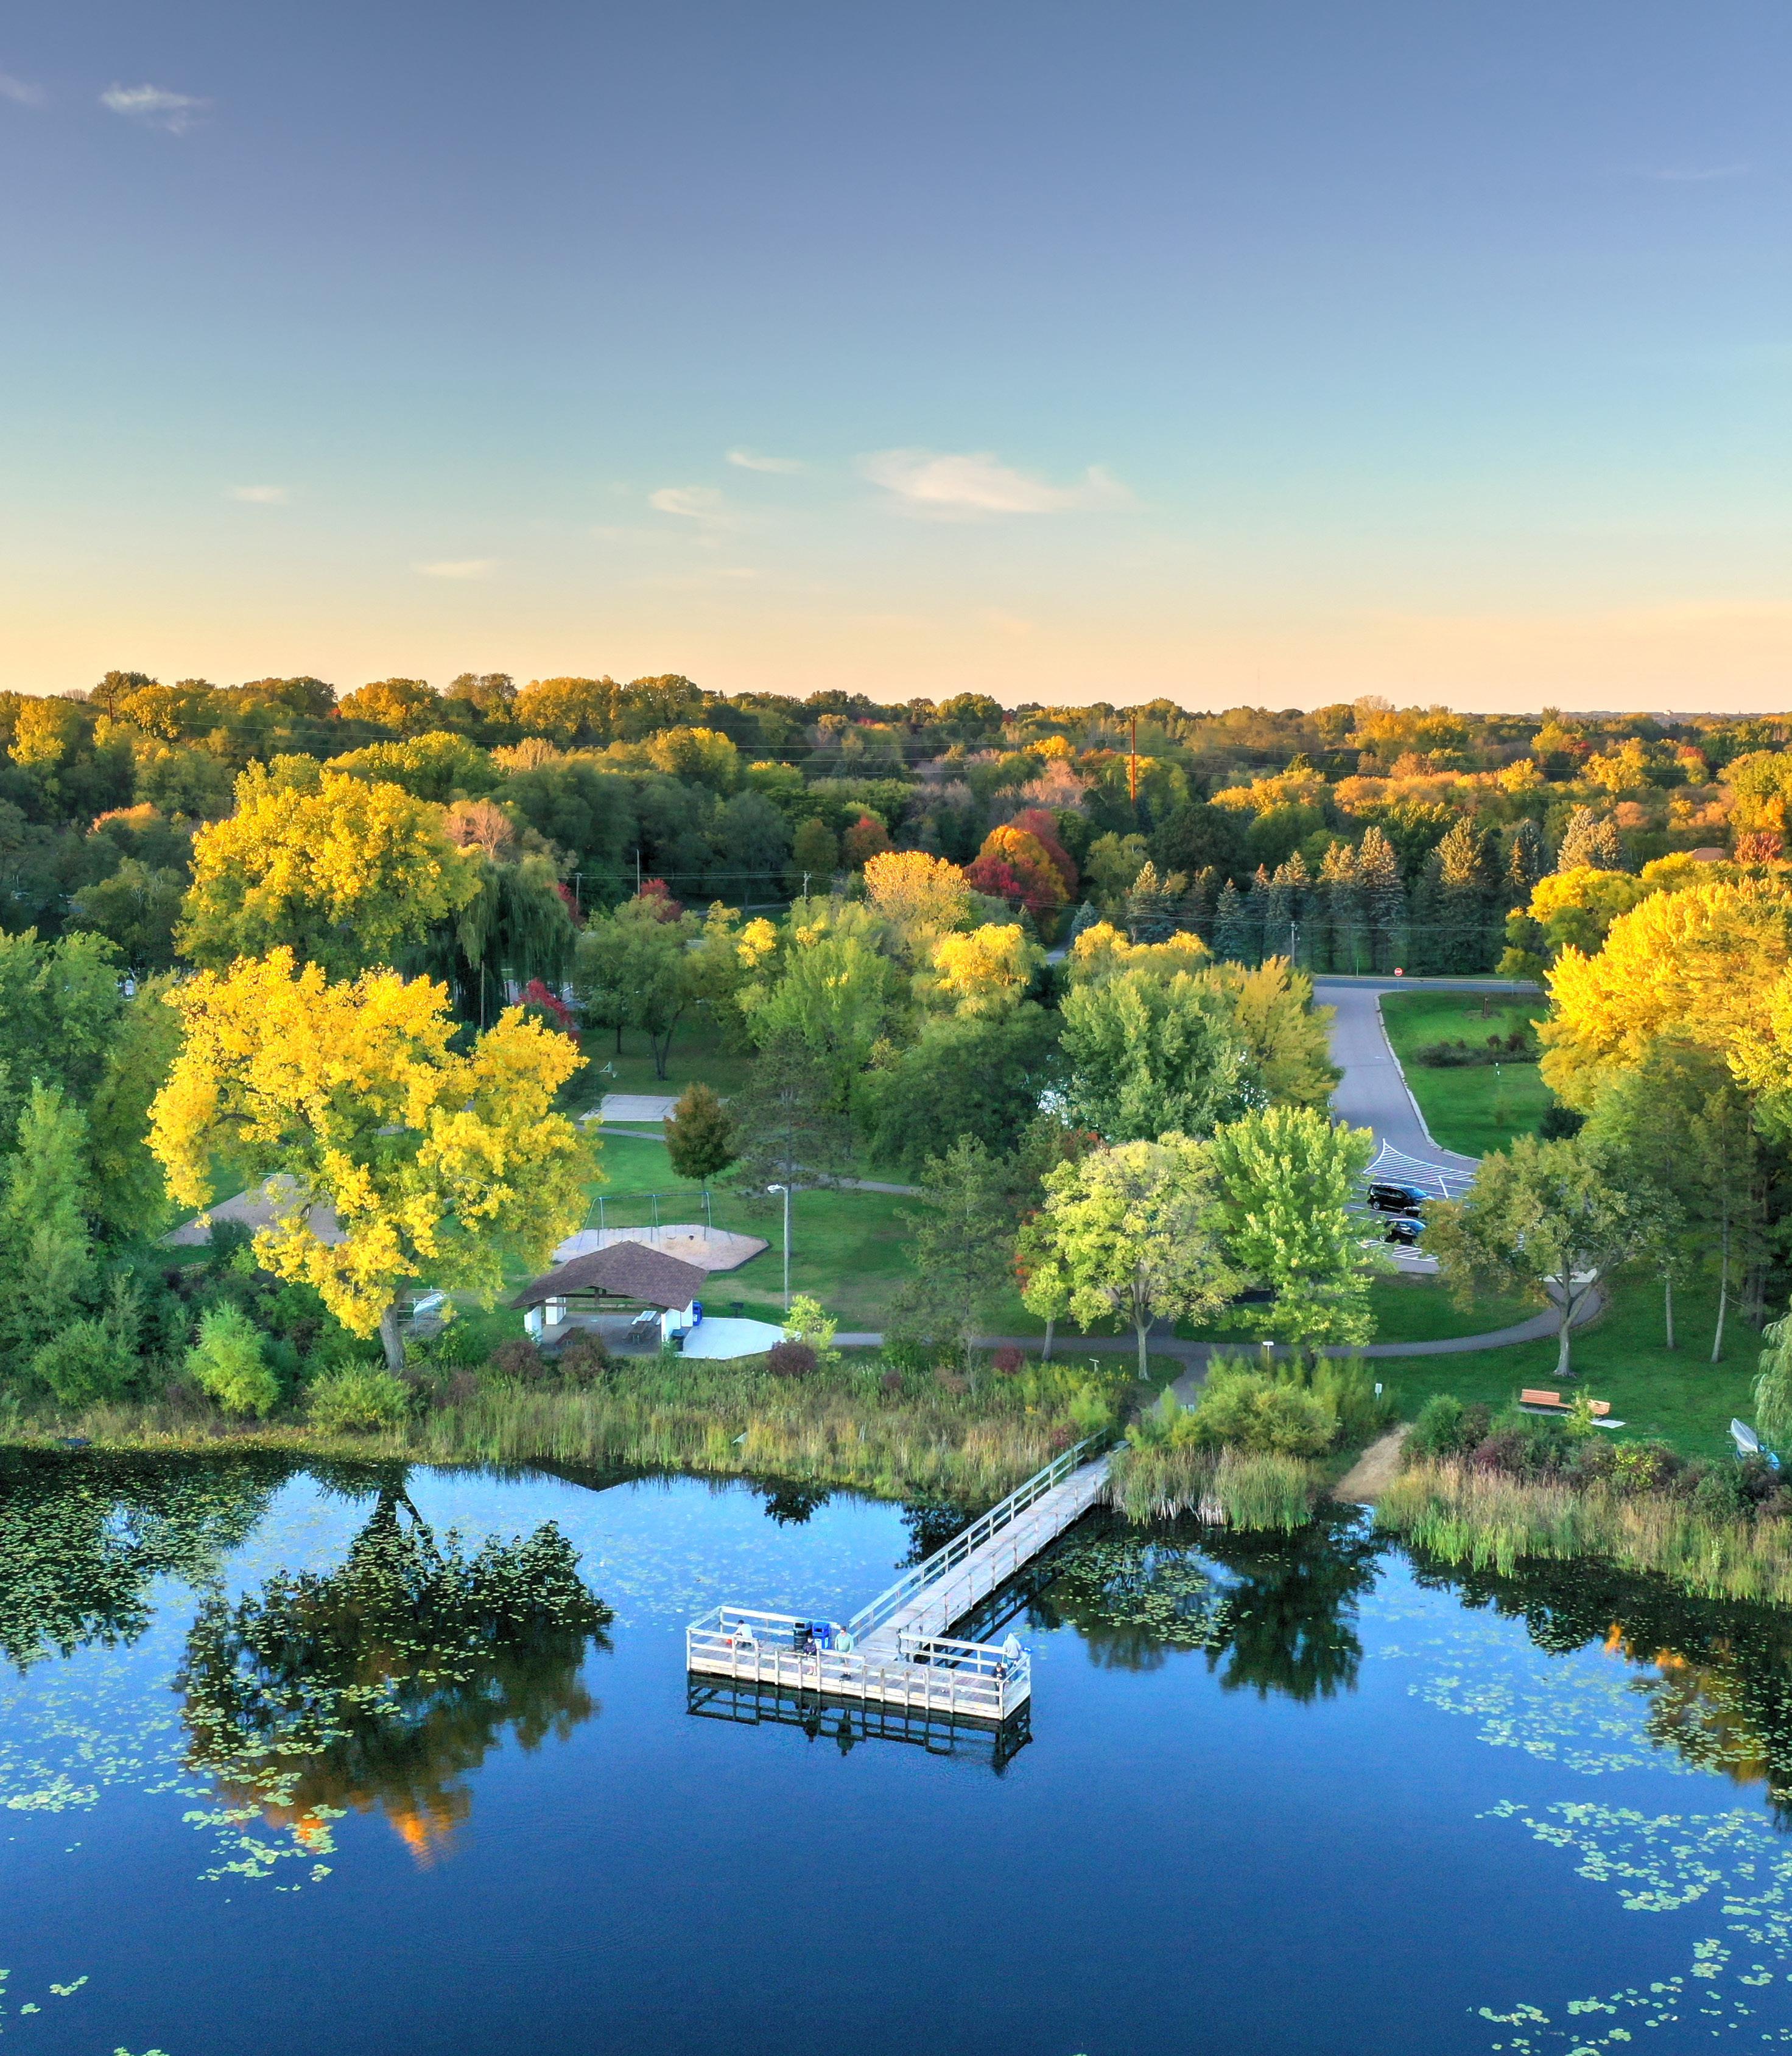


The 2040 Mendota Heights Park System Master Plan is the result of dedicated and ongoing collaboration among residents, elected officials, City staff, and stakeholders. The Plan was shaped by the contributions of all of these individuals. The City of Mendota Heights thanks all who have contributed to this Plan.
Mayor Stephanie Levine
Councilor Sally Lorberbaum
Councilor John Maczko
Councilor John Mazzitello
Councilor Jay Miller
Councilor Joel Paper
PARKS AND RECREATION COMMISSION
Chair Jaffrey Blanks
Commissioner Tica Hanson
Commissioner Stephanie Meyer
Commissioner Michelle O’Conner Muller
Commissioner Jo Schifsky
Commissioner Dan Sherer
Commissioner Michael Toth
Commissioner Jennifer Weichert
Commissioner Daniel Van Lith
Student Representative Meg Murphy
Student Representative Evangeline Fuentes
Dakota County
ISD 197
City of West Saint Paul Tri District Community Education
TRAA: Two Rivers Athletic Association
SALVO Soccer
West Saint Paul Hockey Association
Active Adults Focus Group
Families and Disability Focus Group
CONSULTANTS
Confluence
Pro’s Consulting
The 2040 Park System Master Plan is a clear, 15-year vision for the City’s parks and open spaces, providing guidance on resource allocation, identifying system-level opportunities, and documenting communityidentified focus areas to prioritize potential improvements and development.
The City of Mendota Heights Park System— encompassing over 296 acres of active parks, trails, cultural sites, and natural open space— helps define the City’s scenic, natural character and enhances residents’ quality of life by offering access to nature, recreational opportunities, and community-building events.
Despite its significance, high usage, and the community’s evolving needs over recent decades, the last major system-wide investment in the parks occurred in 1989 when voters approved a parks-focused referendum.
The purpose of the Park System Master Plan is to provide a high-level assessment of the existing park system’s service levels and, through collaboration with community members, City staff, regional partners, and elected officials, identify opportunities for preservation, improvement, and development. This plan ensures that Mendota Heights parks are well positioned to meet both current and future community needs while adapting to regional changes. Notably, this is the first Master Plan for the Park System in the City’s history.
PROVIDED INPUT DURING THE MASTER PLANNING PROCESS THROUGH A VARIETY OF ENGAGEMENT TOOLS. THEIR FEEDBACK DEFINED THE MISSION AND VISION OF THIS MASTER PLAN.
This Master Plan is the result of a 16-month comprehensive planning process that included targeted community and partner engagement. This document synthesizes all the findings and recommendations from this process. All full length stand alone reports and summaries have been included in this document as appendices and will be cited throughout.
This document has four parts:
• Planning Process Overview: Summarizes how the City of Mendota Heights, in collaboration with community members and stakeholders, developed this plan. It provides a high-level overview of the engagement activities that informed the planning process.
• Level of Service Assessment: Reviews the existing park system as a whole and identifies strengths, opportunities, and potential gaps. It provides key background information on demographics, recreation trends, and programming in reference to national standards.
• Park System Mission, Vision, & Recommendations: Defines the key priorities of this plan through clear mission, vision, and guiding principles.
• Implementation: Provides guidance on how to use this for capital planning, detailed design, partnerships, and park dedication expenditures. It discusses how to track progress and ensure accountability to the public.
The 16-month master planning process consisted of five defined stages, each building upon the previous phase to ensure a thorough, data-driven foundation for all recommendations and implementation plans. This comprehensive approach allowed for an in-depth assessment of the existing park system, community needs and priorities, and the feasibility of proposed improvements.
Additionally, the process emphasized thoughtful engagement with community members and elected officials, providing ample time to address questions and concerns.
Below is a brief stage-by-stage overview of the project.
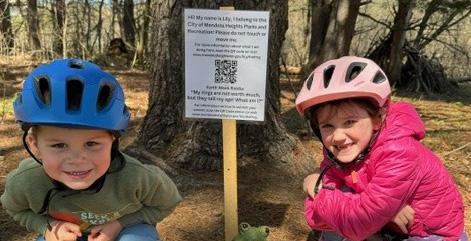
completed a comprehensive evaluation of the current parks and recreational facilities, programs, staffing, and financial resources
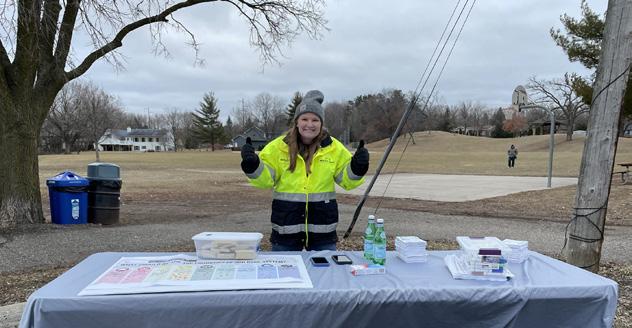
gathered input from residents, stakeholders, and user groups using diverse tools to ensure the plan reflects community needs. This included online surveys, focus groups, and direct outreach to foster meaningful dialogue and gather diverse perspectives
identified strengths, gaps, and opportunities for improvement by analyzing data from the existing system assessment, community engagement, national trends, and community demographics
identified key priorities, potential improvements, and developed a strategic framework to guide future investments and decision-making through establishing a long-term vision
finalizes the master plan by compiling community input, assessment findings, and strategic recommendations into a clear, actionable document

Mendota Heights is a small, affluent suburb in the southeastern portion of the Twin Cities with a lower population density, higher median income, and smaller household sizes when compared to the larger Twin Cities metro area. Most residents are long-term homeowners, and the population is predominantly white, with limited racial and ethnic diversity. The population is fairly stable, with only 600 new residents expected to join the Mendota Heights community in the next 15 years.
As a result, park planning should prioritize accessibility and amenities that cater to older adults and multiple generations. This includes expanding passive recreation options, such as walking trails, seating areas, and social gathering spaces, rather than focusing solely on playgrounds and sports facilities. Given the community’s stable population, the level of service outlined in this plan will remain relevant in the coming years. However, regular assessments are necessary to align with evolving national standards.
4,787
Total households in Mendota Heights from 2017-2021.
The average household size in Mendota Heights is 2.37 persons per household.
The Twin Cities metro has an average household size of 2.53 persons per household
4,809
Total housing units in Mendota Heights from 2017-2021. 55.7% of householders moved into their homes before 2010.
115 Vacant Units
3,927 Owner-Occupied Units
767 Renter-Occupied Units
$120,257
Median household income in Mendota Heights from 2017-2021. The median household income in the Twin Cities area is $94,098 and $74,755 in the USA.
The projected median household income in Mendota Heights for 2038 is $166,217.
The percent population of the Twin Cities area with a disability is 10% 8.1%
Percent population of Mendota Heights with a disability from 2017-2021.
To gain a deeper understanding of the community’s needs, the City engaged with the broader community, a targeted group of residents, and partners to explore their visions for the park system. Through online surveys, pop-up events, direct outreach, and focus group discussions, thousands of ideas and insights were gathered about the current park system and future priorities. A comprehensive summary of the engagement efforts is available in Appendices 1 and 2.
While community engagement was an ongoing component of the master planning process, there were two primary phases for capturing public input. The first phase, conducted at the beginning of the master plan, aimed to gather community opinions and insights on the existing park system and whether it met their needs (Master Plan Appendix 1). Residents were also asked to share their initial vision for the future of the park system.
In both phases of engagement, the community members expressed that the parks and trails throughout Mendota Heights are highly valued and widely used. However, there is strong interest in diversifying and updating park amenities to be more flexible, inclusive and consistent with current park design practices. Additionally, the community identified a need for indoor recreation and gathering spaces. Some larger priorities emerged, including comprehensive accessibility and trail system improvements, an inclusive playground, and park renovations. However, there is currently no dedicated funding source for large-scale projects and improvements. This current funding model would limit the feasibility of improvements.
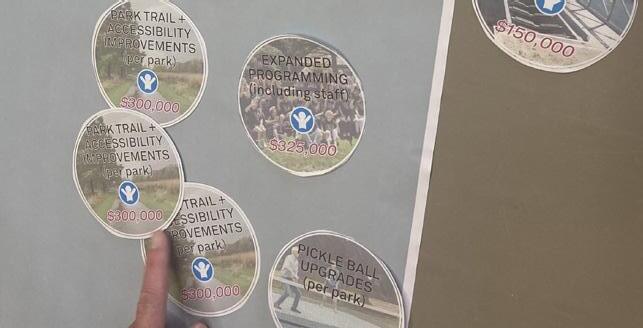
As such, the second phase of engagement sought community feedback on the findings from the first phase and assessed public opinion on additional funding needed to achieve the park system vision (Master Plan Appendix 2). The responses from the second phase reinforced the initial findings. Respondents generally supported expanded programming and select park system improvements. The majority also expressed willingness to support some level of increased funding to meet these needs and priorities.
In summary, input from both phases directly informed the development of the plan’s recommendations. These insights shaped the plan’s direction, leading to six key themes that emerged from the engagement process.
01| Recognition of Park System’s Value: Engagement participants emphasized the park system as a valuable asset to the Mendota Heights community and a key contributor to quality of life. The trail system and natural areas were especially appreciated.
02| Desire for Diversification of and Upgrades to Park Amenities: Park amenities should be diversified to better meet the needs and interests of all residents. Specifically, residents are interested in passive recreation amenities, community gathering, and connection to natural resources. Residents especially want flexible indoor community space for programming and gathering.
03| Need for Accessibility Improvements and Enhancements throughout the Park System: Accessibility is a concern across demographic groups. Residents would like to see improvements that both meet accessibility standards as well as offer unique, inclusive opportunities.
04| Preference for Enhancements Over New Development: There was limited support for new park development, with the community favoring projects that enhance the existing park system. The primary exception was the strong support for indoor community space.
05| Strong Support for Funding Expansion: Engagement participants strongly supported increasing funding for park improvements and staffing. Most survey respondents favored a tax referendum of some level- even though they were not given specific concepts to review. Rather they were asked if they generally supported the types of park projects listed. Further study should be completed by the City to explore potential funding expansions for the coming years.
06| Desire for Continued Planning:
Participants expressed a desire to see more specific concepts and designs for potential improvements suggested by the community through the master planning process. This would help the community focus in on specific parks of interest and prioritize projects in greater detail.
1. Residents like the scale, condition, character and locations of the existing parks and want this preserved in the future park system.
2. Connections between these parks and neighborhood connections leading into parks should be improved for overall safety and accessibility.
3. Park amenities should be diversified to better meet the needs and interests of all residents. Specifically, residents are interested in passive recreation, community gathering, and connections to natural resources. There was also a strong interest in aquatics programming.
4. Accessibility is a concern throughout the parks. Residents would like to see improvements that both meet accessibility standards as well as offer unique, inclusive opportunities within the park system.
5. Residents want flexible community gathering spaces - both indoor and outdoor.
1. Strong Support for Funding Expansion: Residents supported some level of expanded funding for park system improvements and/or staffing. A significant majority of survey respondents favored a tax referendum. This is particularly notable given that residents were not presented with specific designs but were instead asked if they generally supported the types of projects proposed.
2. Top Priorities Consistent with Phase 1: Echoing Phase 1 findings, the top priorities for expanded funding support included accessibility improvements, expanded programming and staffing, and increased indoor community space.
3. Preference for Enhancements Over New Development: There was limited support for new park development, with the community favoring projects that enhance the existing park system. The primary exception was the strong support for additional indoor community space.
4. Recognition of Park System’s Value: Engagement participants expressed that the park system is a valuable asset to the Mendota Heights community and an important contributor to quality of life. Some participants shared examples of amenities and programs from other communities that could serve as models for Mendota Heights.
5. Interest in Detailed Concepts: Participants expressed a desire to see more specific concepts and designs for potential improvements to better understand proposed enhancements.
Accessibility improvements
Walking and hiking trails
Aquatics (Splash pad/pool)
Updated playgrounds (Including fully inclusive playground)
Expanded programming
Field and diamond improvements
Accessibility, trail, and safe route improvements
Indoor gathering and recreation
Programming and staff
General park upgrades and improvements
New park development
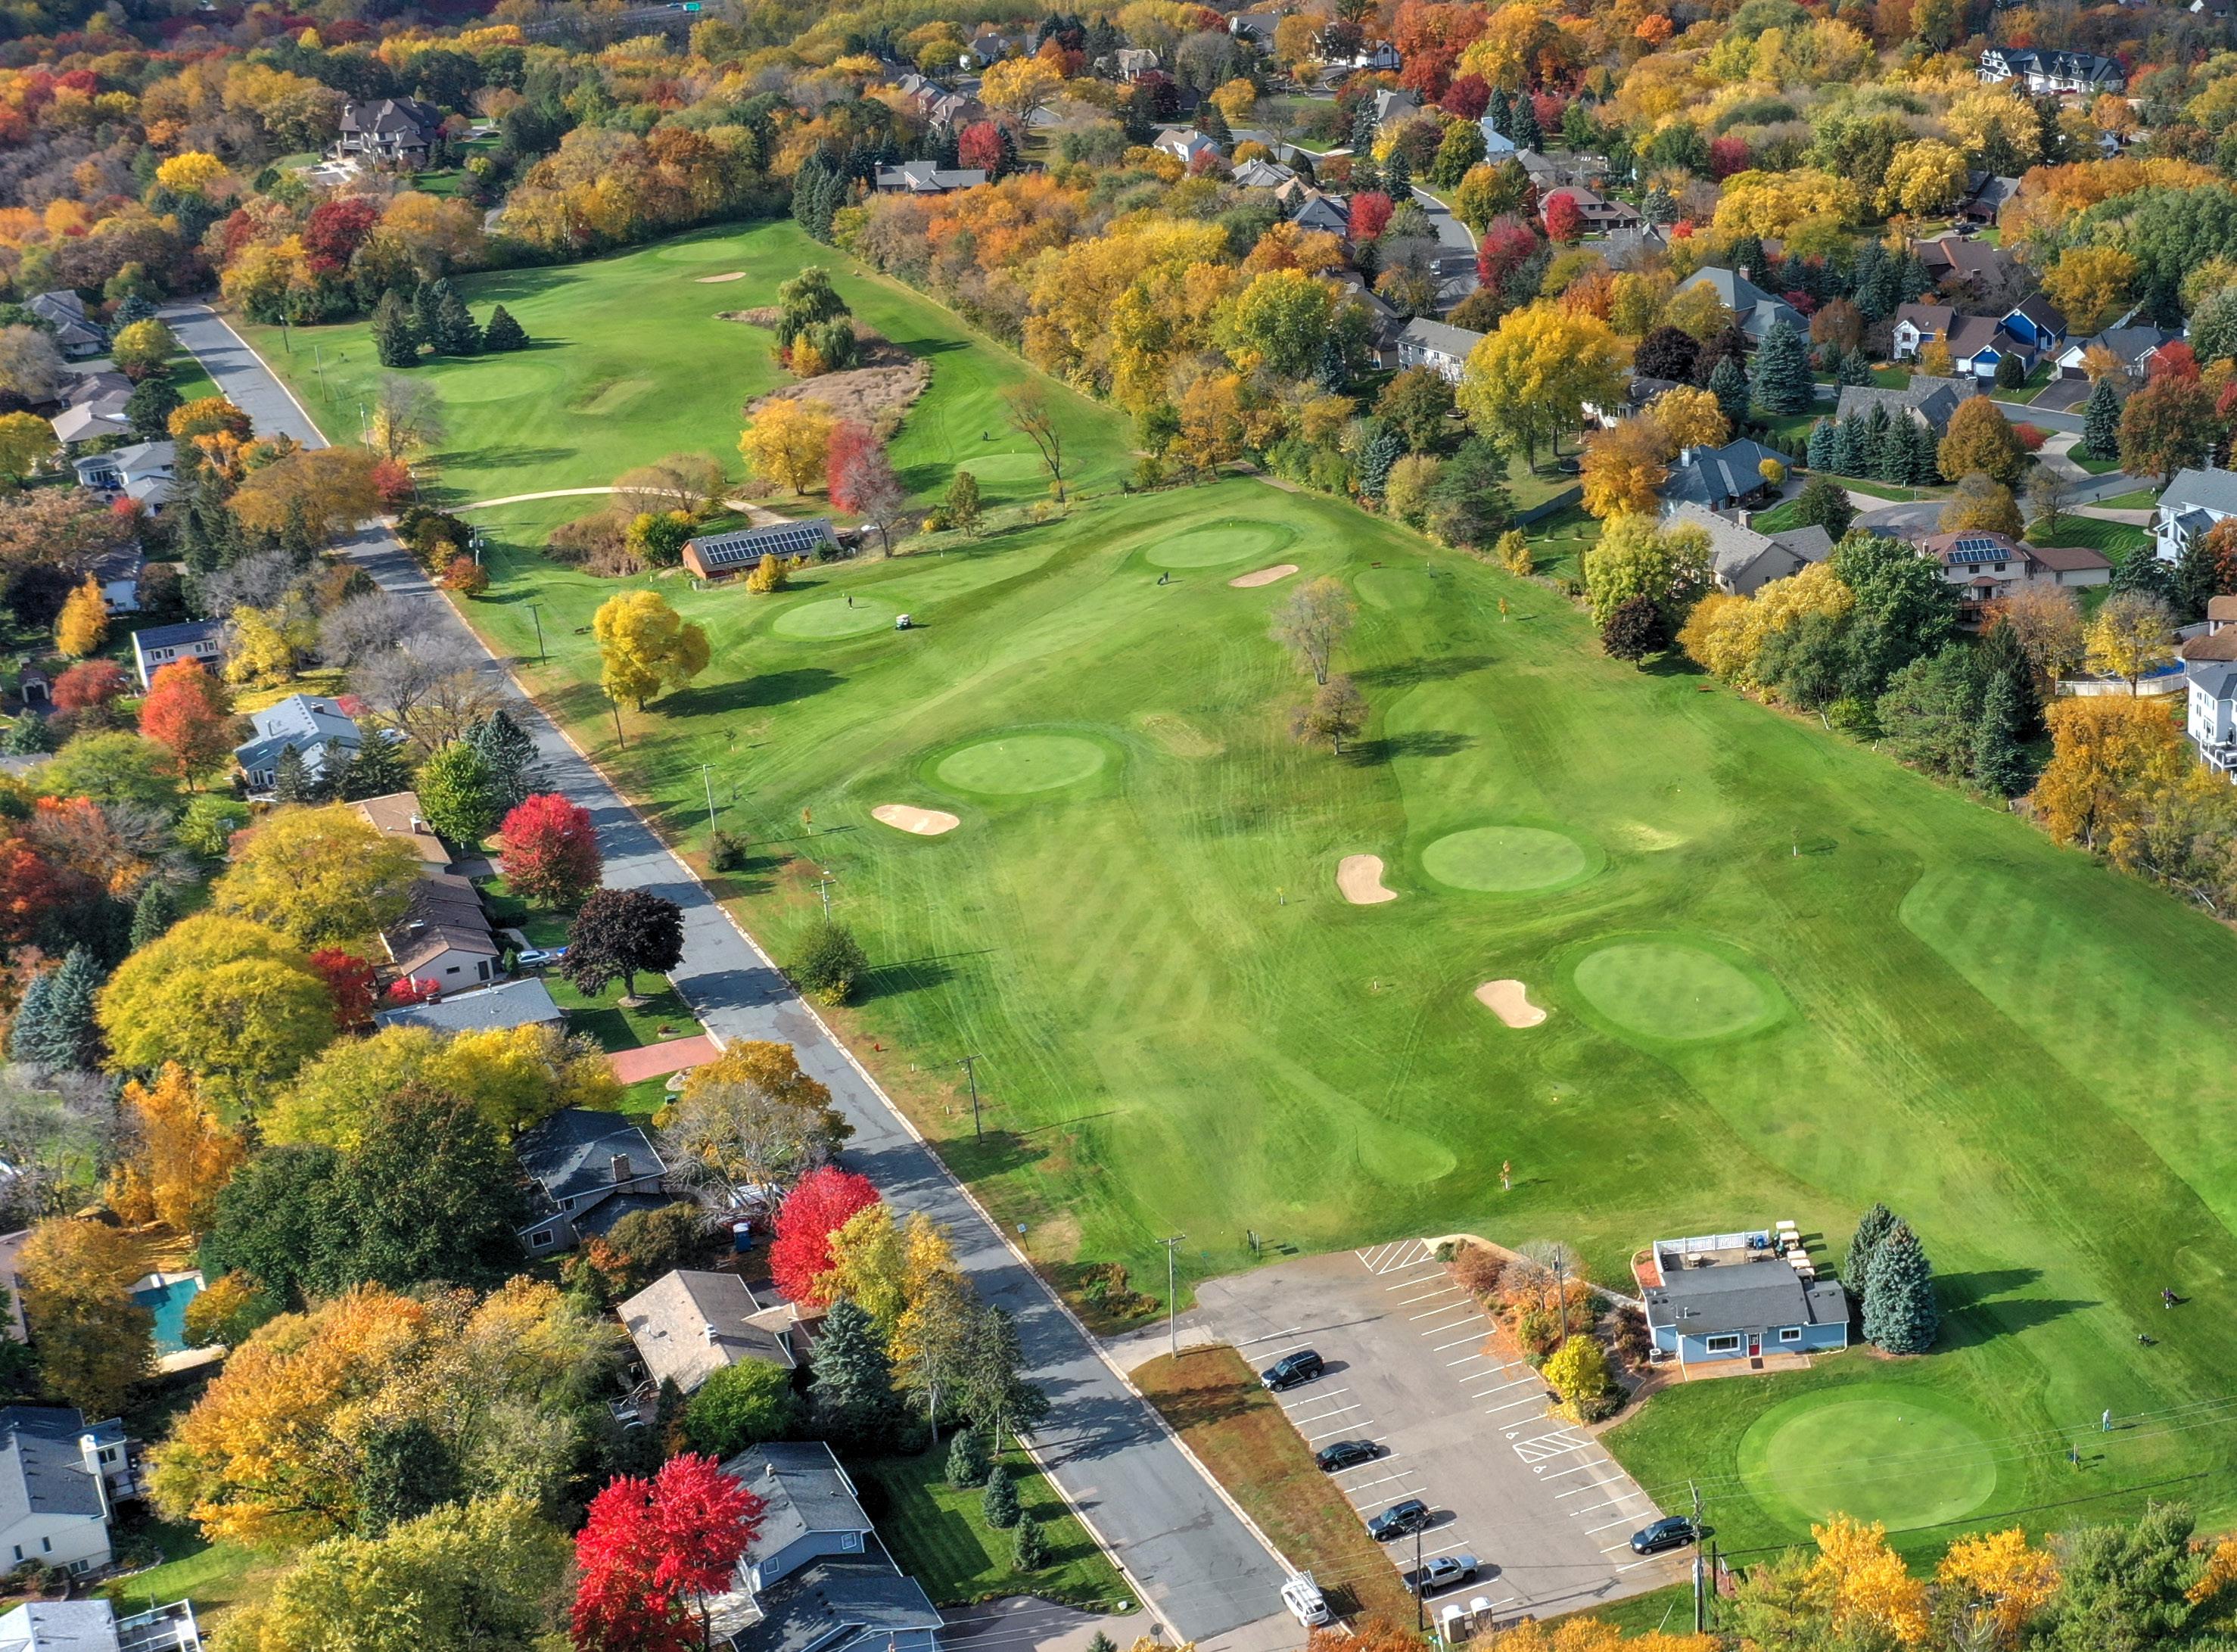
With over
296 acres of
parks and open space, the Mendota Heights Park System provides a range of amentities for its residents within the City.
Existing Park System Summary
The park system in Mendota Heights encompasses 17 parks, open spaces, and cultural sites. This includes Oheyawahe- a 112-acre site considered sacred by Dakota people - that is preserved as an open space.
The majority of the parks are smaller, neighborhood parks that serve nearby residents. They provide standard uniform amenities throughout the community, including courts, playgrounds, picnic areas, and ball fields. These neighborhood parks are complemented by three community parks - Rogers Lake, Mendakota, and Kensington - which offer unique and mostly recreational sports related amenities within the community. Rogers Lake is the only park with water access in the Park System.
There is also one golf course operated and maintained by the City. Mendakota Country Club and Somerset Country Club are private courses and clubs that add to the overall bucolic character of the City and provide private opportunities for recreation (private courses are not counted in the 296 acres of parks and open space).
Operated by Dakota County, the MendotaLebanon Hills and River to River Greenways provide a recreation and open space backbone to the City. They connect many of the City’s existing parks as well as connect Mendota Heights to neighboring communities. These trails complement the 6 miles of existing paved trails that are part of the City’s system.
44% of THE City’s park land is dedicated natural open space
of THE City’s POPULATION IS WITHIN 1/2 MILE OF A PARK


Overall, Mendota Heights is fairly well served in total park acreage per resident, primarily due to the large amount of open and natural spaces within the City. However, when compared to national standards for a City of its size, there is a need for neighborhood and community parks. As the City is nearly fully built out, adding additional acreage is difficult. As such, the existing parks should be planned to better meet diverse interests and accommodate a variety of users.
Reflective of its suburban development patterns and lower-than-average neighborhood park acreage, only 63% of residents live within a halfmile of a park. While there isn’t a single national standard for this metric, the City should aim for a 10-minute walk to a park for most residents. Park access outside of the half-mile walkshed could be improved by extending and enhancing multimodal trails throughout the park system.
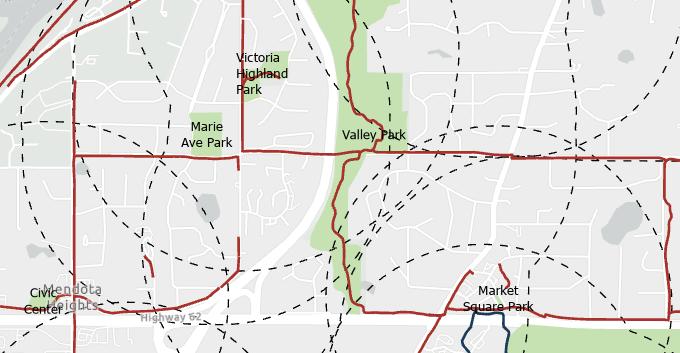
Mendota Heights’ parks are concentrated along the central spine of the City, with the highest concentration in the southeast and south-central areas. There are two significant park service gaps: a larger one in the southwest and a smaller
one along the border with West Saint Paul. The western park gap is in an area with higher levels of industrial and commercial development, but recent multifamily development in the area has increased the need for park access and programming.
Additionally, the parkland adjacent to the western park gap—the Dog Park—is minimally developed and could benefit from diversified amenities to better serve the broader community. This park is also near a known cultural site, and there is a high likelihood that the land may have archaeological significance. A high level of due diligence and a feasibility study should be completed before making any development recommendations.
Alternatively, the City owns an 11.65-acre parcel on the western side of the City that presents an opportunity for potential park development. Additional study should be completed to assess feasibility and interest.
SEE MASTER PLAN APPENDIX 3 FOR PHASE 1 SUMMARY INCLUDING LEVEL OF SERVICE.
The Park System Master Plan consists of five park classifications. Each classification serves a particular purpose in meeting park and recreation needs and are necessary to ensure that the City’s system is well-balanced and efficient. This plan recommends all current park classifications remain.
Park Type
Neighborhood Parks *
Community Parks *
Open/Natural Areas *
Mini-Parks
Special-Use Parks
Definition
Neighborhood parks are the foundation of the park system and serve as the recreational and social focus of the neighborhood. They accommodate a wide variety of age and user groups, both children and adults. They create a sense of place by bringing together the unique character of the site and the neighborhood.
Community parks are designed to meet the recreational needs of several neighborhoods or larger segments of the community. They are intended for ball fields, larger athletic facilities, and community gatherings.
Natural resource areas are lands set aside to preserve significant or unique landscapes. They are often, but not always, properties with steep slopes, drainage ways, ravines, or wetlands. In addition, there may be locations where local tree protection, or state and local wetland ordinances restrict development.
A mini-park (also called a pocket park) is a small, publicly accessible green space typically less than an acre in size, designed to serve nearby residents, workers, or visitors.
Special-use parks are designed for a specific purpose or activity, rather than general recreation. These could include sports complexes, golf courses, cultural sites, or outdoor recreation.
*Park type definitions from the City of Mendota Heights 2040 Comprehensive Plan Update
The Equity Prioritization Tool is a data-driven planning tool that identifies areas for park planning and investment prioritization by determining which parks serve the highest concentration of community members underrepresented in park use and/or historically underserved by park systems throughout the greater metropolitan area. Integrating this tool into the planning process helps ensure that future projects reduce barriers for participation, are developed to engage underrepresented communities, and promote fairness and inclusivity. This integration of data-driven equity prioritization is required to ensure consistency with larger regional park planning priorities.
Below shows the priority ranking for each of the individual parks based on the adjacent community demographics. This ranking should be taken into account
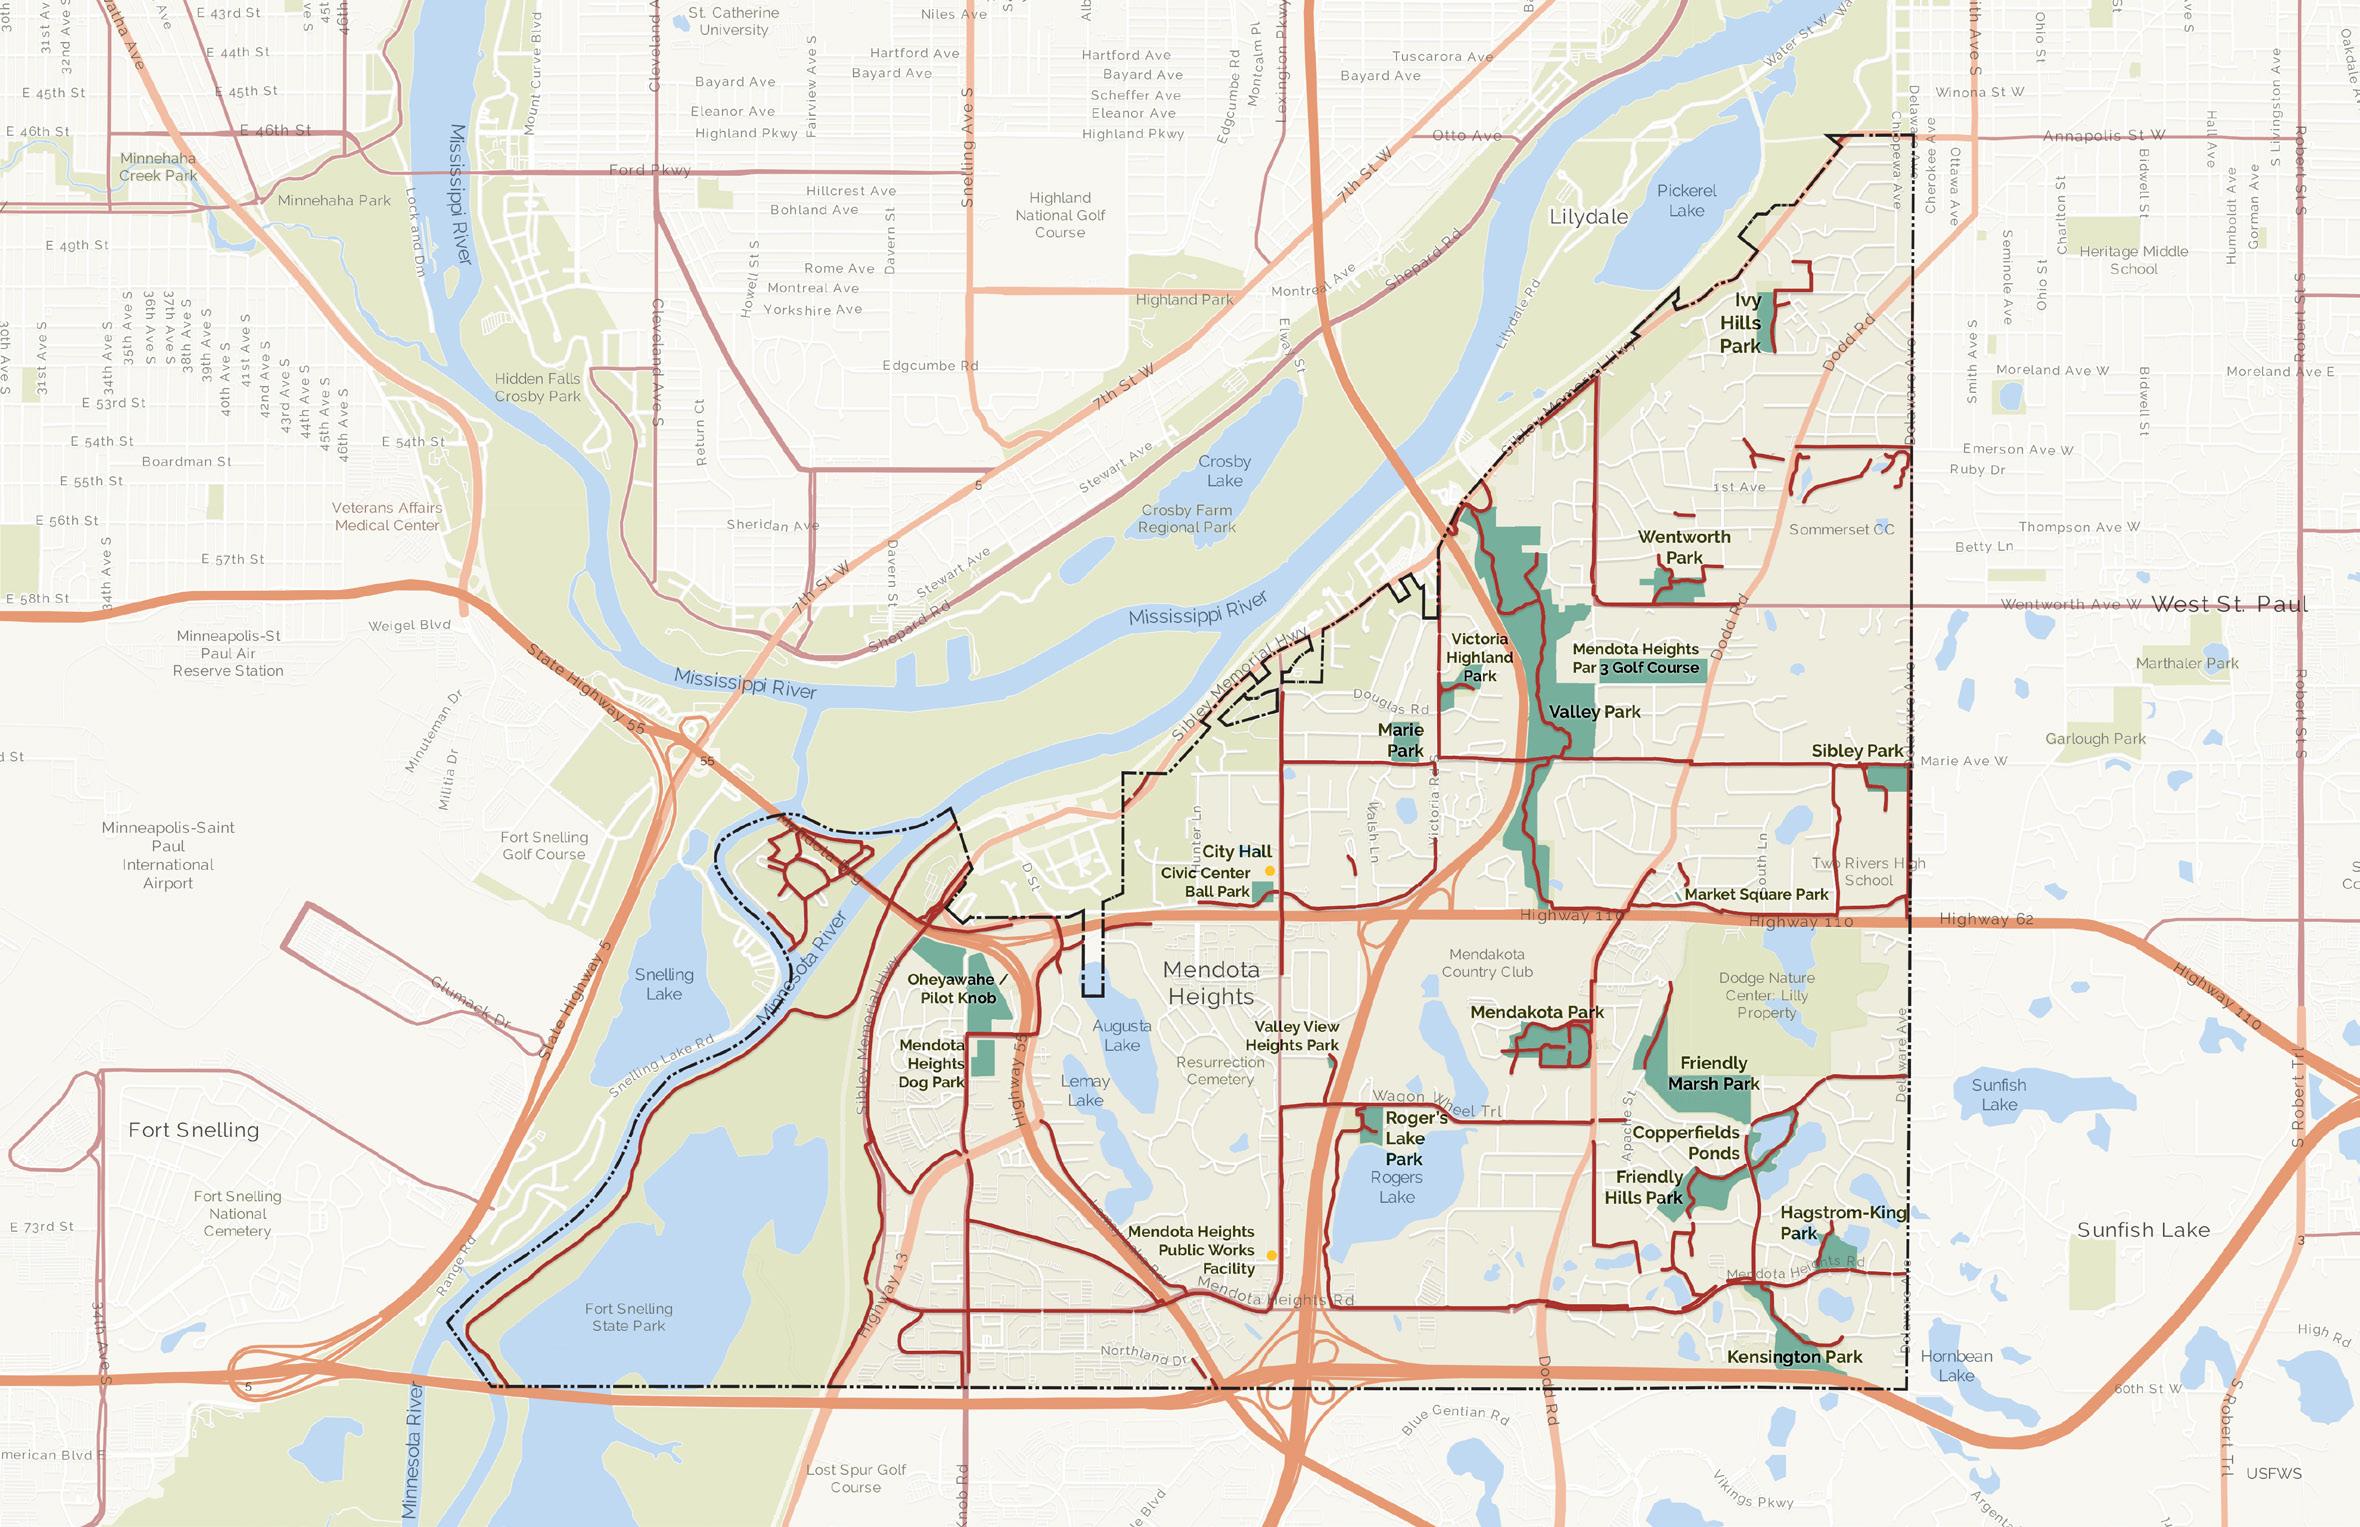

several of the parks in the existing park system have been identified as HIGH PRIORITY PLANNING opportunities. This designation is meant to help PRIORITIZE FUTURE RESOURCE ALLOCATION FOR PLANNING AND POTENTIAL DEVELOPMENT. REASONING FOR THE DESIGNATION IS PROVIDED IN EACH OF THE INDIVIDUAL PARK DESCRIPTIONS.

As part of the Level of Service Analysis, the number of park amenities by type was compared to national recommendations set by the National Recreation and Park Association (NRPA). These benchmarks reflect typical park systems based on population and density. The analysis found that Mendota Heights met or exceeded national recommendations for most amenity types, including courts, fields, shelters, and trails (see Appendix 3).
Similar to the overall distribution of park services, amenities were concentrated in the central and eastern parts of the City, while the west side lacked key features such as playgrounds, trails, courts, and picnic areas. The primary park in this area functions mainly as a dog park, limiting its recreational offerings for residents.
Of particular note, the number of ball fields/ diamonds and playgrounds within the Mendota Heights park system far exceeded national recommendations—roughly three times the suggested number of ball diamonds per resident. Both ball diamonds and playgrounds are highly resource-intensive park features. Additionally, a review of playgrounds identified accessibility challenges for individuals with physical disabilities and neurodiversity, as well as a lack of variety in available playground types. The City could benefit from a destination playground in a central location to serve a wider range of users.
One of the most significant gaps in the park system is the lack of indoor recreation and programming space. This is particularly problematic for communities in northern climates, as it severely limits services during the colder months and reduces year-round offerings for individuals who require indoor spaces for comfort and recreation.
In addition to the absence of indoor recreational space, there is a lack of water-based activities— both of which are recommended amenities for a community of Mendota Heights’ size and population.
The top five parks identified by the Equity Prioritization Tool were the Dog Park, Wentworth, Ivy Hills, Mendakota, and Marie. This assessment identifies those parks with the highest concentration of individuals historically underserved by park systems within their
primary service area. This equity ranking should be used to prioritize future site planning and improvements.
Site assessments of individual parks found that properties were generally well-maintained and in fair to good condition. Consistent with the park system inventory, site visits confirmed that parks across the system feature similar amenities. This presents a strong opportunity to diversify amenities based on community-identified needs and national trends.
A key takeaway was the need for accessibility improvements throughout the park system. Basic access to key site features was limited in most parks. It is recommended that the City conduct a comprehensive accessibility assessment to prioritize necessary improvements and develop a strategy for addressing system-wide accessibility concerns.
Additionally, there is a general need for improved internal and external multimodal connectivity, as well as safer routes, alongside accessibility improvements. Addressing these needs will require tailored solutions for each individual site.
Civic Center is a 17.6-acre neighborhood park located next to the Mendota Heights City Hall and Police Station. The current amenities are limited to a large natural area, a walking trail, and baseball diamond. Residents exercise along the trail and baseball games and practices are hosted at the baseball diamond often.
The park is in good condition. It would benefit from accessibility improvements - specifically accessible walkways - to the baseball diamonds.
If the City proceeds with building a new City Hall in the future, the current City Hall could be renovated as an indoor recreation space and the adjacent parkland master planned to meet more generalized community needs, complement any interior recreation space, and leverage the natural resources. At that time, a master plan of this site should be completed.


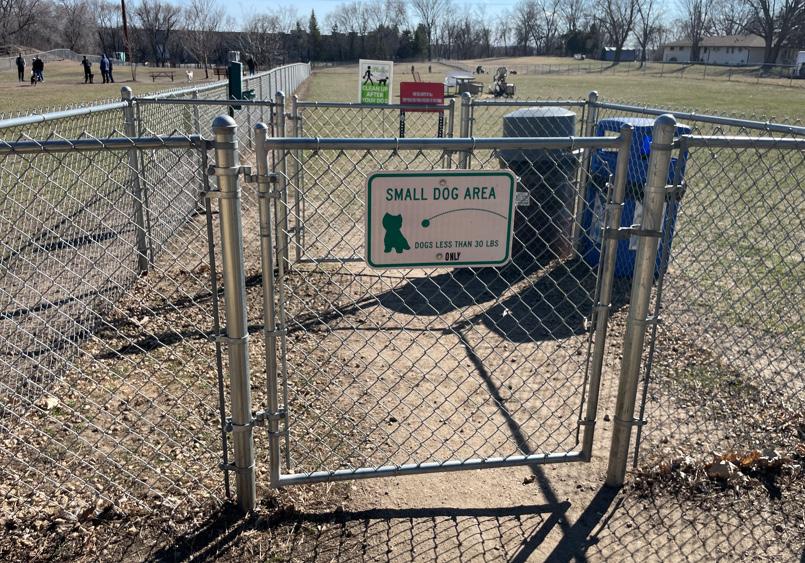
The Dog Park is a 8.2-acre minimally developed neighborhood park. Current amenities are limited to two large fenced in off-leash dog runs and a small seating area with a shade structure. Visitors also bring movable lawn chairs to the park. This park is highly used by the community.
This park has been identified as an opportunity for future planning. It is located adjacent to the park system gap and is located in the area of the City with the highest proportion of historically underserved communities. It’s location as well as its current lack of development makes it a unique resource for the community for future planning.
Future planning should be approached with a high level of due diligence. The park is located across the street from the culturally significant Oheyawahe site. Although no archaeological study has been conducted within the dog park boundaries, one should be completed prior to any future development.
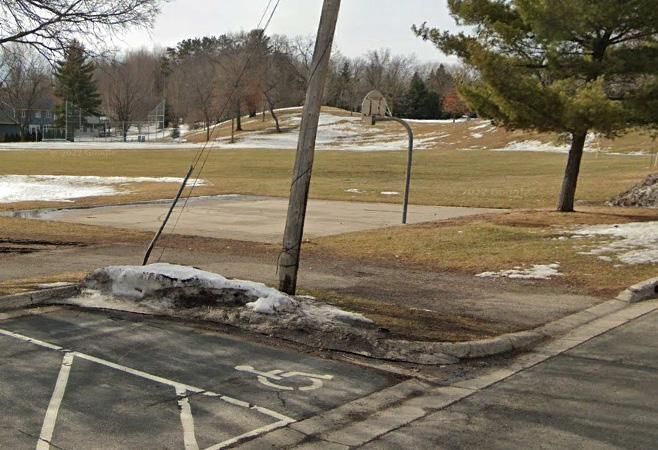
Friendly Hills Park is a neighborhood park that contains trails, a natural area including a pond, a hockey rink with seasonal pickleball courts, a baseball diamond, picnic shelters, and tennis courts. There is also a hill that can be used for sledding in the winter.
The park would benefit from improved connecting walkways throughout the site. A redesign and relocation of the basketball court and playground could also enhance user safety and overall usability. Community feedback should be sought to evaluate the value of the multi-use diamond at this location. The central natural pond is a valuable feature of the park and would benefit from ecological restoration.
Friendy Marsh Park is a Natural Area Park with paved walking trails. This large park contains wetlands and grasslands and is adjacent to the Dodge Nature Center. It is a valuable natural resource within the park system and the City should continue to support natural resource restoration and preservation efforts within it.
Hagstrom-King
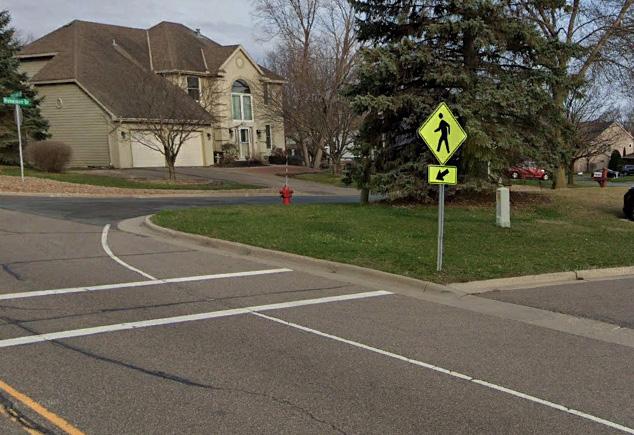
Hagstrom-King Park is a 9.6-acre neighborhood park featuring a large playground, a basketball court, and a baseball diamond. It also includes natural areas and a trail that connects to nearby neighborhoods. The park—particularly the baseball diamond—is well maintained and appears to be in good condition. However, the park would greatly benefit from improved walkways and enhanced accessibility throughout. Currently, it lacks a safe pedestrian entrance. Additional accessibility improvements should include accessible routes to site amenities and accessible play surfacing.

Ivy Hills Park is a well-maintained neighborhood park featuring tennis courts, a trail, a baseball diamond, a basketball court, a picnic area, and a playground. The park’s features and amenities are highly compartmentalized. It would benefit from accessible, passive recreation amenities located adjacent to more active features (e.g., a gathering area near the lawns or courts, or a picnic shelter near the playground). The stormwater wetland is a valuable park asset and could be further utilized for passive programming.
The park is also adjacent to privately owned open space. Clearly delineating between areas with public access could be better defined.

Kensington Park is a community park that contains high quality soccer fields, a playground, picnic areas, restrooms, and a concession building. The concession stand is no longer used as tournaments are no longer held in this park due to parking constraints.
The primary driver for the limited use of this park for field sports is the parking limitations. The fields are in excellent condition. Additional study and master planning work could explore potential design solutions to address this limitation and improve usability for the best multi-use fields in the City.
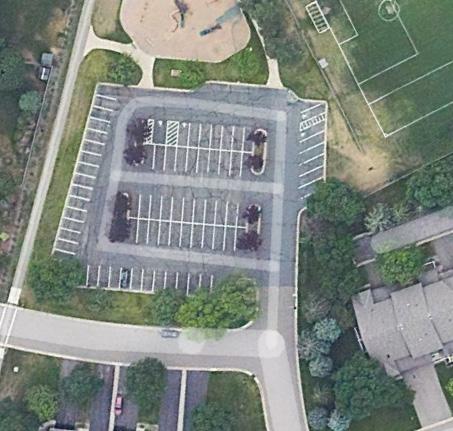
Marie Park is a neighborhood park that contains tennis courts, a hockey rink with seasonal pickleball courts, a warming house, a playground, a baseball diamond, and a basketball court. This neighborhood park is frequently in use and has received positive feedback during community engagement for future improvements. The courts and warming house are well situated in the park. However, there is significant safety concerns in the location and design of the existing playground. Additional planning that accounts best practices for locating play areas should be considered when the playground is flagged for replacement.
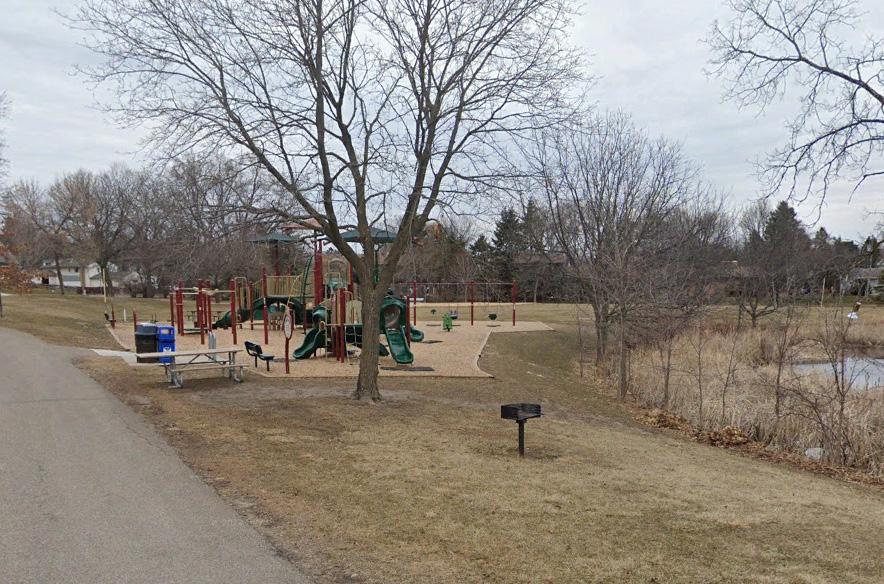
Market Square Park is a 0.24-acre mini park located within the Village of Mendota Heights development. Nestled between shops and other businesses, the park offers space for picnics and community gatherings.

Mendakota Park is a 20.9-acre community park centrally located within the park system and serves as the primary venue for community events. Its main features include a large softball/baseball complex with four fields, a concession stand, and restrooms. Additional amenities include a basketball court, picnic shelter, playground, soccer field, volleyball court, and trails. Given its size, central location, and long-standing use, the park is well positioned to remain a key asset within the system. However, both active and passive recreation opportunities could benefit from overall improvements and updates to better meet the evolving needs of the City and park users. Potential

enhancements include a comprehensive accessibility assessment, playground upgrades, and field improvements to better accommodate youth sports.

Valley Park is a 93.5-acre park featuring a trail system, tennis courts, a basketball court, a playground, a baseball diamond, and a picnic area. Its most notable feature is the expansive natural area—an urban forest—that runs the length of the park, buffering adjacent neighborhoods from I-35E. Additionally, Valley Park contains a significant portion of the River to River Greenway, connecting the City to the Mississippi River.
The park’s main amenities are concentrated near the entrance off Marie Avenue. The basketball court, playground, and baseball diamond are located directly adjacent to the parking area with minimal barriers, creating potential user conflicts and safety concerns, particularly for playground and basketball court users.
Given its location along the regional trail system, opportunities for partnerships with Dakota County, valuable natural resources, and the need to address safety concerns related to park amenity placement, Valley Park has been identified as a priority for future planning.
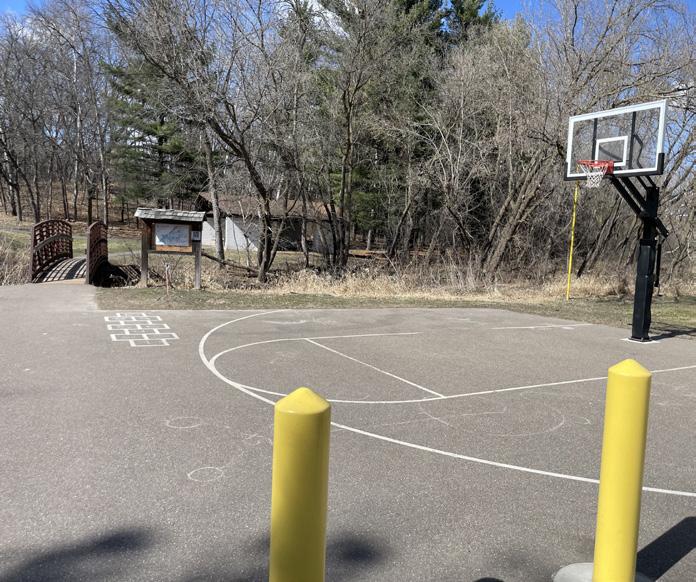
Victoria Highlands Park is a well-maintained 6.7-acre neighborhood park that contains a baseball diamond, a playground, a basketball court, and a walking trail. There are also picnic tables near the playground.

Wentworth Park is a 10.4-acre neighborhood park that offers a wide range of amenities, including a basketball court, a hockey rink with seasonal pickleball courts, picnic shelters, a playground, tennis courts, and a youth softball field. It also features a warming house to support winter activities and includes natural areas. While the park is highly programmed, it could benefit from more flexible-use areas and gathering spaces to better accommodate a broader range of activities and diverse users.

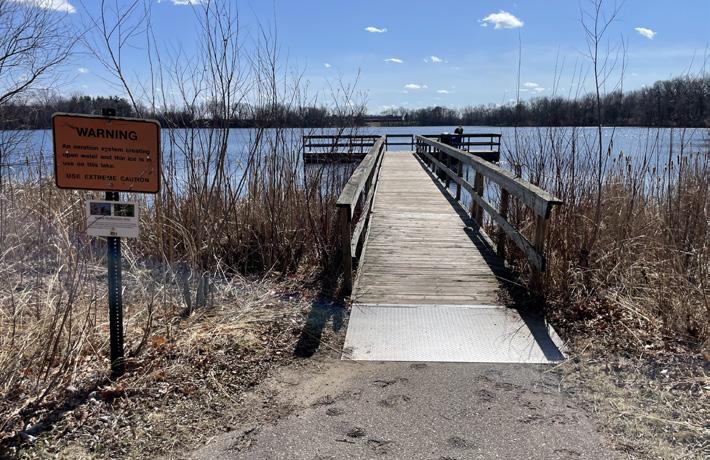
Rogers Lake Park is an 8.7-acre community park that offers space for play, picnics, kayaking, and fishing. The most recent amenity added was a skate park completed in May 2024.
This is the only park in the Mendota Heights system with an active shoreline and water access. Given its unique role within the park system, additional master planning could help position it for future use and maximize its value to the community. Potential improvements could include enhanced shoreline restoration, expanded water access for kayaking and fishing, improved picnic and gathering spaces, and better trail connections to surrounding neighborhoods. Upgrades to parking, pathways, and accessible launch areas could improve inclusivity, ensuring individuals of all abilities can fully enjoy the park’s amenities.
Valley View Heights Park is a small .6-acre neighborhood park that contains a playground, walking trails, and a basketball court. There are also picnic tables within the park. This park would benefit from assessment of adjacent uses and circulation.
The Recreational Trends Analysis examines national, regional, and local recreational trends to provide context and guidance for the future needs of the Park System. This analysis offers insight into the activities the community values and reinforces the need for improved parks, trails, facilities, and recreation programs.
Data for this analysis was sourced from the Sports & Fitness Industry Association’s (SFIA) Sports, Fitness & Leisure Topline Participation Report (2022), the National Recreation and Park Association (NRPA), and the Environmental Systems Research Institute, Inc. (ESRI). All trend data is based on current and historical participation rates, statistically valid survey results, or NRPA Park Metrics. The analysis covers categories such as sports, fitness, outdoor activities, aquatics, and other recreational pursuits. (See Appendices 3 & 4 for full Recreational Trends Analysis and Phase 1 Summary.)

In 2023, approximately 242 million Americans (ages 6+) reported being active, a 2.2% increase from 2022 and the highest level in six years.
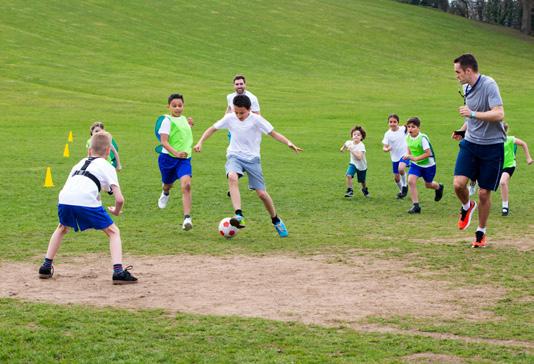
165 million Americans were classified as “core participants” (frequent engagement), marking a six-year increase. Core participants are more committed and less likely to switch activities.

Pickleball was the fastest-growing sport in 2023, with participation skyrocketing to 13.6 million—a 223.5% increase since 2020.
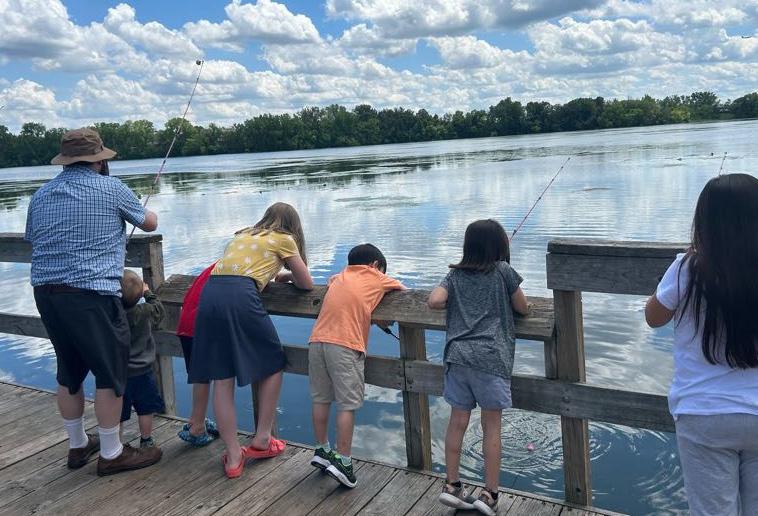
Outdoor activities continue to grow, home fitness remains strong, and team sports are gradually returning to pre-pandemic levels.
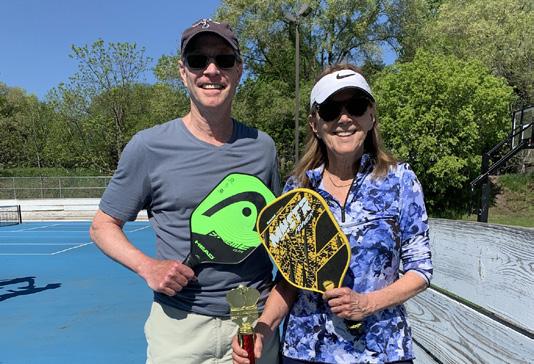
Fitness sports dominate across generations. Outdoor activities are especially popular among Gen Z, Millennials, and Gen X, while team sports are primarily driven by Gen Z.

Group fitness activities such as tai chi, barre, Pilates, and yoga also saw significant growth, reflecting a broader trend toward communitybased exercise.
WHAT DOES THIS MEAN FOR MENDOTA HEIGHTS PARKS?
Current recreational trends highlight the need for flexible community spaces—both indoor and outdoor—within the Mendota Heights park system. These adaptable spaces would support a variety of growing fitness and wellness activities, as well as allow for year-round classes and programs. Expanding indoor programming is especially important given the city’s aging population, who have expressed strong interest in such offerings.
Overall, the park system provides a relatively balanced distribution of amenities based on population and national trends, with two notable exceptions. First, the number of baseball diamonds significantly exceeds national standards. While baseball remains a popular sport, its space allocation should be reconsidered to ensure equitable access to other recreational opportunities. Second, the system lacks aquatic facilities. As community interest in aquatic activities continues to rise, so too will the demand for swimming and water-based programming. Addressing these imbalances will help the park system better meet the evolving needs of all residents.
There is currently a sufficient number of pickleball courts. However, this should be reassessed in the coming years if participation continues to increase. The rising interest in golf highlights the value of the City-owned golf course and presents opportunities to expand programming and amenities at the course.

Water-based recreation experienced a rise in participation across all ages, highlighting increased interest in aquatic sports and potential benefits to a broad swath of the community .

The most popular sports by total participation included basketball, golf, and tennis. Baseball saw a 7.6% increase in participation from the previous year and a 4.9% increase over the past five years.
Recreation programs and services are the backbone of a thriving park system, fostering engagement, wellness, and community connection. To gain a comprehensive understanding of the current programming landscape, this plan includes a detailed Program Assessment. The purpose of this assessment is to evaluate existing recreation offerings and identify opportunities for enhancement and expansion. By aligning programming recommendations with community needs and priorities identified in the Community Needs Assessment, the City can ensure that its recreation services remain relevant, inclusive, and responsive to residents of all ages and abilities.
SEE MASTER PLAN APPENDIX 6 FOR THE FULL PROGRAM ASSESSMENT
MHPR has strong community engagement and high participation rates, particularly in sports camps such as golf and tennis. However, third-party organizations currently use a disproportionate share of MHPR resources. Lease agreements with sports associations should be reassessed to clarify responsibilities and adjust fees to better reflect MHPR’s resource investment.
Community special events, in particular, play an important and meaningful role in the community. Special events are a high priority for the community and MHPR resources should be expanded to focus on this area.
The City has a history of partnering with other regional institutions to share facilities and/ or programming. Strengthening partnerships with School District 197, Dakota County, and West Saint Paul could expand program offerings despite existing constraints. However, this depends on the availability and resources of these organizations and may not be consistent over time.
The primary challenges to sustaining recreational programming include limitations in staffing, funding, and available space. These constraints hinder both current offerings and the department’s ability to expand programs in response to community interest. Additionally, the absence of a clear pricing strategy complicates financial planning and impacts program accessibility. Addressing these issues will be essential to maintaining and growing programming in the years ahead.
MHPR serves most age groups but needs more offerings for preschoolers (ages 5 and under) and older adults (ages 55+).
• A significant portion of MHPR programming is in the “Saturated” or “Decline” stage, signaling a need for diversification.
• Most programs rely on earned income (e.g., user fees) but lack clear cost recovery goals.
• Special events are a high community priority and need more dedicated resources including dedicated staff.
• Over half of the programs are classified as “Value-Added” or serve individual interests which typically should require cost recovery through user fees; however, cost recovery goals and a detailed cost-of-service analysis need to be further established.
• Core Program Areas & Recommendations: MHPR should clearly define core programs to focus resources on areas of greatest community value.
• Accessibility: Expand accessible programming, train staff, and improve facility accessibility to ensure inclusive participation.
• Balance User Groups: Focus on introductory youth sports programs while requiring third-party association to bear more financial responsibility.
• Special Events: Invest in a dedicated Event Coordinator to manage growing demand for community events.
• Senior Programs: Rebrand and diversify offerings to meet the varied needs of older adults, including digital literacy, social engagement, and wellness programs.
• Marketing: Create a marketing plan aligned with MHPR goals and annually update marketing strategies to reflect community needs.
• Data-Driven Decisions and Performance Tracking: Performance metrics, including participation rates, satisfaction surveys, and cancellation tracking, will support continuous improvement and effective program design.
By implementing these action points, MHPR can improve program quality and alignment with strategic priorities, fostering continuous improvement and better serving the community.

This Benchmark Analysis compares park systems in cities with similar size, demographics, and social infrastructure to Mendota Heights. The analysis helps the City assess trends, identify alternative approaches, and evaluate how it measures up to other peer communities. It can reveal significant deviations, such as funding or staffing being notably lower than other cities, or confirm that Mendota Heights’ approach to spending, staffing, and facilities aligns with similar communities. The data used for comparison comes from five benchmark agencies. Four were nearby cities: Golden Valley, New Brighton, New Hope, and West Saint Paul. A fifth, Green River, WY was added as a national benchmark. The analysis also includes national data from the National Recreation and Park Association (NRPA) for cities with populations under 20,000 to offer broader context.
SEE MASTER PLAN APPENDIX 5 FOR FULL BENCHMARKING ASSESSMENT.
Mendota Heights has a well-utilized park system but operates with fewer resources compared to its peers. The City maintains 146 acres of parkland, equating to 12.4 acres per 1,000 residents, which is below the NRPA average of 20.9 acres per 1,000 residents. Additionally, the number of paved and unpaved trails is relatively low compared to other benchmark communities, highlighting a potential opportunity to enhance connectivity and access to outdoor recreation.
MHPR also operates with the smallest full-time and seasonal staff among benchmark agencies, making it difficult to fully meet the demands of park maintenance, recreation programming, and administrative support. Benchmark cities with larger staff teams provide a broader range of services and higher levels of facility upkeep, reinforcing the need for additional staffing in Mendota Heights to maintain high-quality recreational opportunities.
In terms of programming, MHPR takes a targeted approach, focusing on arts, technology, and net sports like tennis and pickleball. However, the analysis reveals gaps in adult sports, fitness programs, and indoor/outdoor aquatics, which are common offerings in peer communities. Expanding the variety of recreational programming could help MHPR engage a wider segment of the population while also generating additional revenue.
While MHPR’s total participant numbers are smaller compared to some benchmark agencies, engagement remains strong, with a high level of repeat visits. This suggests that while the City’s programs serve a committed base of users, there is room to broaden participation through new offerings and expanded outreach.
MHPR’s golf course operations also present opportunities for improvement. The City’s 9-hole course generated $296,818 in revenue in 2023, significantly less than similar facilities in New Brighton ($327,741) and New Hope ($529,939). Both peer agencies utilize indoor spaces for additional programming and rentals, which allows them to increase revenue beyond traditional seasonal golf operations. Adding amenities such as an indoor simulator, enhanced clubhouse, and expanded programming could improve the financial performance of the golf course.
Financially, MHPR is more reliant on program fees, which account for 62% of earned revenue, a higher percentage than any of its benchmark agencies. This highlights the importance of program fees in maintaining financial sustainability. However, MHPR brings in significantly less non-tax revenue— including sponsorships, grants, and partnerships— compared to similar agencies. Exploring additional funding sources such as permits, facility rentals, and land leases could help diversify revenue streams and provide a more stable financial foundation for the department.
The benchmarking analysis highlights both strengths and areas for improvement in Mendota Heights’ park system. While the City efficiently manages a well-used park system, its lower staffing levels, limited trail mileage, and narrower program offerings indicate key areas that require attention. Expanding recreational opportunities—particularly in adult sports, fitness, and aquatics—could better align with regional trends while increasing community engagement and revenue potential. Additionally, diversifying funding sources beyond program fees will be critical to ensuring long-term financial sustainability.
By addressing these gaps, Mendota Heights can strengthen its park system, enhance accessibility, and ensure that investments in staffing, amenities, and funding strategies position the community for continued success. These insights will directly inform the master plan’s recommendations, guiding the City in shaping a well-balanced and financially sustainable park and recreation system for the future.
A financially sustainable park system ensures that parks and recreation services remain accessible, well-maintained, and responsive to community needs. This chapter provides an analysis of Mendota Heights Parks and Recreation (MHPR)’s financial landscape, cost recovery trends, and funding strategies to secure the long-term viability of the park system.
SEE MASTER PLAN APPENDIX 7 FOR FULL FINANCIAL SUSTAINABILITY ASSESSMENT.
Financial Overview
A review of MHPR’s financial data from 20192024 reveals key trends in revenue generation, expenditures, and cost recovery. While MHPR’s operational budget is within national norms, spending is disproportionately allocated toward park maintenance, leaving recreation services underfunded. National Recreation and Park Association (NRPA) benchmarks suggest a more balanced approach to budgeting, with a greater share allocated to recreation programming.
Parks: Cost recovery for parks remains extremely low, averaging 1-2% compared to an industry standard of ~22%. While parks are not expected to be self-sufficient, the current recovery rate is unsustainable and highlights the need for alternative funding sources.
Recreation: Recreation services have seen a sharp decline in cost recovery from 111% in 2019 to a projected 36% in 2024. Increased free events and reduced program fees have contributed to this decline. A more structured pricing approach is necessary to improve financial sustainability while ensuring equitable access.
Golf: Golf operations perform significantly better than recreation and parks, recovering nearly all operating costs. The introduction of additional revenue-generating amenities, such as a golf simulator, could further improve cost recovery and expand year-round use of facilities.
Capital Expenditures: Funding for capital improvements has largely relied on the Special Park Fund, which is depleting without a sustainable replenishment mechanism. Mendota Heights currently spends well below the national benchmark for capital reinvestment, putting longterm infrastructure at risk.
MHPR’s per capita spending on parks falls within the middle quartile of national standards, yet recreation services remain significantly underfunded compared to similar communities. Additionally, the current per capita investment in capital improvements is well below recommended levels, posing long-term risks to park maintenance and facility upgrades. A major challenge for MHPR is its heavy reliance on tax support, with limited alternative revenue streams to balance its financial structure. This dependence on a single funding source threatens long-term sustainability and highlights the necessity of adopting a more diversified financial strategy. Expanding revenue generation through user fees, sponsorships, partnerships, and other innovative mechanisms will be essential to achieving fiscal stability and ensuring the continued success of the park system.
To achieve financial sustainability, MHPR must adopt a diversified funding approach that includes:
User Fees & Pricing Adjustments: Implementing a structured fee policy that aligns with market standards while ensuring access for low-income residents through scholarship programs.
Public-Private Partnerships: Collaborating with local businesses, nonprofits, and neighboring municipalities to develop and maintain facilities.
External Funding Sources: Expanding grant applications, sponsorships, and philanthropic partnerships to increase non-tax revenue.
Alternative Revenue Streams: Introducing naming rights, advertising opportunities, and concession management to generate additional income.
Tax & Government Support: Exploring local sales tax initiatives, special service districts, and strategic use of park dedication fees to fund improvements.
To maintain and enhance its park system, MHPR must take a proactive approach to financial sustainability. By diversifying funding sources and aligning expenditures with best practices, the City can ensure that parks and recreation services continue to meet community needs for generations to come. A well-funded and strategically managed park system not only enhances the quality of life for residents but also fosters community engagement, economic development, and environmental stewardship.
Ensuring equitable access to parks and recreational amenities is essential for every community. While Mendota Heights has a wellmaintained park system, accessibility improvements are needed throughout the park system to ensure that all residents—regardless of age or ability—can fully enjoy public spaces. A fundamental step toward achieving this goal is ensuring that every park includes ADAcompliant pathways and accessible routes to key amenities. Beyond basic accessibility, park systems should incorporate inclusive playground equipment, improved wayfinding signage, destination amenities, and adaptive sports fields. Additionally, upgrading restroom facilities and seating areas with accessible features will enhance comfort and usability for all visitors.
Community engagement efforts and site assessments conducted by the consultant team have identified significant accessibility gaps throughout the Mendota Heights park and trail system. Currently, many parks do not meet baseline accessibility standards, limiting opportunities for individuals with disabilities to participate fully in outdoor recreation. To address these issues strategically, the City should conduct a comprehensive accessibility assessment of all park properties to identify and prioritize necessary improvements.
Beyond infrastructure, programming and public engagement play a critical role in accessibility. MHPR can expand inclusion efforts by offering adaptive sports, sensory-friendly events, and bilingual programming to better serve the needs of diverse community members. Establishing partnerships with organizations specializing in disability advocacy and inclusive recreation will provide valuable insights and help guide best practices in program development.
Effective communication and public awareness are also essential for accessibility. Residents should have access to clear, detailed information about available amenities and accessibility features before they visit parks or trails. Improved digital and on-site signage, maps, and online accessibility guides can help individuals plan their visits with confidence.
Improving accessibility in the park system is not just a matter of compliance—it is a commitment to creating inclusive, welcoming spaces for all residents. By prioritizing inclusive infrastructure, enhanced amenities, and diverse programming, Mendota Heights can build a park system that promotes equity, encourages participation, and strengthens community connections.
Complete an Accessibility Assessment of all parks and trails
Prioritize improvements identified in the Accessibility Assessment using the Equity Prioritization Tool
Initiate implementation by integrating recommendations into park specific master plans. Integrate Accessibility Best Practices in all future work


Clearly communicate available amenities and access information to the community prior to their visit. During their visit, provide visible signage and intuitive wayfinding tools to support a welcoming and navigable experience
Create a diverse range of sensory environments and amenities to spark use by diverse user and age groups
Inclusion should be addressed at all levels - Parks, Programming, Planning, Improvement Prioritization


Provide for the basic needs and comfort of all visitors (restrooms, water, shade, clear pathways, safe entrances and exits)
Provide spaces and amenities that are important to users including fully accessible playgrounds, different scales of gathering spaces, and areas to connect to nature
Best practices, community needs, and demographics are constantly changing and evolving. Practices should be in place to allow frequent check-ins with users and experts to ensure the park system provides the most relevant services
A clear mission and vision for the Mendota Heights park system will provide a solid foundation for future decision-making and prioritization of competing needs and resources, ensuring that investments align with community values and long-term goals.
This chapter establishes the guiding principles that will shape the future of Mendota Heights’ parks, recreation, and natural spaces. By defining a clear vision, this plan helps direct resources effectively, balance diverse community needs, and create a park system that is welcoming, sustainable, and adaptable. The ultimate goal is to support the City in providing high-quality parks and recreation opportunities for all residents.
The mission and vision statements presented here are the result of a comprehensive 16-month planning process that engaged community members, elected officials, and key partners. This inclusive approach ensures that the guiding framework reflects the community’s
priorities, balancing recreation, natural resource preservation, and equitable access. By incorporating a broad range of perspectives, the plan provides a strong foundation for decisionmaking, ensuring future investments align with shared goals.
For the master plan to be successful, its recommendations must be both aspirational and practical. Implementation will require a strategic approach that considers financial feasibility, staffing capacity, and evolving community needs. A well-scaled, sustainable funding strategy will be essential to ensuring long-term success, allowing the City to maintain and improve parks, expand programming, and address evolving recreational demands
without overburdening resources. Diversifying funding sources—including strategic public investment—will help create a resilient park system that can adapt to growth and changing priorities.
This chapter outlines key goals for the park system’s future, detailing actionable steps to transition from planning to execution. By balancing short-term wins with long-term investments and securing stable funding, the City can ensure steady progress while maintaining the flexibility to adapt to changing conditions. This strategic approach will enable Mendota Heights’ park system to evolve sustainably, equitably, and meaningfully for years to come.
to preserve and enhance the quality of life for Mendota Heights residents through continued care of parkland, providing exceptional recreational opportunities and programming, maximizing fiscal efficiency, and fostering an inclusive environment.
preserve valued features of the current park system while innovatively expanding recreational opportunities to meet the needs of current and future park users to create an inclusive environment where all visitors can enjoy the City’s trails and open spaces.

• Diversify park amenities
• Diversify and expand programming
• Ensure ongoing community engagement
• Expand winter programming and amenity options
• Add flexible indoor & outdoor space
• Add aquatics options
• Consider all ages and abilities in amenity development and design

• Stewardship of public dollars
• Making park spaces “do more” to address gaps
• Identifying additional funding/ revenue opportunities
• Utilize data-based methods—such as ongoing maintenance data collection and asset management software—to document existing practices and conditions, enabling informed, datadriven decision-making
• Ensuring Operation & Maintenance efficiency

• Complete City-wide accessibility study and improvement plan to identify and address issues
• Define accessibility standards that meet and exceed ADA outdoor accessibility standards
• Provide a fully inclusive playground and amenities within City
• Update communications to current accessibility standards
• Include accessibility improvements to all planned park improvements

• Natural resources
• Programming and education
• Natural surface trails
• Enhancement - improve quality
• Character - scale/type/quaintness of neighborhood parks
• Trail quality

• Expand communications - media, language (as needed)
• Add physical trail connections and road crossing improvements
• Connect to the Minnesota River Valley
• Ensure all residents can connect to nearby quality parks

• Diversify revenue sources
• Optimize cost recovery
• Balance park and recreation expenses
• Leverage Interagency Partnerships
• Dakota County
• West Saint Paul
• Metropolitan Council
• Eagan
• ISD 197 School District
• Maintaining appropriate staffing levels
• Tying decision-making to long-term goals and vision

Implementing a Park System Plan is a new endeavor for Mendota Heights. The following is a practical tool for staff to guide the park system’s future development, redevelopment, maintenance, and recreation efforts. The following framework plan outlines key improvement areas that guide and inform more detailed Park System improvements.
The following Action Plan consists of actions in four categories. The goal of this section is to provide a framework that outlines strategies to upgrade the park system in Mendota Heights to meet the City’s evolving needs. As implementation occurs, the City will assess and monitor these actions with an emphasis on adequate staffing, financing, and equitable resource allocation.
Mendota Heights recognizes the planning horizon of the Park System Master Plan may require modifications to specific recommendations as conditions change. Shifts in development patterns, redevelopment, demographic changes, technology, staffing, funding, or recreational interests can reshape needs and priorities, warranting new implementation approaches. The overall System Plan, and this Action Plan are living documents that guide but do not prescribe. The framework is expected to be modified in the future. Implementation flexibility enables the City to adjust, refine, and improve strategies to deliver accessible, equitable, innovative, and highquality recreational experiences.
It is recognized that the community engagement process for the Master Plan identified gaps between the public’s desires and needs for the park system and current facilities, funding, and staffing levels. Staff and City leadership will need to work together to creatively bridge these gaps through increased resource allocation, staffing, and efficiencies in processes. The following recommendations provide one avenue to improve the system. There are other means to achieve the goals of this Master Plan, and this Action Plan should be flexible and updated over time.
A series of Goals, Strategies, and Tactics are presented below and tied to a budget category found in the Parks and Recreation Capital Improvement Plan (CIP). The CIP Budget Category responses identify the financial or staff level effort associated with the tactic. This order of magnitude ranking is the consultants’ opinion and should be used for resource planning purposes. It should be updated as necessary.
Lifecycle Maintenance - routine efforts requiring a modest level of financial commitment and/ or staff time to complete. Many of these tactics should be on a set schedule.
Enhancement - requiring an increased level of financial commitment or additional staff resources to complete. These tactics go above and beyond normal operating procedures to make a tangible improvement to the system.
Visionary Element - requires significant enhancement to achieve, often requiring City leadership to direct significant resource allocation. These elements have a significant cost, but provide significant directional change that will last long into the future.
Lifecycle Maintenance
Enhancement
Visionary Action Plan Key


The Action Framework supports all of the Key Themes of the Guiding Principles. However, each category of the Action Framework directly supports some Principles more than others.


01: MEET NEEDS THROUGH DIVERSIFICATION
02: PRIORITIZE ACCESSIBILITY + INCLUSIVITY
03: IMPROVE CONNECTIVITY
04: MAINTAINING QUALITY
05: PRESERVE EXISTING VALUED PARK FEATURES
06: DEVELOP LONG-TERM SUSTAINABLE FUNDING MODEL
Determine the capital investment needed to enhance existing community and neighborhood parks in the system to bring them up to a higher recreational experience value over a ten-year period through effective park design and amenities that provide a diversity of recreation opportunities, support community recreation needs and provide a positive experience.
Improve and enhance the existing trail system by supplementing the Comprehensive Plan with the Bike and Pedestrian Plan (2022) to fill gaps and create an easy to use bike/walking pathway system of trails and on street sidewalks that allow any user to walk, run or bike in a safe environment.

• Establish a priority list of existing parks to be updated based on the equity analysis provided in this master plan. Update the priority list and analysis annually to ensure system is up-to-date and continues to respond to community needs.
• Develop community-driven updated park site master plans and program plans for each park that is said to be improved and how residents benefit from the improvements slated to be completed and incorporate new types of amenities to broaden user types where appropriate.
• Incorporate amenities in existing parks where appropriate to create a balance of amenity experiences across the City.
• Track the use and impact of the park improvements on visitor rates and economic benefit to the City.
• Submit state grants for trail enhancements in the City with the goal of completing one new mile a year until completed.
• Improve safety and perception of arterial road crossings. Work with Engineers during road re-design efforts.
• Identify opportunities to integrate natural surface trails through natural areas to support hiking and mountain biking. Focus on low-quality vegetation areas near existing parks & trails.
• Establish policies for trails and open space development that require future development, and significant re-development, to connect with existing trails where possible.
• Host events on the trails to promote usage such as trail runs and health walks so users understand the value of the trails in the City.Track the health of residents each year for areas of the City that have the trail system passing through it. Partner with health advocacy groups.
Acquire park land in underserved areas of the City as development occurs in the southwest.
Reinforce consistent signage, education and branding of the park system that includes existing parks, trails, and major attractions to make it easy for residents and visitors to access the facilities and amenities provided.
Develop additional sports fields to accommodate lacrosse and soccer for youth.
Improve accessibility of all parks and facilities to accommodate all residents.

• Set aside land for park space as a part of development and develop a site master plan for the new park site.
• Seek to acquire enough land to provide amenities lacking in that part of the City. Develop a master plan to understand site capabilities.
• Seek partners to help develop the park such as the school corporation or local developers who will benefit by having the park in their area of development.
• Reaffirm signage brand for the park system and update inconsistent signage to make the brand stronger and more identifiable.
• Create wayfinding along trails and at key attractions.
• Work with the Chamber of Commerce, Public Works, and the school corporation on appropriate signage/wayfinding for connecting parks and special events held in the City.
• Work to develop soccer and lacrosse fields to accommodate the needs of residents. Evaluate conversion of existing over-served diamonds.
• Update practice fields to accommodate competitive games.
• Complete an ADA audit for parks and incorporate changes needed to be in compliance over the next five years.
• Provide programming opportunities that support all residents with or without disabilities.


Implement the program recommendations outlined in the Master Plan that require indoor and outdoor space for year-round programming.

Match program needs with indoor and outdoor spaces available. Acquire or develop new program spaces to meet residents’ needs in the City. Include 15,000-20,000 sq ft of indoor recreation space in future City facilities planning.
Visionary Element
• Seek partners who are willing to share indoor space needs and costs to meet unmet program needs in the City.
• Update pricing policies to reflect the cost of programmable space to meet the cost recovery goal desired.
Update pricing policies and partnership policies to create equity and fairness between partners, user groups, and the City for the level of benefit received beyond what a general taxpayer receives to offset operational and maintenance costs.

• Continue to meet annually with each sports group/association to review their partnership agreement and use of Mendota Heights facilities. Adjust agreements as needed.
• When working with new sports organizations or other recreation providers that are wanting to partner with the City, meet prior to that organization starting their program and ensure the partnership is equitable.
• Consider the creation of a sports advisory group that includes parks, the school district, and youth sports associations to discuss coordination of community space, key issues, and how to support each other’s needs through appropriate advertising, marketing, and policy implementation.
Establish partnership policies for public/public partnerships that include the school district, public not-for-profit partnerships such as youth sports associations to create fairness in use and how operations are funded by the City in the future.

• Establish the true cost of what the City is investing in existing facilities on an annual basis through asset management software, training, and tracking of parks maintenance activities.
• Assess the level of public and private benefit each partnership receives from the use of City facilities, along with the associated costs to prepare park sites for leagues and tournaments. This evaluation will help determine an equitable cost-sharing approach among all participating groups.
• Make agreements as fair and equitable as possible between the City and the responsible group.
Develop a feasibility study and business plans for future indoor program spaces to meet the needs of the community in a financially equitable manner.
Study outdoor ice use and benefit to maximize cost benefit to the community; consider decommissioning low use/ low quality rinks and/ or covering high use outdoor ice facilities to maximize their use and to operate in the most efficient manner.
Expand/ remodel the Par 3 Golf Course clubhouse to accommodate more use and revenue generation, encourage winter use, and allow for full operations of restrooms and concessions.

• Implement the program space needs with other partners to support core program needs in the City.
Develop an operating proforma to demonstrate to key leaders that the Department is operating within the guidelines established in the feasibility study.
• Determine capital financing options to fund these program facilities that reach the widest level of users in the City.
• Determine the value, cost, and feasibility of extending the use and value of outdoor ice rinks via a feasibility study.
• Determine what programs can be offered on enhanced ice and how they can contribute to the cost to operate them.
• Develop a program plan for the sites involved that can incorporate skating and ice hockey.
• Study clubhouse expansion to fully utilize restrooms, concessions, and seating space. Acquire golf simulator.
• Utilize online reservation software to maximize revenue generation. Enhancement
Maint.
• Develop a feasibility study and business plan to demonstrate the payback to the City for enhancing the site.
Provide high quality recreation programs and amenities that are well-developed, desired, and delivered to build a strong user basis.
Strengthen and diversify core program offerings.
Develop a cost-of-service study for each core program to be considered to determine the cost to operate effectively and how to fund it through user fees and earned income as much as possible.

Establish at least one new core program each year that focuses on summer camps, sports, special events, active senior services, outdoor adventure, youth and adult sports, arts and culture, golf and people with disabilities.
• Prioritize special events, a high-demand service, by increasing resources and staffing.
• Re-brand senior programs to include passive and active recreation opportunities for different abilities and interests.
• Seek out program spaces that can be rented or created to support these core services.
• Focus on entry-level instructional youth sports programming rather than resource-intensive leagues and tournaments.
• Develop program staff to support these programs in the most cost-effective manner.
• Establish a cost recovery framework for the staff to cost out each program they provide based on the cost of service and how the program is classified as core essential, important and value added.
• Continue scholarship fund to support equitable access while maintaining financial sustainability.
Increase fees for third-party associations using MHPR sports fields to better reflect resource usage.
• Introduce differential pricing (e.g., prime vs. non-prime time rates) to enhance revenue development.
• Determine price points based on the level of service provided and the classification determined.
• Develop a fee policy to reflect the level of cost recovery desired by each core program area.
Develop and enhance special events in the City to bring the community together to celebrate living in Mendota Heights.
Enhance the volunteer program to assist program staff in hosting special events and programs in the City.
• Establish at least four additional special events a year working with various groups in the City.
• Hire full-time or part-time staff to develop the special events in the City and develop working volunteer groups who will work with staff to pull the events together.
• Develop operating budgets for each special event and incorporate earned sponsors to help fund the events for the residents in the City.
• Volunteer coordination is currently a minor component of the full-time Administrative Services Assistant’s role. To ensure continuity of the volunteer program, this responsibility should be formally maintained within the position’s defined scope of duties.
• Establish a goal of 5% of the total workforce hours are made up of volunteer hours.
• Use volunteers in park maintenance for neighborhood park cleanups, set up and take down of events, and planting of flowers in parks.

02, 04, 05
04, 05, 06
Lifecycle Maintenance
Lifecycle Maintenance
Lifecycle Maintenance
Lifecycle Maintenance
02
02, 03, 06
02, 03, 06
06
04, 06
02, 03, 04, 06
Lifecycle Maintenance
Lifecycle Maintenance Enhancement Enhancement Enhancement Enhancement
05, 06
05, 06
05, 06
05, 06
04, 05, 06
06
Lifecycle Maintenance
Lifecycle Maintenance
Provide high quality recreation programs and amenities that are well-developed, desired, and delivered to build a strong user basis.
Establish an effective marketing plan to enhance the use of all public mediums to encourage more community awareness, use, and appreciation for program services.
Improve program management and lifecycle planning.
• Establish a funding process to implement the marketing plan in the upcoming budget years to deliver the message to encourage the highest use levels for each core program and event offered in the City.
• Implement an automated email marketing system to streamline communication with residents.
• Conduct a social media audit to refine content strategies and measure effectiveness.
• Market community-wide events in the parks.
• Enhance the branding identity of the park system to bring greater recognition on the value of the park system to the citizens.
• Conduct annual program lifecycle reviews to ensure a healthy mix of new, growing, and mature programs.
• Implement a standardized program evaluation process to determine whether programs should be expanded, restructured, or retired.
• Aim for 50-60% of programs in the beginning stages to maintain innovation and community engagement.
• Regularly track program participation, retention rates, and customer satisfaction to guide decision-making.
Maintenance
Lifecycle Maintenance
Lifecycle Maintenance
Maintenance
Lifecycle Maintenance

Strengthen partnerships and resource sharing with organizations in near proximity and/ or aligned in vision/ mission.
Improve staffing capacity to expand recreation services asked for by the public.
• Expand partnerships with School District 197, Dakota County, and neighboring cities to secure additional space and resources for programs.
• Expand collaborations with health organizations to offer wellness-focused programs for all ages.
• Review and renegotiate third-party contracts and lease agreements to ensure equitable cost sharing.
• Actively seek funding and sponsorships from local businesses, non-profits, and foundations to supplement program revenue.
• Develop a staffing plan to ensure sufficient personnel before expanding programs.
• Introduce technology solutions to automate administrative tasks and improve efficiency.
• Hire a full-time Event Coordinator to oversee special events and sponsorships.
• Provide staff training on quality assurance, program evaluation, and customer service standards.
Maintenance
Lifecycle Maintenance
Lifecycle Maintenance
Develop
Identify capital improvement priorities for key parks in the system that will enhance their value, usability, and overall experience for both residents and visitors.

• Develop updated site plans for existing parks and new parks for the future with capital costs and operational costs to go with each improvement.
• Seek as many funding options as possible that are outlined in the master plan to support capital improvement needs including some taxpayer investment as well as operational funding.

• Develop a long-term funding strategy and financial plan for capital improvements in the next ten years.
Ensure staffing of park maintenance and program staff is aligned with community expectations.
Incorporate as many new funding options as possible that are outlined in the master plan to help support the system of the future and provide future capital and operational funding for parks and recreation amenities moving forward.
Explore submission of a parks referendum to fill capital, operations, and programming gaps and needs identified in the Master Plan.
Seek to attract high performing employees that can implement this master plan and deliver high-quality programs and services to the community.
• Develop a maintenance management plan that aligns with defined maintenance standards and assigns responsibilities to full-time, part-time, seasonal, or contracted staff. The plan should address all City-owned functions and amenities, ensuring timely upkeep and replacement of assets as they reach the end of their useful life.
• Provide training for full-time, part-time, seasonal staff, and volunteers to ensure they understand and can meet maintenance standards in their assigned areas, fostering a culture of excellence. Collect data on productivity, efficiency, and output to evaluate and enhance the effectiveness of parks maintenance operations.
• Link the cost of implementing maintenance standards for types of parks and recreation facilities to the budget so the right dollars are budgeted to achieve the right outcome desired.
• Seek a combination of dedicated and earned income funding options for the department to meet the community expectations based on the results of the master plan moving forward.
• Work with the local community advocacy groups to create a park foundation to support future park and recreation capital needs of the system.
• Build on the community engagement from this master plan. Provide additional studies and analyses to determine the appropriate amount of a potential referendum ask to the public.
• Create the right balance between full-time staff and part-time staff in parks and in recreation services to match the expectations of City leaders and the public.
Establish key performance indicators to demonstrate to elected officials and key City leadership the value of the parks system to the community and its ability to deliver to the public’s expectations of parks.
• Teach and train staff through various management schools hosted by NRPA on delivering on the key components of park maintenance, program management, facility management and financial management for the system moving forward.
• Complete a feasibility study for 15,000- 20,000 sq ft of indoor recreational space including detailed budget.
• Develop a comprehensive funding strategy to support field redesign improvements and the construction of a new, modernized concession building at Mendakota Park.


Develop implementation plans for the top requested amenities from the master plan and incorporate funding needs into the CIP.
• Develop a funding strategy for a fully accessible playground at Mendakota Park.
• Develop a funding strategy for improvements to the Par 3 Golf Course, including the addition of a golf simulator.
• Develop a funding strategy for master plan and implementation of Kensington Park.
• Develop a funding strategy for a covered refrigerated ice rink within the City’s park system.

The 2040 Mendota Heights Park System Master Plan establishes a comprehensive and strategic vision for the future of the City’s parks, trails, and recreational spaces. It reflects the input of over 1,000 community members, elected officials, stakeholders, and experts, ensuring that the recommendations are rooted in the needs and priorities of residents. Through this extensive engagement process, six key themes emerged, shaping the guiding principles of this plan: preserving the park system’s value, expanding and diversifying amenities, improving accessibility, prioritizing enhancements over new development, ensuring sustainable funding, and fostering continued community involvement.
Mendota Heights boasts a well-loved and highly utilized park system, yet the City faces challenges that must be addressed to sustain and enhance its parks and recreation services. The benchmarking analysis highlights that while the City provides a strong foundation for outdoor recreation, it operates with fewer resources than peer communities. Staffing shortages, limited program diversity, gaps in accessibility, and underfunded capital improvements present ongoing barriers to maintaining a high-quality park system. Additionally, funding constraints and a reliance on program fees necessitate a more sustainable financial model that balances public investment, partnerships, and alternative revenue sources.
The implementation strategy outlined in this plan provides a realistic roadmap for prioritizing investments, improving existing parks, enhancing connectivity, and expanding recreation opportunities. The recommendations focus on both short-term actions, such as improving park accessibility and upgrading outdated amenities, and long-term visionary projects, such as developing an inclusive playground, enhancing Rogers Lake Park’s water access, and exploring new indoor community gathering spaces.
Ensuring accessibility and inclusion is a central priority of this plan. Currently, many parks lack ADA-compliant pathways, adaptive sports fields, and inclusive playgrounds. A City-wide accessibility assessment will be a key first step toward identifying and addressing these gaps. Additionally, continued investment in safe routes, trail connectivity, and pedestrian access will enhance park accessibility for all residents, regardless of age or ability.
A sustainable funding model will be critical to implementing the recommendations in this plan. Community members expressed strong support for additional investment in park improvements, and future funding strategies should explore public-private partnerships, grants, sponsorships, and tax-supported initiatives to ensure long-term financial stability. Diversifying revenue sources will allow the City to expand programming, maintain high-quality facilities, and meet evolving community needs without over-relying on user fees.
The Mendota Heights park system provides a strong foundation, and with continued investment and thoughtful enhancements, it has the potential to become an even greater asset to the community. By implementing the recommendations outlined in this plan, the City can build on its successes, expand recreational opportunities, and ensure that parks remain vibrant and accessible for future generations. Each step taken—whether small improvements in accessibility or large-scale facility investments— will help create a stronger, more inclusive, and better-connected park system that serves the entire community.
The 2040 Park System Master Plan is not just a static document—it is a living strategy that will evolve alongside the City. By committing to regular evaluation, community engagement, and strategic decision-making, Mendota Heights can continue to provide exceptional parks and recreation services that enhance quality of life, promote environmental stewardship, and strengthen community connections. With thoughtful planning, dedicated resources, and strong leadership, the City is well-positioned to preserve its cherished park system while innovatively expanding opportunities for future generations.
This plan marks the beginning of an exciting new chapter for Mendota Heights. Through collaboration, commitment, and communitydriven action, the City will ensure that its parks remain vibrant, inclusive, and sustainable for decades.
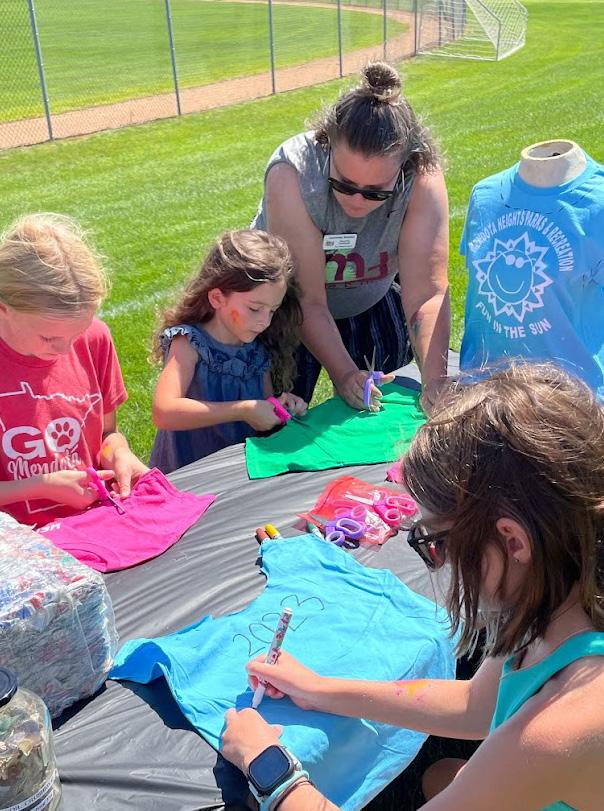
The purpose of Phase 1 engagement was to capture the community-identified strengths and weaknesses of the existing Mendota Heights park system. Additionally, it was an opportunity for community members to share initial ideas for improvement, preservation, and other long-term visions for the park system. To capture the varying voices within the community, a range of engagement tools were used, and the timeline for engagement was maximized.

To provide the public with balanced and objective information to assist them in understanding the problems, alternatives, opportunities and/or solutions.
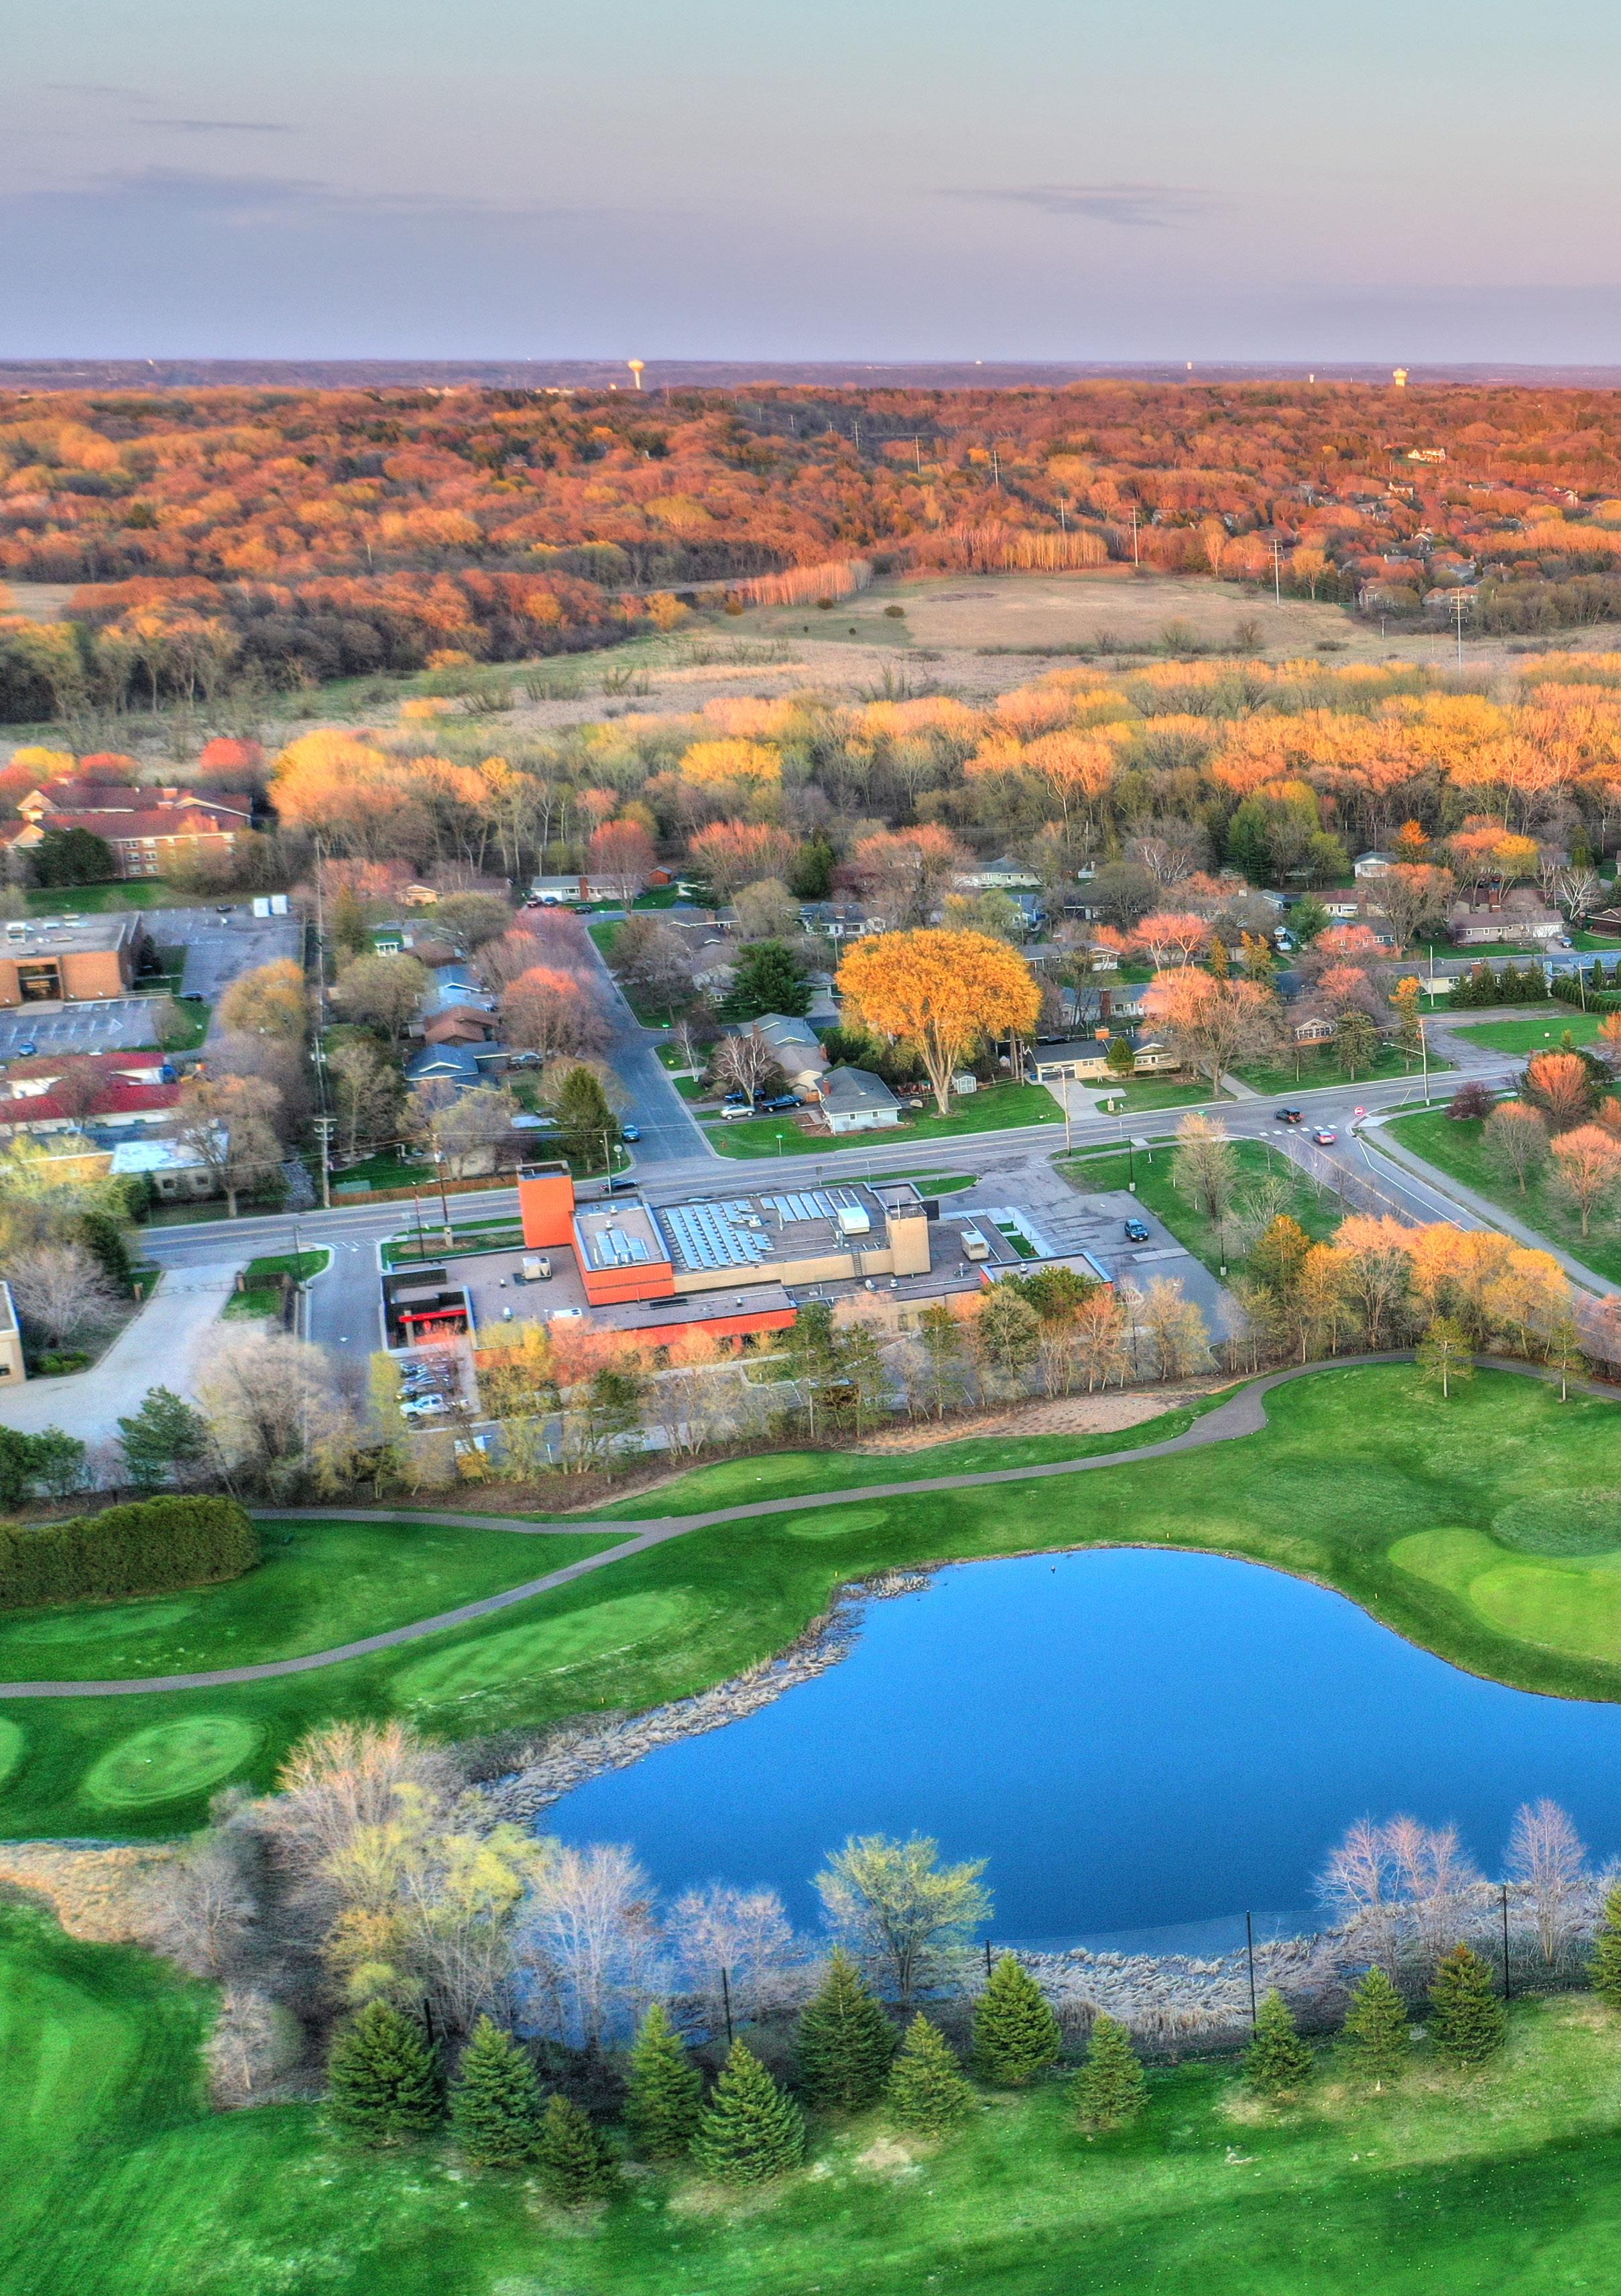

To obtain public feedback on analysis, alternatives and/or decisions.

To work directly with the public throughout the process to ensure that public concerns and aspirations are consistently understood and considered.

To partner with the public in each aspect of the decision including the development of alternatives and the identification of the preferred solution.

To place final decision making in the hands of the public.
REFERENCE: International Association for Public Participation (IAP2). (2018). IAP2’s public participation spectrum. (On-line): https://iap2.org.au/wp-content/uploads/2020/01/2018_IAP2_Spectrum.pdf (PDF 160KB).
01 02 03 04


A Social Pinpoint engagement site was a digital home-base for this project. The major components utilized in the digital engagement platform included a landing page with project information, online mapping application, survey, and idea wall.


A series of small group discussions including individuals with similar interests, passions, or relationships with the City. Discussions with these groups were led by consultants to gain knowledge about the existing system’s strengths, weaknesses, and opportunities for improvement.


Representatives from the City meet with high priority community members or those who historically have been underrepresented in planning efforts where they are. Engagement included conversations with students at elementary, junior high and high schools within Mendota Heights, in addition to the Rotary Club and active adult communities,


In-person conversations, maps, and other activities that inform community members about the project and provide them the opportunity to give direct feedback on phase specific topics. Staff participated in two primary events for pop-up engagement including Frozen Fun Fest and Touch-A-Truck.
513 unique visitors participated in the online survey tools for a total of 680 contributions 46 individuals participated in the focus group listening sessions
• 120 teens and children were visited in their respective classes as part of the direct connect
• 505 individuals engaged in conversation with staff during pop-up events
Phase 1 engagement began in late January 2024 and ended in May 2024.
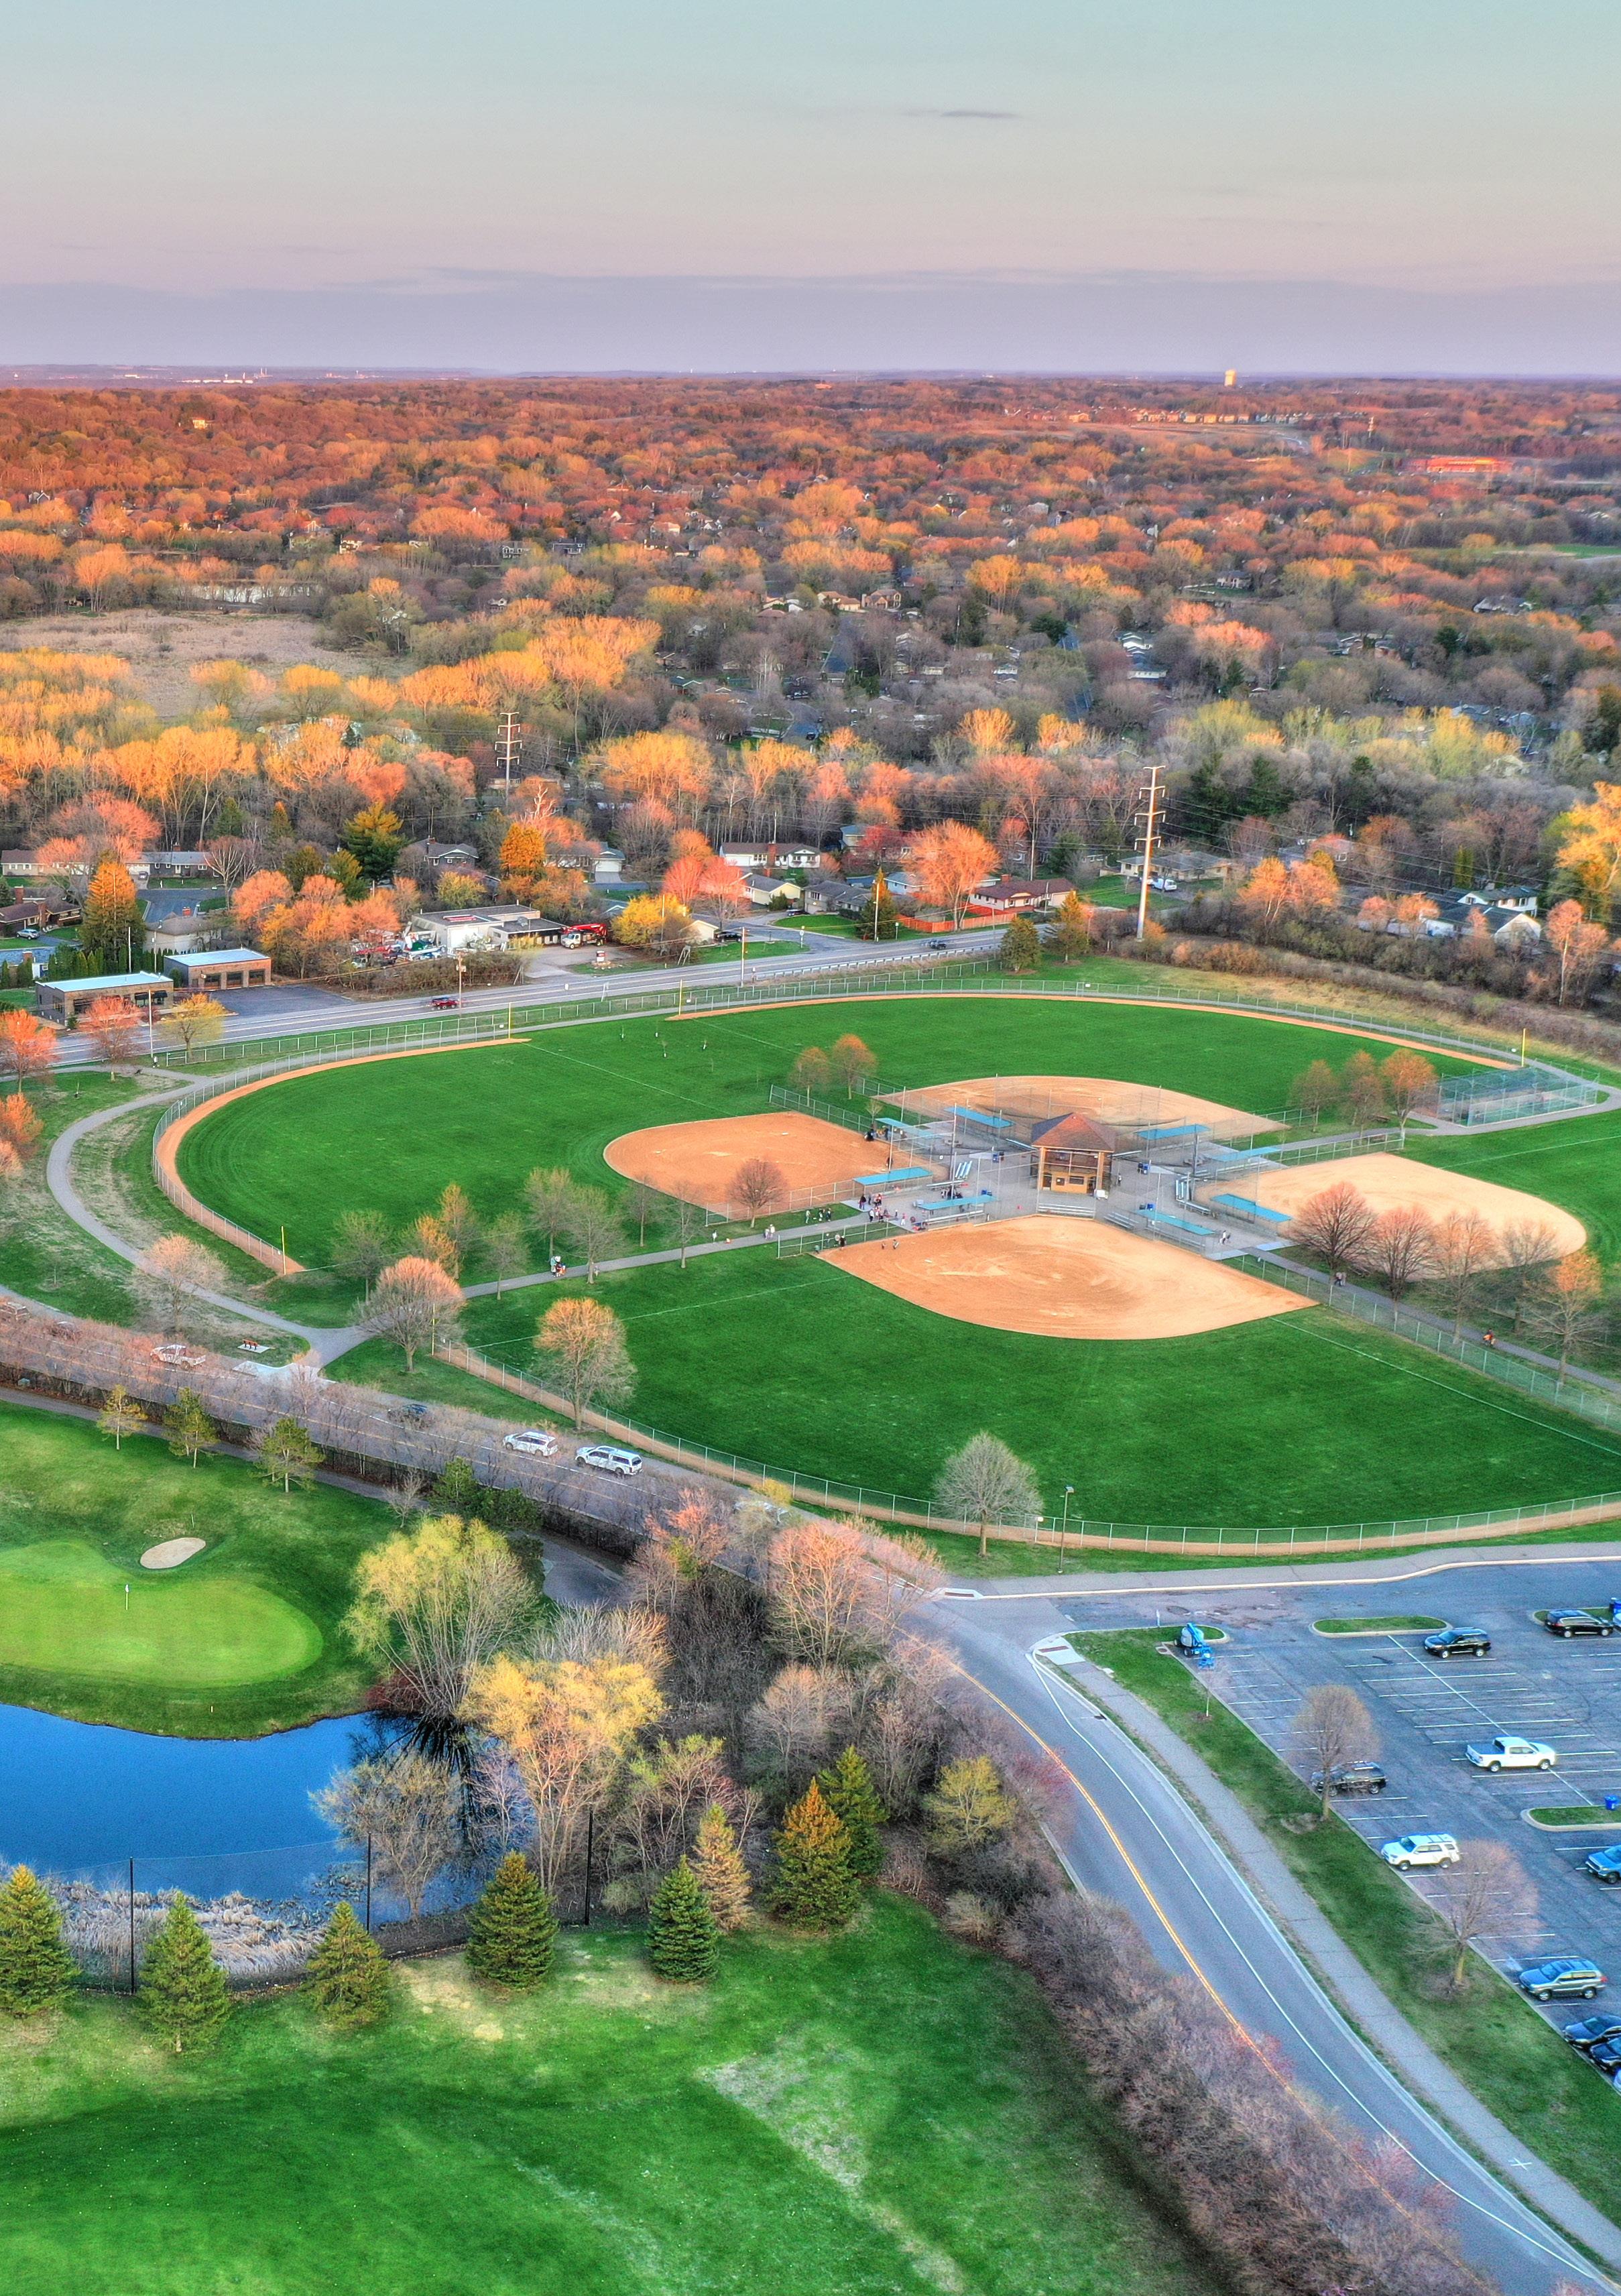
At the end of Phase 1 Engagement , results were aggregated and reviewed. There were five primary themes shared across all groups as seen in the following summaries.
1- Residents like the scale, condition, character and locations of the existing parks and want these preserved in the future park system.
2- Connections between parks and neighborhood connections leading into parks should be improved for overall safety and accessibility.
3- Park amenities should be diversified to better meet the needs and interests of all residents. Specifically, residents are interested in passive recreation amenities, community gathering, and connection to natural resources. There was also a strong interest in aquatics programming.
4- Accessibility is a concern across the park system. Residents expressed a desire for improvements that not only meet accessibility standards but also provide unique and inclusive opportunities for people of all abilities.
5- Residents want flexible community gathering spaces - both indoor and outdoor.

Approximately 500 individuals completed an online survey via Social Pinpoint to share their opinions about the current Mendota Heights park system and suggest areas for improvement or diversification. Overall, residents expressed enjoyment of the park system and a strong fondness for memories created in the parks. However, they also identified needed improvements and desired additions that could enhance the system now and into the future.
The trail system was identified as a primary strength of the existing park system. In particular, residents highlighted the number and length of trails as standout features. Participants also praised the neighborhood parks—specifically their number, maintenance, cleanliness, and proximity to homes— as valuable community resources that contribute to a park system residents enjoy using. Many shared how they use the parks for watching sports events, enjoying nature, and spending time with family and friends. Residents also appreciated the abundance of sports fields and noted the recent addition of pickleball courts as a welcome improvement.
Despite these positives, residents expressed frustrations with certain aspects of the parks and the overall system. Common concerns included the limited diversity of amenities, poor trail connections, unsafe crosswalks and lack of sidewalks, outdated baseball/softball diamonds, inadequacies in youth sports programs, and the absence of water-based recreational activities. Respondents emphasized the need for a broader range of activities and more accessible play environments. While the City was recognized for offering many program facilities, residents noted a lack of variety in the programming. For example, although there are numerous baseball and softball fields, many residents expressed interest in additional options such as mountain biking and cross-country skiing.
In summary, while residents of Mendota Heights are generally fond of their park system, they would like to see expanded programming and enhanced safety features in the future.
PARK
115 residents wrote that the level of maintenance of the parks is sufficient.
89 residents wrote that there are a lot of parks.
84 residents wrote that there are a lot of trails.
73 residents wrote that the parks are conveniently located.
68 residents wrote that the parks are kept clean.
60 residents wrote the parks’ trail system is not well connected.
SAFETY WATER ACTIVITIES
55 residents wrote that safer road crossings to the parks should be added.
34 residents wrote that the parks are lacking water activities. 26 residents wrote that the baseball/softball diamonds need updating.
23 residents wrote that the youth sports programs need improvement.
How frequently did you or others in your household visit Mendota Heights parks in the past year?
Within the last year have you traveled out of Mendota Heights to use a recreation facility or program?
Which improvements could be made to EXISTING Mendota Heights Parks?
Would you favor or oppose expanding recreational opportunities?
What new, updated, or additional amenities would you like for Mendota Heights Parks?
How
Approximately 95 residents of Mendota Heights completed the online mapping activity through the engagement website. Residents were able to leave pinpoint comments on the parks under four classifications; idea, favorite park, more of this, and less of this. The majority of pinpoints left on the parks were under the idea classification. The park with the most pinpoints was Hagstrom-King Park with 13 pinpoint comments.
Two topics that came up the most within this activity is the idea of adding irrigation systems and the idea of adding more pedestrian crossings/pathways. Residents often brought up that the fields and diamonds are very dry and bumpy and could benefit from an irrigation system to help maintain their condition. Additional pedestrian pathways and crossings are heavily requested to make the commute to the parks safer and more convenient.


GOLF COURSE
KENSINGTON
MENDAKOTA
HAGSTROM-KING
FRIENDLY MARSH
ROGERS LAKE
Idea!
Re-pave the bike path
New playground equipment would be great
Install a new basketball hoop
Idea!
Favorite Park
Favorite Park
Add irrigation to the fields
The tennis courts are in great condition
Good pickleball courts
Love the pickleball courts
Idea!
Idea! Idea!
Needs a connecting pedestrian path
Needs a connecting pedestrian path
Needs a connecting pedestrian path
Less of this
Idea! Idea!
Idea!
Favorite Park
Favorite Park
Favorite Park Idea!
Groom ski trails on par 3
Unsafe to cross the street to access the park
Tennis courts could use better surfacing
Replace tennis courts with pickleball courts
Rebuild playground to be accessible for all
Love the trails that parallel 35E
Love the trails here
Field is not safe enough. Could use irrigation
Idea! Less of this
Connect to access Viking Lakes
Solar light stop sign to control traffic
Idea! Idea!
Expand parking
Add a splash pad
Idea!
Idea! Idea!
Idea! Idea!
Idea!
Idea!
Less of this
Idea!
Idea!
Idea!
Control weeds and mulch areas along path
More of this
Great connection
Add path connecting Mendakota and Decorah
Update baseball/softball fields to turf
Install field lighting for evening games
Install scoreboards
Renovate to accommodate youth baseball.
Only focuses on baseball/softball
Add steps to access slide
Add path connecting to Hampshire Dr
Barrier to prevent basketballs from getting lost
Add path connecting to Hampshire Dr
Add a scoreboard
Add educational components to bog
Add bocce ball courts
Idea! Idea!
Favorite Park Idea!
Add an accessible playground
Favorite Park
Idea! More of this
More of this
Less of this
Idea! Idea!
Less of this
Favorite Park
Favorite Park
Idea! Idea! Idea!
Favorite Park Idea!
This is an awesome park
Basketball courts and hoops are great
Great playground and zipline!
Fields are dead and dry
Asphalt bike path is deteriorating
Add an accessible walkway
Improve accessibility
Please don’t create a boardwalk
Trail needs resurfacing
Really enjoy walking through these trails
More of this
More of this
Beautiful natural trails
Add rentable lockers
Great, fun park
Adding facilities like skate parks for teens
WENTWORTH
VALLEY VIEW HEIGHTS
CIVIC CENTER
VICTORIA HIGHLANDS
MARIE
DOG
MARKET SQUARE
Idea!
Bring back the ice rink
Skating area in the winter
Basketball court needs to be updated
Softball field needs to be updated
Idea! Idea!
Favorite Park Idea!
Basketball court needs to be updated
Favorite Park
Less of this
Less of this Idea!
More of this
Family walks to the park often
Really small park
Expand basketball court and update hoops
Add a splash pad
Family uses park for birthdays and picnics
Softball field is in rough shape
New playground is great
Install lights for evening games
More of this
Idea! Idea! Idea!
Less of this Idea!
Refurbished field looks great
Install irrigation system for fields
Baseball outfield is very bumpy and unsafe
Put a fence by the playground near water
Favorite Park
Favorite Park
Favorite Park
More of this
More of this
More of this
Favorite Park
More of this Idea!
Close to neighborhood
Great playground
Great playground and tennis courts
Expanded basketball court
Great playground with lots of options
Love the pickleball courts
This park is great for all
More spaces like this to sit and gather
A series of conversations were held with selected small groups of individuals with similar interests, backgrounds, and relationships with the City staff and consultants. Consultants led discussions to gain knowledge about the existing system’s strengths, weaknesses, and opportunities for improvement as seen by their communities.
FOCUS GROUPS INCLUDED:
Athletic Associations + Sports Clubs
S.W.O.T.
Active Adults
Partners
(schools, cities, nonprofits, county)
Accessibility + Inclusion
To assess the quality of the parks, a SWOT (strengths, weaknesses, opportunities, and threats) analysis was used to structure the conversations with the focus groups and get a robust assessment of the park system. Overall, the conversations were very positive of the park system. Conversation really focused on the strengths and opportunities of the park system. Common themes shared across the diverse groups included:
STRENGTHS
The Mendota Heights Park System contains many parks, trails, and amenities that are valued resources to the community. The number of facilities and the location in neighborhoods are of particular value.
WEAKNESSES
OPPORTUNITIES
Park facilities lack diversity and do not fully accommodate all groups within the community. There is a particular shortage of programming options beyond athletics, a need for flexible indoor spaces, and a lack of infrastructure that supports individuals with varying physical needs and abilities.
The park system has an opportunity to expand and upgrade the facilities and amenities to make them more inclusive and diversethis includes flexible indoor space. Strong relationships with adjacent communities and other governmental agencies can be leveraged to develop partnership programs or collaborative programming.
THREATS
The biggest threat to the Mendota Heights park system is insufficient funding. There are concerns that current funding levels are inadequate to meet existing needs or to support long-term planning and improvements for the future.
There are many strengths of the Mendota Heights Park System. The parks are well placed, easily accessible, safe, clean, and unique. The park facilities are well taken care of, especially the sports facilities. City partners mention that they appreciate staff and their great communication and willingness to partner with other organizations. Participants expressed their fondness for the natural aspects of the park system. They enjoy the trail system and that the parks feel like they are in the countryside. Dakota County’s inclusive playground is a strength and City partners would like to see more playgrounds like this added into the park system.
Three primary opportunity themes emerged during the focus group meeting: inclusivity, connectivity, and natural resources. Participants noted that existing parks tend to have similar designs and amenities throughout the system. They recommended diversifying park features to better serve older adults, individuals with disabilities, and those with a wider range of interests. City partners also emphasized the need to improve connectivity across the park system, highlighting opportunities to create stronger links between parks and the river, as well as to expand trail connections. Lastly, the group expressed a desire for a stronger emphasis on environmental stewardship and the protection of natural resources.
The group identified several weaknesses within the park system. One major concern is the gap between the community’s desires for park updates and the limitations of the current budget, which is unlikely to accommodate all of these requests. They also noted that general infrastructure improvements are needed, along with increased shade throughout the parks. While shade structures are one option, the group emphasized that additional tree plantings could also provide natural, long-term shade. Accessibility remains a challenge, and the addition of more inclusive playground equipment was recommended. Finally, there was strong support for adding a splash pad to the park system to enhance recreational opportunities for families.
Some of the biggest threats to the Mendota Heights Park System include climate change, being unprepared for changing trends & demographics, limited new development, maintenance of new facilities, high traffic, and long term park funding. Hesitation and unwillingness to make changes may have a detrimental impact on the park system.
The Mendota Heights park system offers ample space, including generous areas of open space. Parks are consistently described as clean, well-maintained, and safe. The system includes strong existing amenities such as a skate park, golf facilities, and pickleball courts. Parks provide activities for both children and adults, and the separated bike path system is appreciated for enhancing safety, particularly for young users. The dog park is another highlight—heavily used and beloved by the community. Overall, residents express deep appreciation for the park system, and City staff are recognized for being responsive and attentive to community concerns.
The main opportunities with the park system include maintaining and improving what is already existing first. There are many improvements that can be made to the park system as it is today, including improvements to the golf course clubhouse, accessibility at the parks, lacrosse fields, pickleball courts, trails, weed control, and the dog park. Mendota Heights may also benefit from adding facilities such as an indoor rec center, more hockey rinks, and trail extensions. More signage in the parks would be beneficial and add more educational opportunities.
There is very little variety of activities to do in the parks. Each park has very similar facilities and residents would like to see different activities such as bocce ball introduced. There is also a concern with lake activities. Rogers Lake water quality is not great for recreational use and the fishing area at the lake could be improved. There is also a lack of winter sports within the parks besides skating rinks. Residents often have to travel outside of the park system to partake in other winter activities. There are also not enough bathrooms or seating areas. Finally, maintenance of the landscape itself can be improved. Residents find the sports fields to be dry and foliage to be overgrown.
The biggest threats to the Mendota Heights Park System involve circulation, funding, and vandalism. The trail system within Mendota Heights can be improved to be safer for all residents. Some areas are considered to be dangerous because the path is degrading. Car traffic is also a problem within Mendota Heights. Some parks are located on busy roads with no crosswalk which makes traveling to the parks very dangerous for children. There are also concerns that the current funding will not be sufficient to cover maintenance and future development. Finally, there is a concern that the parks are not secure enough and vandalism will become an issue like the vandalism found in Friendly Hills.

The main strengths of the Mendota Heights Park System is the ample amount of parks within the system and the variety of facilities that are found at each park.
The Mendota Heights park system has the opportunity to become a truly inclusive space for all community members. Efforts should be made to expand communication and collaboration with accessibility-focused groups to better understand and meet diverse needs. Accessibility improvements should be integrated throughout the park system in a way that fosters inclusion, rather than isolating individuals with disabilities. Features that support accessibility should be thoughtfully blended into the overall park design. In addition, clear communication strategies are needed to help residents identify which parks best suit their specific needs. Park programming should also strive to be more inclusive and reflective of the community’s diversity. Finally, additional signage should be installed to improve safety and wayfinding, particularly for individuals with disabilities.
The park system presents navigation challenges for individuals with disabilities, as some parks are considered accessible while others are not. Inconsistent and inadequate surfacing is another concern—certain materials, particularly those that are too soft, make it difficult for wheelchair users to access key amenities such as playground equipment. Additionally, the park system lacks adequate accommodations for older individuals with disabilities. For example, there are no adult changing tables, and programming for teens and adults with disabilities is limited. Expanding developmental disability programming would provide meaningful opportunities for inclusion, social connection, and community engagement for these groups.
Threats to the park system include both a lack of fencing and insufficient funding. Installing fencing around play areas—especially those located near bodies of water—is critical to ensuring the safety of children. Additionally, there is concern that current funding levels may be inadequate to address the needs of individuals with disabilities, which could limit both the accessibility and inclusivity of the park system.

The Mendota Heights Park System is described by residents as having a small town vibe. Residents enjoy that the parks are quiet and feel secluded/remote. There is also a good amount of mixed-use facilities at the parks that allow for a wider variety of activities. The smaller neighborhood parks are also loved by the community and provide residents with space to socialize with their neighbors in a space that is not very busy. Finally, sport user groups mentioned that they are fond of the sports setup at Mendakota Park and would like to see it maintained and improved.
Mendota Heights has the opportunity to become more involved in both youth and adult sports. Sports programs should be able to host events and tournaments in order to reduce fees and bring more people into the parks. The concession stands should also be available for use for these events/tournaments to help raise money for the programs. The sports programs could also benefit from getting annual sponsors. Finally, there is an opportunity to expand certain sports programming such as lacrosse. The park system could greatly benefit from adding more fields for lacrosse and soccer.
Overall, the Mendota Heights park system lacks the space and facilities needed to adequately support sports programs. For these programs to thrive, they must be able to host events and tournaments— something that is currently not feasible due to limited space and outdated infrastructure. In addition, insufficient parking further limits the capacity to accommodate large events and expanded programming.
Another significant weakness is the lack of lighting on sports fields and courts, which restricts the ability to hold evening games and tournaments. Finally, there is a pressing need for additional soccer and lacrosse fields. With approximately 1,500 children participating in community soccer, the current number of fields is not adequate to meet the growing demand.
A primary threat to the park system is the deteriorating condition of its trails. Some residents view the degraded surfaces as not only hazardous but also as barriers to accessibility. Currently, many trails are uneven and difficult to navigate with carts, strollers, or wheelchairs. This limits everyday use and participation in events for individuals with mobility challenges, families with young children, and others who rely on smooth, accessible pathways.
Youth and children are often underrepresented in engagement. To ensure their voices were captured and amplified in this process, the City staff met with a diverse range of students, This included students at Two Rivers High School, St. Thomas Academy, an after school program for kids in middle school, and students in the 4th grade at Mendota Elementary. Young children were also included in the process at the Touch-A-Truck event. This direct contact with students and children will be repeated during the planning process.
16-18 YEARS OLD
High School teens from St. Thomas Academy and Two Rivers High School were asked questions on how they use the parks in Mendota Heights and what they would like to see added to them. Teens from both schools mentioned that they like to use the parks to hang out and play sports. They also mentioned that they would like to start sports groups for teens where they could meet up with friends and play casual games/tournaments. Teens from both high schools mentioned that they would like to see more programs meant for teens where they could meet and socialize with others their age. Teens from Two Rivers High School would like an addition of a community garden, farmer’s market, winter activities, and hammock areas. They also mentioned that they would like more winter programming.
8-11 YEARS OLD
Children aged 8-11 at an after school program and Mendota Elementary were asked to take a survey asking about what they like to do at the parks. They were also asked to draw their ideas for their dream parks. Most students reported enjoying playing at the playgrounds, playing sports, and meeting with their friends. The children shared many ideas for the parks in their drawings, but the items that appeared the most were pools, large slides, tall ziplines, trampolines, and basketball courts. The children also mentioned activities such as rock climbing, walking/biking on trails, and different sports. Music festivals and food truck events were also a popular request. Children at the after school program specifically requested classes in the parks such as anime and art class.
3-6 YEARS OLD
Young children at Mendota Heights’ Touch-A-Truck event were asked the same questions as the elementary children and were also asked to draw their dream parks. Similarly to the elementary students, most children in this age group reported that they liked playing at the playgrounds the most. When asked to draw their dream park most kids drew various types of play equipment. They specifically drew monkey bars and slides often. The children also drew things such as pools, fishing, and other water activities.
PRIMARY THEME: AMENITIES THAT SUPPORT COMMUNITY CONNECTIONS AND GATHERING
Teen sports leagues and additional courts/fields
winter activities
16-18 Years Old
• Hammock locations
• Pickleball lessons & tournaments
• Events for teens
• Outdoor classes
• More soccer fields
Years Old
• More soccer fields Playground • Tournaments • Football camps
Years Old
• Walking/biking trails
• Splash pad
• Open space
• Merry-go-round • Climbing wall
Seesaws
Postcard, Sticker Board
Postcard, Sticker Board
Postcard, Sticker Board Postcard
Kids Activity, Postcard Discussion
Postcard Consultants
High School Activity High School Activity
Kids Activity, Postcard
Kids Activity, Postcard Survey, Discussion
Frozen Fun Fest: Ice Block Party
Frozen Fun Fest: Valentine’s in the Village Frozen Fun Fest: Puzzle Competition
Mom’s Club (Informal)
School Age Care Engagement Meeting with Augusta Shores Residents Rotary
Focus Groups
Upper School STEM Pathway at St. Thomas Academy Two Rivers Leadership Students
Mendota Elementary Touch-A-Truck Event
TPAC - Senior Citizens Families Families Families
Women, 50+ Children Seniors
Adults
Varies: 4 Different Groups Juniors and Seniors in High School Juniors and Seniors in High School 4th Grade Students
4-6 Year Olds
Seniors
02/09/2024 02/10/2024
02/11/2024 03/18/2024
04/11/2024 04/15/2024
04/17/2024 04/18/2024
04/26/2024 04/29/2024
05/07/2024 05/11/2024
05/16/2024
4:00-6:00pm 5:00-8:00pm 9:00am-3:00pm 10:30-11:30am 4:00-5:00pm 3:00-4:00pm 7:30-8:00am 1:00-7:00pm 1:00-2:00pm 12:00-1:00pm 1:00-2:00pm 10:00am-12:00pm 1:00-2:00pm
Meredith Lawrence, Ryan Ruzek
Meredith Lawrence, Consultants
Eisfeldt Meredith Lawrence, Steph Meyer
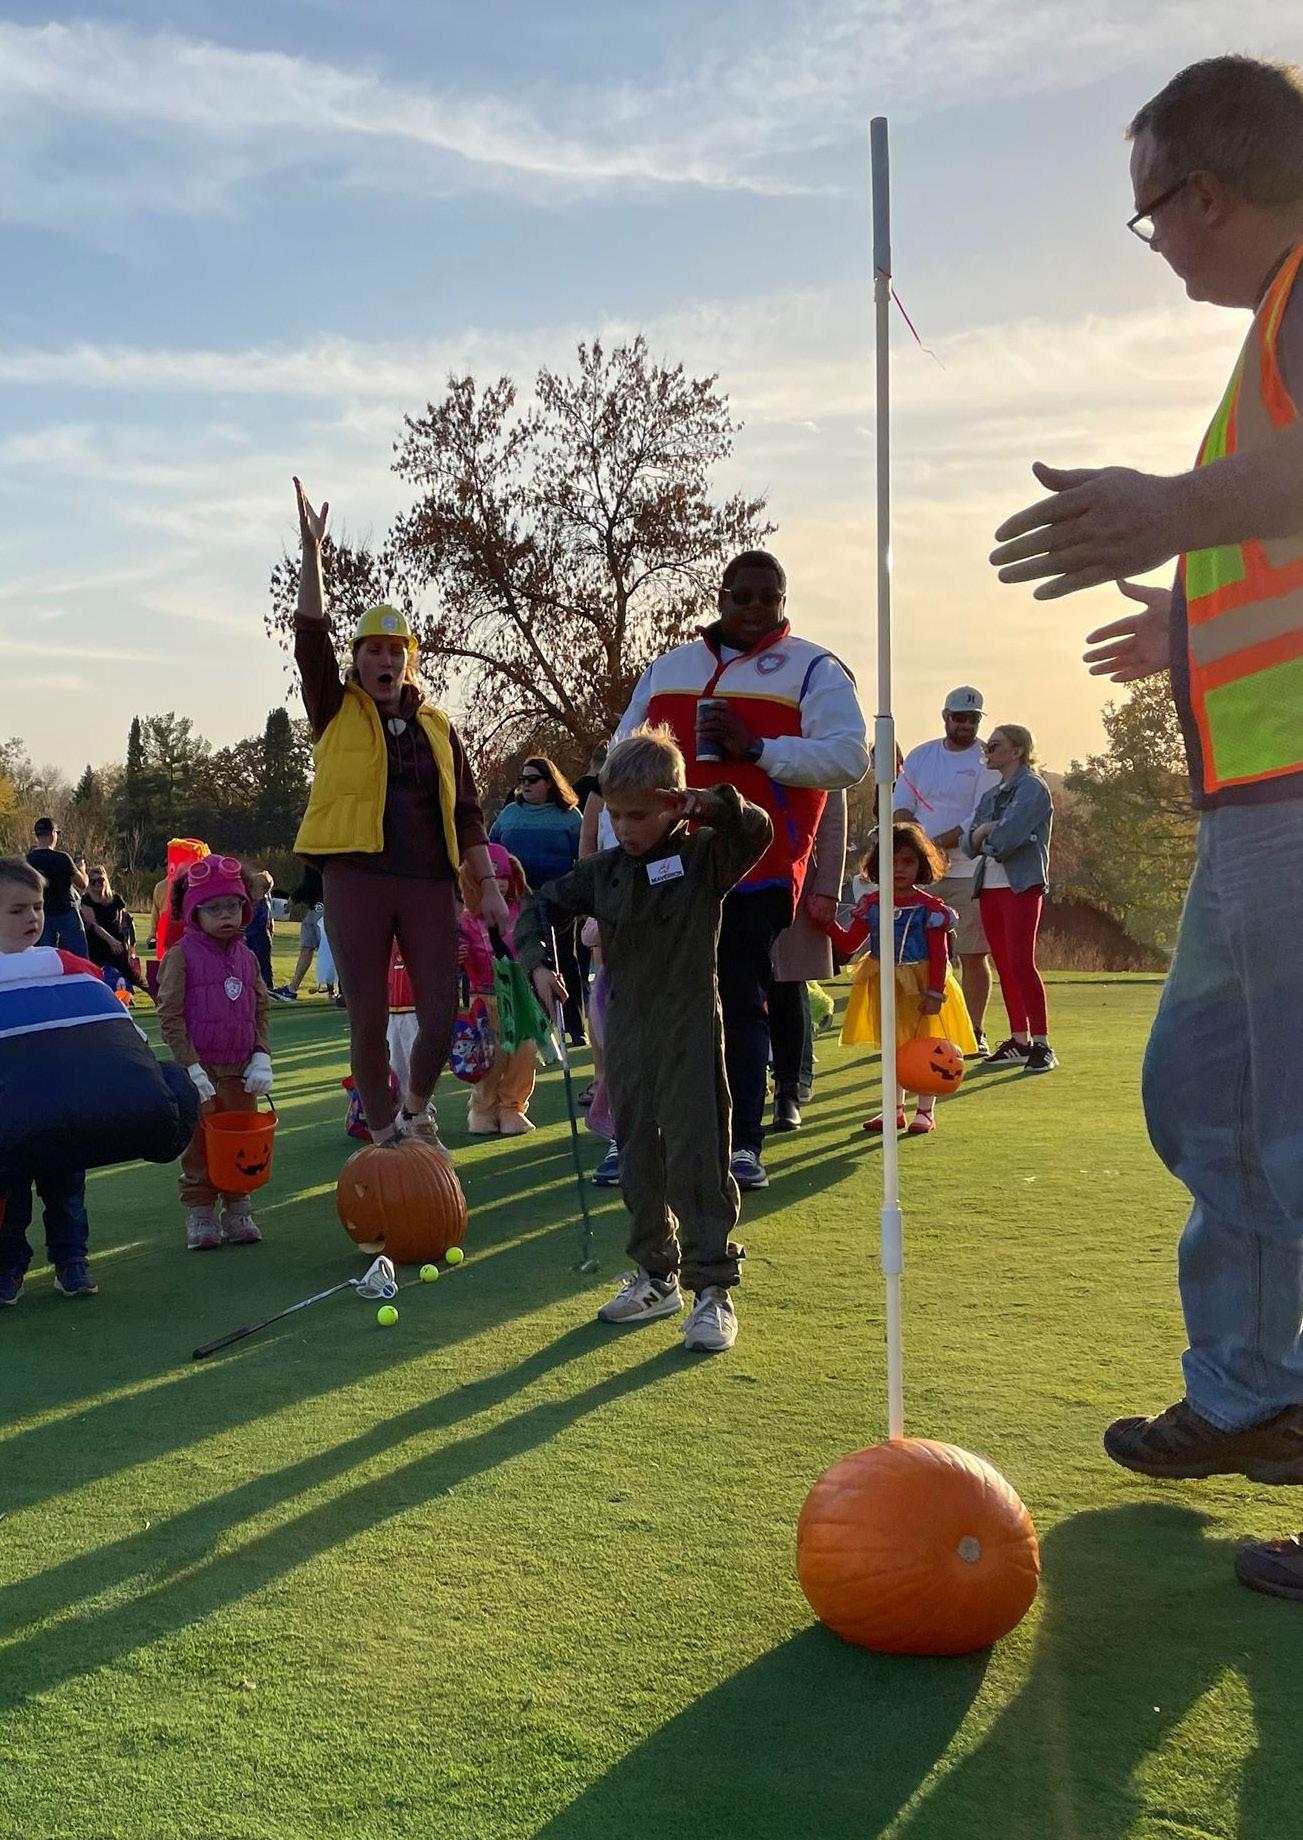
Phase 1 of community engagement was completed in the spring of 2024, with the primary goal of capturing community-identified strengths and weaknesses of the existing Mendota Heights park system, along with initial ideas for improvements, preservation, and long-term visions. A robust set of tools—including digital, in-person, and targeted methods—were used to gather diverse opinions and voices within the community.
Results from Phase 1 indicated that while the community generally appreciates the size, location, and maintenance of their parks, there is a recognized need for overall accessibility improvements, general amenity updates, diversification of park features, and increased indoor space. Notably, over 90% of Phase 1 survey participants supported expanding recreational opportunities within the park system.
In parallel, an audit was conducted to assess the park system’s level of service, park conditions, programming, and financial sustainability. This audit echoed the community’s feedback, highlighting the need and opportunity for improved accessibility, greater program and amenity diversity, additional staffing, and indoor facilities to better serve the larger Mendota Heights community now and in the future.
A review of the department’s current budget and operations confirmed that the existing budget can only support current staffing, programming, and ongoing park maintenance. It does not provide for additional staffing, expanded programming, larger-scale updates, new park features, or significant investment projects, such as indoor facilities.
To create actionable recommendations for the Master Plan and prioritize community-identified improvements, it became essential to gauge community interest in alternative funding methods for the park system. The primary goal of Phase 2 engagement, therefore, was to assess community support for increased funding through tax referendums, partnerships, and other avenues.
Phase 2 engagement took place from July through October 2024, utilizing a short survey (available both digitally and in hard copy) and a second round of focus groups. Staff attended park and community events to inform residents about the survey and encourage participation. The survey received 594 responses, with over 40 individuals participating in targeted focus groups. Staff estimate approximately 500 direct in-person contacts.
At the end of Phase 2 Engagement, results were aggregated and reviewed, revealing five primary themes shared across all groups, summarized below:
1- Strong Support for Funding Expansion: Residents overwhelmingly supported some level of expanded funding for park system improvements and/or staffing. A significant majority of survey respondents favored a tax referendum. This is particularly notable given that residents were not presented with specific designs but were instead asked if they generally supported the types of projects proposed.
2- Top Priorities Consistent with Phase 1: Echoing Phase 1 findings, the top priorities for expanded funding support included accessibility improvements, expanded programming and staffing, and increased indoor community space.
3- Preference for Enhancements Over New Development: There was limited support for new park development, with the community favoring projects that enhance the existing park system. The primary exception was the strong support for additional indoor community space.
4- Recognition of Park System’s Value: Engagement participants expressed that the park system is a valuable asset to the Mendota Heights community and an important contributor to quality of life. Some participants shared examples of amenities and programs from other communities that could serve as models for Mendota Heights.
5- Interest in Detailed Concepts: Participants expressed a desire to see more specific concepts and designs for potential improvements to better understand proposed enhancements.
Approximately 594 individuals completed an online survey via Social Pinpoint to share their opinions on potentially supporting expanded funding for the park system. This was not a statistically valid survey. Overall, residents responded favorably to expanded funding, with priorities aligning with the Phase 1 results.
About a quarter of respondents did not support any expanded funding. Those who opposed shared various reasons in their comments. Some were categorically opposed to any tax increases, regardless of the project type, while others requested additional information—such as specific plans or costs—to make a more informed decision.
MASTER PLAN APPENDIX 2
Would you be willing to pay an additional $4.00 per month in additional taxes (for a taxpayer with a median value home of $537,000) to support expanded staffing and associated programming?
RESPONSE - 67% of respondents favor increased taxes to support expanded programming.
585 RESPONSES 9 SKIPPED
Ceramics, family friendly exercise classes
Parks, sidewalks, trails as opposed to activites Public gathering space to rent Supervised gym games year round Programming for retired and elderly
INFORMATION NEEDED 20 OUT OF 65
Would the programs be offered free of charge?
It depends on what additional programs were being offered
Is a user fee-based approach more sustainable?
Paying too much in taxes
No use for expanded programming or associated staff
Satisified with the current options in our city and surrounding nearby cities
Taxes, fees, and costs are going up on everything
The city can’t even take care of current parks
Doubtful of participation
Request is one of many that add up to large dollars
All of these recreational opportunities are already offered through the local tridristrict community education
Is there programming that people can pay to sign up for, or does it differ by being tax funded?
Not understanding the question This question feels too broad
Will the money be spent on administration?
“Associated programming" requires definition
Is this saying homes with median value and higher would be assessed?
What is the current attendance for similar events?
Understanding of the $4 per month concept. Yet, what is the wholistic impact of this funding (i.e. Specific program and/or staff)?
Not enough information to say yes. Do we have solid info about the success of such programs? Would taxes go back down if they failed?
This indoor space would not be a stand-alone facility but rather a component of the planned new municipal building. Would you be willing to pay an additional $3.00 per month for 20-years in additional taxes (for a taxpayer with a median value home of $537,000) to fund indoor community and recreation space as part of a larger project?
RESPONSE : 68% in favor of increased taxes to fund indoor community and recreation space
77 PEOPLE PROVIDED COMMENTS:
WHAT DO THE PEOPLE WANT?
More programs are needed for middle age homeowners, it's not all about kids & seniors
Basketball courts
Tennis courts, Yoga, Arts
A community center with walking track and work out area like the city of Eagan.
An indoor community gathering space, e.g. for concerts or other programming or rental.
Indoor rec center
Lacrosse and other sports could use indoor options in the spring like surrounding communities
Indoor playground
583 RESPONSES 11 SKIPPED
WHAT ARE THE CONCERNS?
Not large enough of a community to require dedicated indoor park or community activity space
The private sector already provides most of these services
There are three High Schools and Two Rivers has expanded indoor space. Is this necessary?
Already paying too much in taxes
Eagan already has all the programming needed. Teens don’t want recreation and seniors can go to Thompson Park.
I don't think it is necessary
A new municipal building is not needed until it’s revenue is sufficient Batting cages
MORE INFORMATION NEEDED
What programming and recreation are we talking about?
What % of the municipal building would be allocated to community and recreation space?
Is there a location for the Community Center?
I would need more information on the indoor space to actually decide.
The current outdoor facilities serve needs and there are plenty of rental spaces in the surrounding community; would rather see more open green space than more development of structures
How many square feet? What is the specific use?
How big is this need, and how much does it turn into additional revenue for our city?
What size (i.e. capacity), amenities and availability would this have?
Would you be willing to pay an additional $4.00 per month in taxes (for a taxpayer with a median value home of $537,000) for the next 20-years to improve park accessibility?
RESPONSE - 64% of respondents favor increased taxes to improve park accessibility.
580 RESPONSES 14 SKIPPED
54 PEOPLE PROVIDED COMMENTS
WHAT DO THE PEOPLE WANT?
Repair the uneven pavement on trail system
In favor of improving our trail system and having a more rigorous maintenance program for it
A big need in Mendota Heights is more trails
Sidewalks and paths, especially along Dodd, Delaware, Wentworth.
Would like to see 50% of our parks meet universal accessibility. We do need improved crossings and safe routes.
Prioritize safe access to existing trails first
This should be a priority, not waiting 20 years to complete a project
Mendota Heights still has lots of potential space for new or expanded parks and trails
We are an affluent, top-tier community in Twin Cities; this is reason by itself, to stay up-to-date on things such as accessibility of our parks & facilities
MORE INFORMATION NEEDED
Fund these projects a little at a time with current budget
Would taxes go back down if they failed?
This proposal at least has a plan to back it up
I would like to see more specific plans before committing to paying additional taxes for accessibility
WHAT ARE THE CONCERNS?
The trails are fine
Taxes are already too high
Individually these all sound good, collectively, they start to add up. While I’d like all of these, I think accessibility needs to be prioritized
It feels like this is okay right now. New fully accessible playground just opened at Somerset Elementary
Taxes are high enough as home values seem very inflated in the area for older homes especially
Yes, but with a caveat. Did “current standards or best practices” change over time, leaving the city in a deficit? Or was this a result of poor planning and budgeting?
Mendota Hts. parks have sufficient amenities. What's needed is significant upgrades for the asphalt trails. Resurfacing? How about installing retaining walls and drainage systems to help keep the trails dry?
I feel like some of this money should already be in the city's budget - like maintaining the trails
This seems to be similar to question #5. Accessibility would be part of upgrades
Are all of these extra taxes compounded? So with the first questions $4 and the second $3 and now this, it’s up to $12? Or are we choosing between all of these?
Would you support funding the development of a new park in the western area of the city? This new park is estimated to add a monthly tax input of $6 (for a taxpayer with a median value home of $537,000) for the next 20-years?
RESPONSE - 61% opposed increased taxes to fund a new park on the western side
69 PEOPLE PROVIDED COMMENTS:
All can enjoy
A new park in this area would be great
I live in the NE part of the city. I was a member of the parks & trails committee in the 80s that advised the city council. We did what was possible then, but it wasn’t enough. The western part of the city should have a park nearby
Yes! I strongly believe in this and would pay even more to make this a reality! Thanks for putting this plan together
Equity is a priority
MORE INFORMATION NEEDED
The western area should be better defined to more clearly answer this question
I don’t understand where this would go, so it’s hard to support it
What kind of park amenties and access are provided?
Is there space available for a park? Where is the western area in question?
Would want existing parks updated before developing a new park. It would have to be a major draw in terms of special park features
I’d be open to it, but I’d want to know more about the location and proposal to support this.
582 RESPONSES 12 SKIPPED
New park? No. But redoing Mendakota, yes
That is too high of a price tag when there are other available parks in the city
We need to maintain and repair existing things first
No tax increases. It might seem like just a few dollars. But just a few dollars are coming from all over. No more!!!
We have nice trails but personal safety is troublesome making a simple walk a risk
The western side of our community is mainly industrial and the cemeteries. Almost no housing. Not sure why a park
32 OUT OF 69 RESPONDENTS NEED MORE INFORMATION
Would you support a general parks referendum (increase in taxes for a period) to update/ upgrade selected parks, add the requested amenities to the park systems, and complete larger park infrastructure projects? Additional master planning work would be completed to identify specific improvements. Please select the range you would be willing to support.
in favor of at least one of the tax increase ranges
I support targeted projects to improve existing fields as well as an indoor facility that would support programming during the winter months.
I would like to better understand the current budget and why existing funds are not adequate.
Would need to see a plan before making a decision
I think we need a calisthenics park. Most fitness is being centered around children and tennis/pickleball players with little diversity around adult fitness
Would pay higher than Tier 3 for a plan that includes more places, paths, and sidewalks to connect to various areas across the city and help encourage reduced pedestrian usage on shoulders of streets
majority of these responses include those in favor of more or less than the ranges provided
RESPONSES 11
Has the city also looked into a Community Center concept with a multifunctional facility that could be rented out by the public for a variety of events.
Would be more willing to pay for a very specific project versus "general" funds
I would support $30/month, at least. If you ask for more I'll probably still say yes. I'd probably max at $150/month.
I have a different priority order than the listed levels above. I support comprehensive trail resurfacing, but not a destination playground
Please select all park system improvements and funding you would support and rank them from highest priority at the top to lowest priority at the bottom. 1 2 3 4 5 6 7 8
528 RESPONSES 66 SKIPPED
ACCESSIBILITY, TRAIL, AND SAFE ROUTE IMPROVEMENTS
$4.00 MONTHLY TAX INPUT FOR 20 YEARS
INDOOR GATHERING AND RECREATION
$3.00 MONTHLY TAX INPUT FOR 20 YEARS
PROGRAMMING AND STAFF
$4.00 MONTHLY, INDEFINITELY
GENERAL PARK UPGRADES AND IMPROVEMENTS TIER 1
$8.00 PER MONTH FOR THE NEXT 20 YEARS
NEW PARK DEVELOPMENT
$6.00 MONTHLY TAX INPUT FOR 20 YEARS
GENERAL PARK UPGRADES AND IMPROVEMENTS TIER 2
$15.00 PER MONTH FOR THE NEXT 20 YEARS
GENERAL PARK UPGRADES AND IMPROVEMENTS TIER 3
$22.00 PER MONTH FOR THE NEXT 20 YEARS
NONE
Increased tax inputs are the most reliable tool to ensure large funding needs are met. However, there are other methods to meet smaller needs. Would you be in favor of any or all of the following in increased park system funding?
557 RESPONSES 37 SKIPPED
INCREASING USER FEES, PROGRAMS, AND/OR RENTAL FEES
PARTNERSHIPS WITH PRIVATE ORGANIZATIONS
SPONSORSHIPS AND DONATIONS (WILL INCLUDE NAMING RIGHTS OR DONOR MARKETING)
CHARITABLE GAMBLING
OTHER
State and Federal funds
The State of MN, DNR and others.
Increased sales or property taxes on business and rental properties located in MH.
Your parks work within your existing budget parks shouldn’t have to be paid for with extra money
Raffles
Cut staff especially costly police. Fire department already has a nice $15M building where people can gather. Need to support youth hockey (goat hill like in Eagan structure) and ball fields for the youth. Honestly how many people cross country ski? Get rid of golf course and build a sports complex our wealthy community of families deserves.
Collaborating with other communities
Because I don’t know where this fits. Increasing rental and user fees is simply passing the cost off to organizations thus individuals. Ie increased ball field rental fees means higher registration costs which can make organized sports inaccessible to lower income families.
Charity runs/walks. Added benefit of getting people to know more of our trail system!
Art exhibits, exhibitors pay fee
Zoning and development plans could include renting out facilities for larger private events
Some smaller ticket items that were requested in Phase 1 engagement could fit within this existing budget. Of these what would you like to prioritize? (Select your top 3)
523 RESPONSES 71 SKIPPED
PLAYGROUND UPGRADES (ADDITIONAL SEATING, MINOR UPDATES TO SOME EQUIPMENT)
407 PEOPLE
WINTER ACTIVITIES (EG. GROOMING CROSS COUNTRY SKI TRAILS)
ADDITIONAL SEATING AND SMALL GATHERING AREAS (EG. SMALL SHADE STRUCTURE WITH TABLES) IN PARKS
392 PEOPLE 341 PEOPLE 278 PEOPLE
MINOR GOLF COURSE IMPROVEMENTS
PEOPLE
BASIC ACCESSIBILITY IMPROVEMENTS (EG. PATHWAYS TO EXISTING PICNIC SHELTERS)
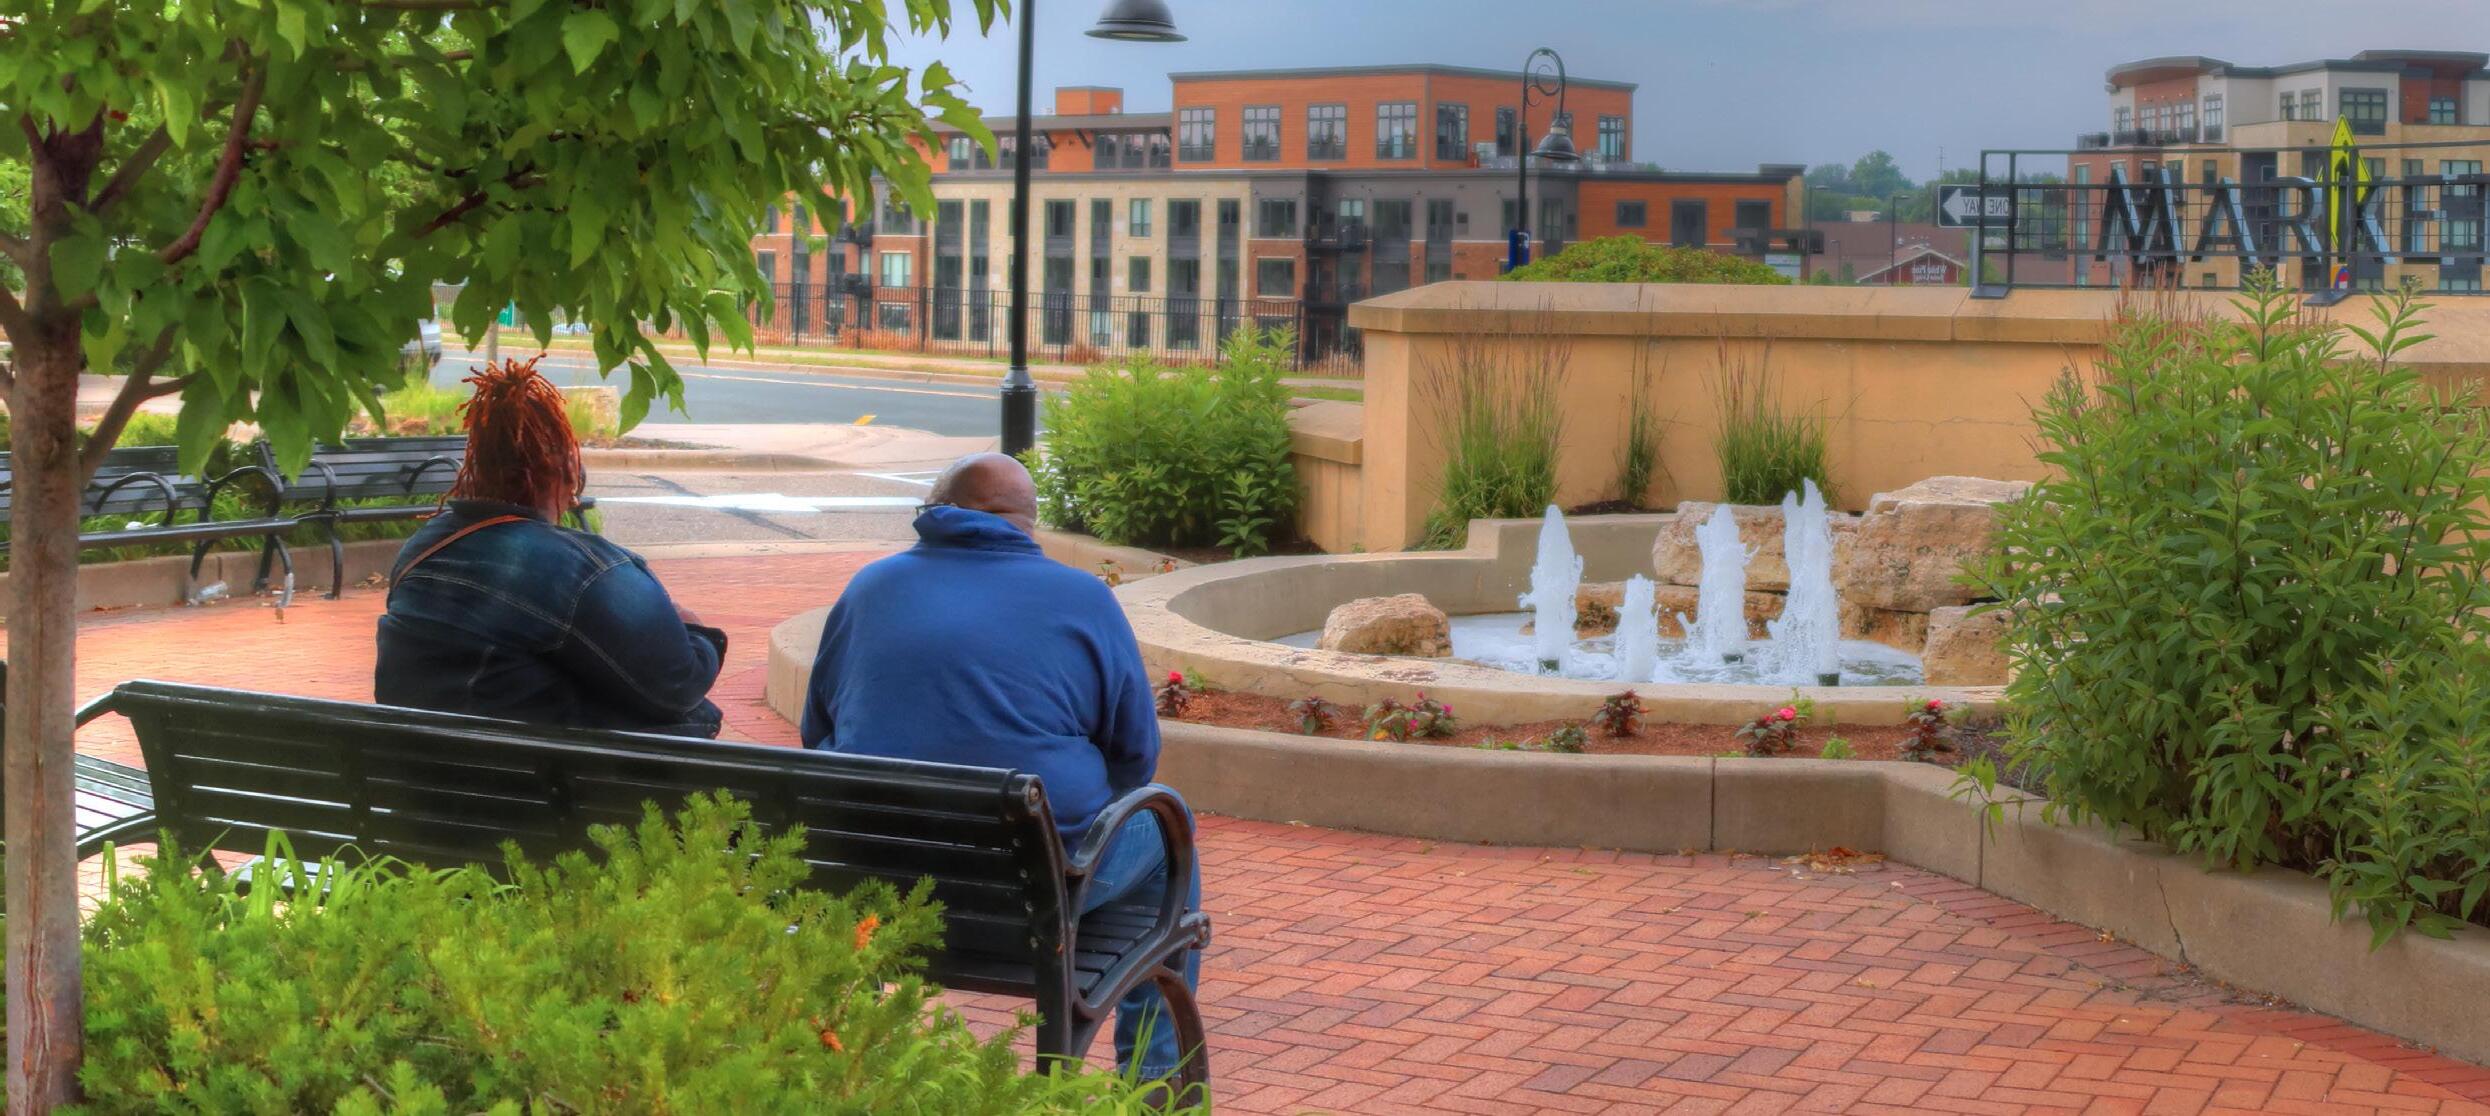
A series of small group conversations were held with individuals who shared similar interests, backgrounds, or relationships with City staff and consultants. These focus groups were facilitated by the consultant team to gather insights on the perceived strengths, weaknesses, and opportunities for improvement within the existing park system. This marked the second and final round of focus group meetings.
FOCUS GROUPS INCLUDED:
Athletic Associations + Sports Clubs
PRIORITIZATION EXERCISE
Active Adults
Partners (schools, cities, nonprofits, county)
Accessibility + Inclusion
In teams of five or fewer, focus group participants collaborated to prioritize the top improvements, expansions, or additions to the park system identified in Phase 1 of the Master Planning Process. Each item was assigned a high-level cost estimate (e.g., a park restroom at $400,000). The exercise involved three rounds: in the first round, teams selected items totaling up to $20 million; in the second, up to $10 million; and in the third, up to $2 million. This exercise aimed not only to give teams a sense of the cost of individual items within full budgets but also to illustrate how the numerous community requests must be balanced within the planning process. Across all focus groups, the top 10 selected items were:
1. PARK TRAIL + ACCESSIBILITY IMPROVEMENTS *PER PARK*
2. GENERAL PLAYGROUND UPDATES
3. SPLASH PAD
4. EXPANDED PROGRAMMING *INCLUDING STAFF*
5. PICNIC SHELTER
6. PARK RESTROOM
7. GENERAL FIELD IMPROVEMENTS
8. FULLY ACCESSIBLE PLAYGROUND
9. INDOOR COMMUNITY ROOM
10. WINTER TRAILS
$2,000,000
Splash pad
Fully accessible playground
Concession building with restrooms
General playground updates
Expanded programming (including staff)
Improved park communication and marketing
$10,000,000
General park renovation
Fully accessible playground
Splash pad
General playground updates
Winter trails
Park trail and accessibility improvements (per park)
Picnic shelter
Expanded programming (including staff)
Pickleball upgrades (per park)
Improved park communication and marketing
Existing trail system resurfacing
Indoor community room
Splash pad
General playground updates
Expanded programming (including staff)
Improved park communication and marketing
Park trail and accessibility improvements (per park)
Picnic shelter
Park restroom enhancement
General playground updates
General field improvements
Indoor community room
Refrigerated ice pad
Expanded programming (including staff)
Winter trails
Park trail and accessibility improvements (per park)
Park restroom enhancement
Park trail and accessibility improvements (per park)
Winter trails
Splash pad
Park restrooms
Expanded programming (including staff)
Hippo campus chair
Sensory chair
General ball diamond improvements
General field improvements
General playground updates
Picnic shelter
Park trail and accessibility improvements (per park)
Winter trails
Expanded programming (including staff)
Indoor community room
Fully accessible playground
Splash pad
Park restrooms
Hippo campus chair
Security staff
General field improvements
Concession building with restrooms
Field or diamond lighting
General ball diamond improvements
Premier field
General playground updates
Picnic shelter
Refrigerated ice pad
$20,000,000
Indoor community room
New west side park or dog park
investment
General playground updates
Splash pad
General park renovation
Fully accessible playground
Park trail and accessibility improvements (per park)
Expanded programming (including staff)
Pickleball upgrades (per park)
General playground updates
Splash pad
Field or diamond lighting
Indoor community room
Concession building with restrooms
Park restrooms
General field improvements
Refrigerated ice pad
Pickleball upgrades (per park)
Existing trail system resurfacing
Expanded programming (including staff)
Improved marketing and communication
Field or diamond lighting
Picnic shelter
Concession building with restrooms
Premier ball diamond
Existing trail system resurfacing
General playground updates
Park restrooms
Park trail and accessibility
improvements (per park)
Indoor community room
Winter trails
Splash pad
Park trail and accessibility improvements (per park)
Park restrooms
Expanded programming (including staff)
Splash pad
Winter trails
Concession building with restrooms
Indoor community room
Fully accessible playground
General park renovation
Improved trailhead
Hippo campus chair
Security staff
Accessible sleigh
General field improvements
General ball diamond improvements
Premier field
Picnic shelter
Field or diamond lighting
General playground updates
Concession building with restrooms
Refrigerated ice pad
Existing trail system resurfacing
New west side park or dog park investment
City Partners Group 1: Prioritized playgrounds, including a fully accessible playground, a splash pad, and general park renovations across all budgets. They also highlighted the need for trail and accessibility improvements, and in higher budgets, included expanded programming and a new park or improved dog park on the west side.
City Partners Group 2: Focused heavily on trail resurfacing, with an emphasis on playground updates and adding an indoor community room. A refrigerated ice pad and additional park restrooms also emerged in the larger budgets.
Residents 55+: Emphasized trail and accessibility improvements alongside expanded programming and community gathering spaces such as an indoor community room and picnic shelters. They also valued winter trails and enhanced park restrooms.
Accessibility Group: Their key focus was on accessibility improvements for trails and facilities, such as accessible playgrounds, restrooms, and expanded programming. They also requested adaptive seating (e.g., Hippocampus chairs) and a security staff presence.
Sport User Groups: Their primary needs centered around field and ball diamond improvements and lighting. They also sought concession buildings and refrigerated ice pads at higher budgets, as well as investment in a new park or improved dog park in the $20M scenario.
1. School district continues to show an interest in partnering for staffing in order to provide more after school activities for students (especially low income)
2. Developer of the At Home Apartments (near McDonalds) would like to discuss some potential grants with staff they would like to potentially partner on
3. A few of the attendees talked with staff about the need for additional MH staff
4. Indoor community space continues to be a necessary piece missing to our Park System
5. The addition of a refrigerated ice rink continues to be a high priority of some residents as they are lacking indoor ice time
6. The funding question continues to be a concern of partners—from a staff perspective this makes us hesitant that our partners would consider us for a large-scale project partnership
1. Funding continues to be a concern for seniors on a fixed income
2. They would like to see higher user fees, as they think it's important for the users of facilities to pay for a large portion of the costs to maintain it
3. They think $25 per player for user fees would be more on par than $7
4. Programming/things to keep Seniors busy is especially important to them after the closing of the YMCA
5. They want more Coffee, Cribbage and Cards type activities in the community—more staff to make this possible would be helpful
6. Indoor space would give them the opportunity to see people in the Winter (a lot of isolation)
7. Picnic shelters are important gathering spaces for seniors to engage with their family
8. Ice skating is a pastime, would be nice to have a refrigerated rink
9. Money is going to get tight, let’s prioritize maintaining the amenities we already have
1. Track wheelchairs for Winter trails would be a game changer (allow them for free rental)
2. Then it isn’t as important to have perfectly groomed trails, because they can still be used!
3. Winters are a difficult time for people in wheelchairs to get out, enjoy nature and interact with others
4. An indoor recreation space to gather would be a huge advantage for the disability community
5. Splash Pads provide a lot of opportunities for people in wheelchairs to recreate. They don’t have to change, the water feature is level, and it’s a fun opportunity!
6. Having a free rentable wheelchair to use would be nice, as they are concerned about getting their power wheelchairs wet, but wouldn’t have the ability to invest in a waterproof wheelchair just to use at the splash pad
7. Splash pads can be used by children/others, so it would benefit everyone!
8. Look into a partnership with Courage Kenny in order to provide opportunities for wheelchair/other supply use at a reasonable rate
9. Would love to see the Par 3 invest in the wheelchair carts that help people stand and golf
10. This could be a great way to utilize the short course and show yet another way the golf course can be used
11. Family Bathrooms are essential for so many reasons! It allows a spouse/child/friend to come in and help someone use the bathroom (with no issues on gender)
12. Sensory free spaces are so important
13. Could we put something like this by our parks by the playgrounds?
14. #1 Request: Indoor/Accessible Gathering Space
1. For baseball, the top priority is modernizing the concessions and bathroom facilities at Mendakota
2. Two toilets for tournaments aren’t enough, they have to bring in portable restrooms
3. Having lights at Mendakota would be a huge help, would allow for a longer/better season
4. An accessible playground only helps a few kids, but it is a great destination opportunity and could bring in revenue at tournaments for concessions
5. We should think about what provides the highest impact to all residents (not just kids who play sports)
6. Indoor space should consist of a community center with an indoor turf field and gym space
7. Charitable Gambling to TRAA would provide a lot of revenue to improve parks but need further discussion of what Charitable Gambling consists of
8. TRAA will send out the survey to all users to try to boost participation
9. TRAA will stay invested in the process
10. SALVO in addition will send out the survey link to their families (encourage MH residents to fill it out)
11. A referendum would be a huge help to make improvements, they think their young families would benefit and support additional funding for parks
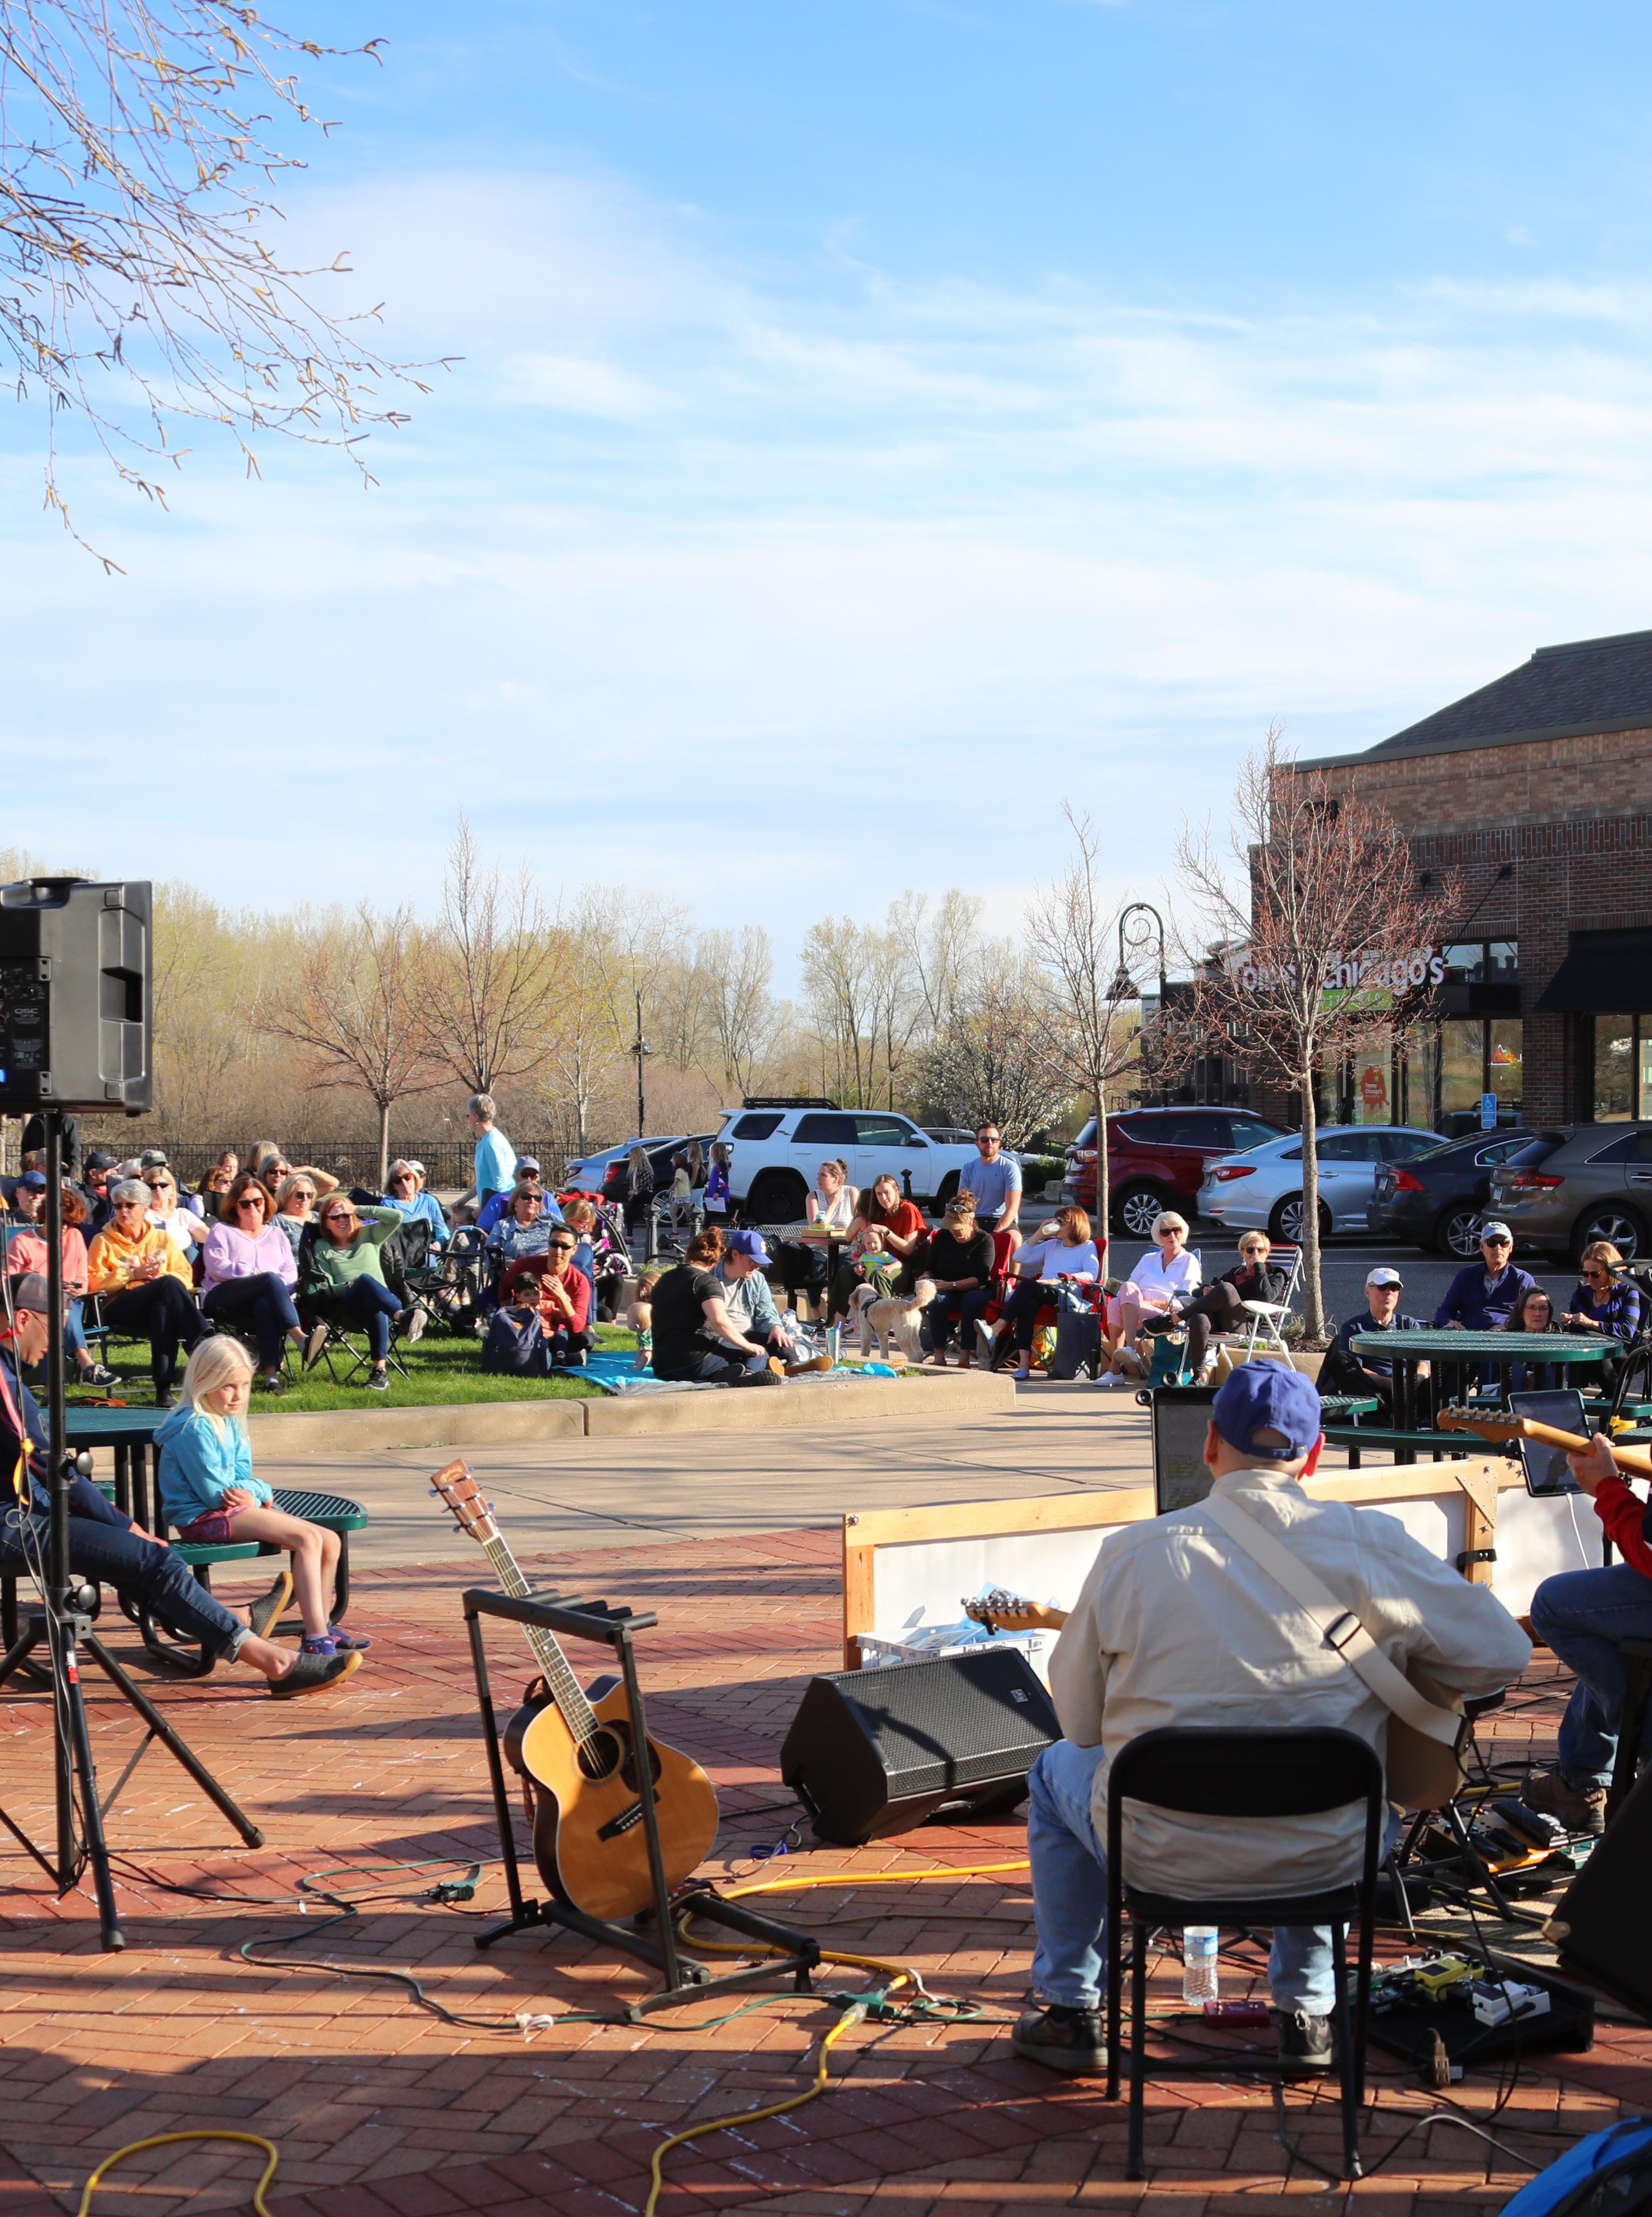

Overall, Mendota Heights is fairly well served in total park acreage per resident on account of the amount of open/natural spac es within the City. However, when the land was categorized by park type, the analysis did show a need for neighborhood and community park s when compared to national standards. If additional acreage is not feasible, the existing parks should be planned for diverse intere sts and needs to better accommodate the diversity of users and high usage potential.


Currently, Mendota Heights’ parks are concentrated along the central spine of the city with the highest concentration in the so utheast and south central area of the City. There are two significant areas of park service gaps: a larger area in the southwest and sm aller area along the border with West Saint Paul. The park gap in the west is in areas with more industrial and commercial development ra ther than residential. However, there is significant multifamily development within this area that would benefit from increased park acc ess and programming. Any park gaps and unequal park acreage distribution can lead to disparities in access to green space and recreatio n within the City.

REGIONAL


The Equity Prioritization Tool is a data-driven planning tool that identifies areas for park planning and investment prioritiza tion by determining which parks serve the highest concentration of community members underrepresented in park use and/or historically underserved by park systems throughout the greater metropolitan area. Integrating this tool into the planning process helps ens ure that future projects reduce barriers for participation, are developed to engage underrepresented communities, and promote fairn ess and inclusivity. This integration of data-driven equity prioritization is required to ensure consistency with larger regional p ark planning priorities.
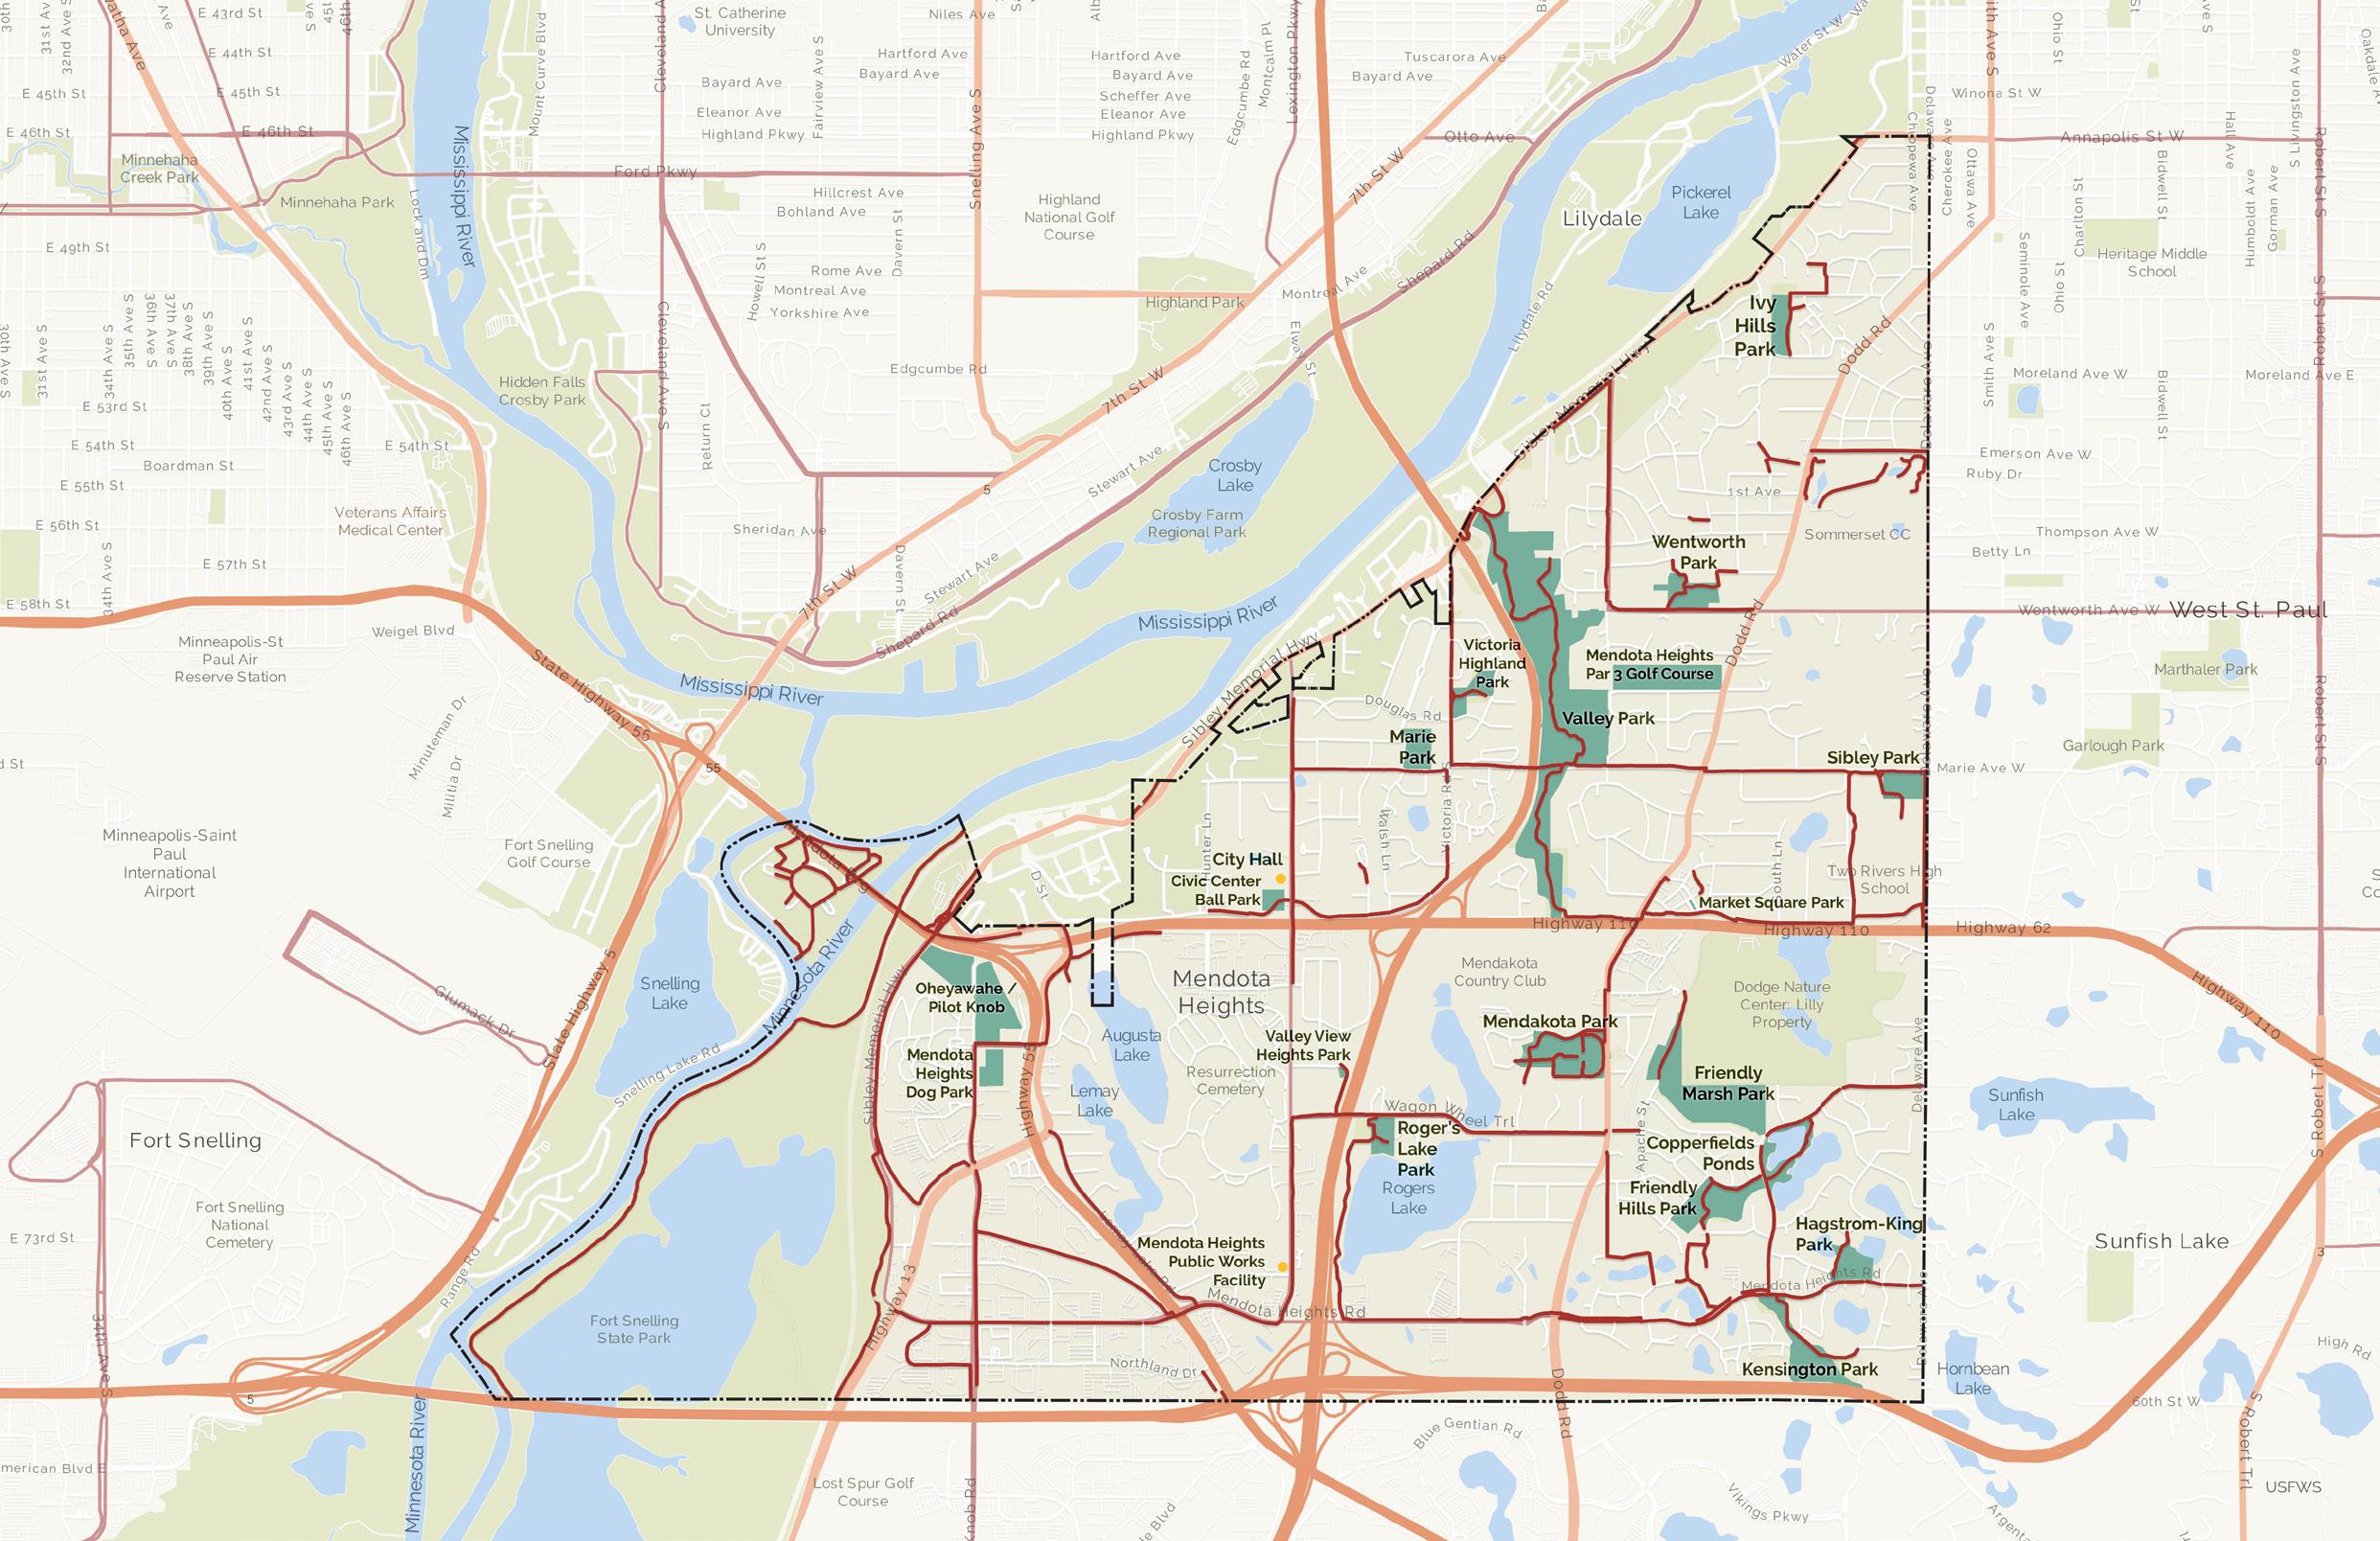


SUMMARY: The number of ball fields/diamonds within the Mendota Heights’ Park System far exceeds the national standard with a field/ diamond located in nearly every park. Fields are larger and more resource intensive site features.


SUMMARY: The number of fields meet the national standard in terms of field per population but are unequally distributed throughout the park system. All fields are located in the south east area of the City. Fields are highly flexible site features and valuable for both active and passive park users.


SUMMARY: The number of playgrounds within Mendota Heights exceeds the national standard. However, as the parkland is unequally distributed in the City, there are several areas of the City that do not have access to a playground within a 1/2 mile walk. Futher review of the playgrounds also found overall issues with accessibility for those with physical disabilities and/or neurodiversity. The City could also benefit from one destination playground to better serve a wider range of users in one central location.


SUMMARY: The number of courts exceeds the national standard in terms of courts per population.


SUMMARY: The trails meet the national standard in terms of trails for the population.


SUMMARY: The number of shelters meet the national standard in terms of picnic shelters for the population.


SUMMARY: There is a lack of water activities in the City. These are highly resource intensive features.


SUMMARY: The number of winter activities exceeds the national standard in terms of features for the population, important with Minnesota’s climate.


Mendota Heights is a small, affluent suburb located in the southeastern part of the Twin Cities metro area in Minnesota. Compared to the larger metro area, Mendota Heights has a lower population density, a higher median household income, and smaller household size reflecting its relatively affluent population. The majority of residents own their homes and have lived in their homes for more than 10 years. The suburb has a predominantly White population, with fewer residents from diverse racial and ethnic backgrounds compared to the Twin Cities metro area. The population of the community is relatively stable and is only expected to add an additional 600 residents in the next 15 years.
The population in Mendota Heights tends to be older on average, with a higher percentage of residents over the age of 65 than the metro area. The community has a lower rate of disability compared to the regional average as well.
Understanding and planning for the specific demographics of the community are key to identifying and prioritizing park plan recommendations when viewed in conjunction with community engagement results.
SOURCE: Demographic data used for the analysis was obtained from the U.S. Census Bureau and from the Environmental Systems Research Institute, Inc. (ESRI), two of the largest research and development organizations dedicated to Geographical Information Systems (GIS) and specializing in population projections and market trends. All data was acquired in August 2019, and reflects actual numbers as reported in the 2010 Census as well as estimates for 2020 and 2023 obtained by ESRI. Straight line linear regression was utilized for projections.
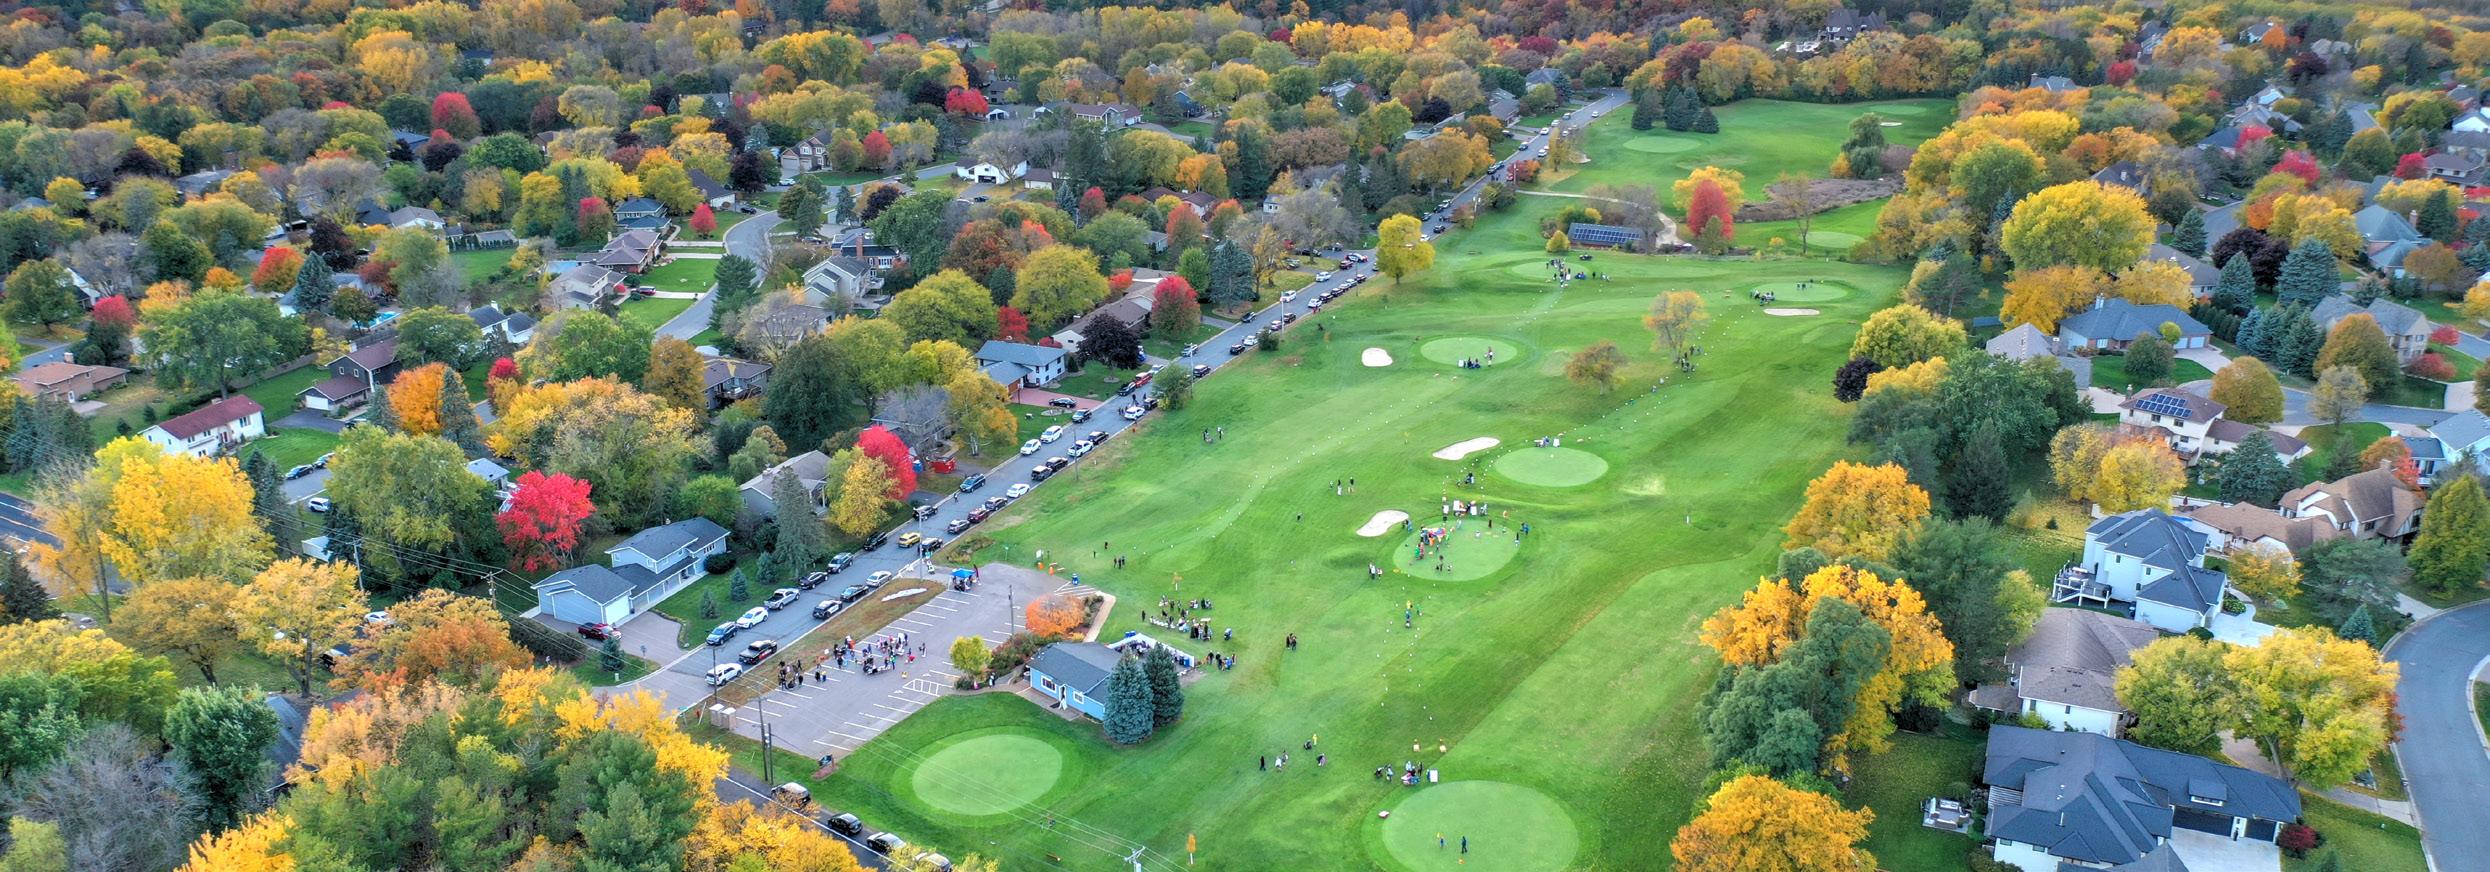
The Trends Analysis provides an understanding of national, regional, and local recreational trends, as well as recreational interests by age segments. Trends data used for this analysis was obtained from Sports & Fitness Industry Association (SFIA), National Recreation and Park Association (NRPA), and Environmental Systems Research Institute, Inc. (ESRI). All trends data is based on current and/ or historical participation rates, statistically valid survey results, or NRPA Park Metrics.
The top sports most heavily particpated in the United States were basketball (29.7 million), golf (26.6 million), and tennis (23.8 million) which have participation figures well above the other activities within the general sports category. Playing golf at an entertainment venue (18.5 million) and baseball (16.7 million) round out the top five.
The popularity of basketball, golf, and tennis can be attributed to the ability to compete with a small number of participants, this coupled with an ability to be played outdoors and/or properly distanced helps explain their popularity during the COVID-19 pandemic. Basketball’s overall success can also be attributed to the limited amount of equipment needed to participate and the limited space requirements necessary, which makes basketball the only traditional sport that can be played at most American dwellings as a drive-way pickup game. Golf continues to benefit from its wide age segment appeal and is considered a life=long sport. In addition, target type game venues or golf entertainment venues have increased drastically (99%) as a 5-year trend, using golf entertainment (e.g., Top Golf) as a new alternative to breathe life back into the game of golf.
Overall, national participatory trends in fitness have experienced growth in recent years. Many of these activities have become popular due to an increased interest among Americans to improve their health and enhance quality of life by engaging in an active lifestyle. The most popular general fitness activities in 2023 were those that could be done in multiple environments such as at home, gym or in a virtual class setting. The activities with the most participation were walking for fitness (114.0 million), treadmill (54.8 million), running/jogging (48.3 million), and yoga (34.2 million).
TRAIL RUNNING PILATES

Participants of walking for fitness are mostly core users (participating 50+ times) and have seen a 1.3% growth in the last five years.
Results from the SFIA report demonstrates rapid growth in participation regarding outdoor/adventure recreation activities. Much like general fitness activities, these activities encourage an active lifestyle, can be performed individually, and are not as limited by time constraints. In 2023, the most popular activities, in terms of total participants include day hiking (61.4 million), freshwater fishing (42.6 million), road bicycling (42.2 million), camping (38.6 million), and wildlife viewing (21.1 million).
CAMPING SKATEBOARDING
BIRD WATCHING BICYCLING (BMX) HIKING (DAY)
Although most outdoor activities have seen participation growth over the past five years, it is important to note that participation in all outdoor activities—except adventure racing—primarily consists of casual users.
The most popular water sports/activities based on total participants in 2023 were recreational kayaking (14.7 million), canoeing (10.0 million), and snorkeling (7.5 million). It should be noted that water activity participation tends to vary based on regional, seasonal, and environmental factors. A region with more water access and a warmer climate is more likely to have a higher participation rate in water activities than a region that has a long winter season or limited water access. Therefore, when assessing trends in water sports and activities, it is important to understand that fluctuations may be the result of environmental barriers which can influence water activity participation.
5-YEAR TREND - 5-YEAR TREND - 5-YEAR TREND1-YEAR TREND - 1-YEAR TREND - 1-YEAR TREND -
Fitness sports continue to be the preferred form of exercise for Boomers, Gen X, and Millennials. Over half of Gen X, Millennials, and Gen Z participated in at least one type of outdoor activity. Team sports were most popular among members of Gen Z, while nearly one-third of Gen X reported participating in individual sports such as golf, trail running, triathlons, and bowling.
Pickleball continues to be the fastest growing sport in America by reaching 13.5 million participants in 2023, a 223.5% growth since 2020. The growth of pickleball participants has nearly reached the size of outdoor soccer participants (14.1 million). Following the popularity of pickleball, every racquet sport except table tennis has also increased in total participation in 2023.
Group, full-body workout activities such as tai chi, barre and pilates saw the biggest increase in participation this past year. Americans continued to practice yoga, started indoor climbing, and trail hiking. Additionally there was an increase in the participation in all paddlesport activities over the past year.
Over two-thirds (67.8%) of Americans participated in fitness sports and over half (57.3%) of Americans participated in outdoor sports. Total participation for fitness, team, outdoor, racquet, water, and winter sports are higher than their pre-pandemic participation rates. Individual sports are the only category still not at their pre-pandemic participation levels dropping from 45% in 2019 to 42.1% in 2023).

APPENDIX 4
1.1.1
The City of Mendota Heights is implementing a Park System Master Plan to assess its parks and recreation system including staffing needs, facility inventory and conditions, financial performance, program offerings, and community demographics and trends. The goal is to gain a deeper understanding of current conditions and plan effectively for future parks and recreation needs. PROS Consulting will analyze local park data alongside information from nearby agencies to provide relevant comparisons. This analysis will be informed by city demographics, regional recreation trends, and the programs, services, activities, and amenities that residents have expressed interest in for the future of Mendota Heights.
1.1.2
The Demographic Analysis outlines the characteristics of the population within Mendota Heights’ service area, including age distribution, race, ethnicity, and income levels. The analysis reflects the City’s total population and provides insight into current and projected trends. Future projections are based on historical patterns and may be influenced by unforeseen events occurring during or after the time of the analysis. This could have a significant bearing on the validity of the projected figures. At the time this report was prepared, statistics from the 2020 – estimate 2023 Census Bureau data were used.
1.1.3 DEMOGRAPHIC OVERVIEW





1.1.4
Demographic data used for the analysis was obtained from the USA Census Bureau and from the Environmental Systems Research Institute, Inc. (ESRI), two of the largest research and development organizations dedicated to Geographical Information Systems (GIS) and specializing in population projections and market trends. All data was acquired in August 2019 and reflects actual numbers as reported in the 2010 Census as well as estimates for 2020 and 2023 obtained by ESRI. Straight line linear regression was utilized for 2029 and 2034 projections. The City’s boundaries shown below were utilized for the demographic analysis (Figure 1).
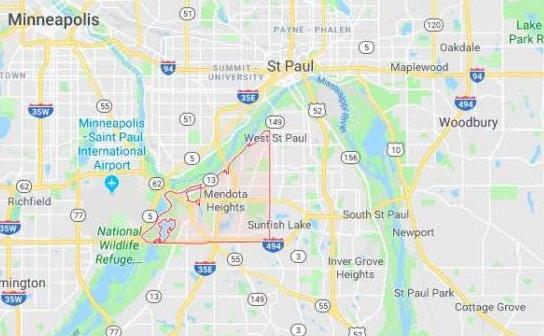


The City of Mendota Heights’ population experienced an increase in growth within recent years, increasing from 2010 to 2020. Aside from the 2020 population to the estimated population in 2023, there is an estimated decrease of -0.23%. From the estimated population in 2023 to the projected population of 2038, the City of Mendota Heights is expected to experience slight growth of 0.36%. This is below the national annual growth rate of 0.85% (from 2010-2019). Similar to the population, the total number of households also experienced an increase in recent years (1.17% since 2010) with 0.75% average per year. Currently, the population is estimated at 11,663 (2023) individuals living within an estimated 4,892 households. Projecting ahead, the total population is expected to decrease slightly from 2020 to 2023 and rebound in 2033. The 2038 predictions expect to have 12,280 residents living in 5,398 households (Figures 2 & 3).
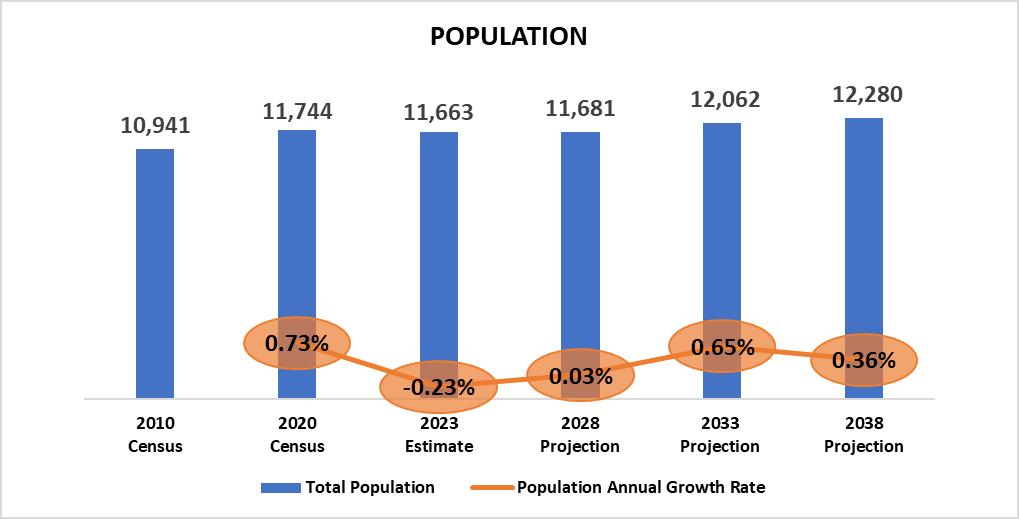
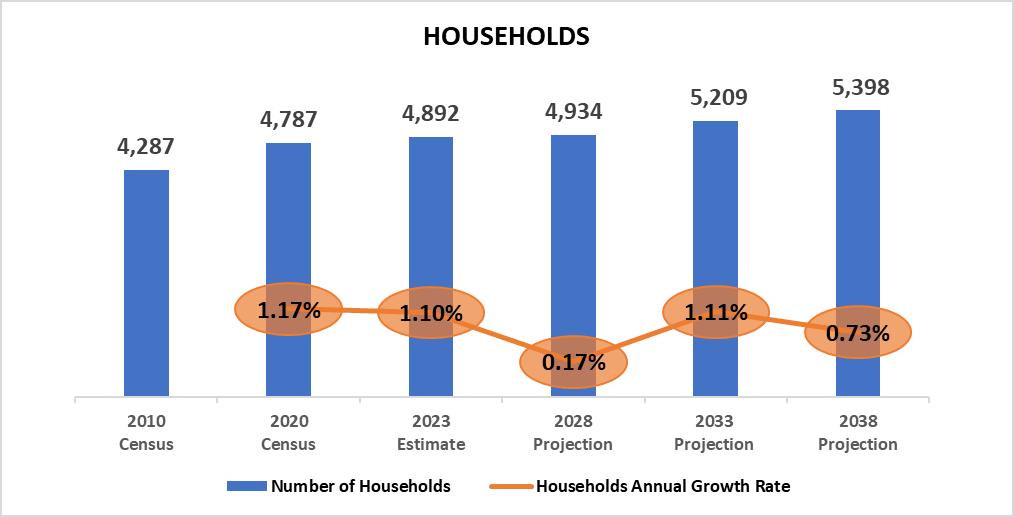


CITY OF MENDOTA HEIGHTS, MN
PLAN; DEMOGRAPHICS AND TRENDS
Evaluating the City by age segments (Figure 4) and the estimate for 2020, the service area’s largest population segment is the 55-74 age segment. The City of Mendota Heights’ median age is 48.6, which indicates that the City may already be ahead of the aging national trend


CITY OF MENDOTA HEIGHTS, MN MASTER PLAN; DEMOGRAPHICS AND TRENDS
The minimum categories for data on race and ethnicity for federal statistics, program administrative reporting, and civil rights compliance reporting are defined as below. The 2010 Census data on race is not directly comparable with data from the 2000 Census and earlier censuses; therefore, caution must be used when interpreting changes in the racial composition of the USA population over time. The latest (Census 2010) definitions and nomenclature are used within this analysis.
• American Indian – This includes a person having origins in any of the original peoples of North and South America (including Central America), who maintains tribal affiliation or community attachment.
• Asian – This includes a person having origins in any of the original peoples of Asia, Southeast Asia, or the Indian subcontinent including for example, Cambodia, China, India, Japan, Korea, Malaysia, Pakistan, the Philippine Islands, Thailand, and Vietnam.
• Black – This includes a person having origins in any of the Black racial groups of Africa.
• Native Hawaiian or Other Pacific Islander – This includes a person having origins in any of the original peoples of Hawaii, Guam, Samoa, or other Pacific Islands.
• White – This includes a person having origins in any of the original peoples of Europe, the Middle East, or North Africa
• Hispanic or Latino – This is an ethnic distinction, a subset of a race as defined by the Federal Government. This includes a person of Mexican, Puerto Rican, Cuban, South or Central American, or other Spanish culture or origin, regardless of race.
Please Note: The Census Bureau defines Race as a person’s self-identification with one or more of the following social groups: White, Black or African American, Asian, American Indian and Alaska Native, Native Hawaiian and Other Pacific Islander, some other race, or a combination of these. Ethnicity is defined whether a person is of Hispanic/Latino origin or not. For this reason, the Hispanic / Latino ethnicity is viewed separate from race throughout this demographic analysis.

As of 2023, the City's population is predominantly White Alone (approximately 88%). The next largest racial groups are Black Alone and Asian, each representing 2% of the population. Compared to national demographics approximately 70% White Alone, 13% Black Alone, and 7% Some Other Race the City is significantly less diverse. Projections for 2038 indicate a slight increase in diversity: the White Alone population is expected to decline to 83%, while the Black Alone population remains steady at 2%, and the Asian population increases slightly to 3% (Figure 5). Overall, the projected change from 2023 to 2038 reflects a modest 5% decrease in the White Alone population and a 1% increase in the Asian population.
Mendota Heights Minnesota
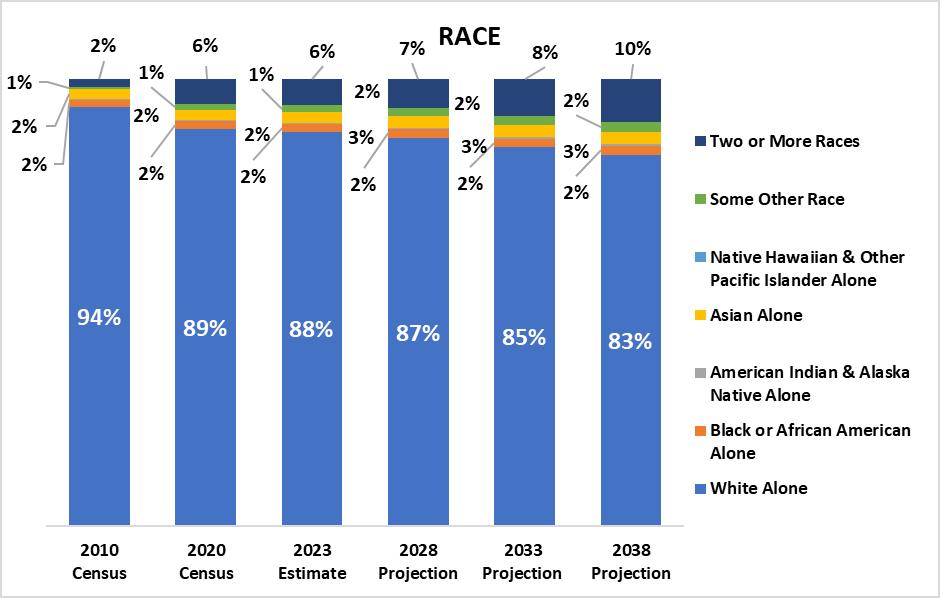


Mendota Heights’ population was also assessed based on Hispanic/Latino ethnicity by the Census Bureau definition, which is viewed independently from race. It is important to note that individuals who are Hispanic/Latino can also identify with any of the racial categories from above. Based on the current estimate for 2023, those of Hispanic/Latino origin represent just 4% of the City’s current population, which is much lower than the national average (18% Hispanic/ Latino). The Hispanic/Latino population is expected to grow slightly over the next 15 years, to represent 6% of the City’s total population by 2038 (Figure 6).
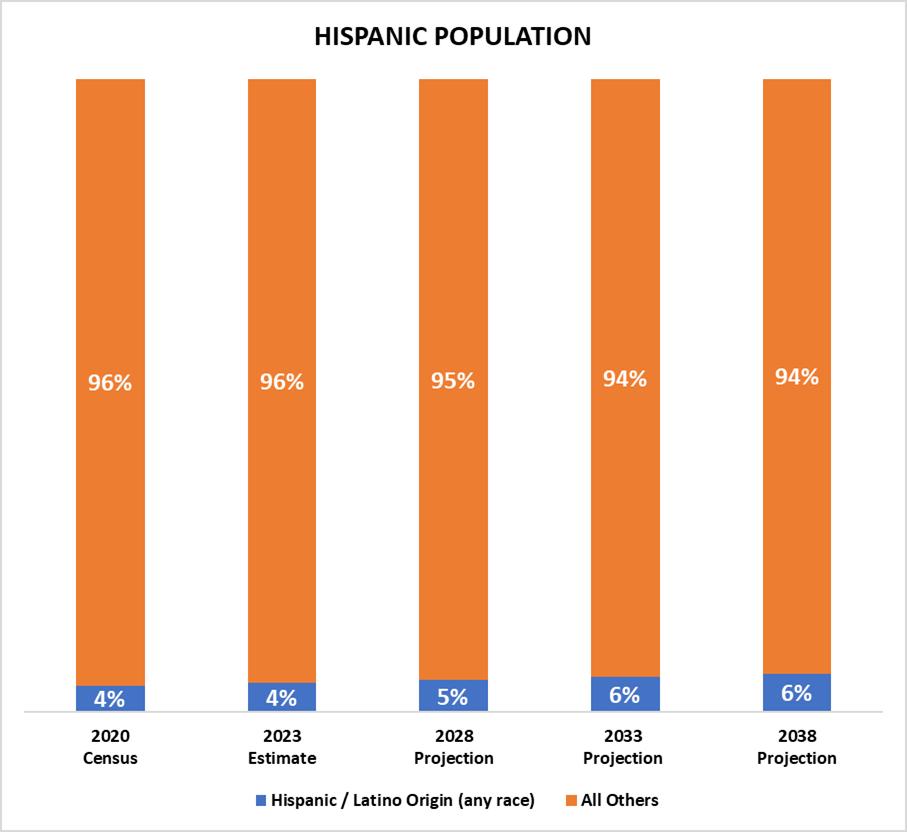

The City’s median household income ($120,257) is higher than the state ($83,993) and national ($74,755) levels. The City’s per capita income ($72,744) is also higher than both the state ($68,840) and the national ($41,804) levels This may indicate a higher rate of disposable income among the population served and should be considered when evaluating financially sustainable opportunities for how the City of Mendota Heights will address future community needs. (Figure 7 and Figure 8)


Researching the demographics of Mendota Heights, it bears saying that the recreation needs and priorities should not be solely focused on these statistics alone. This data is to link the population in Mendota Heights with appropriate programs, activities and amenities in order to evaluate recreation needs and determine if any alterations should be made to better serve residents.
Below are some potential inferences for Mendota Heights that were derived from research and data used in this report:
Mendota Heights had negative population growth, compared to the National growth rate. From previous population information in this report, the population growth rate percentage made very slow growth. This indicates a near-steady probable use in the park system.

The average household size in Mendota Heights is projected at 2.37 persons per household compared to the average household size in the USA of 2.53 persons. While this change is insignificant, it may show an age appropriate segment of household members are leaving the home to attend college or relocate outside of Mendota Heights. A consideration may be to evaluate programming for empty nest parents.


As age distribution is examined, it can stand to reason that as a particular age segment increases or decreases, the number of program users may follow that age segment fluctuation. This is only an observation of the research done for age segmentation, and the generalization of the recreation industry.
The three largest age segments in Mendota Heights are:
• 0– 17 year olds and 35 – 54 year olds tied at 21% of the population
• 55 – 74 year old residents at 33% of the population. These groups benefit from programs directed toward children, youth, middle-aged adults and “Active Seniors” that are 55-75 years old. With a total of 75% in these age groups, programs for children, youth and young adults, as well as Seniors should be the main

Mendota Heights Population by Age Segments

CITY OF MENDOTA HEIGHTS, MN
MASTER PLAN; DEMOGRAPHICS AND TRENDS
areas of focus for Mendota Heights. The 0-10 ages of the 0-19 age group will encompass the children of the lower population side of the 35-54 year old young adult groups. Family programs should be considered as a significant combination of these two age groups
Mendota Heights is 10% higher than the USA in the 55-74 year old age segment indicating this age group often considered “Active Seniors” may be a very involved group in programs and activities. They may want programs that are geared toward cardio fitness and healthy exercise. The older age segment 75+ in Mendota Heights (11%) is slightly higher than the 75+ age segment in the USA (7%) The young adults (ages 35 -54) years old at 21% in Mendota Heights is slightly lower than that group in the USA (25%) With this age group in Mendota Heights and the USA being close, national recreation trends for this group may be a guide for programs and activities that are popular in the nation.
The percentages in the Mendota Heights chart and the USA chart show that the White Alone population is the largest sector. Minorities of all races other than White Alone in Mendota Heights total nearly 12%, and in the USA, all minorities other than White Alone total 39%.


Mendota Heights’ race distribution indicates a less diverse population than the USA and may provide opportunities for the park system to offer programs that offer more diversity and increase overall attendance at programs and activities.


As shown in the chart below, the proportion of Hispanic and Latino residents in Mendota Heights is significantly lower than the national average. In contrast, the percentage of residents identifying with all other racial groups is higher in Mendota Heights compared to the U.S. overall. Expanding culturally relevant programming may encourage greater participation among Hispanic and Latino residents.

CITY OF MENDOTA HEIGHTS, MN MASTER PLAN; DEMOGRAPHICS AND TRENDS
Mendota Heights is found to be higher in both per capita income and median income than the nation. Higher income in these areas indicate more disposable income for residents in Mendota Heights, allowing them to spend more money in various areas that may include recreational activities.
$140,000
$120,000
$100,000
$80,000
$60,000
$40,000
$20,000
$0
$72,744
$41,804
$120,257
$74,755

To support the preceding summary information and potential opportunities reflected in the demographics, the City should examine the regional and national recreational and sports trends defined in the next section while also considering their own market potential index.


CITY OF MENDOTA HEIGHTS, MN
MASTER PLAN; DEMOGRAPHICS AND TRENDS
NRPA’s Agency Performance Review 2019 summarized key findings from NRPA Park Metrics. This benchmark tool compares the management and planning of operating resources and capital facilities within park and recreation agencies. The report contains data from 1,075 park and recreation agencies across the USA as reported between 2016 and 2018.
Based on this year’s report, the typical agency (i.e., those at the median values) offers 175 programs annually, with roughly 63% of those programs being fee-based activities/events.
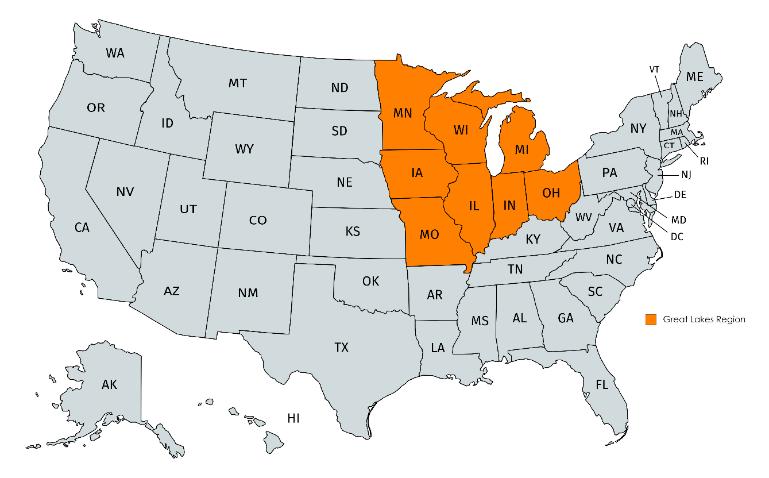

According to the information reported to the NRPA, the top programming activities most frequently offered by park and recreation agencies in the USA and regionally, are described below.
The following charts show the potential sports and leisure market data for the City of Mendota Heights’ service area, as provided by ESRI. A Market Potential Index (MPI) measures the probable demand for a product or service within the City. The MPI shows the likelihood that an adult resident of the target area will participate in certain activities when compared to the USA national average. The national average is 100; therefore, numbers below 100 would represent lower than average participation rates, and numbers above 100 would represent higher than average participation rates. The service area is compared to the national average in four categories: general sports, fitness, outdoor activity, and commercial recreation.
As seen in the charts below, the following (sport or sports) and leisure trends are most prevalent for residents within the service area. High index numbers (100+) are significant because they demonstrate a greater potential that residents within the service area will actively participate in offerings provided by the City of Mendota Heights Parks and Recreation Department.


MASTER PLAN; DEMOGRAPHICS AND TRENDS
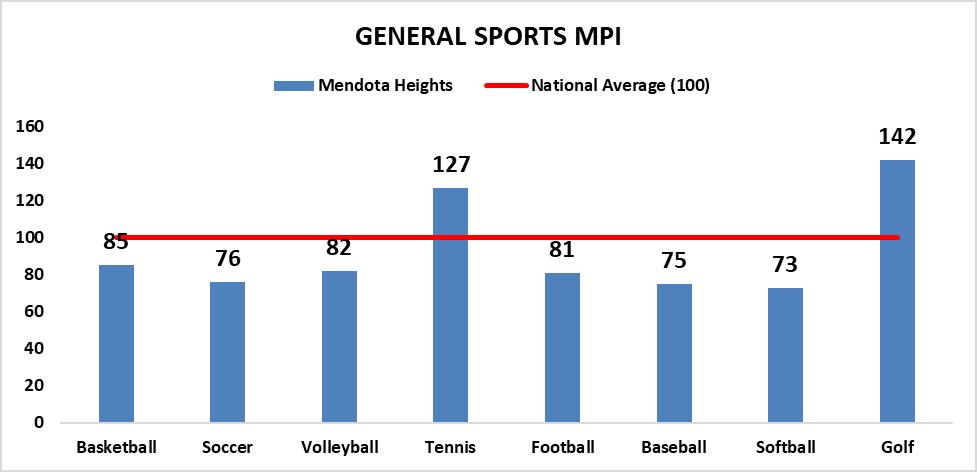
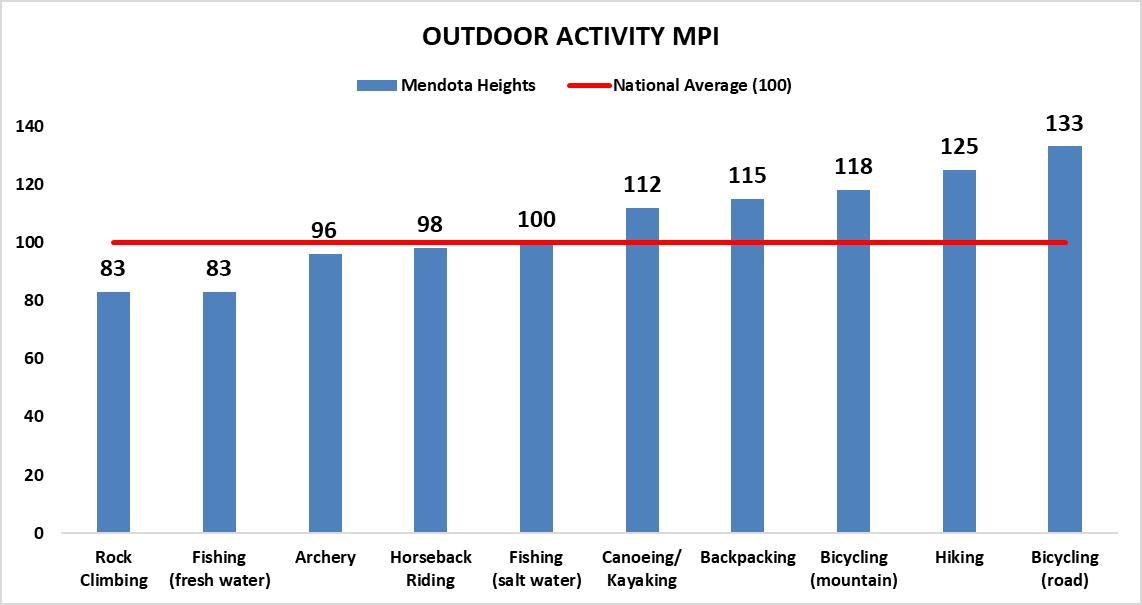


Mendota Heights National Average (100)
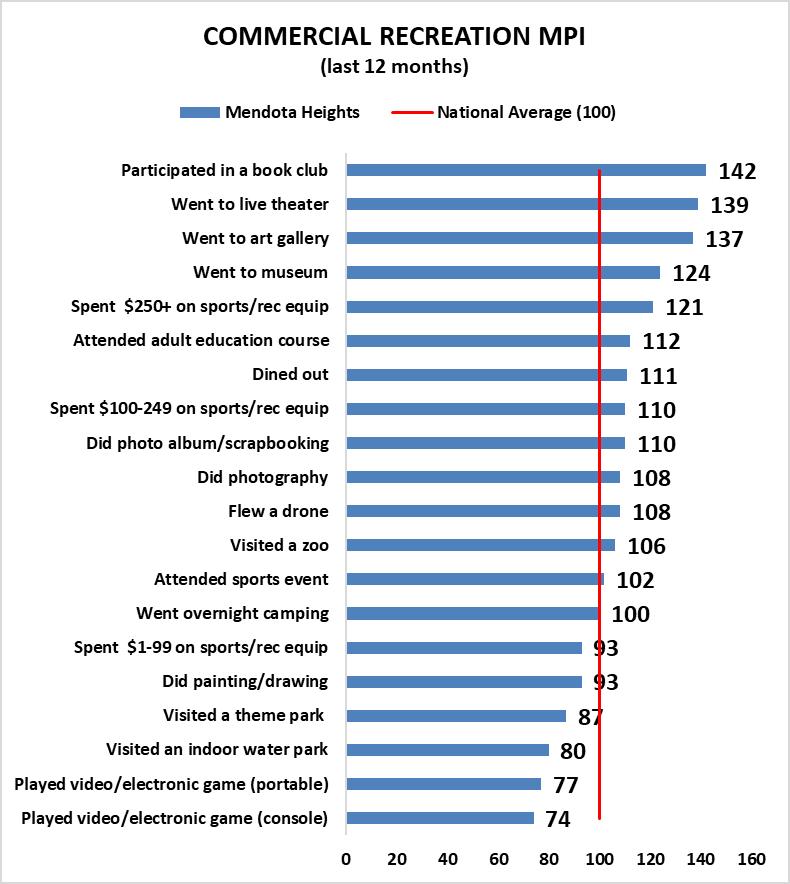


NOTE: Participation figures are in 000's for the US population ages 6 and over

NOTE: Participation figures are in 000's for the US population ages 6 and over Participation Growth/Decline:


NOTE: Participation figures are in 000's for the US population ages 6 and


The Trends Analysis provides an understanding of national, regional, and local recreational trends as well as recreational interest by age segments. Trends data used for this analysis was obtained from Sports & Fitness Industry Association (SFIA), National Recreation and Park Association (NRPA), and Environmental Systems Research Institute, Inc. (ESRI). All trends data is based on current and/or historical participation rates, statistically valid survey results, or NRPA Park Metrics.
The Sports & Fitness Industry Association (SFIA) Sports, Fitness & Leisure Activities Topline Participation Report 2024 was utilized in evaluating the following trends:
• National Recreation Participatory Trends
• Core vs. Casual Participation Trends

The study is based on findings from surveys conducted in 2023 by the Sports Marketing Surveys U S A (SMS), resulting in a total of 18,000 online interviews. Surveys were administered to all genders, ages, income levels, regions, and ethnicities to allow for statistical accuracy of the national population. A sample size of 18,000 completed interviews is considered by SFIA to result in a high degree of statistical accuracy. A sport with a participation rate of five percent has a confidence interval of plus or minus 0.32 percentage points at a 95 percent confidence level. Using a weighting technique, survey results are applied to the total U.S. population figure of 306,931,382 people (ages six and older).
The purpose of the report is to establish levels of activity and identify key participatory trends in recreation across the U.S. This study looked at 124 different sports/activities and subdivided them into various categories including: sports, fitness, outdoor activities, aquatics, etc.


Approximately 242 million people ages six and over reported being active in 2023, which is a 2.2% increase from 2022 and the greatest number of active Americans in the last 6 years. This is an indicator that Americans are continuing to make physical activity more of a priority in their lives. Outdoor activities continue to thrive, recreation facilities reopened, fitness at home maintains popularity, and team sports are slowly reaching pre-pandemic participation levels. The chart below depicts participation levels for active and inactive (those who engage in no physical activity) Americans over the past 6 years.
In addition to overall participation rates, SFIA further categorizes active participants as either core or casual participants based on frequency of participation. Core participants have higher participatory frequency than casual participants. The thresholds that define casual versus core participation may vary based on the nature of each individual activity. For instance, core participants engage in most fitness activities more than fifty times per year, while for sports, the threshold for core participation is typically 13 times per year.
In each activity, core participants are more committed and tend to be less likely to switch to other activities or become inactive (engage in no physical activity) than casual participants. This may also explain why activities with more core participants tend to experience less pattern shifts in participation rates than those with larger groups of casual participants. Increasing for the sixth straight year, 165 million people were considered core participants in 2023.

Figure 20 - Total Core Actives

The following chart shows 2023 participation rates by generation. Fitness sports continue to be the go-to means of exercise for Boomers, Gen X, and Millennials. Over half of the Gen X, Millennials, and Gen Z participated in one type of outdoor activity. Team sports were heavily dominated by Gen Z and nearly a third of Gen X also participated in individual sports such as golf, trail running, triathlons, and bowling.
Pickleball continues to be the fastest growing sport in the U.S. by reaching 13.6 million participants in 2023 which is a 223.5% growth since 2020. The growth of pickleball participants (13.6 million) has nearly reached the size of outdoor soccer participants (14.1 million). Following the popularity of pickleball, every racquet sport except table tennis has also increased in total participation in 2023.
Group, full-body workout activities such as tai chi, barre and pilates saw the biggest increase in participation this past year. Americans continued to practice yoga, workout with kettlebells, started indoor climbing, while others took to the hiking trail. The waterways traffic increased in participation for all activities in the past year.
Over two-thirds of Americans (67.8%) participated in fitness sports, while 57.3% participated in outdoor sports. Total participation in fitness, team, outdoor, racquet, water, and winter sports is now higher than pre-pandemic levels with one exception. Team sports remain the only category that has not yet returned to pre-pandemic participation levels, with 45% participation in 2019 compared to 42.1% in 2023.


The popularity of basketball, golf, and tennis can be attributed to the ability to compete with a small number of participants, this coupled with an ability to be played outdoors and/or properly distanced helps explain their popularity during the COVID-19 pandemic. Basketball’s overall success can also be attributed to the limited amount of equipment needed to participate and the limited space requirements necessary, which makes basketball the only traditional sport that can be played at most American dwellings as a drive-way pickup game. Golf continues to benefit from its wide age segment appeal and is considered a life-long sport. In addition, target type game venues or golf entertainment venues have increased drastically (99%) as a 5-year trend, using golf entertainment (e.g., Top Golf) as a new alternative to breathe life back into the game of golf.

Since 2018, pickleball (311.5%), golf - entertainment venues (99.0%), and tennis (33.6%) have shown the largest increase in participation. Similarly, outdoor soccer (23.4%) and basketball (22.7%) have also experienced significant growth. Based on the five-year trend from 2018-2023, the sports that are most rapidly declining in participation include roller hockey (-28.7%), rugby (-28.7%), and ultimate frisbee (23.0%).
The most recent year shares some similarities with the five-year trends; with pickleball (51.8%) and golfentertainment venues (18.8%) experiencing some of the greatest increases in participation this past year. Other top one-year increases include court volleyball (13.3%), ice hockey (9.6%), and cheerleading (8.3%).
Sports that have seen moderate 1-year increases, but 5-year decreases are cheerleading (8.3%), track and field (5.8%), lacrosse (5.5%) and slow-pitch softball (5.3%). This could be a result of coming out of the COVID-19 pandemic and team program participation on the rise. Like their 5-year trend, roller hockey (9.6%), sand/beach volleyball (-5.1%), and rugby (-4.6%) have seen decreases in participation over the last year.
General sport activities such as basketball, court volleyball, and slow pitch softball have a larger core participant base (participate 13+ times per year) than casual participant base (participate 1-12 times per year). Due to the COVID-19 pandemic, most activities showed a decrease in their percentage of core participants, but these percentages for core users are slowly reaching their pre-pandemic levels.


PARTICIPATION LEVELS
Overall, national fitness participation has grown in recent years, driven by a rising interest in health and quality of life through active lifestyles. In 2023, the most popular fitness activities were those offering flexibility across settings whether at home, in the gym, or through virtual classes. The activities with the most participation were walking for fitness (114.0 million), treadmill (54.8 million), free weights (53.9 million), running/jogging (48.3 million), and yoga (34.2 million).

Over the last five years (2018-2023), the activities growing at the highest rate were trail running (48.7%), pilates training (30.6%), barre (21.6%) and yoga (19.1%). Over the same period, the activities that have undergone the biggest decline in participation include group stationary cycling (-34%), cross-training style workout (-29.5%) and traditional/road triathlons (-19.8%).
In the last year, fitness activities with the largest gains in participation were group-related, slow, intentional body motion activities including, tai chi (16.3%), pilates training (15.0%), and barre (12.9%). This 1-year trend is another indicator that participants feel safe returning to group-related activities. Trail running (12.3%) also saw a moderate increase indicating trail connectivity continues to be important for communities to provide. In the same span, fitness activities that had the largest decline in participation were boxing/MMA for fitness (-14.4%), traditional/road triathlons (-2.4%) and weight/resistance machines (-1.9%).
CORE VS. CASUAL TRENDS IN GENERAL FITNESS
Participants of walking for fitness are mostly core users (participating 50+ times) and have seen growth in the last five years.


NOTE: Participation figures are in 000's for the US population ages 6 and over


CITY OF MENDOTA HEIGHTS, MN
MASTER PLAN; DEMOGRAPHICS AND TRENDS
PARTICIPATION LEVELS
Results from the SFIA report demonstrate rapid growth in participation regarding outdoor/adventure recreation activities. Much like general fitness activities, these activities encourage an active lifestyle, can be performed individually, and are not as limited by time constraints. In 2023, the most popular activities, in terms of total participants include day hiking (61.4 million), freshwater fishing (42.6 million), road bicycling (42.2 million), camping (38.6 million), and wildlife viewing (21.1 million).

From 2018-2023, camping (40.7%), birdwatching (33.0%), skateboarding (37.3%), BMX bicycling (29.7%), and day hiking (28.4%) have undergone large increases in participation. The five-year trend also shows that only two activities declined in participation, adventure racing (-18.4) and backpacking overnight (5.2%).
The one-year trend shows most activities growing in participation from the previous year. The most rapid growth being indoor climbing (10.0%), BMX bicycling (6.7%), fly fishing (5.8%), and adventure racing (5.5%). Over the last year, the only activities that underwent decreases in participation were road bicycling (-3.0%), overnight backpacking (-2.2%), RV camping (-2.0%), and skateboarding (-1.1%).
CORE VS. CASUAL TRENDS IN OUTDOOR / ADVENTURE RECREATION
Although most outdoor activities have experienced participation growth in the last five years. It should be noted that all outdoor activities participation, besides adventure racing, consist primarily of casual users.


NOTE: Participation figures are in 000's for the US population ages 6 and over


PARTICIPATION LEVELS
CITY OF MENDOTA HEIGHTS, MN
MASTER PLAN; DEMOGRAPHICS AND TRENDS
Swimming is deemed a lifetime activity, which is why it continues to have such strong participation. In 2023, fitness swimming remained the overall leader in participation (28.2 million) amongst aquatic activities.

Assessing the five-year trend, all three aquatic activities saw moderate increases in participation.
In 2023, all aquatic activities experienced moderate increases in participation, likely due to the return of facilities and programs to pre-COVID-19 levels. Swimming on a team saw the highest percentage increase in participation, reaching 14.6%.
CORE VS. CASUAL TRENDS IN AQUATICS
All activities in aquatic trends have undergone an increase in casual participation (1-49 times per year) over the last five years.
Participatory Trends - Aquatics
NOTE: Participation figures are in 000's for the US population ages 6 and over


PARTICIPATION LEVEL
The most popular water sports / activities based on total participants in 2023 were recreational kayaking (14.7 million), canoeing (10.0 million), and snorkeling (7.5 million). It should be noted that water activity participation tends to vary based on regional, seasonal, and environmental factors. A region with more water access and a warmer climate is more likely to have a higher participation rate in water activities than a region that has a long winter season or limited water access. Therefore, when assessing trends in water sports and activities, it is important to understand that fluctuations may be the result of environmental barriers which can influence water activity participation.

Over the last five years, surfing (38.9%), recreational kayaking (33.7%), stand-up paddling (19.6%) and rafting (19.0%) were the fastest growing water activities. From 2018-2023, activities declining in participation were water boardsailing/windsurfing (-7.8%), water skiing (-6.8%), snorkeling (-4.2%) and sea/touring kayaking (-0.2%).
In 2023, there were no activities that saw a decrease in participation. Activities which experienced the largest increases in participation include scuba diving (15.2%), sailing (12.9%), and rafting (12.7%).
As mentioned previously, regional, seasonal, and environmental limiting factors may influence the participation rate of water sports and activities. These factors may also explain why all water-based activities have drastically more casual participants than core participants, since frequencies of activities may be constrained by uncontrollable factors.


NOTE: Participation figures are in 000's for the US population ages 6 and over


CITY OF MENDOTA HEIGHTS, MN


NOTE: Participation figures are in 000's for the US population ages 6 and over Participation Growth/Decline:


National Participatory Trends - Outdoor / Adventure Recreation
NOTE:


1.1.1
Mendota Heights Parks and Recreation identified operating metrics to benchmark against comparable parks and recreation agencies. This report is intended to provide reference points from the benchmark agencies and how Mendota Heights Parks and Recreation relates congruently. The goal of the analysis is to evaluate how Mendota Heights Parks and Recreation is positioned among peer best practice agencies with a combination of operating metrics that factor budgets, staffing levels, and inventories, as well as data about golf courses on City property.
Due to differences in how each park system collects, maintains, and reports data, the benchmark agencies’ answers may have details that are not able to be verified through research. The data provided will be considered accurate as related to the questions. Any unknown variations may impact program descriptions, financial data, staffing, and park visitors. Therefore, the overall comparison must be viewed with this in mind. The benchmark data collection for all systems was complete as of June 2024, and it is possible that information in this report may have changed since the original collection date. In some instances, the information was not tracked or not available from the participating agencies, which is indicated as “not provided” in the data tables.
After Mendota Heights Parks and Recreation determined the information they wanted to obtain from the benchmark agencies, a data request listing the metrics in the form of questions was sent to these agencies:
1. Golden Valley, MN Parks and Recreation
2. Green River, WY Parks and Recreation
3. New Brighton, MN Parks and Recreation
4. New Hope, MN Parks and Recreation
5. West Saint Paul, MN Parks and Recreation
Four of the five benchmark cities were chosen not only because of their proximity to Mendota Heights Parks and Recreation, but also to learn about their approach to programming, activity fees, and management practices Green River Parks and Recreation is in Wyoming, but the community size and park system are the closest to any of the other benchmark agencies and will provide the closest comparison to Mendota Heights. Although the benchmark agencies are not an exact parallel to Mendota Heights, the data about their park systems will provide information that is pertinent as a reference with Mendota Heights Parks and Recreation regarding their operations. They were chosen as agencies that offer programs, activities, and events along with the facilities and amenities in their system to assist in the internal evaluation of what Mendota Heights Parks and Recreation offers and what areas are considered gaps in their programs and events.
The data request forms were completed and returned by the benchmark agencies and the data was organized into charts and graphics that portray the metrics for reference to the City of Mendota Heights The consultants will also use the data researched to aid in the development of the Master Plan.


The chart below presents statistical data regarding various cities where the benchmark park systems are located. (Figure 1.) Data for the population of the benchmark cities and the City size in square miles depicts the similarity to Mendota Heights. For benchmarking purposes, this analysis uses metrics to identify cities with park systems and fundamental characteristics similar to those of Mendota Heights.
The population column details the number of residents to understand the number of visitors to the parks and what programs they use.
The size (square miles) of the cities will provide additional information about the community and how parks can allocate resources for larger or smaller cities.
Overall, the chart serves as a valuable tool for comparing the demographic and spatial characteristics of the benchmark cities to the metrics that Mendota Heights Parks and Recreation will use to evaluate their own park operations and make improvements where necessary tothe serve residents of the Mendota Heights community.




With a population of 11,744, Mendota Heights is the second smallest among all benchmark cities and ranks fourth in land area. While Golden Valley is slightly larger in size, its population is nearly double that of Mendota Heights, resulting in significantly higher population density.


To provide additional contrast data to Mendota Heights Parks and Recreation, information will also be shown about park systems throughout the United States that was obtained by the National Recreation and Parks Association (NRPA), 2024 NRPA Agency Performance Review. NRPA categorizes their data using several metrics, and for the purpose of this report, the information from NRPA data of cities with a population of less than 20,000 residents will be used. (Figure 2.) The benchmark cities data should be used as an additional reference for Mendota Heights Parks and Recreation, but because NRPA segments their city population, their data should be an extended view of agencies nationwide. NRPA does not gather data for the metrics Mendota Heights Parks and Recreation chose to evaluate, so some charts will not show NRPA data. The NPRA data is collected from 1,000 park and recreation agencies and where NRPA data is available for comparison to the benchmark metrics in this report, it will be listed below the corresponding chart or graph.
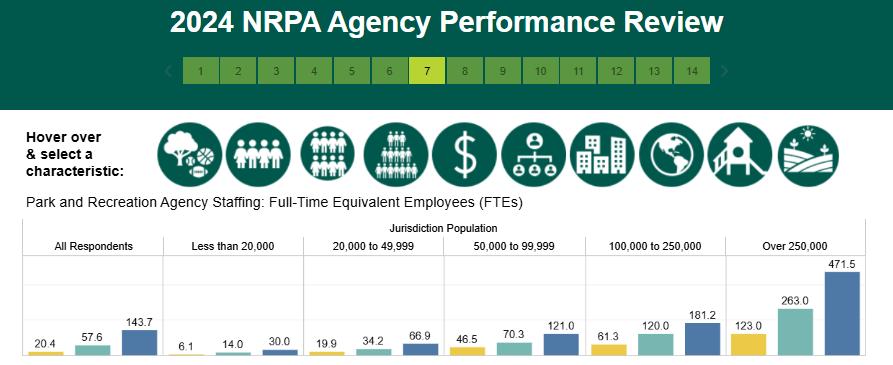
Mendota Heights Parks and Recreation has 1,046 residents per square mile of the City
• NRPA ranks Mendota Heights in the upper quartile with cities “less than 20,000 people” for population density when compared to the other cities, towns and census designated places (CDP) in Minnesota.
The parks information chart (Figure 3.) provides an overview of metrics and answers from the benchmark agencies. The metrics indicate the number of parks, total acres of parkland maintained, and miles of trails. Acres maintained in a park system relate to the number of maintenance staff, and often to the maintenance level standards Acres per maintenance staff is not definitive; only a recommendation based on routine park maintenance practices. The FTE maintenance staff calculation derived from parkland and


trails information is to be interpreted as a guide and does not include information about the type of parkland maintained, the presence or number of sports fields, or each agency’s maintenance schedules. Trails are a desired amenity by residents and will require specific maintenance to keep them presentable, safe, and useable. This chart does not have specific information about the level of maintenance, but when


Utilizing NRPA Cities, agencies have an average 20.9 acres of parkland per 1,000 residents and 9.2 miles of trails in their park system.

Mendota Heights Parks and Recreation has 146 acres of parkland, equaling 12.4 acres per 1,000 residents and 28 miles of trails.
compared with employees required to care for park acres, number of parks, and number of trails later in this report, more information will be presented to show the correlation. The chart shows the number of parks each agency is responsible for, giving a view of the breadth of park coverage in total acres. Parks contain various amenities and require distinct types of maintenance as well as specific maintenance levels to adhere to individual agency standards. Therefore, the number of parks as well as total acres maintained are factors that will assist Mendota Heights Parks and Recreation for the care of their parks and required staff numbers with those of the benchmark agencies. The acres maintained column also provides information on the total area of land each agency maintains within their parks, highlighting the scale of their operations. Additionally, the miles of paved and unpaved trails quantify the extent of trail infrastructure within each park system an important factor influencing the number of maintenance staff required.
Paved and unpaved miles of trails in the chart also show that all benchmark agencies have at least six times the number of paved trails as unpaved trails. Overall, this chart is useful for understanding the scope of parkland care for acres and miles of trails.
Parks & Parkland
Number of Parks Acres Maintained
Figure 4 Parks and Parkland


The bar graph above clearly shows that Green River parks and recreation has 5.48 times more acres maintained than Mendota Heights Parks and Recreation. (654 more acres) A greater number of acres in a park system is usually related to a larger city, but in this case both Green River and Mendota Heights are nearly the same population. (Mendota Heights has 343 more residents than Green River)
For example, an agency responsible for a large number of parks typically manages a significant amount of parkland. This broad coverage demands substantial resources and careful coordination to ensure all areas are properly maintained. Beyond the total acreage, the number of parks, natural areas, ball fields, and facilities also influences the type and complexity of maintenance required.
Moreover, having more parks often indicates a broader commitment to providing accessible green spaces for the community. This contributes to environmental conservation, recreational opportunities, and public well-being. Each park, regardless of size, adds to the total acreage the agency is responsible for, and cumulatively, this can result in a large, varied type of parkland requiring maintenance. This reflects the total staff that each of the benchmark agencies require to care for in their park systems.
This underscores the need for effective resource allocation and strategic planning to maintain high standards of park care across all properties.
The contents of the chart below show the number of staff for each benchmark agency separated into the various employee positions as well as their job classification. (Figure 5.)


Responses from NRPA agencies in cities of 20,000 or less show 14.0 (FTEs) Full Time Equivalent employees
Mendota Heights Parks and Recreation has:
• the lowest number of full-time staff. There is an imbalance of personnel in maintenance, recreation and administrative divisions
Seasonal staff are vital during peak visitation times, such as spring and summer, when the number of park visitors significantly increases. They support the full-time staff by assisting with the increased level of responsibilities and ensure the parks can accommodate the surge in visitors.

Mendota Heights Parks and Recreation has:
• the second lowest number of seasonal staff in parks and recreation benchmark communities
Seasonal maintenance staff play a crucial role in keeping parks in optimal condition throughout the year, but their efforts are especially important during busy seasons. The range of seasonal weather conditions demand more intensive plant care and turf care, foliage and leaf maintenance, and snow plowing and removal.
Percentage of Staff Positions with NRPA Agencies
Referring to the NRPA percentage calculations above (Figure 6.), percentages were used to determine what the Mendota Heights Parks and Recreation full time operations/ maintenance staff ratio is to the overall full-time staff. Mendota Heights Parks and Recreation is above the NRPA percentage of 43% for maintenance/operations employees by referencing park systems nationally from NRPA and the highest for benchmark cities


CITY OF MENDOTA HEIGHTS, MN MASTER PLAN; BENCHMARK ANALYSIS
Full-time and seasonal staff are integral to the continuous management and operation of parks, whereas full-time, part-time, and seasonal maintenance staff are all responsible for the ongoing upkeep of park facilities and grounds. However, there is currently an imbalanced number of staff across these categories, which impacts operational efficiency and workload distribution.
The comprehensive list of core programs was developed by combining the core programs of all benchmark agencies. (Figure 8.) The data for core programs across the benchmark agencies reveal interesting comparisons between Mendota Heights Parks and Recreation and other agencies.

Mendota Heights Parks and Recreation provides a focused selection of programs, singularly offering Arts and Technology Programming as a unique program provided only by them.
Core Programs that Mendota Heights offers are:


Mendota Heights Parks and Recreation offers programs that two or more benchmark agencies also offer indicating programs that are popular with residents in their respective communities:
• Adult Softball
• Senior Programing
• Specialty Events
• Youth Sports
• Youth Programs
Areas that could be considered as gaps in core programs at Mendota Heights Parks and Recreation that the benchmark agencies offer but Mendota Heights Parks and Recreation does not offer are:
• Adult Programs
• Adult Sports
• Curling, Lawn Bowling
• Community Center Activities
• Family Programs
• Fitness Programs
• Gym Programs
• Indoor Ice
• Kids Programming (games and activities)
• Outdoor Aquatics
• Pee Wee Sports
• Playgrounds
• Specialty Programs
• Summer Playground Programs
In summary, while Mendota Heights Parks and Recreation offers niche programs for Arts and Technology Programming as well as Adult Softball and Field Trips, the other agencies collectively offer a wide-ranging set of programs that cover physical fitness, active engagement, sports, and physical activities. This distinction highlights a more targeted approach with Mendota Heights Parks and Recreation versus the broad, inclusive strategy employed by the benchmark agencies.
The total number of programs for all agencies:
Mendota Heights Parks and Recreation: 15 programs
Golden Valley Parks and Recreation 6 programs
Green River Parks and Recreation 6 programs
New Brighton Parks and Recreation 9 programs
New Hope Parks and Recreation 11 programs
West Saint Paul Parks and Recreation
West Saint Paul Parks and Recreation 11 programs
The more programs an agency offers often indicates the need for a larger number of staff, a wider variety of size and type of facilities, park size and type, and number of amenities offered In-house programs can be a financially viable solution when more programs are offered, while facilities and amenities can accommodate additional programs. Mendota Heights Parks and Recreation has the highest number of programs among the benchmark agencies.
Percentage of NRPA agencies that have programs in common with Mendota Heights Parks and Recreation
Special Events: 89% Racquet Sports: 73% Golf: 49%


Park Visitors
Park systems utilize visitor numbers in various ways to evaluate operations, administration, maintenance, and to improve their parks. In this benchmark analysis visitors have been sorted in two classifications. (Figure 9.)
• Participant: One person counted individually per program or class.
• Participations: The number of times one person uses a facility or program. (i.e., one person accumulates 8 participations of a class)

Annual Number of PARTICIPANTS


Annual Number of PARTICIPATIONS


Mendota Heights, MN 4,168


New Brighton, MN no data provided 13,224 programs only New Hope, MN 7,565 programs only 6,867 2,529 2,750 2,601 no data provided no data provided
Golden Valley, MN


West Saint Paul, MN 4,995 2,583

Participants are normally users that purchase a day pass or attend a specific class. These users may progress in participations as they become more familiar with programs and services the agency offers. Memberships drive participations since users feel they will receive more value from their membership by participating in additional programs or activities.
Mendota Heights Parks and Recreation has a slightly smaller number of participants than Golden Valley Parks and Recreation at 2,601 but a higher number of participations; 2,750. This suggests that while Golden Valley attracts a comparable number of participants, Mendota Heights Parks and Recreation has users involved more often in multiple programs and activities.
New Brighton Parks and Recreation stands out with a significantly higher number of participants at 13,224, yet no information was provided regarding how many times users were active in a program, class, or activity.
New Hope Parks and Recreation also shows strong engagement with 6,867 participants and 7,565 participations. This data highlights a robust level of users, yet with a slightly higher number of participations which shows that users are not involved multiple times in programs or activities.
West Saint Paul Parks and Recreation and Mendota Heights Parks and Recreation have a very close number of participants, yet West Saint Paul Parks and Recreation has 18% more participations.
Looking solely at Mendota Heights Parks and Recreation participants and participations, the larger number of participations indicates that users are frequently involved in programs and activities.


The chart below shows financial information about Mendota Heights Parks and Recreation and all benchmark agencies for revenue, expenses and the average capital. The current year budget as well as the previous year are shown for comparison.


Two similar provider agencies did not provide data about their earned and unearned revenue sources. (Figure 11.) Mendota Heights Parks and Recreation generates 62% of its earned revenue from program fees. This percentage is highest of all benchmark agencies, indicating the fees are important to the financial sustainability of Mendota Heights Parks and Recreation, and offering more programming will have a positive effect on earned revenue.
Mendota Heights Parks and Recreation currently generates significantly less revenue from permits, reservations, rentals, and land leases compared to benchmark cities. While the department relies more heavily on other forms of unearned or non-tax revenue such as sponsorships, grants, and partnerships it may benefit from exploring additional revenue opportunities within these underperforming categories. These sources can provide more consistent and sustainable funding year over year and help strengthen the department’s overall financial resilience.


NRPA shows nationally the Program Revenue average is 56% of Earned Revenue Mendota Heights Parks and Recreation Program Revenue is 62% of Earned Revenue


Benchmark agencies provided a financial set of data (Figure 12.) Golden Valley is the only park agency that has a 27-hole course, and their total revenue, expenses and program revenue will not be an accurate reference with Mendota Heights Parks and Recreation Par 3 Golf Course or the other similar providers that all have 9-hole courses. Green River and West Saint Paul will not be included in this section because they do not have a golf course.


In 2023, the total revenue data for golf courses in Mendota Heights, New Brighton, and New Hope reveal significant differences. The Mendota Heights Par 3 Golf Course reported a total revenue of $296,818. In comparison, New Brighton’s Golf Course generated a total revenue of $327,741, which is $30,923 more than the Mendota Heights Par 3 Golf Course. This means that New Brighton’s Golf Course has total revenue approximately 10% higher than the Mendota Heights Par 3 Golf Course.
Greens fees and cart rentals are not the only source of revenue to a golf course. Including golf technology with an Online Tee Time Software and Virtual Golf Simulators, a driving range, a well-stocked concession stand, and golf merchandise can provide additional revenue and a value-added service to golfers. With a dedicated full-time golf course staff, additional golf programs and lessons, hosting tournaments and business outings can add revenue and should be marketed well to promote these activities/opportunities.
The disparity is even more pronounced when referencing the total revenue with that of New Hope’s Golf Course. New Hope's Golf Course brought in total revenue of $529,939 for 2023, which is $233,121 higher or 78.5% higher than the Mendota Heights Par 3 Golf Course total revenue.
Considering 2022, the full year prior, the Mendota Heights Par 3 Golf Course reported total revenue of $264,361. As a reference, New Brighton’s Golf Course generated a total revenue of $291,137, which is $26,776 more than the Mendota Heights Par 3 Golf Course. This represents approximately 10.1% higher earnings for New Brighton compared to the Mendota Heights Par 3 Golf Course.


CITY OF MENDOTA HEIGHTS, MN MASTER PLAN; BENCHMARK ANALYSIS
The difference is more significant when comparing the Mendota Heights Par 3 Golf Course revenue with New Hope’s Golf Course which had revenue for 2022 of $438,982, which is $174,621 higher than the Mendota Heights Par 3 Golf Course’s revenue. This marks an approximate higher revenue of 66.1% for New Hope over the Mendota Heights Par 3 Golf Course.
The graph below provides a visual of total revenue for 2022 and 2023 for the Mendota Heights Par 3 Golf Course, New Brighton Golf Course, and New Hope Golf Course. (Figure 13.)
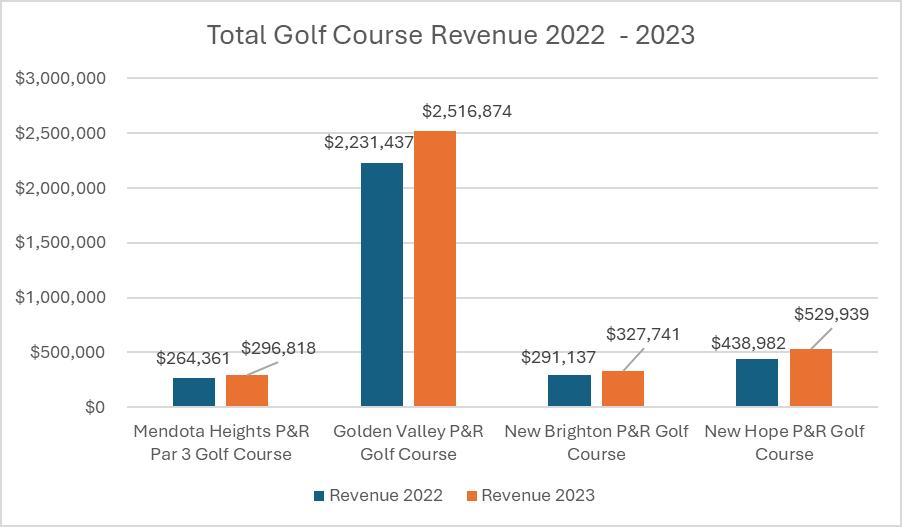
In 2022, the expenditure data for golf courses at Mendota Heights, New Brighton, and New Hope is shown with the Golf Course Expenditures Chart 2022- 2023 (Figure 14). Mendota Heights Par 3 Golf Course reported total operational expenditures of $220,309. In comparison, New Brighton’s Golf Course incurred expenditures totaling $206,718, which is $13,591 less than the Mendota Heights Par 3 Golf Course, indicating approximately 6.2% lower spending by the New Brighton Golf Course.
The difference in expenditures is even more pronounced when comparing the Mendota Heights Par 3 Golf Course with New Hope’s Golf Course, where operational expenditures for 2022 were $400,741, which is $180,432 more than the Mendota Heights Par 3 Golf Course expenditures. This is approximately 81.9% more in spending in New Hope over the Mendota Heights Par 3 Golf Course.
Of the three agencies previously reviewed, (New Hope Golf Course, New Brighton Golf Course, and Golden Valley) all had 2022 revenue that exceeded expenditures.


The data comparing expenditures from 2022 and 2023 for Mendota Heights’ Par 3 Golf Course to similar provider agencies is presented in the graph below.
Green River Parks and Recreation and West Saint Paul Parks and Recreation do not have a Golf Course
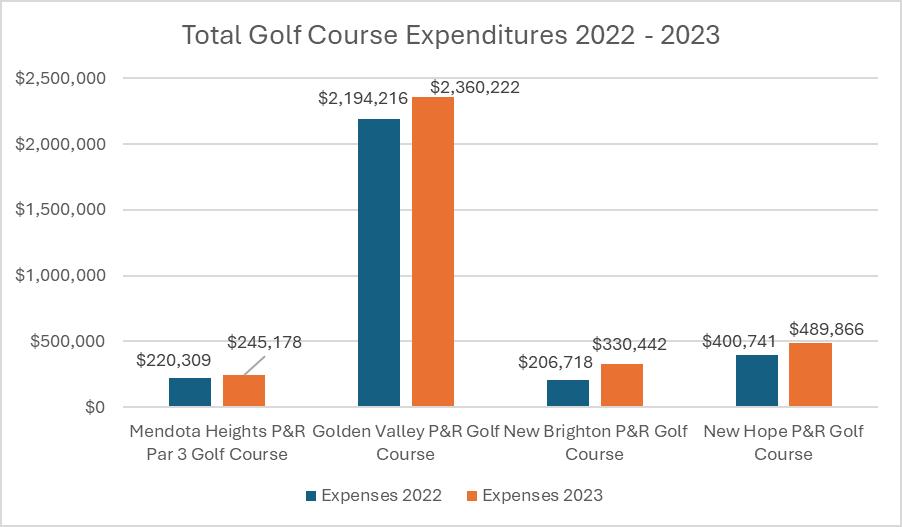
GOLF REVENUE AND EXPENDITURES
Revenue and expenditures for the years 2022 and 2023 are shown below. (Figure 15.)


Including the Mendota Heights Par 3 Golf Course, two other benchmark agencies produce revenue with the golf programs they offer. (Figure 16.) The programs could be lessons (various ages) or clinics (specific skills) Golden Valley is a much larger course, and it would be expected for them to have a larger amount of revenue from more programs.
The Mendota Heights Par 3 Golf Course has a larger amount of program revenue than New Brighton for nearly the same total golf course revenue.


Recreation programs and services form the essential foundation of park and recreation systems. The goal of the program assessment is to understand current recreation program and activity offerings, as well as recommendations for additional programming to meet community needs and priorities identified in the community needs assessment.
The recommendations within this report align with Mendota Heights Parks and Recreation’s (“MHPR”) overall mission and vision within the strategic plan. These practices have been proven to lead to improved planning, better service delivery, and enhanced community satisfaction. Streamlining processes can make for smoother daily operations. Additionally, improved data analysis and strategic planning for recreation programming lead to more informed decision- making and better program execution.
The program findings and comments are based on a review of information provided by MHPR staff and partners including program descriptions, financial data, and website content. This report addresses the program offerings from a systems perspective for the entire portfolio of programs.
The program assessment identifies the strengths, challenges, and opportunities in current programming. It also highlights core programs, gaps in services, and key system- wide issues. The assessment offers strategic recommendations to improve existing offerings and guide future program planning for both residents and visitors. Implementing these recommendations will require strong support from City leadership, including investments in funding, staffing, and facilities, to ensure MHPR’s long- term success .
MHPR boasts strengths in its program offerings, particularly evident in the high public participation rates . This enthusiasm demonstrates strong community engagement and a clear demand for MHPR services S ports programming for golf and tennis are a particular strength of MHPR by providing quality, specialized sports instruction to varied interests and skill levels within the community. However, programs and leagues operated by third- party associations currently utilize a disproportionate amount of MHPR resources. S trategic partnerships, such as the collaboration with School District 197, Dakota County, and West Saint Paul for programming space, could be leveraged to expand the range of activities offered despite space , staffing, and funding constraints. These partnerships would be highly dependent on the partners’ available resources, interest, and MHPR base offerings . Furthermore, lease agreements and contracts with sports associations and instructors should be revisited regularly to clarify roles and responsibilities for areas like field maintenance , program administration, and fees . The fees within agreements for third parties using public park and sports field spaces should also be increased to offset the cost of increased resources that MHPR has recently put toward providing this service.
MHPR faces notable challenges that require direct attention to sustain and enhance program offerings in both the short- term and long- term . A primary issue is the existing staff limitations , which can hinder the department's ability to manage and diversify its offerings effectively. Additionally, space limitations constrain the number and variety of programs that can be provided as well as participants , potentially leaving some community needs unmet. Also, the absence of a pricing strategy for services compl icates financial planning and can lead to inconsistencies in earned income opportunities that can offset operational costs, program accessibility and affordability. Addressing these challenges will be crucial in ensuring that MHPR can continue to meet the recreational needs of residents while maintaining high standards of program delivery.
The following observations have been identified through discussions with MHPR staff and an analysis of recreation programming data.
• MHPR serves most age segments with its core programming but would benefit from additional programm ing for preschool ages (ages 5 and under) and older adults (ages 55 and over)
• MHPR has a higher percentage of programming that falls within the “Saturated” and “Decline” stages meaning there is a need for diversification and integration of activities of rising interest.
• MHPR classifies more than half of its programming as “Value - Added” which typically comes with the expectation that most direct and indirect expenses are covered through earned income sources, such as user fees.
• MHPR prices most of its programming by residency status and the customer’s ability to pay.
• Current core program areas do not have established cost recovery goals or a cost- of- service analysis that details the full cost of providing the service.
• MHPR lacks the staffing and facility capa c ity to take on additional programs in core areas such as special events, sports, and active adult or senior programs. Strengthening current partnerships and defining a future staffing plan for the department are essential if MHPR looks to keep pace with community demand.
• Special events are a high priority for the community and MHPR resources should be expanded to focus on this area.
• The core program area of “Seniors” should be rebranded and further defined to include both passive and active opportunities for the various age segments, interests, and abilities within ages 55 and over.
• Program and quality assurance standards should be further developed to ensure consistency with service delivery for programs offered in- house and through third- party contractors or partners.
• MHPR ’s website adheres to several Web Content Accessibility Guidelines, as outlined by digital.gov, to accommodate users of all abilities.
1.2.1
It is important to identify Core Program Areas based on current and future needs to create a sense of focus around specific program areas of greatest importance to the community. Public recreation is challenged by the premise of being all things to all people. The philosophy of the Core Program Areas is to assist staff, policy makers, and the public to focus on what is most important to the community to prioritize funding, staffing, and programming accordingly. Program areas are considered as Core if they meet most of the following criteria:
• The program area has been provided for an extended period (over 4 - 5 years) and/or is expected by the community.
• The program area consumes a relatively sizable portion (5% or more) of MHPR ’s overall budget.
• The program area is offered 3 - 4 seasons per year.
• The program area has wide demographic appeal.
• There is a tiered level of skill development available within the program area’s offerings.
• There are full - time staff responsible for the program area.
• There are facilities designed specifically to support the program area.
• MHPR controls a significant percentage (20% or more) of the local market.


The following core program areas, descriptions, and outcomes for MHPR were identified during the data collection phase.
• Special Events & Programs are seasonal events and programs that benefit multiple age and interest groups. This includes legacy events, the summer Music in the Park program and Tour De Rec. Events and programs typically include other departments and City businesses. MHPR aims to promote a connected and healthy community through partnerships with other community organizations. These programs are provided at low or no cost to participants.
• Golf programs are hosted at the Par 3 Community Golf Course and focus on teaching skills through lessons and open play programs. Most programs achieve cost recovery through user fees.
• Net Sports programs include Pickleball and Tennis lessons, tournaments, and free play for multiple age groups. MHPR provides lessons for beginner and intermediate levels at a low cost.
• Senior programming is intended for ages 55+ and supports the mental, physical, and emotional health and wellbeing of seniors in the community. The goal is to provide low to no cost social opportunities for seniors in the community to stay connected with each othe r.
• Art & Tech consists of contracted programming that offers art and technology camps and lessons for youth and young adults. MHPR partners with adjacent cities to provide low- cost access to learn new technology and enrichment opportunities.
• Youth Camps & Field Trips provide engaging activities through childcare for youth and teens during out- of- school time. These programs are provided at a low cost and in partnership with adjacent cities.
MHPR should further define core program areas and measurable outcomes within each area based on community priorities for recreation programming. Developing goals and key outcomes for core recreation program areas is crucial for a parks and recreation agenc y for several reasons:
• Clear goals provide a roadmap for program development and decision- making, ensuring that efforts are aligned with the MHPR mission and community needs.
• Key outcomes offer measurable indicators of success, enabling MHPR to track progress, evaluate effectiveness, and make data - driven decisions. These could include program participation rates, customer retention and feedback on service quality.
• Establishing goals and outcomes holds MHPR accountable to stakeholders, including residents, funders, and staff, demonstrating commitment to improving community services and achieving results.
• Goals and outcomes help prioritize resources and allocate the budget effectively, ensuring that investments are directed toward programs that provide the most significant impact.
• Regularly assessing progress towards goals allows MHPR to identify strengths and areas for improvement, leading to enhanced program quality and community satisfaction.
• Well - defined goals and outcomes communicate MHPR ’s objectives to the community, fostering transparency and encouraging public support and participation.
• Goals and outcomes inform strategic planning and long- term development, guiding MHPR in adapting to evolving community needs and trends in recreation and wellness.
MHPR should look to develop more adaptive recreation programs throughout all their core programming areas and facilities. The goal of adaptive recreation is to ensure that everyone, regardless of ability, can participate in recreational activities and enjoy the physical, mental, and social benefits of an active lifestyle. To be intentional with these efforts, staff should continue to assess community needs as well as strategic partnerships with local organizations that could enhance offerings. Collaborating with experts and engaging volunteers can enhance program design and support.
Training staff in disability awareness and specialized adaptive techniques is crucial, along with improving facility accessibility by conducting regular audits and implementing universal design principles with new design or renovation projects.
Successful adaptive recreation programs start with specifically designed programs that can be adapted to various abilities, ensuring everyone can participate together. MHPR should create specific programs for individuals with a variety of disabilities, using specialized adaptive equipment and techniques.
Finally, raising community awareness about the importance of adaptive recreation and highlighting success stories fosters a more inclusive and supportive environment. Promoting programs through accessible communication and diverse outreach channels ensures broad community awareness and participation.
MHPR can support the development of youth sports through programs that offer skill development opportunities specifically for golf and tennis. With limited staffing and facility capa c ity, MHPR should continue to focus on more entry- level, instructional youth sports programming through partnerships with community organizations, adjacent communities, and third- party contracts. Sports leagues and tournaments require significant resources to manage the administrative and logistical responsibilities that will ta ke away from other priorities of the department unless there are dedicated staff overseeing league or tournament operations. Leagues operated by third- party associations or organizations should be responsible for independently financially supporting their activities . This should include but is not limited to field rentals, equipment, and field improvements beyond those needed for basic use and maintenance, as well as staffing for tournaments

and events. Currently, the leagues operated by associations utilize a disproportionate amount of MHPR resources and staffing to the detriment of other programming.
Community special events are clearly valued by the Mendota Heights community as measured by the high attendance of these events and feedback throughout the master plan community engagement process . As a high priority for residents, MHPR should continue to invest resources into this core program area. However, e vent management, particularly for larger community scale events, requires many resources not only from MHPR but other City departments and partners to ensure the safety and satisfaction of participants. As such, MHPR will need additional staffing in the future to support continued longevity and potential of this core program area. MHPR would benefit from a full - time Event Coordinator position who could oversee event planning and execution The Event Coordinator would also assist with community engagement including outreach, strategic partnerships, and sponsorships to allow current staff to focus on other critical core job responsibilities .
The senior core program area should be rebranded and more clearly defined to identify both passive and active programming for older adults. The 55 and over, or older adult population, have a wide variety of interests and abilities that should be accounted for in future recreation program planning. Programs should focus on education on digital use and resources, social engagement, creative expression, and health and wellness.
Program standards should be established as a part of the development process to ensure consistency of services . A focused approach should be applied to quality assurance for all services and how they are planned, implemented, and evaluated.
Quality standards should include expectations for staff training standards, staff performance evaluations, the condition of the program space, condition of supplies and equipment used for activities, and adhering to risk management policies and practices.
Customer service standards ensure that staff are maintaining a safe, quality, and positive experience for participants. Important standards are applied to the customer’s journey from the point of deciding to register for a program or activity, through the registration process, participation, and, finally, evaluation of the customer’s experience after the program or activity has been completed. Staff should always be mindful of consistent communication with the customer through the completion of the program or activity as well as ways that the customer experience can be enhanced.
• Establish standards for service delivery, staff training, program conditions, and risk management to ensure consistent quality.
• Apply customer service standards and maintain consistent communication to enhance the customer experience from registration to post- program evaluation.
• Use performance measures and HR standards, including training and reviews, to ensure effective program delivery and staff skill development.
Performance measures are vital gauges for parks and recreation programs. They cut through guesswork, revealing what truly resonates with the community. For example, participation numbers paint a clear picture of program popularity, while satisfaction surve ys illuminate areas for improvement with service delivery. By tracking outcomes linked to core programming as outlined in section 1.2.3, MHPR can pinpoint their programs' impact and justify their value to stakeholders. Ultimately, performance measures guide data - driven decisions, ensuring resources are directed towards programs that bring the most benefit to the community.
Tracking program cancellation rates was identified as an area for enhancement for MHPR . Consistently monitoring this metric will provide staff with valuable insights on program design including accessibility issues, communication gaps, resource allocation, or other external factors that could be impacting participation.
For recreation staff and MHPR leadership, key performance indicators (“KPIs”) foster accountability and transparency, facilitating a clear understanding of individual and team contributions towards MHPR goals. Regular monitoring and reporting on KPIs create a culture of continuous improvement and performance excellence. Staff can align their efforts with strategic priorities, focusing on initiatives that yield the highest community benefits. Additionally, KPIs enable leadership to recognize and reward outstanding performance, promote professional development, and cultivate a motivated workforce dedicated to enhancing the quality of life for the community through exceptional recreation programming.
Human resource standards are crucial for park and recreation programs because they ensure qualified, trained staff. This means recreation programs are led by competent instructors who can deliver safe and effective activities. Standards also promote fair treatment of staff, fostering a positive work environment that attracts and retains skilled employees. Ultimately, strong HR practices underpin successful recreation programs, benefiting both staff and the community they serve.
Specific standards that were analyzed, such as training and performance reviews, contribute to this goal. For example, a variety of training courses ensure staff have the wide range of skills and knowledge necessary to lead programs effectively, while performance reviews help identify areas for improvement and promote accountability toward continuous improvement and MHPR goals
For instance, by understanding staff strengths and areas for improvement, MHPR can tailor training and professional development to address specific needs within recreation programming. Continued learning is one of the main drivers for staff motivation and a positive work culture. Also, encouraging open communication between staff and management will help ensure constructive feedback on employee performance is directly applied to program planning, execution, and customer services.
Additionally, performing regular quality assurance observations of contracted programs ensures that these instructors align with MHPR expectations and standards for community recreation.

Performance evaluations and quality assurance observations are in and of themselves time and resource intensive requirements . Further, they must be completed by senior staff or director level leadership. This requirement should be planned and accounted for accordingly in workload assessments and staffing. The current MHPR leadership staff is at capacity. Additional staffing should be explored to free up leadership to fulfill expert level tasks such as this.
Figure 1 below depicts each core program area and the most prominent age segments they serve. Recognizing that many core program areas serve multiple age segments, Primary (noted with a ‘P’) and Secondary (noted with an ‘S’) markets are identified.
For this report, an Age Segment Analysis was completed by the core program area, exhibiting an over- arching view of the age segments served by different program areas . The analysis also displays any gaps in segments served. It is also useful to perform an Age Segment Analysis by individual programs, to gain a more nuanced view of the data.
Staff should continue to monitor demographic shifts and program offerings to ensure that the needs of each age group are being met. It is best practice to establish a program plan for each program or activity that identifies what age segment to target, establishes the right type of message and desired program outcome, which marketing method(s) to use, and determines what to measure for success before allocating resources towards a particular effort.
The future of recreation programming in Mendota Heights will be significantly influenced by demographic and recreation demand trends. By 2038, the 55+ age segment will comprise of 50 percent of the community, necessitating a shift towards more senior or active adult friendly programming, including low- impact activities, wellness programs, and social engagement opportunities. The high per capita and median household incomes, which surpass state and country averages, suggest that residents may be willing to invest in premium recreational experiences with disposable income to spare . Consequently, MHPR can consider introducing higher- end or specialized programs, such as advanced tennis and golf le ssons, upscale outdoor adventure activities, and introduce more art and cultural programming opportunities to the community. W ith a market potential index for these activities already higher than the national average, there is a clear demand that can be capitalized upon to design future programs that cater to the evolving needs and interests of Mendota Heights residents.
A program lifecycle analysis involves reviewing each program offered by MHPR to determine the stage of growth or decline for each. This provides a way of informing strategic decisions about the overall mix of programs managed by MHPR to ensure that an appropriate number of programs are “fresh” and that few programs, if any, need to be discontinued. This analysis is not based on strict quantitative data, but rather, it is based on staff members’ knowledge of their programs. Figure 2 shows the percentage distribution of the various lifecycle categories of MHPR ’s programs. These perce ntages were obtained by comparing the number of programs in each individual stage with the total number of programs listed by staff members.
It is recommended to have fifty to sixty percent of all programs within the beginning stages because it provides MHPR with an avenue to energize its programmatic offerings. These stages ensure the pipeline for new programs is there prior to programs transitioning into the Mature stage.
The Mature stage anchors a program portfolio, and it is recommended to have forty percent of programs within the Mature category to achieve a stable foundation.
It is a natural progression for programs to eventually evolve into saturation and decline stages. However, if programs reach these stages rapidly, it could be an indication that the quality of the programs does not meet expectations, or there is not as muc h of a demand for the programs. As programs enter the Decline Stage, they must be closely reviewed and evaluated for repositioning or elimination. When this occurs, MHPR should modify these programs to begin a new lifecycle within the Introductory Stage or replace the existing programs with innovative programs based upon community needs and trends.
• Conduct an annual review of all programs to determine their stages of growth or decline and adjust the portfolio as needed to maintain balance and innovation.
• Aim for 50 - 60% of programs in the beginning stages to energize offerings and ensure a pipeline for future mature programs.
• Implement annual performance metrics for each core program area to track participation growth, customer retention, and the introduction of new programs, fostering innovation and alignment with community needs and trends.
S taff should complete a Program Lifecycle Analysis , using the process in Figure 3 , on an annual basis and ensure that the percentage distribution closely aligns with the desired performance. Furthermore, MHPR could include annual performance measures for each core program area to track participation growth, customer retention, and percentage of new programs as an incentive for innovation and alignment with community trends.

Figure 2 : Program Lifecyle Analysis: MHPR has a higher percentage of programming that falls within the “Saturated” and “Decline” stages. Staff should regularly review these programs and the need to reposition them or eliminate them from MHPR offerings. For instance, golf programming has experienced a decline in participation mostly because MHPR lacks a dedicated FTE to allocate to this service. However, MHPR has budgeted for one in 2025 which could result in increased programming and participation for golf programs.


BEGINNING
Establish program goals

Design program scenarios & c omponents

Conduct / operate program

Develop program operating / business plan

Conduct regular evaluation based on established criteria

Update program goals / business plan and implement

Slow to no participation growth

Declining participation

Sustained / growing participation

Look at market potential, emerging trends, anticipated participation, priority rankings, facility space issues, and evaluations to Modify Program

programming existing

Terminate and replace with a new program based on public priority ranking, emerging

3 : Program Lifecycle Evaluation Process
Conducting a classification of services analysis informs how each program serves the overall organization mission, the goals and objectives of each core program area, and how the program should be funded with tax dollars and/or user fees and charges. Where a program or service is classified depends upon alignment with the organizational mission, how the public perceives a program, legal mandates, financial sustainability, personal benefit, competition in the marketplace, and access by participants. Program classifications can also help to determine the most appropriate management, funding, and marketing strategies.
With assistance from staff, a classification of programs and services was conducted for all the recreation programs offered by MHPR . The results presented in Figure 4 represent the current classification distribution of recreation program services. All MHPR programs should be assigned cost recovery goal ranges, through an MHPR pricing policy, for the different classifications or core program areas.
Public interest; Legal Mandate;Mission Alignment
Financial Sustainability
Benefits (health, safety, protection of assets, etc.)
Competition in the Market
Access
Free, nominal or fee tailored to public needs, Requires public funding
Substantial public benefit (negative consequence if not provided)
Limited or no alternative providers
Open access by all
Fees cover some direct costs, Requires a balance of public funding and a cost recovery target
Fees cover most direct and indirect costs, Some public funding as appropriate
Public and individual benefit Primarily individual benefit
Alternative providers unable to meet demand or need
Alternative providers readily available
Open access Limited access to specific users Limited access to specific users
Figure 4 : Program Classification: MHPR classifies more than half of its programming as “Value- Added” which typically comes with the expectation that most direct and indirect expenses are covered through earned income sources, such as user fees.
More than half of MHPR programming is classified as “Value - Added” which primarily includes instructiona l sports programming for pickleball, tennis, and golf as well as softball and golf leagues. Value - added programs primarily serve individual users and there is likely more market competition for these types of activities. Also, “Value - Added” programs typicall y receive less public funding because of their limited user base. Thus, the direct and indirect expenses for these types of programs should be covered by other sources such as user fees.
In general, MHPR program staff should continue the cycle of evaluating programs on both individual merit as well as the overall program mix. This can be completed at one time on an annual basis, or in batches at key

seasonal points of the year, if each program is checked once per year. The following tools and strategies can help facilitate this evaluation process:
MHPR should create a Program Development and Resource Guide that outlines a consistent program development process that can assist programming staff with service delivery standards for both in- house and contracted programs . This includes a worksheet that staff would fill out when proposing a new program or an update to a current program. The worksheet outlines critical program details including projected expenses that are used to establish the program fee. The worksheet also asks for information related to program outcomes, marketing tactics, and whether a similar program is offered elsewhere within the community.
Also, as a part of the program development process, MHPR should consider comparing planned programs and prioritizing resources using additional data points, such as potential partnership or sponsorship opportunities, market competition, and the program’s priority investment ranking from the community needs asse ssment survey. This additional analysis will help staff make an informed, objective case to the public when a program is in decline, but enjoyed by a few, is discontinued. A strong case is made for resources to be allocated to the program/service if it has a high priority ranking, appropriate cost recovery, good age segment appeal, good partnership potential, and strong market conditions.
Mendota Heights has many leisure and recreation opportunities available to residents offered by MHPR and other providers in the local government, non- profit, and private sectors. With limited resources, MHPR cannot realistically provide all recreation opportunities at a high level. Leadership should continuously assess its services to ensure they are not duplicating a program or activity that is already addressing a need in the community. The MacMillan Matrix (Figure 5) is a tool that can help staff determine if specific program areas are the right strategic investment for MHPR .
Affirm this program and negotiate functions with other organizations.
Give this away quickly.
Grow in order to provide this service to the community.
Decide with other organizations who should do this.
Collaborate to share the load or help to find resources.
Give this to other organizations, supportively.
"Soul of the Organization"find support for this or limit its scope.
Collaborate to share the load or give it away.
Give this away quickly. Give this away systematically.
Figure 5 : MacMillan Matrix: A strategic method to determine the best programming investments for MHPR .
Mendota Heights, MN Program Assessment
Based on an analysis of current program data, available facilities, recreation trends, comparable providers, and community input, MHPR may consider expanding its offerings to include private nonprofit associations, leagues, tournaments, and other activities. If pursued, it will be important to preserve scheduling for popular existing programs to avoid disruptions. The following chart illustra tes how the MacMillan Matrix can help guide decisions about where to invest future recreation program resources.
Other organizations cover this. Few other organizations cover this.
Strong Competitive Position
Good Fit With Mission and Abilities
Weak Competitive Position
Fit With Mission and Abilities
Instructional programs for golf, tennis, and pickleball
Private, non-profit association youth sport leagues and tournaments, indoor recreation, youth camps and out of school programs
Special events, Older/Active Adult passive and active programming, Adaptive recreation programming
Adult Sport leagues and tournaments
Give this away quickly.
Figure 6: The best investments for future programs include instructional sports programming, special events, and older/active adult passive and active activities.

Performing an alternative service provider and market definition analysis for recreational programming can offer several benefits to MHPR to help the organization operate more efficiently, offer higher- quality programs, and best serve the needs of the community.
• Understanding the alternative service providers in the market allows MHPR to identify gaps in existing services and potentially offer new or improved programs to meet the needs of the community more effectively.
• Identifying gaps in the market can also present opportunities for MHPR to develop new revenue streams through innovative programs or partnering with private providers for mutually beneficial outcomes.
• By analyzing the market, MHPR can identify potential cost- saving opportunities by either collaborating with existing providers or outsourcing certain services, thus optimizing resource allocation.
• Analyzing alternative providers helps the department benchmark its own programs against those offered by competitors, leading to the enhancement of program quality and diversity.
• Through consistent market analysis, MHPR can prioritize its resources based on identified needs and demands, ensuring that investments are directed towards areas where they are most needed and likely to have the greatest impact.
• By offering programs that align with community interests and preferences, MHPR can create greater engagement and satisfaction among residents, leading to increased utilization of recreational facilities and services.
• Insights gained from the analysis can inform the department's strategic planning process, helping to set clear objectives and priorities for future programming initiatives.


Highland Park Community Center
Mendota Country Club
Somerset Country Club
The Heights Racquet & Social Club
Thompson Park Activity Center
1978 Ford Pkwy, St Paul, MN 55116
2075 Mendota Dr, Mendota Heights, MN 55120
1416 Dodd Rd, Mendota Heights, MN 55118
1415 Mendota Heights Rd Suite 100, Mendota Heights, MN 55120
1200 Stassen Ln, West St Paul, MN 55118
Figure 7: The analysis of alternative providers for MHPR core programming within a five mile radius of Mendota Heights revealed several public, private, and non- profit organizations that offer similar services.
Many alternative providers in and around Mendota Heights are private organizations. This further highlights the need for strong parks and recreation facilities that can offer alternative programming opportunities focused on inclusivity, affordability, and wide demographic appeal. For instance, MHPR can support the need for youth sports programs by providing non- competitive, instructional programs that build skills for children in a variety of sports. This will continue to build interest in youth sports that eventually feeds into the more advanced programs that other organizations oversee within the community.
MHPR and its programming will benefit from a sustained effort toward building capa c ity to address the limitations of space and staffing. There are five key operational areas crucial to a park and recreation department’s success.
• Policy/Procedure: This involves establishing clear guidelines and protocols to achieve desired outcomes for park and recreation services, ensuring adherence to approved plans, policies, and standards.
• Management: This focuses on effectively organizing, coordinating, and supervising all departmental activities to fulfill defined goals. It encompasses staff roles, responsibilities, and overall workflow.
• Resources: This entails managing the department's resources, including finances, equipment, inventory, staff expertise, and information, to ensure their efficient utilization for optimal functioning.
• Technology: This emphasizes leveraging technology like software, tools, and equipment to enhance efficiency in park operations. This can involve utilizing digital platforms for communication, work order tracking, or resource management.
• Communications: This covers both internal and external communication strategies. It involves effectively disseminating information regarding park operations, promoting services and programs, and keeping the community informed about capital projects.
MHPR can adopt several strategic approaches that help strengthen the preceding key operational areas .
• Ensure a staffing plan is established before planning additional programs. Falling short on staff will have a direct effect on program capac ity and may leave some activities unsupervised or cancelled altogether.
• Consider partnering with additional community organizations to host programs. L everaging partnerships with local schools, community and private organizations can provide access to additional volunteers and spaces for programming, which can extend the range and reach of recreational activities. Utilizing these external venues during off- peak hours or through collaborative agreements can help mitigate space constraints without significant capital


investment. Also, volunteers with specific skills and interests can help fill a need for program instructors.
• The use of enhanced technology can help with staff efficiency through automated tasks and allow staff to be used in different, potentially more effective ways. For example, MHPR is adding online software for golf customers to book their tee times. This enhances the customer experience by making the reservation process more convenient and helps to automate the scheduling process, allowing staff to focus on other operational priorities.
o S treamline operations such as recruitment, training, and employee management through cloud software that brings together all necessary human resources functions .
o Systems that tie together program registration and facility usage data with financial performance data, can make analysis more efficient for budgeting, and reporting with accuracy.
o Automate marketing campaigns, content creation, and audience engagement. Software that brings all marketing functions under one umbrella and that also provides real - time engagement metrics can save staff a lot of time on this important recreational programming function.
o D esign and manage recreational programs and events. For example, new technology can help with research and data analysis to determine participation trends to recognize adjustments or enhancements that need to be made to offerings. Fitness centers are also using this technology for wellness analytics for members to help with the devel opment of wellness plans.
o Lastly, new technology can help in counting visitors, monitoring building systems, surveilling facilities, providing security, planning building improvements, and saving energy. This can save valuable time while providing more data for informed operational decisions.
Pricing strategies are one mechanism MHPR can use to influence cost recovery. Pricing tactics used most consistently by staff include determining the customer’s residency status and ability to pay. Figure 8 below details various pricing methods currently in place as well as additional strategies that could be implemented over time .
Median household income for the MHPR service area is well above state and national averages. MHPR should be mindful of this when pricing services. While income levels may allow MHPR to be more competitive with the private sector, there still may be a need for equitable pricing strategies for certain core program areas.
Figure 8 : MHPR prices most of its programming by residency status and the customer’s ability to pay. As MHPR looks to establish cost recovery goals, other recommended strategies can enhance earned income capabilities .
Moving forward, MHPR should consider researching any untapped pricing strategies and the impact they could have on cost recovery goals. For instance, MHPR could build their marketing budget by adding a marketing fee that is built into the overall fee for those programs that require more extensive promotions . This fee can eventually help to offset the costs for supplies, services, and personnel required for marketing and promotions.
Also, differential pricing such as weekday/weekend and prime time/non- prime time pricing could incentivize usage during off- peak times with lower prices and maximize revenue generation during periods of high demand.
These other pricing strategies can help balance revenue generation with accessible pricing, allowing MHPR to expand programming without overwhelming existing staff resources.
• Offering different prices based on age (e.g., youth, adults, seniors) can encourage participation across demographics. Seniors may receive lower fees, which can boost overall participation, while certain youth and adult programs that are in higher demand typically have higher rates and can generate more revenue to subsidize other services.


• Providing discounts for group registrations (e.g., sports teams, classes) can encourage larger participation with minimal marketing or outreach, reducing per- user administrative efforts while increasing total revenue.
• Setting fees in line with local competition ensures that MHPR remains competitive. This can maximize participation while aligning fees with what people are willing to pay, ensuring you are not undervaluing services, thus increasing revenue to reinvest in staff and other resources.
MHPR seeks to ensure that all members of the community can participate in recreation programs and activities, regardless of their financial circumstances.
Fundamental to equitable access is providing and supporting programs and amenities that serve all ages, abilities, and interests in the community. Following the previously outlined program strategy objectives will help to better ensure programs are more equitably distributed. Further, MHPR should consider including the following measures in the policy to address inequities:
• Identify specific populations in the City through demographic data to understand their needs and financial barriers. Where appropriate, tailor scholarship programming to specific populations such as youth, seniors, as well as low- income families.
• Provide income - based discounted rates for residents facing financial limitations. U.S. Federal Poverty Guidelines can be used to determine the appropriate percentage of fee discounts.
• Provide discounts for services for low- income residents.
• Offer alternative payment options and alternative payment methods to accommodate different financial circumstances.
• Implement community outreach and education with residents to raise awareness of available programs and services and help with accessing services.
• Ensure that measures are implemented to guarantee the confidentiality of all applicant information.
• Ensure that partnerships with private or non- profit organizations that use facilities and do not have customers that qualify for need based assistance – such as private, non- profit sports associations - cover the full costs of park use accordingly
Growing the MHPR scholarship fund for discounted recreational programming and facility access can significantly enhance equity in recreation offerings for the Mendota Heights community.
Leveraging the resources of a non- profit such as a potential partnership with the Mendota Heights Community Foundation or establishing a Park Foundation can create a conduit for community support and philanthropic endeavors. MHPR can tap into resources beyond its operational budget. A foundation can spearhead fundraising efforts, seeking donations from local businesses, individuals, and organizations committed to promoting wellness and community inclusivity. These contributions can be restricted funds specifically for a scholarship fund, ensuring that financial barriers do not hinder access to MHPR offerings. Additionally, the foundation can manage the allocation and distribution of scholarships, ensuring transparency and fairness in the selection process.
A revenue policy should be created as a part of the overall master planning process. The policy should outline eligibility criteria, application procedures, and selection criteria as well as how pricing differentials are established for various programs and services. The policy should align with MHPR’s mission as well as current financial policies. Transparency and accountability in the administration of the scholarship program can be
achieved through clear guidelines for fund allocation, selection processes, and regular reporting to the community on the impact of scholarships and how funds are being utilized. The policy should also be regularly reviewed and updated to be concurrent with changing demographics.
Cost recovery targets should be identified for each core program area at a minimum, and for specific programs or events when realistic. The previously identified core program areas would serve as an effective breakdown for tracking cost recovery metrics including administrative costs. Theoretically, staff should review how programs are grouped for similar cost recovery and subsidy goals to determine if current practices still meet management outcomes.
Determining cost recovery performance and using it to make informed pricing decisions involves a three - step process:
1. Classify all programs and services based on the public or private benefit they provide (as completed in the previous section).
2. Conduct a Cost- of- Service Analysis to calculate the full cost of each program.
3. Establish a cost recovery percentage, through MHPR policy, for each program or program type based on the outcomes of the previous two steps and adjust program prices accordingly.
To develop specific cost recovery targets, full cost of accounting needs to be created for each class or program that accurately calculates direct and indirect costs. Cost recovery goals are established once these numbers are in place, and MHPR ’s program staff should be trained on this process. A Cost- of- Service Analysis should be conducted on each program, or program type, that accurately calculates direct (i.e., program- specific) and indirect (i.e., comprehensive, including administrative overhead) costs. Completing a Cost- ofService Analysis not only helps determine the true and full cost of offering a program, but it also provides information that can be used to price programs based upon accurate delivery costs.
The methodology for determining the total Cost- of- Service involves calculating the total cost for the activity, program, or service, then calculating the total revenue earned for that activity. Costs (and revenue) can also be derived on a per unit basis. Program or activity units may include:
• Number of participants
• Number of tasks performed
• Number of consumable units
• Number of service calls
• Number of events


• Required time for offering program/service
Agencies use a Cost- of- Service Analysis to determine what financial resources are required to provide specific programs at specific levels of service. Results are used to determine and track cost recovery as well as to benchmark different programs provided by the agency between one another. Cost recovery goals are established once Cost- of- Service totals have been calculated. Program staff should be trained in the process of conducting a Cost- of- Service Analysis and the process should be undertaken on a regular basis.
1.5.1
Effective communication strategies require striking an appropriate balance between the content and the volume of messaging, while utilizing the “right” methods of delivery. MHPR utilizes many of the traditional delivery methods for promoting programs. However, it is imperative to continue updating the marketing strategy annually to provide information for community needs, demographics, and recreation trends. Successful strategies will help MHPR effectively share the impact it has on the community, enhance programming and partnerships, and ultimately build a stronger connection with current and future customers.
As MHPR looks to make future enhancements to the website and overall user experience, staff should consider implementing additional accessibility guidelines and new technology to improve usability. The overall user experience looks at several factors including accessibility, customer experience, and usability. MHPR should also regularly analyze website metrics that track user behavior and can identify areas for overall improvement.
In addition, as a part of overall updates to Title II of the Americans with Disabilities Act (“ADA”), the Department of Justice released updated regulations for all state and local government web and mobile content to meet Web Content Accessibility Guidelines (“WCAG”) Version 2.1, Levels A and AA. MHPR should work with City communications and legal representatives to understand full digital compliance requirements for content, design, programming, and procedural updates that are necessary.
• MHPR ’s website adheres to several Web Content Accessibility Guidelines, as outlined by digital.gov, to accommodate users of all abilities.
o The website offers multiple language options.
o The website adapts to different screen sizes.
o The website includes a personalization feature to customize accessibility needs for each user.
o Essential details about parks, facilities, programs, and events are presented in a clear and easy to understand format.
o A top navigational menu highlights key information that a user will likely be searching for when visiting the website.
o The website includes a search function at the top of the page.
o The homepage uses attractive and engaging visuals to engage users and their clear calls to action for online registration/reservations, job listings, and for upcoming events.
o There is an event calendar that is prominently displayed on the homepage.
o The park system map page has an interactive map of parks and facilities, including amenities and points of interest.
MHPR should continue to utilize website analytics to track user behavior and regularly identify other areas for improvement.
Additionally, to enhance the customer experience and streamline recreation program administration, MHPR should invest in improved software with automation features for repetitive tasks like program setup, pricing updates, and roster and waitlist management. Automation could also simplify communication with participants through customizable online forms, reminders, and confirmation emails. Using a single, integrated software platform is essential to avoid customer confusion and encourage program registration
However, while automation reduces administrative time, staff oversight remains necessary. Designating one staff member to manage and optimize MHPR’s software will help maximize the technology's potential, though additional staffing may be required to support these improvements.
Social media strategies play a critical role in telling the story of a recreation agency. The right content can increase program participation and overall community awareness of MHPR services. MHPR currently uses several platforms to promote programs and events, update the community on park planning efforts, and highlight staff and volunteer initiatives.
While this will be a challenge due to current staffing levels, MHPR should work with City staff and partners to continue a focus on high- quality photos and videos that highlight parks, facilities, programs, and their users. MHPR should consider online events and challenges, live videos , and partnerships with local influencers to drive more traffic to its social media channels. Additionally, maintaining a consistent posting schedule can ensure that fresh content is always being pushed out to the community. A periodic social media audit is

recommended to provide MHPR with a sound understanding on how social media impacts its programming. The audit can also show insights on how MHPR is engaging with their audiences and how effective the platforms are at raising awareness of recreation services.
There are several components and benefits to a social media audit that are highlighted below.
• Take inventory of the platforms that are in use and whether you need them by developing Key Performance Indicators.
• Define goals for each platform to ensure multiple platforms are not pushing out the same type of content.
• Ensure branding and messaging are consistent across all platforms.
• Understand how to use social media analytics to determine where your social media traffic is coming from. Google analytics is another tool to inform MHPR about website and social media users.
• Understand the demographics and preferences on content type of MHPR social media followers and tailor the messaging to the right audience.
• Identify the top performing social media posts and build on this success with future social media campaigns.
• Create a marketing plan aligned with MHPR goals and annually update marketing strategies to reflect community needs. Focus on high- quality word- of- mouth, social media, and website enhancements, using inclusive and accessible communication methods.
• Enhance the online user experience by streamlining navigation and automate tasks to enhance customer satisfaction and operational efficiency.
• Ensure consistent branding and messaging across all platforms, regularly assess unmet community needs, and educate staff on marketing principles to boost program participation and community engagement.
The best practice is to have a specific recreation marketing plan that is in line with MHPR goals and objectives in communications. A marketing plan must be built upon and integrated with supporting plans and directly coordinate with the organization vision and priorities. The plan should also provide specific guidance as to how MHPR ’s identity and brand is to be consistently portrayed across the multiple methods and deliverables used for communication. Below are the essential pieces to an effective marketing plan:
• Know the audience: Understand the community demographics and who MHPR is trying to reach along with their needs and interests and how they will best receive messaging. MHPR should also regularly assess the unmet needs or gaps in recreation services throughout the community.
• Define the goals that will drive specific marketing strategies: Some goals can include increasing program participation, boosting MHPR brand awareness, or improving community engagement for more informed decision making.
• Create the right message: Focus on the benefits and positive outcomes of the program. Emphasize the factors that make the program or service stand out from others in the community.
• Use the right tools and channels: Depending on the demographic s and area, some channels may not resonate with community members. For instance, traditional media can reach a wider audience, but it may not be the main source for MHPR ’s target market. Additionally, partnerships
Mendota Heights, MN Program Assessment
with other community organizations can help MHPR get messaging to the right audience by sharing resources. By ensuring the right method is used, MHPR will maximize resources for marketing and communications and see positive results with engagement.
• Monitor goals and strategies regularly: MHPR should build in methods to measure the impact of the marketing plan and specific strategies to ensure necessary adjustments can be made with communications.
Currently, the City of Mendota Heights has a part- time communications position that oversees City wide communications and most of the marketing for recreation programming falls on the limited parks and recreation staffing. Enhancing marketing efforts will be a challenge with minimal staff time to allocate to the responsibilities. Ideally, if recreation programs continue to grow, a full - time Communications or Community Engagement Manager should be considered for MHPR that could also oversee strategic partnerships and sponsorship opportunities in addition to marketing and promotions. However, there are some approaches that will help maximize staff time.
• Identify the programs that bring the most value or have the highest participation and prioritize marketing efforts for these.
• Automate social media posts with low cost content management platforms, such as Hootsuite.
• Use email marketing tools to automate regular program update emails to MHPR’s customer database.
• Collaborate with local civic organizations to share marketing resources such as print materials or distribution lists.
• Use online design tools that can create professional - looking marketing materials with minimal design experience and in a fraction of the time it would take a printing or design vendor.
• Use larger programs and events or popular public spaces as an opportunity to cross - promote programs and events.
Educating program staff on marketing principles can lead to increased awareness of services and overall participation, a stronger connection with the community, and enhanced program partnerships. Simply put, marketing training empowers program staff to tak e more ownership over their programs. This is a time and resource intensive activity and should be planned accordingly in staffing projections.
MHPR currently works with several partnering agencies, organizations, and corporations throughout the community. Current partnerships with School District 197, West Saint Paul, and Dakota County support facilitation of programs and sponsorships of community events. However, growing population and programming within West Saint Paul will likely negatively impact MHPR’s future partnership for indoor recreation space.
Tracking partnerships can demonstrate MHPR ’s ability to leverage resources within the community. In many instances, partnerships can be inequitable to a public agency and do not produce reasonable shared benefits between parties. It is not suggested that MHPR ’s existing partnerships are inequitable; rather, in general many parks and recreation agencies’ partnerships tend to be one - sided.
The following recommended policies will promote fairness and equity within existing and future partnerships while helping staff to manage potential internal and external conflicts. Partnership principles for existing and future partnerships will maximize their effectiveness. These partnership principles are as follows:


• All partnerships require a working agreement with measurable outcomes and will be evaluated on a regular basis. This should include reports to MHPR on the performance and outcomes of the partnership including an annual review to determine renewal potential.
• All partnerships should track costs associated with the partnership investment to demonstrate the shared level of equity.
• All partnerships should maintain a culture that focuses on collaborative planning on a regular basis, regular communications, and annual reporting on performance and outcomes to determine renewal potential and opportunities to strengthen the partnership.
Additional partnerships can be pursued and developed with other public entities such as neighboring towns/cities, colleges, state or federal agencies, non- for- profit organizations, as well as with private or forprofit organizations. There are recommended standard policies and practices that will apply to any partnership, and those that are unique to relationships with private, for- profit entities.
Today’s realities require most public parks and recreation departments to seek productive and meaningful partnerships with both community organizations and individuals to deliver quality and seamless services to their residents. These relationships should be mutually beneficial to each party to better meet the overall community needs and expand the positive impact of MHPR ’s mission. Effective partnerships and meaningful volunteerism are key strategy areas for MHPR to meet the needs of the community in the years to come.
The City of Mendota Heights' Volunteer Policy provides a comprehensive framework for managing volunteers. It includes guidelines on the purpose, scope, and definition of volunteers, categorizing them into adult and junior volunteers. The policy also outlines volunteer management procedures, including recruitment, conflict of interest, record- keeping, and criminal background checks. Additionally, the policy emphasizes volunteer support, recognition, and maintaining a respectful work environment.
The City’s Administrative Support Assistant serves as a part- time volunteer c oordinator and oversees several types of volunteers related to parks and recreation responsibilities including event management, invasive species removal, general park clean- up, and tree planting efforts. Each volunteer position comes with a service description that outlines the skills desired, responsibilities, and outcome or learning opportunities.
To strengthen volunteer and partnership efforts, Mendota Heights Parks and Recreation should implement the best practices outlined in the following section and begin consistently tracking volunteer metrics such as the number of individuals engaged and tota l hours donated annually. Additionally, the department should establish measurable outcomes for each partnership and monitor these metrics on an annual basis.
The program assessment for MHPR identifies strengths such as high public participation and current diversity of programming. However, there is a ceiling for program expansion with the current staffing structure and indoor space allocated to MHPR Also, the absence of a pricing strategy will impact program management, expansion, and financial planning. Key action points include strengthening partnerships, optimizing staffing and space usage, developing a comprehensive pricing strategy to generate more earned income that can offset expenses for enhancing program offerings, and improving financial planning to sustain and enhance the department's services for residents and visitors.
To enhance MHPR 's recreation programs and services for in- house and third- party operated programs , staff should establish and adhere to comprehensive program standards to ensure consistent service delivery. This includes quality assurance measures for planning, implementation, and evaluation, with a focus on staff training, program space conditions, a nd risk management.
• Customer service standards must address the entire participant experience, from registration to postprogram evaluation, emphasizing consistent communication and experience enhancement.
• Performance measures, such as participation numbers and satisfaction surveys, should be tracked to inform data - driven decisions and improve program impact. Monitoring program cancellation rates can reveal areas for improvement in design and execution.
• Regular quality assurance observations of contracted programs will ensure alignment with MHPR 's standards and expectations. To ensure consistent and high- quality service delivery, MHPR should establish and monitor program standards, focusing on staff training, program space conditions, and risk management.
• A consistent analysis of community demographics should guide program and marketing strategies, with attention to demographic shifts such as the increasing opportunities for those in the 55+ age group.
• Introducing premium programs to leverage high household incomes and tracking program lifecycles annually will ensure a balanced and innovative program mix.
• Conducting a classification of services analysis will align programs with organizational goals and funding strategies.
• MHPR should also adopt a Program Development and Resource Guide for systematic program planning, leveraging tools like the MacMillan Matrix to avoid duplicating services.
• Lastly, e nhancing the Department’s capa city with the City through clear policies, efficient management, optimal resource use, advanced technology, and strong communication strategies is crucial. Staff planning, efficient space use, community partnerships, and technology adoption will further bolster program delivery and community engagement.
Additionally, to optimize pricing strategies and achieve cost recovery goals, MHPR should consider various strategies to balance competitive pricing with equitable access for core programs. Implementing a Cost- ofService Analysis for accurate pricing decisions and setting cost recovery targets is crucial. F ostering equitable partnerships and enhancing volunteer policies will strengthen community relationships and resource utilization.
By implementing these action points, MHPR can foster a culture of continuous improvement, align staff efforts with strategic priorities, and ultimately enhance the quality of program offerings for the community.

In developing a volunteer policy, some best practices that MHPR should be aware of include:
• Involve volunteers in cross - training to expose them to various organizational functions and increase their skill. This can also increase their utility, allowing for more flexibility in making work assignments, and can increase their appreciation and unders tanding of MHPR
• Ensure the Volunteer Coordinator (a designated program staff member with volunteer management responsibility) and associated staff stay fully informed about the strategic direction of MHPR overall, including strategic initiatives for all divisions. Periodically identify, evaluate, or revise specific tactics the volunteer services program should undertake to support the larger organizational mission.
• A key part of maintaining the desirability of volunteerism is developing a good reward and recognition system. The consultant team recommends using tactics like those found in frequent flier programs, wherein volunteers can use their volunteer hours to obtain early registration at programs, or discounted pricing at certain programs, rentals or events, or any other department function. Identify and summarize volunteer recognition policies in a Volunteer Policy document.
• Regularly update volunteer position descriptions. Include an overview of the volunteer position lifecycle in the Volunteer Manual, including the procedure for creating a new position.
• Add end- of- lifecycle process steps to the Volunteer Manual to ensure that there is formal documentation of resignation or termination of volunteers. Also include ways to monitor and track reasons for resignation/termination and perform exit interviews with outgoing volunteers when able.
• In addition to the number of volunteers and volunteer hours, categorization and tracking volunteerism by type and extent of work, is important:
o Regular volunteers: Those volunteers whose work is continuous, provided their work performance is satisfactory and there is a continuing need for their services.
o Special event volunteers: Volunteers who help with a particular event with no expectation that they will return after the event is complete.
o Episodic volunteers: Volunteers who help with a particular project type on a recurring or irregular basis with no expectation that they will return for other duties.
o Volunteer interns: Volunteers who have committed to work for MHPR to fulfill a specific higher- level educational learning requirement.
o Community service volunteers: Volunteers who are volunteering over a specified period to fulfill a community service requirement.
MHPR should encourage employees to volunteer in the community. Exposure of staff to the community in different roles (including those not related to parks and recreation) will raise awareness of the agency and its volunteer program. It also helps staff understand the role and expectations of a volunteer if they can experience it for themselves.
The recommended policies and practices for public/private partnerships that may include businesses, private groups, private associations, or individuals who desire to make a profit from use of MHPR ’s facilities or programs are detailed below. These can also apply to partnerships where a private party wishes to develop a facility on park property, to provide a service on publicly owned property, or who has a contract with MHPR to
provide a task or service on MHPR ’s behalf at public facilities. These unique partnership principles are as follows:
• Upon entering into an agreement with a private business, group, association or individual, MHPR staff and political leadership must recognize that they must allow the private entity to meet their financial objectives within reasonable parameters that protect the mission, goals and integrity of MHPR .
• As an outcome of the partnership, MHPR must receive a designated fee that may include a percentage of gross revenue dollars less sales tax on a regular basis, as outlined in the contract agreement.
• The working agreement of the partnership must establish a set of measurable outcomes to be achieved, as well as the tracking method of how those outcomes will be monitored by MHPR . The outcomes will include standards of quality, financial reports, customer satisfaction, payments to MHPR , and overall coordination with MHPR for the services rendered.
• Depending on the level of investment made by the private contractor, the partnership agreement can be limited to months, a year or multiple years.
• If applicable, the private contractor will provide a working management plan annually that they will follow to ensure the outcomes desired by MHPR . The management plan can and will be negotiated, if necessary. Monitoring the management plan will be the responsibility of both partners. MHPR must allow the contractor to operate freely in their best interest, if the outcomes are achieved, and the terms of the partnership agreement are adhered to.
• The private contractor cannot lobby MHPR advisory or governing boards for renewal of a contract. Any such action will be cause for termination. All negotiations must be with MHPR Director or their designee.
• MHPR has the right to advertise for private contracted partnership services or negotiate on an individual basis with a bid process based on the professional level of the service to be provided.
• If conflicts arise between both partners, the highest- ranking officers from both sides will try to resolve the issue before going to each partner’s legal counsel . If none can be achieved, the partnership shall be dissolved.
MHPR currently has a strong network of recreation program partners. Therefore, the following recommendations are both an overview of existing partnership opportunities available to MHPR , as well as a suggested approach to organizing partnership pursuits. This is not an exhaustive list of all potential partnerships that can be developed, but this list can be used as a reference tool for MHPR to develop its own priorities in partnership development. The following five areas of focus are recommended:
1. Operational Partners: Other entities and organizations that can support the efforts of MHPR to maintain facilities and assets, promote amenities and park usage, support site needs, provide programs and events, and/or maintain the integrity of natural/cultural resources through in- kind labor, equipment, or materials.
2. Vendor Partners: Service providers and/or contractors that can gain brand association and notoriety as a preferred vendor or supporter of MHPR in exchange for reduced rates, services, or some other agreed upon benefit.
3. Service Partners: Nonprofit organizations and/or friends’ groups that support the efforts of MHPR to provide programs and events, and/or serve specific constituents in the community collaboratively.

4. Co- Branding Partners: Private, for- profit organizations that can gain brand association and notoriety as a supporter of MHPR in exchange for sponsorship or co- branded programs, events, marketing and promotional campaigns, and/or advertising opportunities.
5. Resource Development Partners: A private, nonprofit organization with the primary purpose to leverage private sector resources, grants, other public funding opportunities, and resources from individuals and groups within the community to support the goals and objectives of MHPR on mutually agreed strategic initiatives.
All partnerships developed and maintained by MHPR should adhere to common policy requirements. These include:
• Each partner will meet with or report to MHPR staff on a regular basis to plan and share activity- based costs and equity invested.
• Partners will establish measurable outcomes and work through key issues to focus on for the coming year to meet the desired outcomes.
• Each partner will focus on meeting a balance of equity agreed to and track investment costs accordingly.
• Measurable outcomes will be reviewed quarterly and shared with each partner, with adjustments made as needed.
• A working partnership agreement will be developed and monitored together on a quarterly or asneeded basis.
• Each partner will assign a liaison to serve each partnership agency for communication and planning purposes.


As a key element of the Master Plan, available information was reviewed to assess the financial situation of Mendota Heights Parks and Recreation(“MHPR”) The revenues and expenditures were analyzed to identify trends and assess MHPR’s financial integrity. The cost recovery at major functional levels has also been analyzed to assess the adequacy of revenues to cover continuing operations
The detailed cost and activity information prepared by MHPR’s staff was reviewed as part of this analysis Financial reports for fiscal years 2019 through 2024 were analyzed to assess the financial situation of the Department
A summary of the cost recovery for each of the respective operating funds is provided in Figure 1. MHPR has demonstrated an adequate cost recovery rate for most of the years in the study period Recreation operations show a drop in cost recovery for the last two years due to more free events being offered.
The revenue and expenditure amounts, and cost recovery percentages for park operations are illustrated below in Figure 2. Cost recovery percentages are low at 1% and 2% while industry standards are approximately 22%. Park operations are not anticipated to recover the full cost of operations


Over / (Under)


The park revenue and expenditure details are shown in Figure 3. Park expenditures increased at a rate greater than the revenues.


3 – Park Revenues and Expenditures


The distribution of park expenditures are shown in Figure 4 The distribution of expenditures has been consistent over the study period, indicating the cost increases are primarily the result of inflation.


4 – Park Expenditures


The revenues and expenditures for recreation operations are illustrated below in Figure 5. Recreation cost recovery dropped in the last two years below the anticipated cost recovery of similar entities.


5 – Recreation Operations


Recreation revenue and expenditure details are shown in Figure 6. Recreation expenditures have increased significantly over the study period. The revenues have not recovered from the drop during COVID.


The revenues and operating expenditures without Capital Outlay for golf operations are illustrated below in Figure 7. Golf operations recovered most of the cost of operations in the last four years. Golf operations recovered over 101% of the operating expenditures for the actual years of operations. The 2024 budget is projected to recover 96% of operating expenditures.


Over / (Under)


The golf revenue and expenditure with capital outlay details are shown in Figure 8 Golf revenues have increased at a rate greater than the expenditures, improving the cost recovery. The total cost recovery with Capital Outlay has improved 37% over the study period.


Expenditures


Revenues Over / (Under) Operating Expenditures


The distribution of golf expenditures is shown in Figure 9. Distribution of expenditures has been consistent over the last years of study period indicating the cost increases are primarily the result of inflation

MHPR’s investment per round of Golf is shown in Figure 10.
Revenues Over / (Under) Expenditures
$6.60
Figure 10 – Investment Per Round of Golf
The Special Park Fund continues to provide necessary investments to MHPR’s facilities and infrastructure as shown in Figure 11.

The capital funds provided to MHPR from budgeted funds and the Special Park Fund are shown in Figure 12.
Figure 11 – Special Park Fund Capital Expenditures $ $ $ $ $ $ $ $ $ $ $ $ ($54,951)
Figure 12 –Capital Expenditures from All Funds

The Mendota Heights Financial Analysis focuses on best practices as provided by the National Recreation and Park Association (“NRPA”) Performance Review information for the 2024 year. In the report under the financial segment, it provides financial benchmarks including the following:
• The Park Operational 2024 Budget is $1,202,146 and per capita spending is $103.96. This makes up 91% of the total operational budget for park services. According to the National Recreation and Parks A ssociation, typical parks operational budgets usually make up about 46% of the total operational budget for parks and recreation agencies in similar size communities One of the key challenges in Mendota Heights is that the recreation budget accounts for only 8.5% of the City’s overall operational budget, compared to a national average of approximately 41%.In terms of spending Mendota Heights is spending dollars in the Middle Quartile of the NRPA Performance Review standards for similar size systems. Balancing the budget between parks and recreation would achieve a stronger overall impact to the community of park and recreation services. This would also activate more park spaces with more programs targeted to people of all ages. Ideally the parks and recreation budget should be combined into one budget document to track the true impact of money that is spent by the city for parks and recreation purposes
• Based on the NRPA per capita basis for populations under 20,000 people, Mendota Heights is spending below the Upper Quartile Standard on a per capita basis at $169.43, which includes both the parks and recreation budget NRPA Best Practices for similar size cities is $229.61 per capita
• To determine the amount of funds to use for capital spending , most best practice agencies calculate 5% of the total asset value of the parks system then deduct the land value to arrive at the amount they spend to maintain what they already own.
• The Golf 2024 Budget is $287,327 and $24.85 per capita for golf operations Typically golf operations cover 100% of the operating budget from green fees and related golf revenues. The current per capita subsidy for Golf operations is $1.89 per capita. The golf course has a very small clubhouse and no practice facilities for golfers to use Adding a golf simulator to the clubhouse would open the opportunity for youth and adults to practice year-round as well as offer lessons and grow the game for youth and adults in the City and generate significant amounts of revenue. In the winter, the golf course is not utilized to generate revenue, rather as a community gathering space.
• The average capital spending for Parks and Recreation in Mendota Heights per year is $202,355. The NRPA Performance Report for similar size cities indicates capital spending is normally at $823,757 on capital expenditures per year.
• The total budget is $1,314,946 which is 10.66% of the total city budget of $12,331,671. Normally Park and Recreation Services make up between 7 and 10% of the city budget. Mendota Heights’ budget is in the appropriate range of funding, but it is not balanced by the three core functions of park maintenance, recreation services and administration.
• Typical staffing of FTE for parks and recreation is 20.1 people for communities under 20,000 residents in the Upper Quartile and in Mendota Heights the FTE number is 7.3 with a newly hired employee in March. Balancing out recreation program staff with additional administrative staff will bring a much higher level of use to the park system and create more operational revenue through program fees and charges.

• Mendota Heights has 25.39 park acres per 1,000 residents. This is higher than 21.1 acres for Upper Quartile cities in the United States.
• A city the size of Mendota Heights typically has 2.0 square feet of indoor recreation space per population served. This ratio would require Mendota Heights to have 23,400 square feet of indoor programable space. The City has currently has 2,506 square feet for programmable space.
• Earned income revenues for communities the size of Mendota Heights typically contribute to 24.6% of their operational budget. In 2023, MHPR generated approximately 21.3% of their total budget from earned income which equates to $360,066. The lower percentage is likely, in part, due to MHPR’s limited space that is dedicated to indoor and outdoor programming
MHPR should develop other funding options to support the efforts to build a park and recreation system that is balanced and responsive to citizens’ needs. Incorporating a pricing policy, earned income policy and partnership policy to manage the system forward will all help the department to manage in a best-practice mode of operation. This follows the summary data outlined at the start of this document on - Financing the System Forward. It is important for MHPR to meet the expectations of the community while creating consistency across the system as it applies to access and priority of use. These policies will allow for less entitlement of special interest groups who use city facilities and services and provide greater fairness for the City to control the facilities the taxpayers are funding for everyone
Public recreation faces a constant challenge securing reliable funding for projects, programs, daily operations, and ongoing maintenance. While traditional funding sources exist, they can be subject to change. To ensure a sustainable future, it is crucial to diversify funding streams and actively seek new opportunities.
Developing a dynamic funding strategy is key. This strategy should consider different levels, from overall departmental needs to specific facilities and core programs. While the process of identifying and securing new funding can be time- consuming, the long-term benefits are significant. Additional and non-traditional sources can provide a critical boost for ongoing operational costs. These funding options are used by similar size park and recreation systems in Minnesota. All will help to supplement what the city is investing now in the park and recreation system.
MHPR should position its fees and charges to be market- driven and based on surrounding public, private, and non-profit facilities. The potential outcome of revenue generation is consistent with national trends relating to public park and recreation sports facilities, which can generate a majority of all the operating expenditures. Fees include admissions, memberships, programs, rentals, field usage and other similar sources.
Implications for MHPR: This approach could cover a substantial portion of operating costs for specific valueadded services. MHPR will need to ensure inclusive access for low-income visitors, and this can be done

through an enhanced scholarship or financial aid program. Also, MHPR should take a policy- driven approach to establishing user fees that will provide staff and City officials with a basis for how fees are established, and which groups should receive discounted rates. The policy should also determine the required cost recovery levels for various services, as suggested in the plan’s program assessment. Lastly, non-resident rates should be included in future pricing policy discussions for certain types of programs.
Reservations and Permits
This revenue source comes from the right to reserve specific public spaces or property for a set amount of time. The reservation rates are usually set and apply to multipurpose rooms for various gatherings, hardcourts, sports fields, and other types of facilities for special activities.
Implications for MHPR: Charging for space reservations (e.g., sports fields, multi-purpose rooms) creates a dedicated revenue stream while managing usage efficiently. Clear policies and competitive pricing will be essential to balance revenue goals with public accessibility. MHPR should take the same market and policy driven approach to reservations as suggested for fees and charges including non-resident rates.
This revenue-funding source allows corporations to invest in the development or enhancement of new spaces or renovation of existing amenities/facilities in park systems. Sponsorships are also universally used for programs and events.
Implications for MHPR: MHPR is currently implementing this strategy for recreation programs and events. Sponsorships can also provide significant funding for capital improvements and larger amounts could be overseen and managed by the Mendota Heights Community Foundation or a future Park Foundation
However, care must be taken to align sponsors with the MHPR mission and values to avoid a negative perception from the public. A sponsorship agreement should be created for each opportunity that protects all parties involved and clearly outlines terms. Sponsorships and advertising can be structured with strict graphic standards that reinforce the brand of the community.
Foundations/Gifts
Traditionally, these dollars are raised from tax- exempt, non-profit organizations established with private donations in promotion of specific causes, activities, or issues. They offer a variety of means to fund capital projects, including capital campaigns, gift catalogs, fundraisers, endowments, sales of items, etc. This funding source can be used for operations and capital costs.
Implications for MHPR: Partnering with foundations can provide grants or endowments for operations and capital costs. This funding source is versatile but requires strong grant writing and fundraising efforts. MHPR should continue to strengthen its relationship with the Mendota Heights Community Foundation to ensure future success. The Community Foundation could be an option to manage gifts and large-scale donations as well as take the lead role in planning future special fundraisers.

Partnerships are joint development funding sources or operational funding sources between two separate agencies, such as two government entities, a non-profit and a governmental entity, or a private business and a governmental entity. Two partners jointly develop revenue producing park and recreation facilities and share risk, operational costs, responsibilities, and asset management, based on the strengths and weaknesses of each partner.
Implications for MHPR: A partnership could co - develop facilities and amenities such as a pickleball facility, play areas, or other rental facility upgrades, enhancing amenities without straining park resources and generating revenue for reinvestment back into the park system Partnerships should be regularly evaluated to ensure that they align with the MHPR mission and priorities. Partnership agreements should be specific to private, public and non-profit organizations. The funding source could be used for either operations or capital development. The goal is to make partnerships as equitable as possible and not create a sense of entitlement. Agreement terms should focus on meeting the outcomes desired by both partners.
Private Donations may also be received in the form of funds, land, facilities, recreation equipment, art, or inkind services. Donations from local and regional businesses as sponsors for tournaments, events or spaces should be pursued.
Implications for MHPR: Donations from individuals or businesses can provide financial or in-kind support for events or specific projects. Regular communication with donors is critical to maintaining these relationships and ensuring long-term support. MHPR is currently working to establish a policy for receiving donations and currently implements a Memorial Bench Program.
The revenue source is an indirect revenue source in that people donate time to assist the organization in providing a product or service on an hourly basis. This reduces the organization’s cost in providing the service plus it builds advocacy into the system. According to independentsector.org the value of a volunteer hour is worth $33.49. This monetary value can be used for matching money for some state and federal grants.
Implications for MHPR: Volunteer efforts reduce costs and build community support. The City of Mendota Heights' Volunteer Policy provides a comprehensive framework for managing volunteers. The policy outlines volunteer management procedures and emphasizes volunteer support, recognition, and maintaining a respectful work environment.
The City’s Administrative Support Assistant serves as a part-time volunteer coordinator and oversees several types of volunteers related to parks and recreation responsibilities. This includes event management, invasive species removal, general park clean-up, and tree planting efforts. The program assessment outlines some other best practices with volunteer management that MHPR can consider for enhancing its engagement with future volunteers.

An Irrevocable Remainder Trust allows a donor to place assets (e.g., cash, stocks, real estate) in a trust that generates income for the donor or designated beneficiaries during their lifetime or a specified term. After the income period ends, the remaining trust assets (the "remainder") are donated to a charitable organization, such as a city’s parks department or a nonprofit supporting local parks and natural resources.
Implications for MHPR: This strategy can come in the form of land conservation, a park endowment for park maintenance and programming, or enhancements and expansion for park properties and a trail system.
Advertising Sales
This revenue source is for the sale of tasteful and appropriate advertising on park and recreation related items such as print materials, on scoreboards, dasher boards and other visible products or services that are consumable or permanent and expose the product or service to many people.
Implications for MHPR: Tasteful advertising on signage or within events and programs can provide a steady revenue stream without detracting from the park's aesthetic. This must be carefully managed to ensure public approval and brand alignment.
Catering Permits and Services
This is a license to allow caterers to work in the parks and recreation system on a permit basis with a set fee or a percentage of food sales returning to MHPR
Implications for MHPR: Allowing caterers to operate in the parks under permit agreements provides revenue from events while supporting local businesses. This is particularly valuable for weddings or corporate events at pavilions or future facilities.
This funding source is from retail sales or rentals of soft goods, hard goods, or consumable items. There may be opportunities where MHPR could either contract for the service and receive a set amount of the gross percentage or the full revenue dollars that incorporates a profit after expenses.
Implications for MHPR: Concession sales, such as food, beverages, or equipment rentals, provide an opportunity for profit sharing or direct revenue. Contracting out services ensures consistent offerings without increasing park staff workload.
Contractual relationships entered between two or more local units of government and/or between a local unit of government and a non-profit organization for the joint usage/development of sports fields, regional parks, or other facilities.
Implications for MHPR: These agreements could support funding, resource sharing, environmental conservation, recreational programming, and community engagement. The City of Mendota Heights could

further establish an agreement with the City of West Saint Paul or other adjacent communities to jointly maintain and develop a regional trail system. An agreement with Dakota County could help MHPR leverage resources for conservation efforts, park maintenance, and help apply for large-scale park grants. Lastly, an agreement with surrounding Dakota County libraries and School District 197 could help enhance programming while limiting the strain on current staffing levels and facilities.
This includes options where developers / agencies lease space from municipal- owned land through a subordinate lease that pays out a set amount plus a percentage of gross dollars for recreation enhancements. These could include recreation centers and ice arenas.
Implications for MHPR: Leasing land or facilities to private operators could generate revenue for specific enhancements. This reduces operational costs for the City while ensuring facility use. Leases can often require oversight of private operators.
Many municipalities have turned to selling the naming rights for new buildings or renovation of existing buildings and parks for the development cost associated with the improvement.
Implications for MHPR: Selling naming rights for new or renovated amenities could fund significant capital costs. The naming rights value is determined by impression points of the specific business or organization in a given period, such as a year.
Some private soft drink companies execute agreements with organizations for exclusive pouring rights within their facilities. A portion of the gross sales goes back to the organization. This comes from vending machines and soft drink serve stations.
Implications for MHPR: Exclusive agreements with beverage companies could bring in consistent revenue from vending machines and concessions. This strategy is most viable for high-traffic facilities or events.
Grants can be an essential funding source as part of a greater overall funding strategy for capital projects and some for specific services. For most, grants are seen as an opportunity for free money, increased credibility of fiscal stewardship, increased access to valuable data, and the ability to point to past grants awarded in future applications.
Platforms such as Grant Gopher and Instrumentl® provide databases that can be searched for national, regional, and state specific grants for parks and recreation. It is also suggested that MHPR regularly track organizations such as the National Recreation and Parks Association, Minnesota Department of Natural Resources, and Minnesota Recreation and Parks Association for funding opportunities for park projects and recreation programming.

It is important for MHPR to understand each grant’s requirements. In many instances, agencies look at the pros and cons of each individual grant to understand the cost-benefit ratio. Consider the following to determine MHPR’s potential level of success:
• What is the overall time commitment expected from staff for grant administration, reporting, and implementation?
• What is the level of competition?
• How well does the MHPR project or service meet the application requirements?
• Is there an opportunity to renew the grant or will MHPR fund the project for the long-term?
• What are the reporting requirements and length of time given for the overall project?
MHPR has had past success in obtaining grants, most recently from the Minnesota Department of Natural Resources and the United States Tennis Association (USTA). Below are brief descriptions of some impactful grant opportunities.
Provides matching grants to local governments for up to 50% of the cost of acquiring, developing, or redeveloping local parks and recreation areas. Eligible projects include playgrounds, picnic shelters, trails, and athletic facilities. The maximum grant award is $350,000.
Offers grants up to $500,000 to local governments for acquiring natural and scenic land to protect and develop for public use. Aims to preserve significant natural landscapes and provide outdoor recreational opportunities.
Provides grants ranging from $5,000 to $250,000 to local units of government for the acquisition or development of short trail connections between where people live and desirable locations. A 25% match is required. Priority is given to projects that provide significant connectivity.
Offers grants ranging from $5,000 to $250,000 for the development of trails that are of regional or statewide significance. A 25% cash match is required.
Awards grants between $2,500 and $200,000 for maintenance/restoration of recreational trails; development or rehabilitation of recreational trail linkages or trailhead facilities; environmental awareness and safety education programs; and redesign or relocation of trails to benefit the environment. A 25% cash or in-kind match is required.
Funds conservation projects that restore, enhance, or protect forests, wetlands, prairies, and habitat for fish, game, and wildlife in Minnesota. Non- competitive grants from $5,000 to $50,000 with a 10% non-state match requirement are available to local, regional, state, and national nonprofit organizations, including government entities.

Aims to support and increase efforts to expand programming that connects youth to the outdoors. Grants are provided for outdoor environmental, ecological, and other natural resource based education and recreation programs serving youth.
Active Transportation and Safe Routes to School Infrastructure Grants
Programs administered by the Minnesota Department of Transportation State Aid for Local Transportation, these grants provide funding for eligible bicycle and pedestrian improvements.
Cities in Minnesota with sufficient retail businesses can implement a local option sales tax to fund specific capital projects, such as parks, trails, and recreational facilities. Minnesota State Statute 297A.99: Subd. 1a. states that local sales taxes are to be used instead of traditional local revenues only for construction and rehabilitation of capital projects when a clear regional benefit beyond the taxing jurisdiction can be demonstrated. Mendota Heights has a moderate number of retail businesses, and this source would need to evaluated thoroughly before pursuing.
Implications for Mendota Heights: This source requires legislative approval and a voter referendum. It could provide a continuous revenue stream for park infrastructure projects.
The city can dedicate a portion of its property tax revenue to fund parks and natural resources, either through the general levy or a special parks levy.
Implications for Mendota Heights: An appropriate level of property taxes provide a reliable and recurring source of funding. Public approval will be required if structured as a special levy. This would require careful justification and transparency.
Park Dedication Fees are governed by state law, specifically Minnesota Statutes § 462.358, Subdivision 2b. These fees are designed to ensure that as new development occurs, there are adequate parks, open spaces, and recreational facilities to serve the growing population.
Implications for Mendota Heights: The City currently implements this strategy; however, the City is almost fully developed and future use will be limited.
According to Minnesota Statutes 428A.01-428A.101, a city can create an SSD where property owners in a defined area agree to additional property taxes to fund specific services or improvements, such as park enhancements.
Implications for Mendota Heights: Special Service Districts could provide targeted funding for specific parks or natural areas; however, it requires property owner consent.

This strategy provides tax incentives or abatements for landowners who place their property under conservation easements.
Implications for Mendota Heights: Encourages preservation of natural areas without an upfront city expenditure. Conservation easements require collaboration with landowners and conservation organizations.
Local Hotel/Motel Tax
Cities can impose a lodging tax, with revenues used to promote local tourism, including improvements to parks and trails.
Implications for Mendota Heights: This strategy supports parks and recreation as part of tourism promotion and has a minimal impact on residents as the tax is paid by visitors. The revenue potential depends on the City’s lodging market size.