Advanced Microscopy Tools for Drug Discovery: Methods to Examine Cell Morphology and Function in CNS Disease Models
Neurodegenerative disorders remain a global health challenge, requiring sophisticated methodologies for in depth investigation Developments in complex in-vitro, iPSC-derived CNS models together with advanced microscopy tools will improve our understanding of disease mechanisms facilitating the development of new medicines with better translation to the clinic Here, we utilize different approaches to examine aspects of cell phenotype known to be affected in neurodegenerative disorders, using iPSC-derived cells such as neurons and microglia
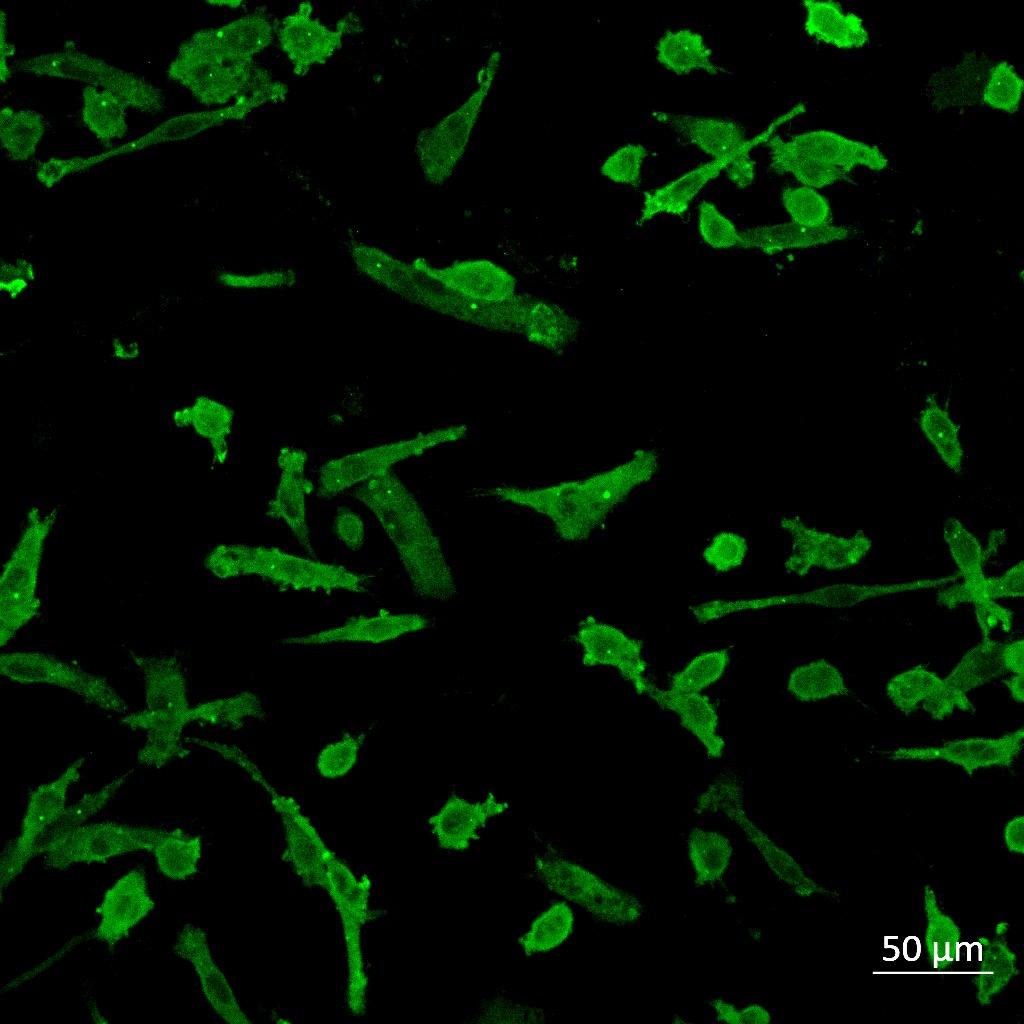
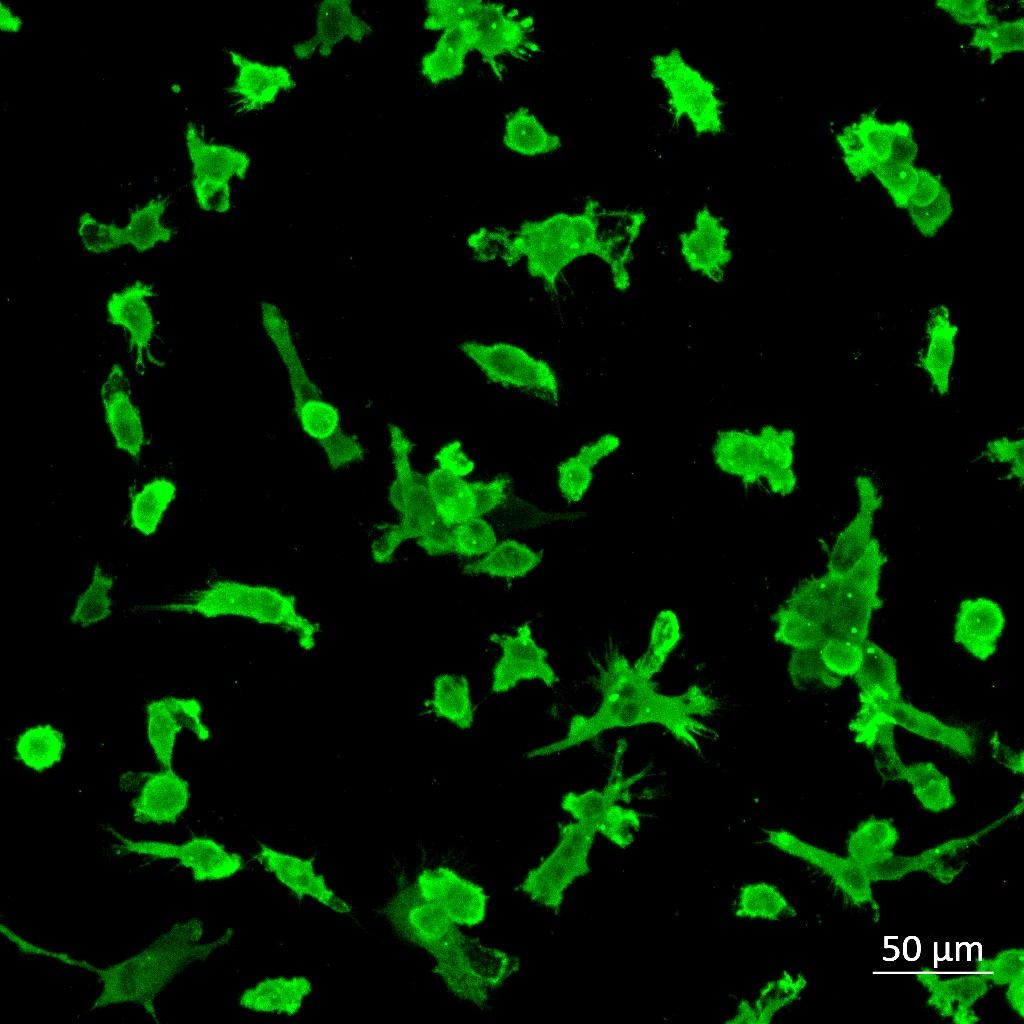
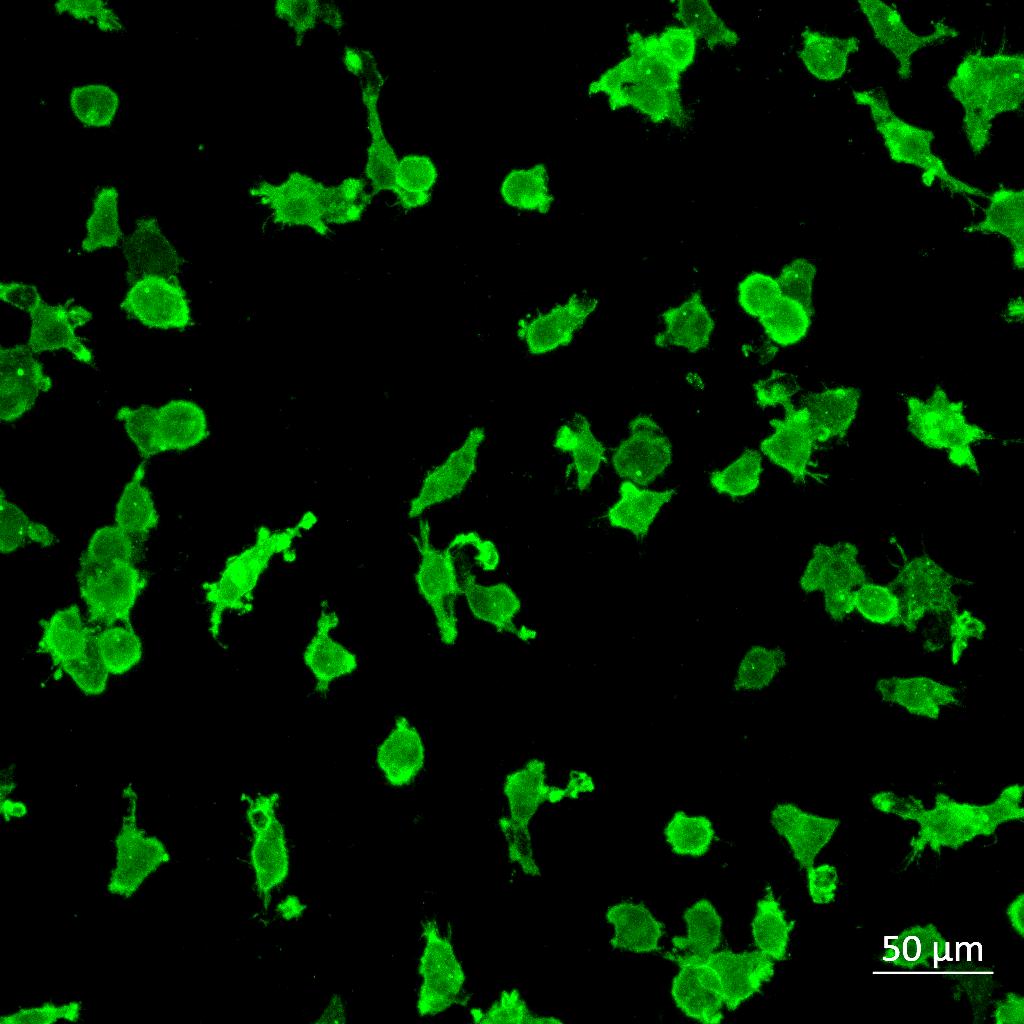
Morphological and Functional Analysis of Microglial Activation
Microglia grow in monoculture and stimulated with activation/inflammation stimuli are analysed using different methods
iPSC
Results
Tools to Examine Inflammasome Activation
• Our inflammasome reporter shows a strong ASC specks counts together with caspase 1 activation following LPS + Nigericin stimulation This increase was blocked by the NLRP3 inflammasome inhibitor, MCC950


– Untreated Monoculture – LPS Monoculture – β-amyloid
β3-Tubulin (Neurons)
GFAP (Astrocytes)
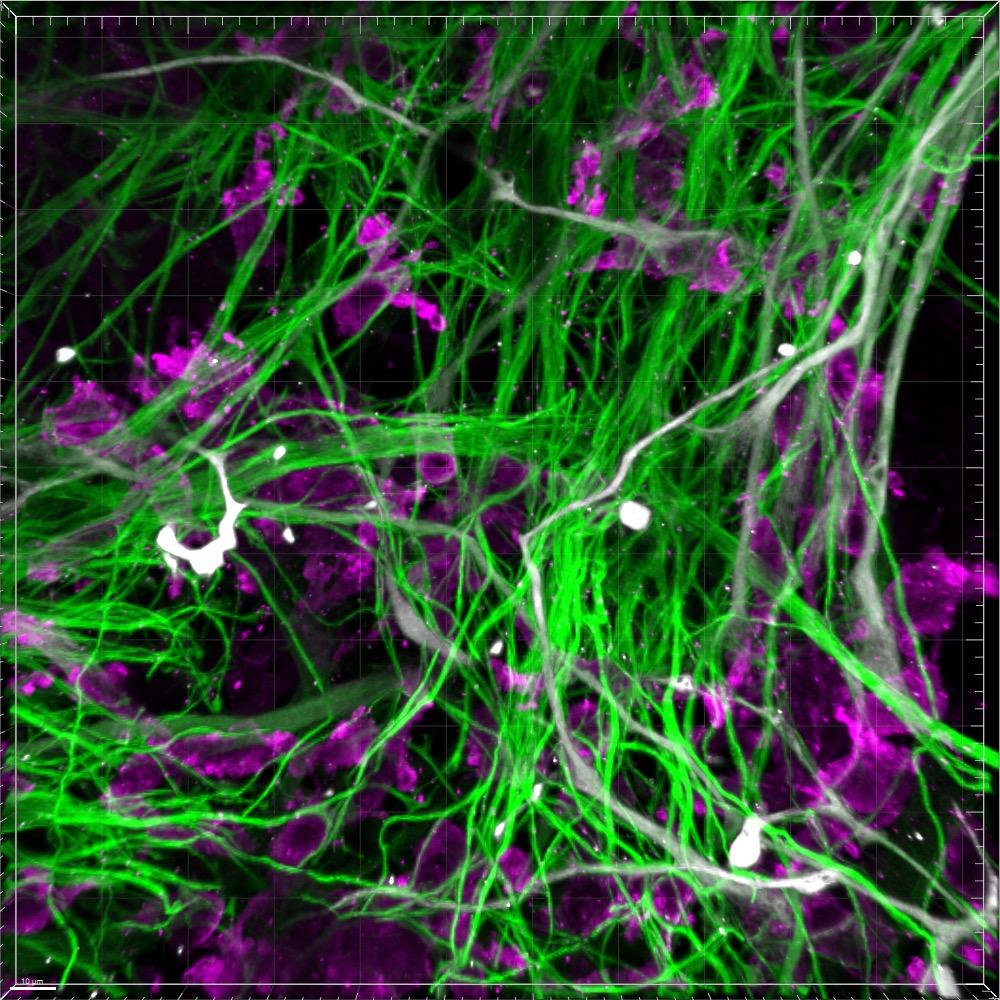
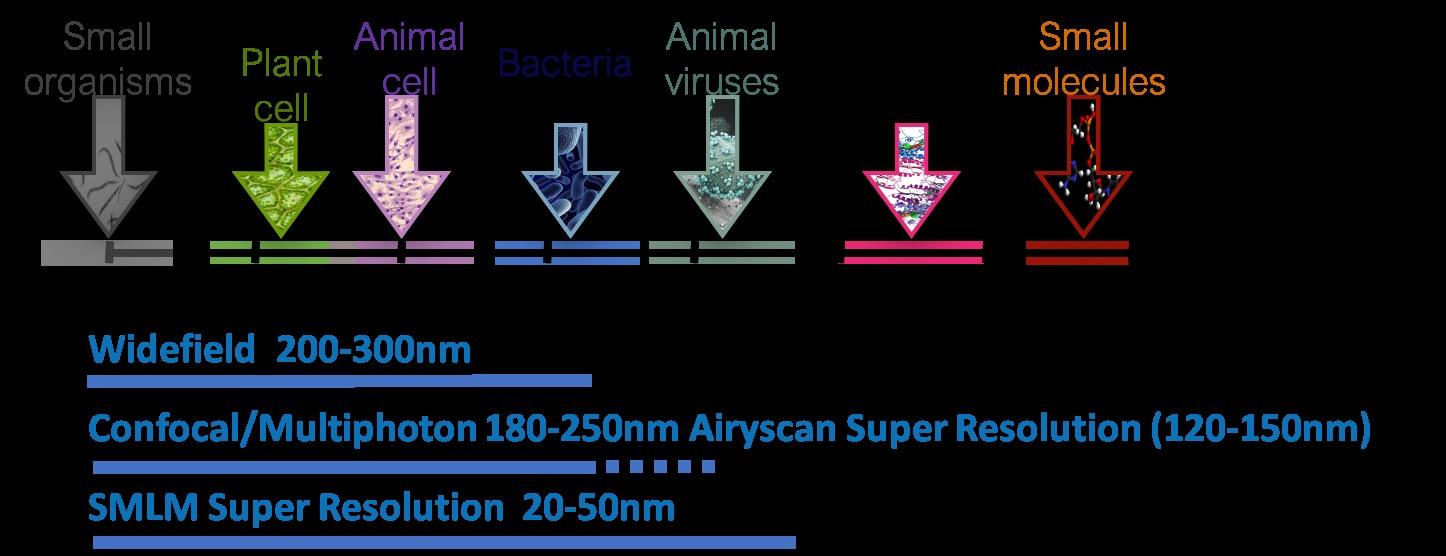
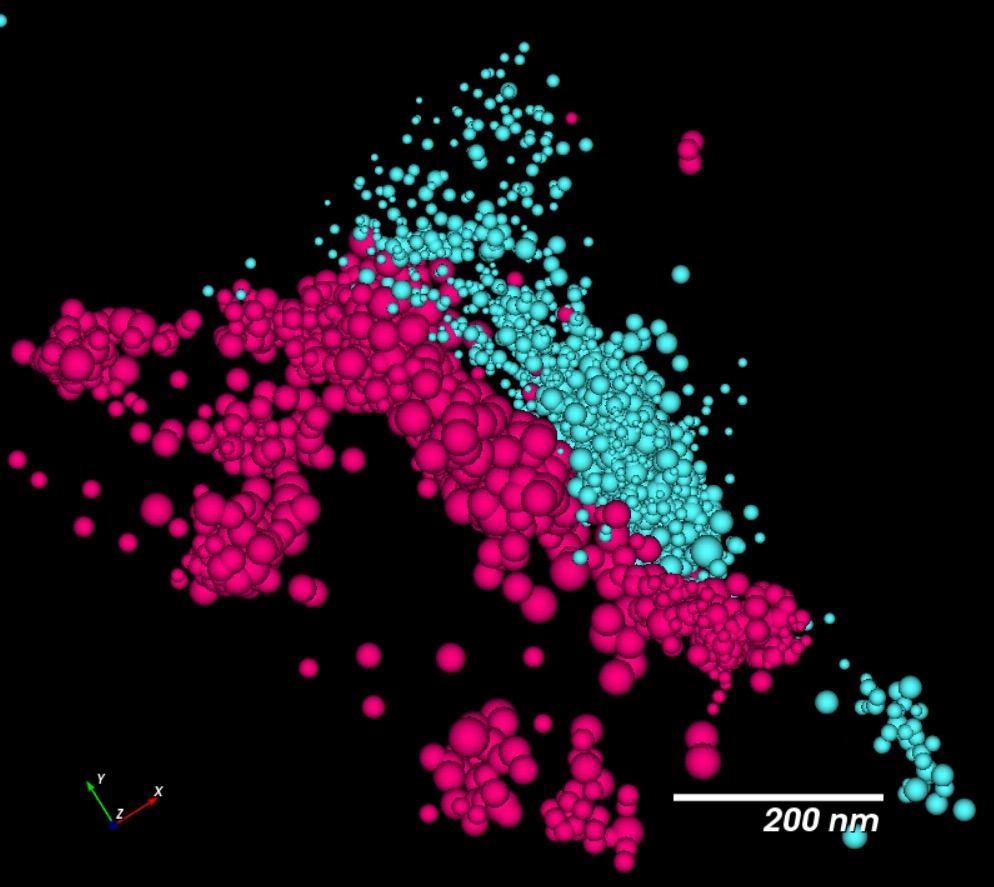
Super Resolution Platform : Target Deconvolution and Validation
Results
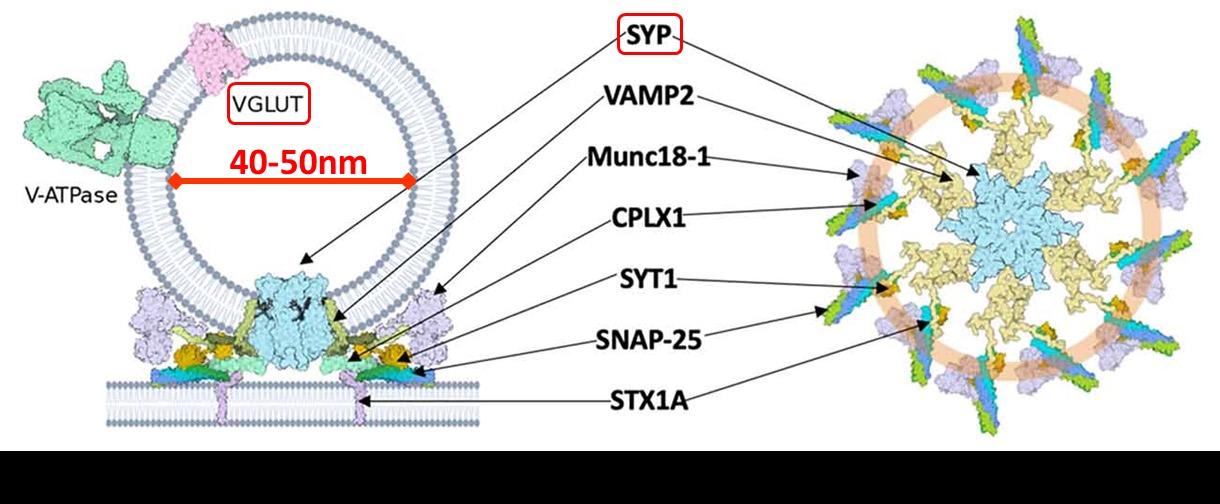
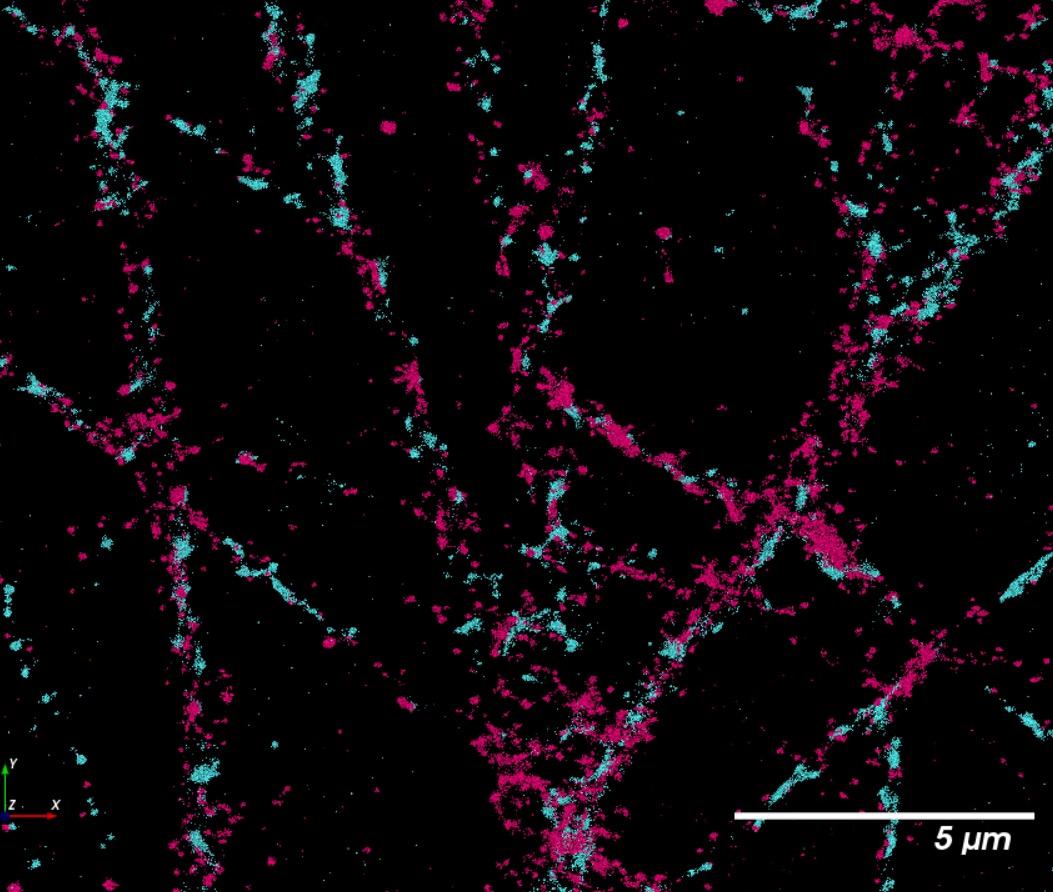
Compared to conventional confocal microscopy, STORM imaging allow separation between pre- and post- synaptic proteins, synaptophysin and Homer, respectively
Conclusions
using
and
Results
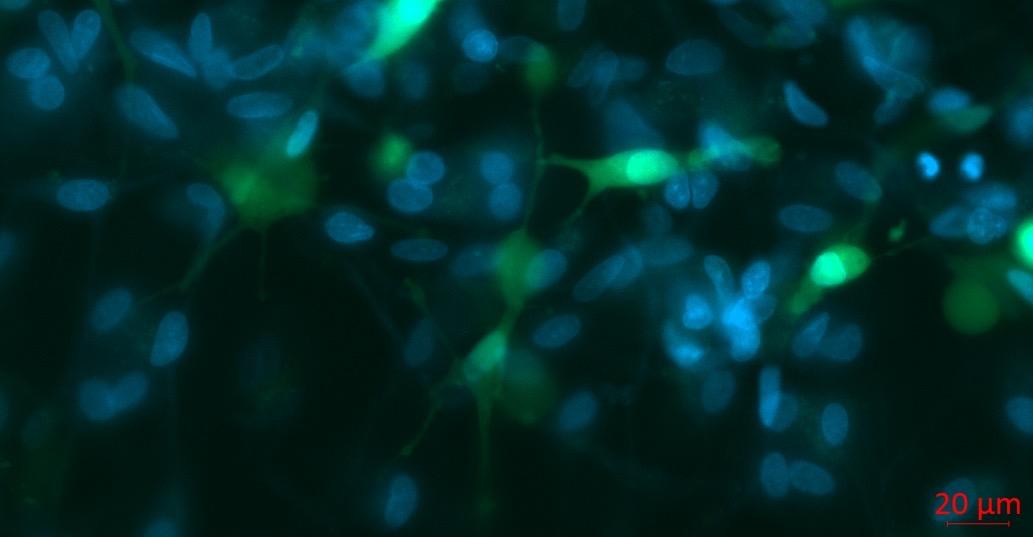
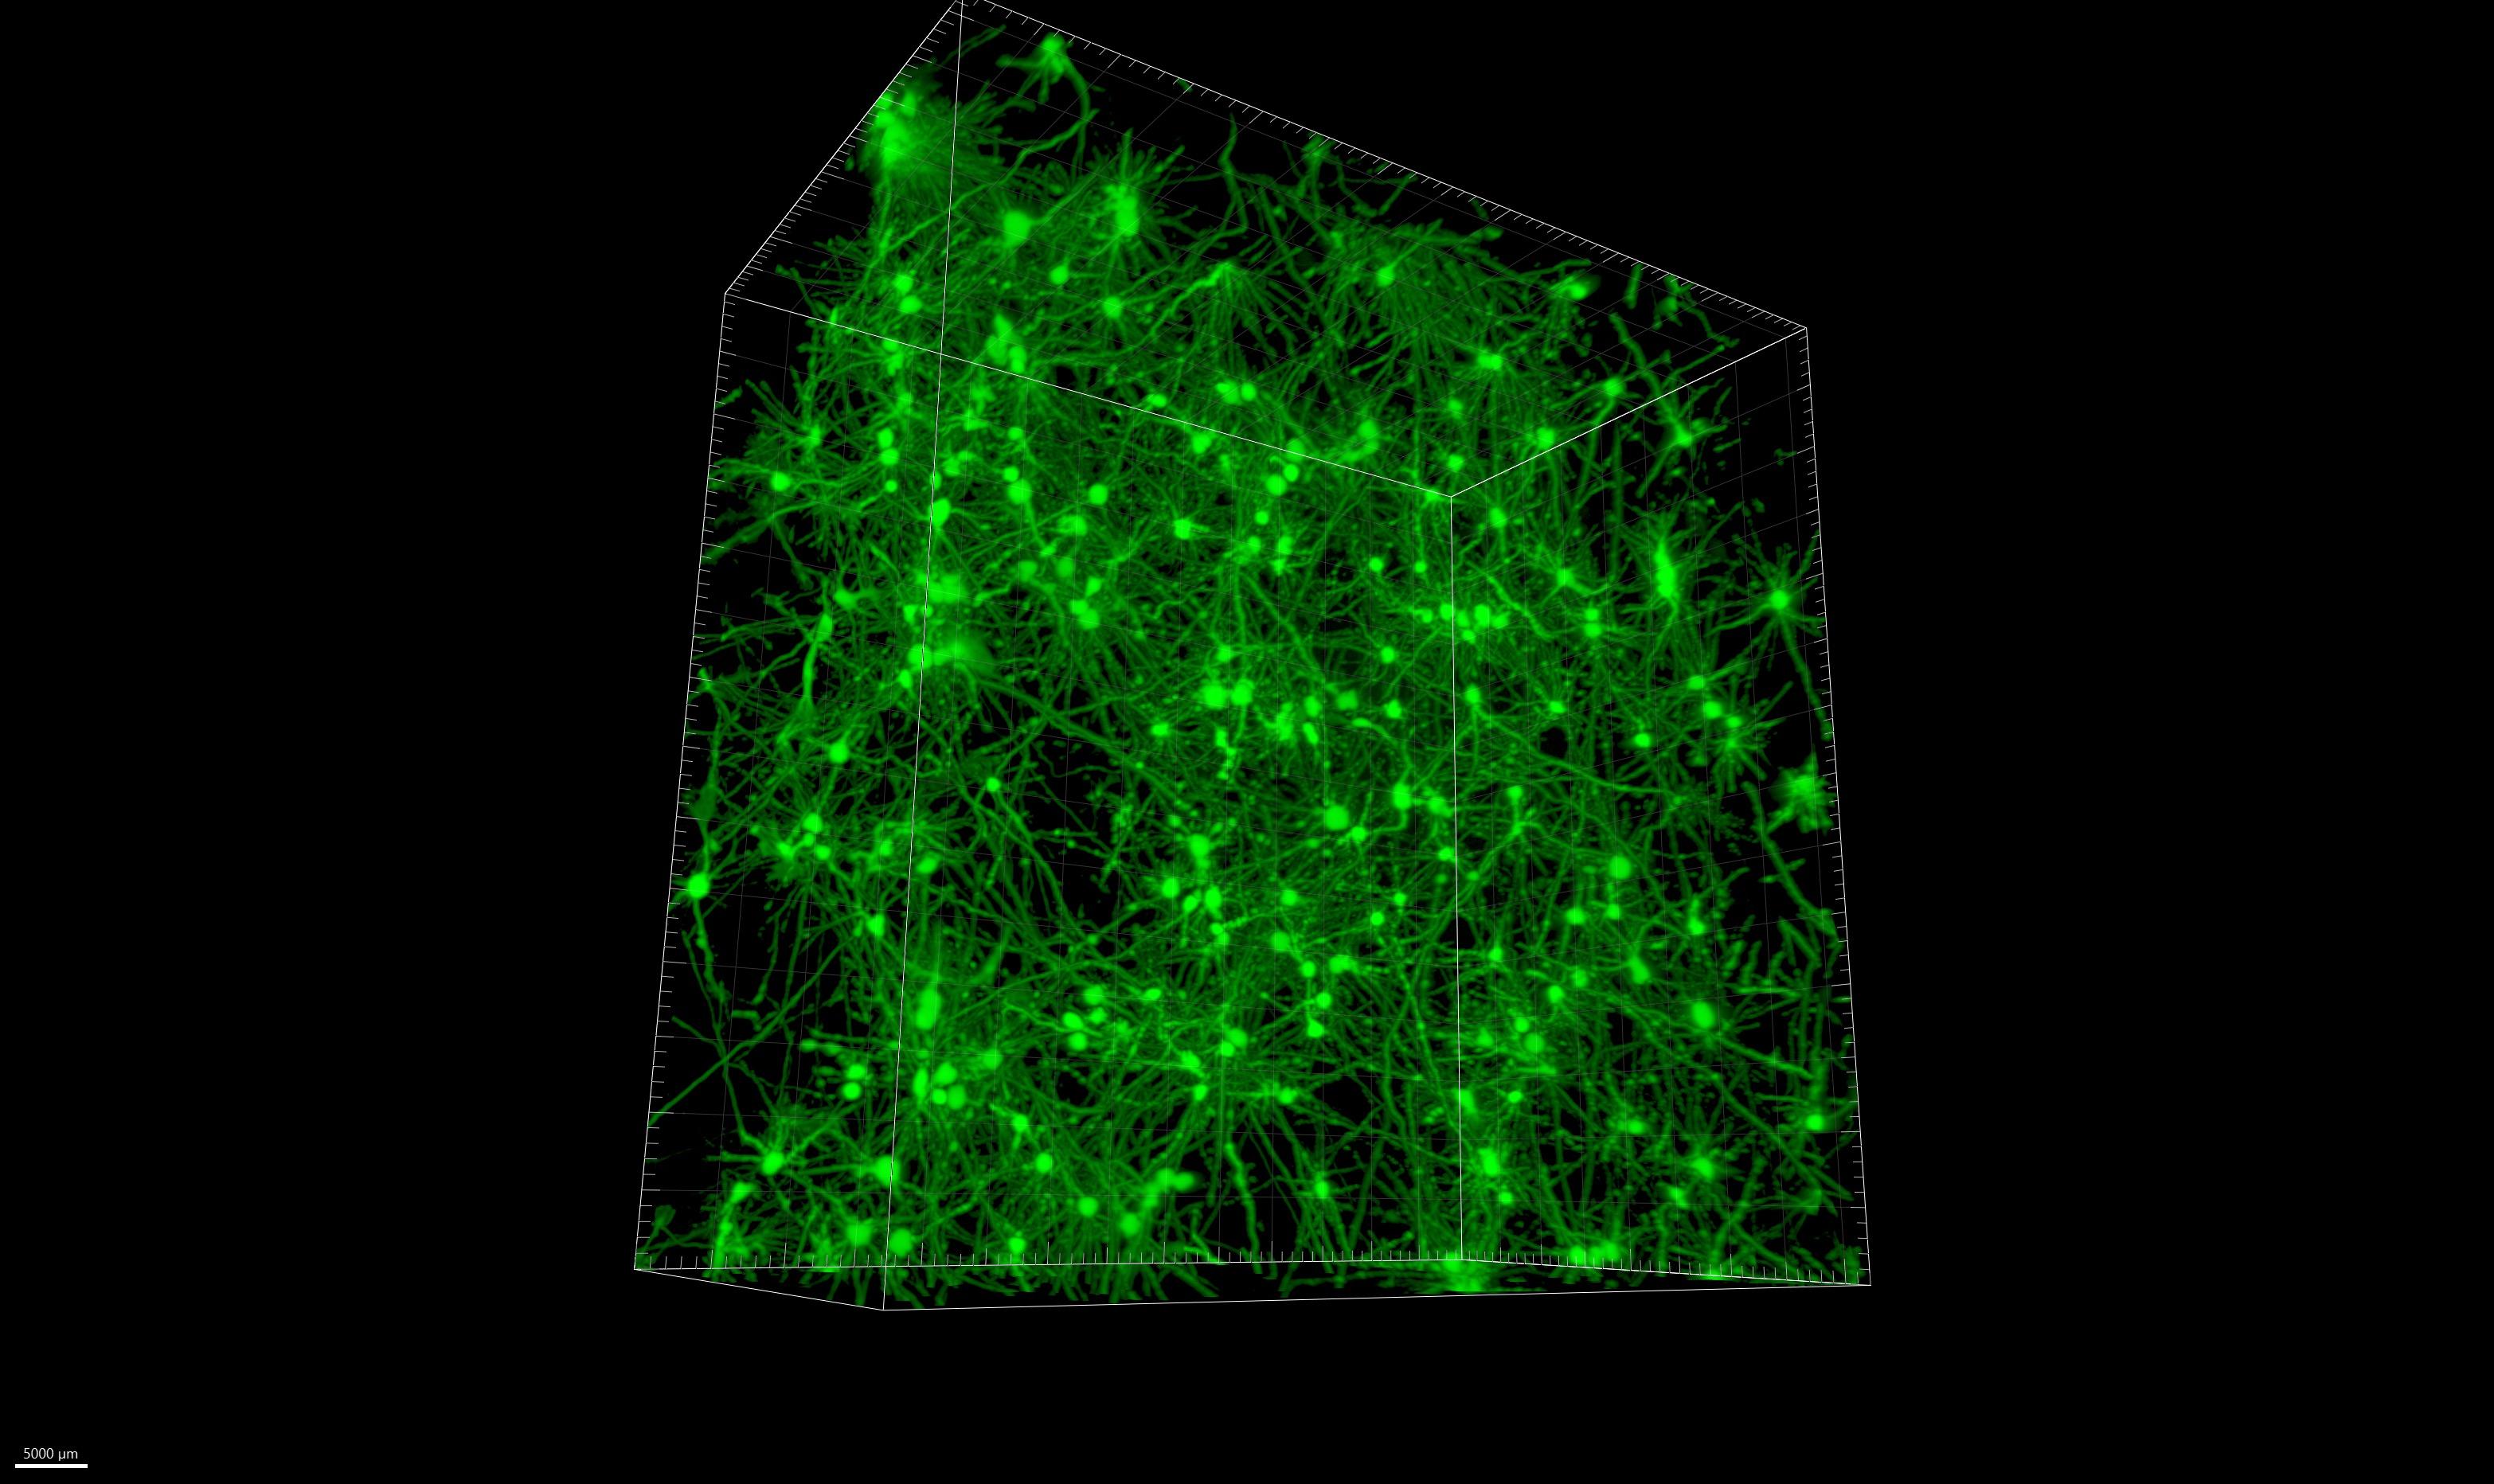
Generation of a Neuronal 3D Culture
Utilizing hydrogels, we have demonstrated that neurons can survive and grow in 3D. Culture of multiple cell types, and analysis of cell phenotype within the hydrogel is ongoing.

 Matthieu Trigano1, Eve Corrie1, Rebecca Kelly1, Lauren Toms1, Nina Vyas1, Lorna FitzPatrick1, Mairi Challinor1, Emma V Jones1 Medicine Discovery Catapult, Block 35, Alderley Park, Cheshire, SK10 4ZF, UK
Results
microglia
cytokines in response
β-amyloid. Untreated LPS β-amyloid 0 500 1000 1500 L10 p g m ✱✱ ✱✱ Untreated LPS β-amyloid 0 10 20 30 40 IL1β p g m l ✱ ✱✱ Untreated LPS β-amyloid 0 500 1000 1500 2000 CCL5 p g m ✱✱ ✱✱ Untreated LPS β-amyloid 0 500 1000 1500 2000 TNFα p g m ✱✱ ✱✱ Untreated LPS β-amyloid 0 1000 2000 3000 4000 IL6 p g / m ✱ ✱ Untreated LPS β-amyloid 0 2000 4000 6000 8000 p g m l Untreated LPS β-amyloid 0 10000 20000 30000 40000 50000 CCL2 p g m ✱✱ ✱✱ Untreated LPS β-amyloid 0 5000 10000 15000 20000 25000 CCL3 p g m ✱✱ ✱✱✱ ControlLPS(100ng/ml) β-amyloid(05µM) 0 2000 4000 6000 8000 10000 Surface area S u a c e A e a μ m 2 ✱✱ ✱✱
• iPSC-derived
in monoculture demonstrate morphological changes and release pro-inflammatory
to the neuroinflammatory stimuli lipopolysaccharides (LPS) and
triculture
and astrocytes
derived microglia in
with neurons
and astrocytes also demonstrate morphological changes in response
LPS
β-amyloid. ControlLPS(100ng/ml) β-amyloid(05µM) 0 5000 10000 15000 20000 Cell volum e V o u m e μ m ✱✱✱ ✱✱
Results • iPSC-derived microglia in coculture with iPSC-derived neurons
to
and
Triculture
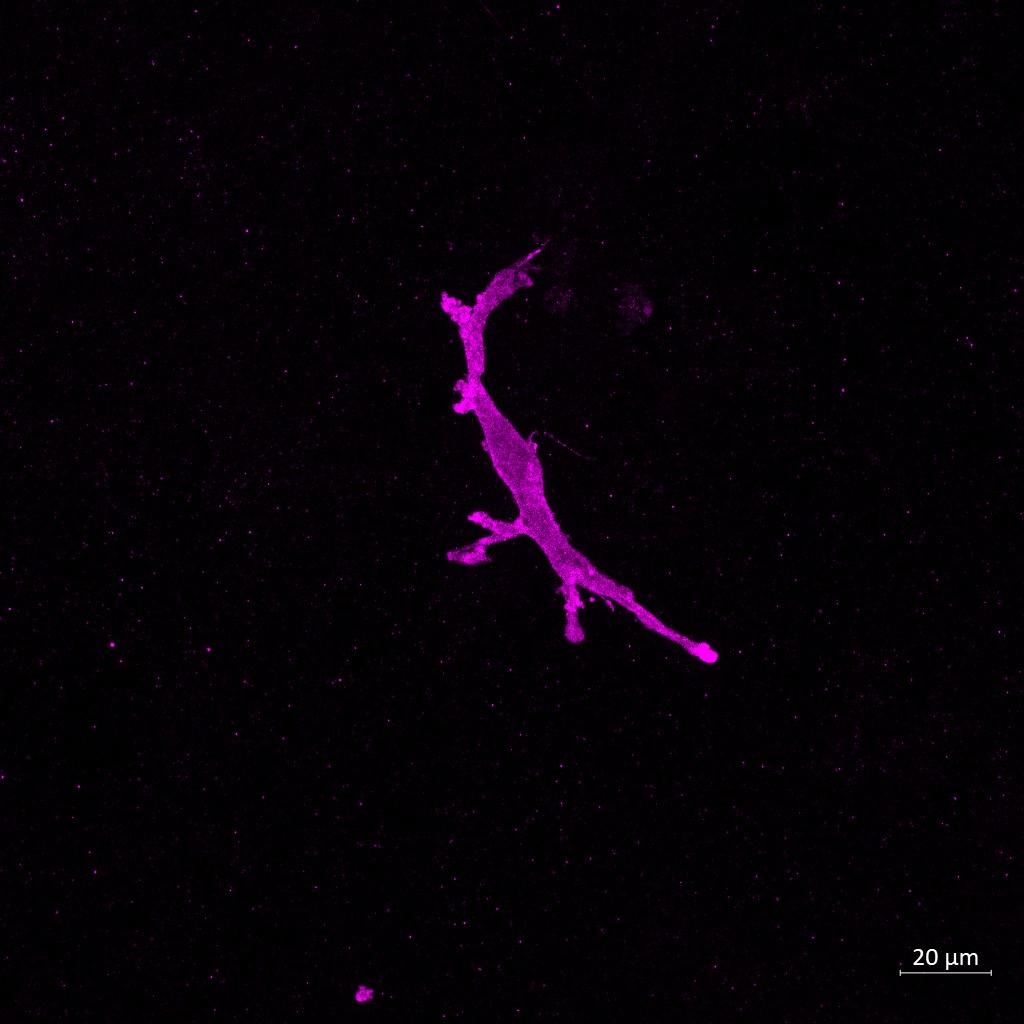
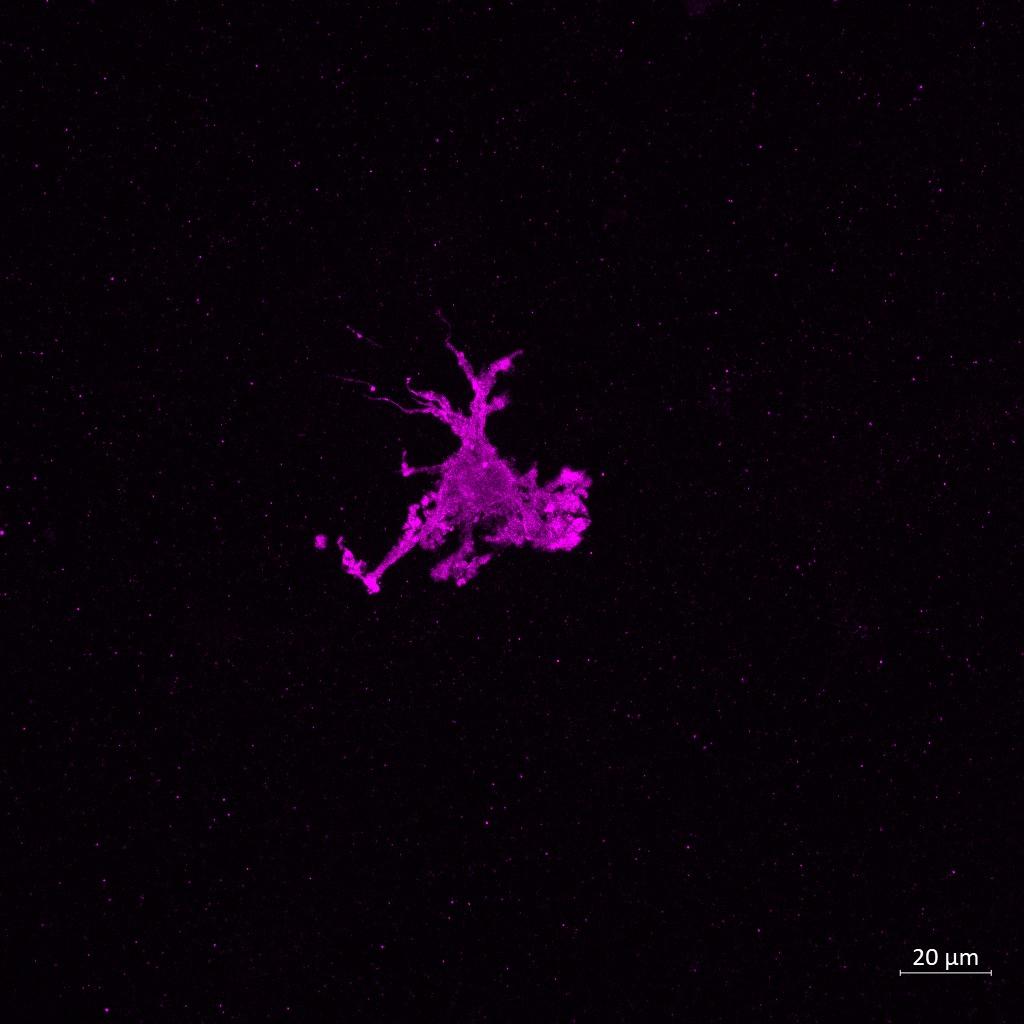
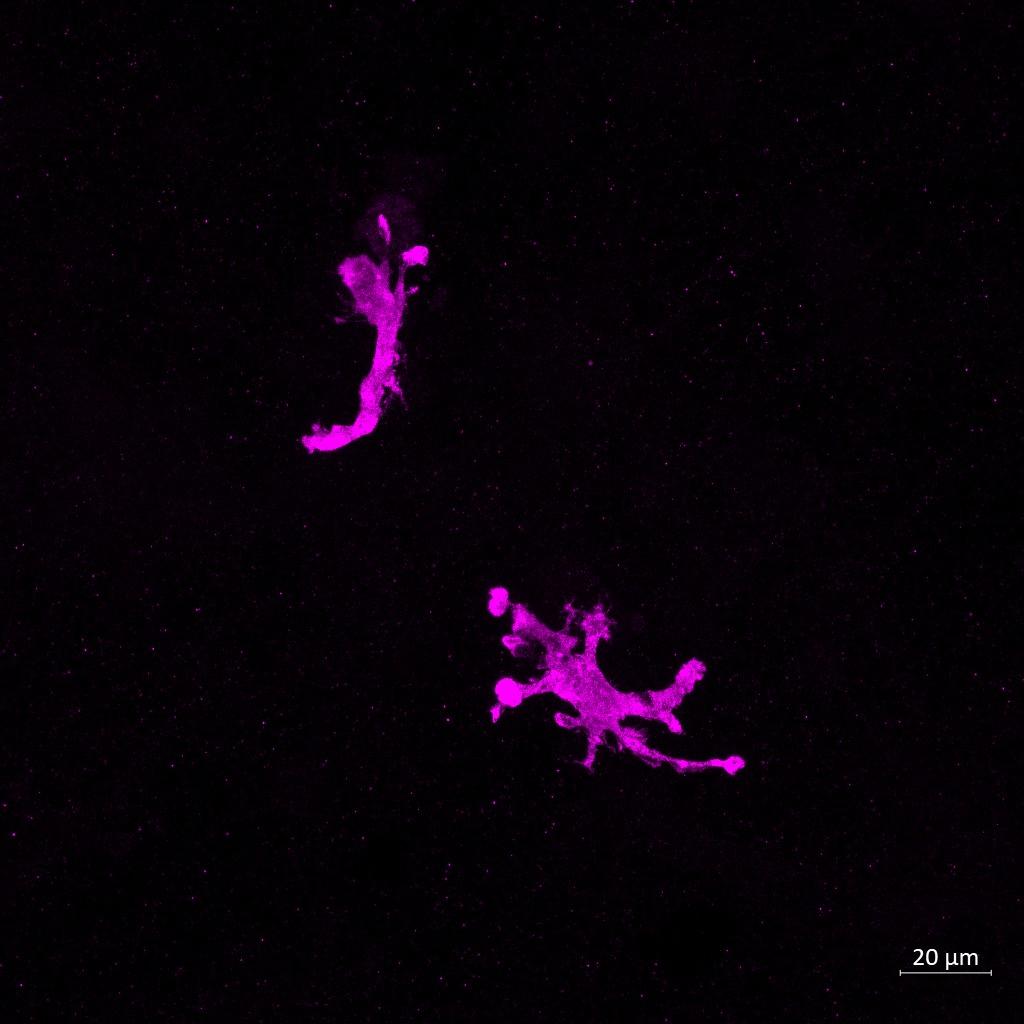
Iba1 (Microglia) Triculture –Untreated Triculture –LPS Triculture –β-amyloid Iba1 Iba1 Iba1 Imaging using a Zeiss LSM880 confocal microscope and analysis using Imaris 3D rendering software. All statistics for this section * P ≤ 0.05, ** P ≤ 0.01, *** P ≤ 0.001. One-way ANOVA followed by Dunnett’s multiple comparisons test
5’ LTR 3’ LTR ASC- GFP EF1α Inflammasome activation A) Schematic of ASC inflammasome reporter ASC is fused to GFP and transduced into iPSC-derived microglia B) ASC speck count normalized to cell density C) Caspase-1, luminescence reporter assay, Caspase Glo (Promega) A. Untreated LPS LPS+Nigericin LPS+Nigericin+mcc950 0 100 200 300 400 500 A S C s p e c k c o u n t UT LPS LPS+Nigericin LPS+Nigericin+mcc950 0 500 1000 1500 C a s p a s e 1 a c t i v i y ( R L U ) ✱✱ ✱✱ ✱✱ B. C. ASC-GFP ASC-GFP
Introduction
morphology using our high content and super-resolution microscopy platform Together with human 3D CNS cell modelling techniques, our goal is to generate models and analytical tools that will facilitate effective drug discovery with the aim of better translation to the clinic Images were acquired at 63x using a ELYRA7 STORM microscope Synaptophysin is in red, and Homer is in blue
At MDC, we are
different microscopy approaches to answer different questions such as microglia morphology or inflammasome activation Our super-resolution microscopes allow us to identify changes at the level of single synaptic receptors or ion channels Additionally, we can investigate mitochondria health
B. A. UntreatedLPS(100ng/ml) β-amyloid(05µM) 30 35 40 45 50 C e l le n g t h µ m ns ✱ UntreatedLPS(100ng/ml) β-amyloid(05µM) 0 34 0 36 0 38 0 40 0 42 0 44 W idth to le ngth ra tio R a o ns ✱
3D representation of neurons in hydrogel ( Opera Phenix high content screening system, cells were incubated prior imaging using of our stack of images.
Monoculture
Iba1 Iba1 Iba1
(A)
High Content Imaging (B) Cytokine analysis
(C) Confocal Imaging and morphological assessment
