Local Market Update – November 2021 A Research Tool Provided by the Multiple Listing Service of Hilton Head Island and the Hilton Head Area Association of REALTORS®
Local Market Update – November 2021 Real Estate Market Report Hampton Lake Hampton Lake |– November 2021 Local Market Update November 2021 Hampton Lake A Research Tool Provided by the Multiple Listing Service of Hilton Head Island and the Hilton Head Area Association of REALTORS®
A Research Tool Provided by the Multiple Listing Service of Hilton
Hampton Lake
A Research Tool Provided by the Multiple Listing Service of Islandandand Hilton Area Association of REALTORS® Hilton Head Head Island thethe Hilton HeadHead Area Association of REALTORS®
Local 2021 November Local Market Market Update Update––November November 2021 A Research Tool Provided by the Multiple Listing Service of A Research Tool Provided by the Multiple Listing Service of Hilton Head Island and the Hilton Head Area Association of REALTORS®2021 Hilton Head Island and the Hilton Head Area 2020 Association of REALTORS®
Key Metrics
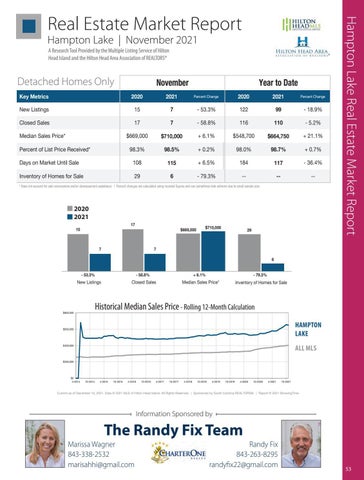
Detached Homes Only New Listings Hampton Lake15
17 2020
Key Metrics
Median Sales Price* New Listings
Closed Sales98.3%
Closed Sales
Key Metrics
2021
7
122
99
7
2021 - 58.8%Percent Change116
2020110
17
November
2020
$710,000 7
$669,00015
New Listings
Percent of List Price Received*
2020
Percent Change
November - 53.3%
Hampton Hampton Lake Lake
Closed Sales Key Metrics
Year to Date
98.5% 2020
2021
Percent Change
Year to Date - 18.9% - 5.2% 2021
Percent Change
Year to Date Percent Change
2020
2021
+ 6.1% - 53.3% $548,700 15 7
+ 21.1% $664,750 122 - 53.3% 99 122- 18.9%
99
-1758.8%98.0% 7
+ 0.7% 116 - 58.8% 110 11698.7% - 5.2% Year to Date
110
November + 0.2%
7 November November 2021
Year to Date
Year 2020 to Date
Percent Change
2021
Percent Change
Percent Cha
- 18.9%
- 5.2%
108 + 6.5% 184 - Change 36.4% 115 117 + 6.1% $669,000 $710,000 $664,750 Percent Percent Percent Change Percent Change$548,700 2021 2020 2021 KeyMetrics Metrics Median Sales Price* 2020 $710,000 2021 2020$548,700 2021 Median Sales Price*Key $669,0002020 +Change 6.1% +- 21.1% $664,750 New Listings 15 - 53.3% 122 18.9% 7 99
Days on Market Until Sale
Inventory of Homes forNew Sale Listings 1515 6 New Listings Percent of List 29 Price Received* Closed SalesReceived* Percent of List Price
- 53.3% 7 7 - 79.3% - 53.3% 98.3%
98.5% 7
98.3% 17
-- 98.0% --99+ 0.2%- 18.9% 99 - 18.9%
-- 122 122 98.5%
- 58.8% + 0.2%
110 98.7%
116 98.0%
* Does not account for sale concessions and/or downpayment assistance. | Percent changes are calculated using rounded figures and can sometimes look extreme due to small sample size.
77
Closed ClosedSales Sales Days on Market Until Sale 1717
$710,000
Median Sales Price*
$669,000 Days on Market Until SaleSales 108 $669,000 Median SalesPrice* Price* $669,000 Median Inventory of Homes for Sale Percent of List Price Received* 98.3% Percent of List Price Received* 98.3%
November
$710,000 115 $710,000
98.5%
29
17 Days on Market Until Sale Dayson onMarket Market UntilSale Sale Days Until
+ 6.1%
116 116 115
6
108 108 108
- 79.3%
115 115 115
+ 6.5% 184 +6.5% 6.5% 184 +$710,000
66 6
- 79.3% - 79.3% -- -- 79.3%
--
--
- 117 36.4% - 36.4%
- 36.4%
November Inventory Homes forSale Sale Inventory ofInventory Homesofof for Sale Homes for
29 2929
-- -- --
-----
--
Doesnot notaccount accountforforsale saleconcessions concessionsand/or and/ordownpayment downpaymentassistance. assistance.| Percent | Percent changes calculated using rounded figures and sometimes look extreme due to small sample changes areare calculated using rounded figures and cancan sometimes extreme due to small sample size.size. * Does not account for**Does sale concessions and/or downpayment assistance. | Percent changes are calculated using rounded figures and canlook sometimes look extreme due to small sample size. 17
November
15
2020 November November November 2021 7
15
17 17
- 53.3%
17 17
$669,000 $669,000
7
$669,000
7 7 Closed
7
7
Sales
7
7
- 53.3%
7
Rolling 12-Month -Calculation 58.8% Closed Sales Sales -Closed 58.8%
- 53.3%
- 53.3%
New Listings
Median Sales Price*
Inventory of Homes for Sale
Closed Sales + 6.1% + 6.1%
- 58.8%
Historical -Median 58.8% Sales Price Closed Sales
Rolling 12-Month + 6.1% Calculation Median Sales Price*
All MLS —— Hampton Lake Hampton Lake —
All MLS — Hampton Lake —
HAMPTON All MLS — Hampton Lake — LAKE
$600,000
$800,000
$400,000
$400,000
$200,000
$600,000
$400,000
$600,000 $0
$400,000
$200,000
4-2015
10-2015
$0 4-2014 $0 4-2014
$200,000
ALL MLS
$200,000
$200,000
10-2014
All MLS — Hampton Lake —
Inventory of—Homes for Sale All MLS
$600,000
$800,000
66 Inventory of Homes for Sa
- 79.3%
Rolling 12-Month Calculation
$600,000
2021
Inventory of Homes for Sale
$800,000
Historical Median Sales Price
2021 29
20
- 79.3%
- 79.3% - 79.3% All MLS — Inventory ofHampton HomesLake for Sale — Inventory of Homes for Sale - 79.3%
Median Sales Price* Median Sales+ Price* 6.1%
Historical Median Sales Price - Rolling 12-Month Calculation Historical Median Sales Price Rolling 12-Month Calculation $800,000
2020
--
6
Median Sales Price*
$800,000
$400,000
--
+ 6.1%6 6
- 58.8%
Historical Median Sales PriceSales Rolling 12-Month Calculation Median Sales Price* New Listings Closed Historical Median Sales Price Rolling 12-Month Calculation
4-2014
- 36.4%
29
- 79.3%
New Listings
New Listings - 53.3%New Listings
$400,000
117
29
2929
$710,000
+ 6.1% 7
Historical Median Sales- 53.3% Price
2020
6
$710,000
$710,000 $710,000 7
$669,000
- 58.8%
New Listings
2020
2020 2021 2021 2020
15 15
15
$710,000
$669,000
7
+ 21.1%
+ 0.7%
--
184 117 117
* Does not account rounded figures and can sometimes look extreme due to small sample 15 for sale concessions and/or downpayment assistance. | Percent changes are calculated using$669,000 29 size.
$600,000
98.7%
98.5% Percent of List Price Received* + 0.2% 98.0% + extreme 0.7% due to small sample size. 98.5% 98.7% * Does not account for sale concessions and/or98.3% downpayment assistance. | Percent changes are calculated using rounded figures and can sometimes look
Inventory of Homes for Sale
$800,000
5.2% +- 0.7%
- 5.2% 110 110 + 6.5%- 5.2% 184 $548,700 + 21.1% $664,750 +6.1% 6.5% $548,700 - 36.4% $548,700 184 + 21.1% $664,750 + 21.1% 117 + +6.1% $664,750 29 - 79.3% -6 2020 2021 + 0.2% 98.0% 98.0% + 0.7% 98.7% + 0.2% + 0.7% 98.7%
- 58.8% - 58.8% 108
Hampton Lake Real Estate Market Report
A Research Tool Provided by the Multiple Listing Service of Hilton Head Island and the Hilton Head Area Association of REALTORS®
4-2016
10-2016
$0 4-2015 4-2014
10-2014
10-2014
4-2015
10-2015
4-2017
10-2014
10-2015
4-2016
10-2017 10-2016
4-2015
4-2016
4-2018
4-2017
10-2015
10-2016
4-2017
10-2018
10-2017
4-2018
4-2016
10-2017
4-2019 10-2018
10-2016
4-2018
10-2019
10-2018
4-2019
4-2017
4-2019
4-2020
10-2019
10-2017 10-2019
10-2020
4-2020
4-2018
4-2020
4-2021
10-2020
4-2021
10-2018
10-2020
4-2021
10-2021 10-2021
4-2019
10-2019
4-2020
10-2020
4-2021
10-2
10-2021
Current as of December 10, 2021. Data © 2021 MLS of Hilton Head Island. All Rights Reserved. | Sponsored by South Carolina REALTORS®. | Report © 2021 ShowingTime. Current as of December 10, 2021. Data © 2021 MLS of Hilton Head Island. All Rights Reserved. | Sponsored by South Carolina REALTORS®. | Report © 2021 ShowingTime.
$200,000
$0 4-2014
Current as of December 10, 2021. Data © 2021 MLS of Hilton Head Island. All Rights Reserved. | Sponsored by South Carolina REALTORS®. | Report © 2021 Showin
Current as of December 10, 2021. Data © 2021 MLS of Hilton Head Island. All Rights Reserved. | Sponsored by South Carolina REALTORS®. | Report © 2021 ShowingTime.
10-2014
4-2015
10-2015
4-2016
10-2016
4-2017
10-2017
4-2018
10-2018
Information Sponsored by
4-2019
10-2019
The Randy Fix Team
4-2020
10-2020
4-2021
10-2021
Current as of December 10, 2021. Data © 2021 MLS of Hilton Head Island. All Rights Reserved. | Sponsored by South Carolina REALTORS®. | Report © 2021 ShowingTime.
$0 4-2014
10-2014
4-2015
10-2015
4-2016
10-2016
4-2017
10-2017
4-2018
10-2018
4-2019
10-2019
4-2020
10-2020
4-2021
10-2021
Marissa Wagner Randy Fix 843-338-2532 843-263-8295 Current as of December 10, 2021. Data © 2021 MLS of Hilton Head Island. All Rights Reserved. randyfix22@gmail.com | Sponsored by South Carolina REALTORS®. | Report © 2021 ShowingTime. marisahhi@gmail.com
53