Local Market Update – November 2021
Local Market Update – November 2021 A Research Tool Provided by the Multiple Listing Service of Hilton Head Island and the Hilton Head Area Association of REALTORS®
Local Market Update – November 2021 Real Estate Market Report Hampton Hall HamptonUpdate Hall | –November 2021 Local MarketHall November 2021 Hampton A Research Tool Provided by the Multiple Listing Service of Hilton Head Island and the Hilton Head Area Association of REALTORS®
A Research Tool Provided by the Multiple Listing Service of Hilton
Hampton Hall
A Research Tool Provided by the Multiple Listing Service of Islandandand Hilton Area Association of REALTORS® Hilton Head Head Island thethe Hilton HeadHead Area Association of REALTORS®
Local 2021 November Local Market Market Update Update––November November 2021 A Research Tool Provided by the Multiple Listing Service of A Research Tool Provided by the Multiple Listing Service of Hilton Head Island and the Hilton Head Area Association of REALTORS®2021 Hilton Head Island and the Hilton Head Area 2020 Association of REALTORS®
Key Metrics
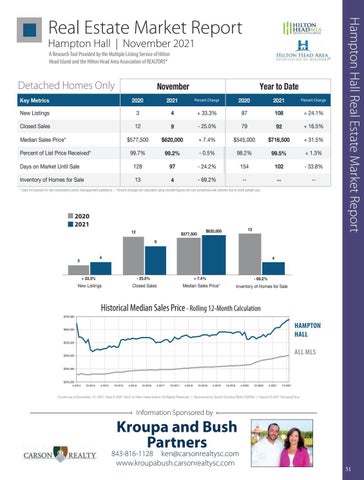
Detached Homes Only New Listings Hampton Hall3
9
New Listings
Closed Sales99.7%
Closed Sales
Key Metrics
87
108
2021 - 25.0%Percent Change 79
2020 92
12
November
2020
$620,000 4
$577,500 3
Percent of List Price Received*
2021
November + 33.3%
12 2020
Key Metrics
Median Sales Price* New Listings
2020
Percent Change
4
Hampton Hampton Hall Hall
Closed Sales Key Metrics
Year to Date
99.2% 2020
2021
+ 7.4% + 33.3% $545,000
November - 0.5%
9 November November 2021
3
Percent Change
Year to Date + 24.1% + 16.5% 2021
Percent Change
$716,500 87
4
+ 33.3%
Year to Date Percent Change
2020
+ 31.5% 108
2021
87 + 24.1%
108
79 + 16.5%
92
Year +to1.3% Date
99.5% - 25.0% 92 -1225.0%98.2% 9 Year 79 totoDate Year Date 2021 Percent Change 2020
Percent Change
Percent Cha
+ 24.1
+ 16.5
128 - 24.2% 154 - Change 33.8% 97 102 + 7.4% $577,500 $620,000 $716,500 Percent Percent Percent Change Percent Change$545,000 2021 2020 2021 KeyMetrics Metrics Median Sales Price* 2020 $620,000 2021 2020$545,000 2021 Median Sales Price*Key $577,5002020 +Change 7.4% ++ 31.5% $716,500 New Listings 3 + 33.3% 87 24.1% 4 108
Days on Market Until Sale
Inventory of Homes forNew Sale Listings 33 4 New Listings Percent of List 13 Price Received*
+99.7% 4 4 - 69.2% +33.3% 33.3%
-- 98.2% --108- 0.5%+ 24.1% 108 + 24.1%
-- 87 87 99.2%
Closed SalesReceived* - 25.0% 79 Percent of List Price 99.7% 12 - 0.5% 98.2% 99.2% 9 * Does not account for sale concessions and/or downpayment assistance. | Percent changes are calculated using rounded figures and can sometimes look extreme due to small sample size. 99
92 99.5%
$620,000
$577,500 Inventory of Homes for Sale Percent of List Price Received* 99.7% Percent of List Price Received* 99.7%
128 $577,500 $577,500
Inventory of Homes for Sale
13
November
Days on Market Until Sale Dayson onMarket Market UntilSale Sale Days Until
12 * Does not account for sale concessions and/or downpayment assistance.
97 $620,000 $620,000 4
128 128 128
- 25.0% - 25.0% 128
7979 97
+ 7.4%
- 69.2%
979797
- 24.2% 154 - 24.2% 154 -$620,000 24.2%
44 4
- 69.2% - 69.2% -- -- 69.2%
--
--
13 1313
9
November
12
2020 2021
November 4November November
- 102 33.8% - 33.8%
- 33.8%
-- -- --
-----
--
12
New Listings
4
3
3 3
4 4
$577,500
4
3- 25.0%
+ 33.3%
$577,500 $577,500
12 12
9
9
9
Closed Sales
4
+ 33.3%
New Listings
Closed Sales
2020
2021
+ 1.3%
- 33.8%
2020
13
--
20
4
44
Median Sales Price*
- 69.2%
Inventory of Homes for S
- 69.2% - 69.2% All MLS — Inventory of Hampton Homes for HallSale —
Median Sales Price* Median Sales+ Price* 7.4%
Inventory of Homes for Sale - 69.2%
Rolling 12-Month + 7.4% Calculation Median Sales Price*
- 69.2%
All MLS — Hampton Hall —
Inventory of Homes for Sale
Inventory of—Homes for Sale All MLS
Historical Median Sales Price - Rolling 12-Month Calculation
All MLSHall —— Hampton Hampton Hall —
$700,000
Historical Median Sales Price $700,000
Historical Median Sales Price $700,000
$500,000
$700,000
Rolling 12-Month Calculation
All MLS — Hampton Hall —
$500,000
HAMPTON All MLS — HALLHall — Hampton
$400,000
ALL MLS
$600,000
Rolling 12-Month Calculation
$600,000
$600,000
$400,000
$500,000
$500,000
$600,000
$400,000
$300,000
$600,000
4
Historical Median Sales PriceSales Rolling 12-Month Calculation Median Sales Price* New Listings Closed Historical Median Sales Price Rolling 12-Month Calculation
$600,000
$700,000
2021
+ 7.4%
+ 7.4% + 7.4%
Historical -Median 25.0% Sales Price
2020
+ 31.5
4
Inventory of Homes for Sale
- 25.0%
--
13
Median Sales Price* Closed Sales
Closed Sales Sales -Closed 25.0%
$620,000
- 69.2%
New Listings
New Listings + 33.3%New Listings
13
1313
+ 7.4%
- 25.0%
Rolling 12-Month -Calculation 25.0%
+ 33.3%
$620,000
$620,000 $620,000
+ 33.3%
Historical Median Sales+ 33.3% Price $700,000
202042021 2021 2020
$577,500
9
$620,000
$577,500 9
12
102
--
154 13102102
Doesnot notaccount accountforforsale saleconcessions concessionsand/or and/ordownpayment downpaymentassistance. assistance.| Percent | Percent changes calculated using rounded figures and sometimes look extreme due to small sample changes areare calculated using rounded figures and cancan sometimes extreme due to small sample size.size. * Does not account for**Does sale concessions and/or downpayment assistance. | Percent changes are calculated using rounded figures and canlook sometimes look extreme due to small sample size.
3
99.5%
24.2% $545,000 7.4% $545,000 154 $716,500 + +-7.4% $716,500
| Percent changes are calculated using$577,500 rounded figures and can sometimes look extreme due to small sample size.
November Inventory Homes forSale Sale Inventory ofInventory Homesofof for Sale Homes for
3
++ 16.5% 1.3%
+ 16.5% + 16.5% 9292 - 24.2% 154 $545,000 + 31.5% $716,500 - 33.8% + 31.5% 102 + 31.5% 13 - 69.2% -4 2020 2021 - 0.5% 98.2% 98.2% + 1.3% 99.2% 99.5% - 0.5% + 1.3% 99.2% 99.5% Percent of List Price Received* - 0.5% 98.2% + extreme 1.3% 99.2% 99.5% * Does not account for sale concessions and/or99.7% downpayment assistance. | Percent changes are calculated using rounded figures and can sometimes look due to small sample size. Closed ClosedSales Sales Days on Market Until Sale 1212
Median Sales Price*
Days on Market Until SaleSales Median SalesPrice* Price* Median
Hampton Hall Real Estate Market Report
A Research Tool Provided by the Multiple Listing Service of Hilton Head Island and the Hilton Head Area Association of REALTORS®
$400,000
$500,000
$200,000 4-2014
$300,000
$300,000
$300,000 4-2015
10-2014
$400,000
$200,000 4-2014 $200,000 4-2014
$500,000 $300,000
10-2015
4-2016
10-2016
$200,000 4-2015 4-2014
10-2014
10-2014
4-2015
10-2015
4-2017
10-2014
10-2015
4-2016
10-2017 10-2016
4-2015
4-2016
4-2018
4-2017
10-2015
10-2016
4-2017
10-2017
4-2016
10-2017
10-2018 4-2018
4-2019
10-2016
4-2018
10-2019
10-2018
10-2018
4-2019
4-2017
4-2019
4-2020
10-2019
10-2017 10-2019
10-2020
4-2020
4-2018
4-2020
4-2021
10-2020
4-2021
10-2018
10-2020
4-2021
10-2021 10-2021
4-2019
10-2019
4-2020
10-2020
4-2021
10-2
10-2021
Current as of December 10, 2021. Data © 2021 MLS of Hilton Head Island. All Rights Reserved. | Sponsored by South Carolina REALTORS®. | Report © 2021 ShowingTime.
$400,000
Current as of December 10, 2021. Data © 2021 MLS of Hilton Head Island. All Rights Reserved. | Sponsored by South Carolina REALTORS®. | Report © 2021 ShowingTime.
$200,000 4-2014
Current as of December 10, 2021. Data © 2021 MLS of Hilton Head Island. All Rights Reserved. | Sponsored by South Carolina REALTORS®. | Report © 2021 Showi
Current as of December 10, 2021. Data © 2021 MLS of Hilton Head Island. All Rights Reserved. | Sponsored by South Carolina REALTORS®. | Report © 2021 ShowingTime.
10-2014
4-2015
10-2015
$300,000
4-2016
4-2017 10-2017 4-2018 10-2018 Information Sponsored by
10-2016
4-2019
10-2019
Kroupa and Bush Partners
4-2020
10-2020
4-2021
10-2021
Current as of December 10, 2021. Data © 2021 MLS of Hilton Head Island. All Rights Reserved. | Sponsored by South Carolina REALTORS®. | Report © 2021 ShowingTime.
$200,000 4-2014
10-2014
4-2015
10-2015
4-2016
10-2016
4-2017
10-2017
4-2018
10-2018
4-2019
10-2019
4-2020
10-2020
4-2021
10-2021
843-816-1128 ken@carsonrealtysc.com www.kroupabush.carsonrealtysc.com Current as of December 10, 2021. Data © 2021 MLS of Hilton Head Island. All Rights Reserved. | Sponsored by South Carolina REALTORS®. | Report © 2021 ShowingTime.
51